Inclusion and treatment of the rural sector in energy … and treatment of the rural sector in...
44
Stanford Paper3 Inclusion and treatment of the rural sector in energy models 1 Sohini Sahu, Research Associate, TERI, New Delhi Abstract Energy planning has now become an inalienable part of aggregate macro level planning. Rural energy planning per se` becomes an important issue in a developing country like India. This paper investigates the extent to which the rural sector has been included in the various energy models used in India, especially the ones used by TERI. Alongside the modelling exercises carried out, the paper also touches upon the survey-based rural planning methodology adopted by the agency(ies) which are responsible for energy planning at the micro level of the economy. Apart from giving a briefly describing the energy models in terms of the nature of data required, the assumptions and the results as far as the rural sector is concerned, the paper also attempts to evaluate the effectiveness of the same, thereby identifying the aspects of improvement in rural energy planning. Introduction Even after fifty years of independence, it is true that ‘India lives in its villages’. A whopping 70% of the country’s population lives in rural areas, spread over 580,000 villages. This rural populace is primarily engaged in agriculture whose contribution to the gross domestic product was 27% in 1999/2000 at 1993/94 prices. Given the overwhelming size of rural India, it has been stressed time and again that a holistic view of development cannot turn a blind eye to this sector. It has been well realized that development related activities cannot remain confined to the industrial and the urban centres only, the rural centres provide the missing link to the path of overall developmental goals. These rural areas are typically characterized by low standards of living, an outcome of low employment opportunities coinciding with poor incomes, since agricultural activities are gradually sliding and employment has reached a 24 October 2002
Transcript of Inclusion and treatment of the rural sector in energy … and treatment of the rural sector in...
Stanford Paper3
IInncclluussiioonn aanndd ttrreeaattmmeenntt ooff
tthhee rruurraall sseeccttoorr iinn eenneerrggyy
mmooddeellss
1
Sohini Sahu, Research Associate, TERI, New Delhi
Abstract
Energy planning has now become an inalienable part of aggregate macro level
planning. Rural energy planning per se` becomes an important issue in a
developing country like India. This paper investigates the extent to which the
rural sector has been included in the various energy models used in India,
especially the ones used by TERI. Alongside the modelling exercises carried out,
the paper also touches upon the survey-based rural planning methodology
adopted by the agency(ies) which are responsible for energy planning at the
micro level of the economy. Apart from giving a briefly describing the energy
models in terms of the nature of data required, the assumptions and the results
as far as the rural sector is concerned, the paper also attempts to evaluate the
effectiveness of the same, thereby identifying the aspects of improvement in
rural energy planning.
Introduction
Even after fifty years of independence, it is true that ‘India lives in its villages’. A
whopping 70% of the country’s population lives in rural areas, spread over
580,000 villages. This rural populace is primarily engaged in agriculture whose
contribution to the gross domestic product was 27% in 1999/2000 at 1993/94
prices.
Given the overwhelming size of rural India, it has been stressed time and
again that a holistic view of development cannot turn a blind eye to this sector. It
has been well realized that development related activities cannot remain confined
to the industrial and the urban centres only, the rural centres provide the missing
link to the path of overall developmental goals.
These rural areas are typically characterized by low standards of living, an
outcome of low employment opportunities coinciding with poor incomes, since
agricultural activities are gradually sliding and employment has reached a
24 October 2002
Stanford Paper 3 2
saturation level. This has led to a huge influx of a proportion of the rural
inhabitants to the urban centres, as suggested by the Harris-Todaro model of
migration. The irony is that, even these urban regions cannot absorb these
migrants productively, employment openings being the main constraint. Hence, a
large section of these burgeoning migrants become faceless workers in the
informal sector. With formal sector jobs becoming elusive, these people
ultimately end up in a situation where they are marginally better off or at times
even worse than their preceding village lives.
This drives home the fact that a conducive situation should be created which
can absorb the rural people productively at their own village, thereby contributing
significantly to rural activities and reducing the pressure on the urban centres
simultaneously. In order to achieve this, priority should be given to rural
development encompassing all the related sectors like infrastructure, energy,
communication, health and education.
The role of energy in this entire exercise is crucial. It is a factor, which either
directly or indirectly, plays the lead in developmental activities. Take for example
agriculture, which is still the dominant employer of the rural masses. Switching
over from animal energy to tractors, from manual watering of fields to irrigation
pumps and from informal storage houses to cold storage, can significantly
increase agricultural productivity, and agro-processing might also emerge as a
potentially viable income/employment facet.
Very few villages have activities after sundown. The dimly lit shops in the
marketplaces represent another lost opportunity. With electric lighting and cold
storage facilities, you need not be an expert to predict the changes it can usher in.
Marketplaces would be the centre of all activitiy, thereby opening up another
income/employment opportunity.
Next, take the case of the present living standards in the rural households. The
households remind you of dark, dingy and smoky indoors, where women spend
the better half of their lives cooking and catering to the needs of the infants at the
same time. Biomass fuels serve 85% to 90% of household energy needs, and
bring along a host of health hazards, especially for women and children; indoor
pollution and a significant opportunity cost.
Even the educational and health aspects are contingent on the availability of
energy. While electric lights replacing the open- wick kerosene lamps might not be
a welcome change for those who want to evade studies, nevertheless it is more
effective, hygienic and less detrimental to the vision. On the other hand, the ability
to tackle emergencies at night and the storage of vaccines and life- saving drugs at
25/10/2002
Stanford Paper 3 3
the local village health centres would be enhanced in the presence of modern
energy carriers.
A patchwork of typical village life has been sketched above, only to emphasize
the point that energy is the keyword and it is the one aspect that can integrate all
the other related development activities. Providing modern energy arbitrarily
would not suffice, it is not the target; it is just the starting point. Each rural area
has its own distinct features and the energy requirements of two villages would
never be alike. A complete study of the existing energy endowments, the
feasibility of alternative energy forms, the methods of financing the switch over
and the concomitant reshaping of the institutions and people’s the psyche will
form the integral parts of effective rural energy planning.
Rural energy planning agency(ies) in India
Economic agents in any given geographical area use a combination of traditional
and/or commercial fuels to satisfy their energy needs. The basket of fuels they
choose is driven by their individual objective function, like utility maximization or
of the consumers surplus maximization or cost minimization. The objective of
planning is either to maximize the total social surplus or to obtain an economy-
wide cost-minimized basket of fuels. The success of any such macro/ micro- level
planning lies in the method of integrating a broader objective with individual
objectives such that the micro agents ultimately end up using efficient forms of
energy, as desired by the planning exercise while satisfying their respective
objective functions.
The IREP ( Integrated Rural Energy Programme) was developed in the
Seventh Five -Year Plan period when projects were set up in various agro-climatic
zones in India, for decentralized rural integrated energy planning at the most
micro level , i.e., at the block level. The broad objectives of the IREP encompass
the provision of energy for meeting the basic needs of cooking, heating, and
lighting using locally available resources.The promotion of renewable energy
sources and the efficient use of the non-renewable ones are important parts of the
agenda of the IREP along with capacity building for greater co-ordination,
participation and involvement among the stakeholders. Rural energy planning in
India comes under the ambit of the MNES (Ministry of Non-conventional Energy
Sources) which has been assigned the implementation of the IREP.
The MNES is the nodal agency of the Government of India which deals with
all the matters relating to non-conventional/ renewable energy covering the policy
– making , planning, promotion and co-ordination functions. These include fiscal
and financial incentives, creation of industrial capacity, promotion of
25/10/2002
Stanford Paper 3 4
demonstration and commercial programmes, Research and Development and
technology development, intellectual property protection, human resources
development and international relations.
(Source: www.indiasolar.com/MNES-PROFILE.htm)
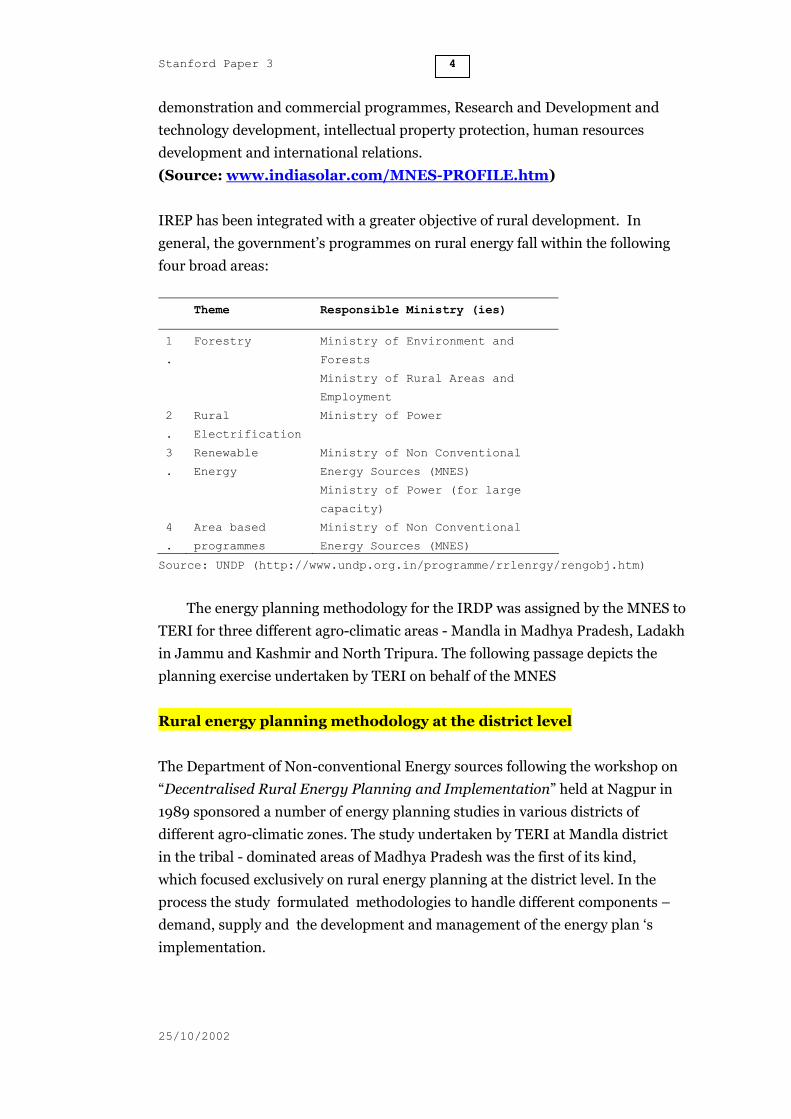
IREP has been integrated with a greater objective of rural development. In
general, the government’s programmes on rural energy fall within the following
four broad areas:
Theme Responsible Ministry (ies)
1
.
Forestry Ministry of Environment and
Forests
Ministry of Rural Areas and
Employment
2
.
Rural
Electrification
Ministry of Power
3
.
Renewable
Energy
Ministry of Non Conventional
Energy Sources (MNES)
Ministry of Power (for large
capacity)
4
.
Area based
programmes
Ministry of Non Conventional
Energy Sources (MNES)
Source: UNDP (http://www.undp.org.in/programme/rrlenrgy/rengobj.htm)
The energy planning methodology for the IRDP was assigned by the MNES to
TERI for three different agro-climatic areas - Mandla in Madhya Pradesh, Ladakh
in Jammu and Kashmir and North Tripura. The following passage depicts the
planning exercise undertaken by TERI on behalf of the MNES
Rural energy planning methodology at the district level
The Department of Non-conventional Energy sources following the workshop on
“Decentralised Rural Energy Planning and Implementation” held at Nagpur in
1989 sponsored a number of energy planning studies in various districts of
different agro-climatic zones. The study undertaken by TERI at Mandla district
in the tribal - dominated areas of Madhya Pradesh was the first of its kind,
which focused exclusively on rural energy planning at the district level. In the
process the study formulated methodologies to handle different components –
demand, supply and the development and management of the energy plan ‘s
implementation.
25/10/2002

Stanford Paper 3 5
This section deals with the details of the methodology followed in the process
of outlining an energy planning framework. A somewhat similar approach was
followed in the two subsequent energy planning exercises carried out by TERI in
Ladakh and Tripura on behalf of the MNES.
A broad overview of the methodology followed by TERI for district
- level energy planning:
The broad objective of energy planning encompasses a methodology for rural
energy planning at the district level to arrive at a feasible mix of energy sources
– conventional and non-conventional that can meet energy needs by keeping in
view the development priorities of the district. Fulfilling this objective requires
an understanding of the profile of the relevant district, which constitutes the
physiography, climate, area and population, land- use pattern, agriculture,
livestock population, infrastructure and energy consumption. All this
information was collected from the Census Handbook of the district under
analysis.
Energy supply
While carrying out the energy planning exercise, it is imperative to have a
proper estimate of the energy presently available from various sources , which
meet different energy end-uses in the district. This would help in arriving at a
realistic supply scenario so that the energy demand and supply could be
properly matched for use of the energy plan. The methodology followed in this
context was not a mere assessment of the existing supply scenario but delved
into other aspects, such as non-energy uses of these sources and the
management practices and functioning of the organizations involved in their
management.
Wood biomass assessment
Given that rural India’s energy needs are fulfilled by biomass , the initial step
was to evaluate the present sources and nature of supply of woody biomass. A
realistic assessment of the existing stock of woody biomass is required to study
the stress on the resources due to energy and non-energy uses Hence, an
assessment of the forest resources in the district was carried out to study the
growing stock from forests of the district, estimate sustainable yield from the
growing stocks, the present pattern of woody biomass consumption and the
potential use of woody biomass for energy generation and suggest measures to
improve the management of forest resources.
25/10/2002
Stanford Paper 3 6
The above study- related information was collected from the Forest
Department’s documents and discussion with officials. The working Plans,
Working Schemes and the Annual Administrative Reports from the
Conservator’s Office were the sources of secondary data related to the history of
the forests in the district, the growing stock, sustainable yields, local rights and
privileges, popular practices, the area of the forests, the volume of wood
harvested, the extraction of minor products, development programs etc. The
Timber account, return of Transit Permit and results of auctions from the
Divisional Forest Officer’s Office threw light on issues like the quantity of wood
movement, aggregated stock situation in depots, and revenues realized . At the
Range Office, the case diary register and the beat reports gave a clue to the
extent of illegal felling, encroachments, incidents of fire and thefts. Details on
wood production similar to timber accounts, growing stocks, volume tables,
regression equations etc. were available from the Report of Forest Survey of
India and other reports published by production division.
The secondary data however had limitations which are listed below:
The data was mainly available in terms of geographical areas and not in
volume, which is essential for assessing biomass resources.
The data on growing stocks, annual yields and expected yields were all in
area terms and since no data were available on the cropping density, crop
height or crop diameter for the same area, estimation of the volume was not
readily possible.
The information was highly scattered over several offices, making it tedious
and cumbersome to compile all the necessary data.
The records in valuable sources like the Nistar and Beat Reports were
incomplete and faulty thereby reducing the reliability of data.
A primary survey was carried at the village level to understand the status of
woody biomass in the sample villages since common and private non- forest
land also constitute a source of woody biomass. The inclusion of this source is
relevant to get an estimate of the total woody biomass available. Thus, an
inventory was planned for the woody biomass standing on these land categories
in both FV (forest villages) as well as RV (revenue villages). To select the
villages for the proposed survey, forest as a percentage of the total land of the
village was taken as the criterion since it was an indicator of relative availability
of biomass and the stress on biomass. The procedure adopted constituted of
listing the village-wise data on forests as a percentage of total land and grouping
25/10/2002
Stanford Paper 3 7
the villages into four strata with ranges of 0-15%, 15-30%, 30-45% and 45-60%.
A total of 12 villages were selected in that manner.
Animal Waste
Availability of animal waste depends on the cattle population ,and the feeding
and the grazing practices. Data on block-wise availability of wet as well as dry
dung based on the cattle population was available from the Veterinary
Department. A Primary survey revealed the extent of energy use and non-
energy use of animal wastes.
Crop Residues
The grain-to-residue ratio typically varies depending on the nature of seeds, soil
character and the amount and time variation of water availability necessary for
crop growth. A Summary of the residue estimates from different crops were
computed from myriad data sources like NPC, IAE, FAI, ICAR etc.
Data problems arose in estimating the proportion of crop residue used for
fodder and thatching vis-a vis` energy requirements.
Kerosene
This is the primary commercial fuel still used in the rural areas of India. In order
to estimate the accessibility of this fuel in the rural areas, the distribution system
for kerosene and the organizations involved in the distribution were studied
with special focus on the efficacy of the existing system. For this, extensive
discussions were held with the district/ divisional level authorities/ agencies
involved in kerosene distribution with the help of structured questionnaires. In
addition , a primary survey was carried out to study the overall energy
consumption pattern in the district.
Electricity
The management of electricity supply is done by a co-operative set-up, the
Grameen Vidyut Sahakari Samiti, which for all purposes is controlled by the
MPEB. Since electrification of a village does not automatically indicate that
electricity is supplied to all the households, primary surveys were conducted to
get a clue on the electricity consumers in households as well as the energization
of pump sets.
25/10/2002

Stanford Paper 3 8
Energy demand
The specified energy demand for different end- uses may either be based on an
energy survey to determine the existing energy consumption or a normative
value, based on predetermined criteria. In both cases, the relevant measure
would be the useful service provided. The relevant unit for specifying the
demand depends on the end-use and is generally one of the following - acre of
land, tonne of produce etc. and a procedure for aggregating the demand at the
appropriate or desired administrative level is required thereafter.
In TERI studies however, primary surveys were carried out with an emphasis
on the major existing end uses in the districts namely cooking, lighting,
irrigation et al.
Methodology
In order to aggregate energy demand at a higher level, it is crucial to select the
statistical sample with acute precision.
Sample selection
In the context of the variety of items on which information is sought through a
survey for local energy planning, the selection of sample is a complex task. For
energy demand estimation, aggregation and projection, it seems desirable to
select sample villages based on
1. per capita forest land
2. per capita agricultural land
3. per capita cultivable wasteland and
4. per capita livestock population
It is assumed that these parameters reflect the stress/ availability of biomass
energy resources on which the village energy system is based and for economies
based on agriculture, land would serve as a proxy for income. In addition to the
per capita land availability, the variation in the productivity of land must also be
incorporated in the exercise of constructing the strata using per capita land. The
appropriate sample selection criteria to determine the pressure on agricultural
land require consideration of the productivity of soil; the logical method to do
this would be to scale the per capita land availability by the productivity.
However, in the absence of clear geographical demarcations of land
productivity, and the fact that for a significant sample size post- stratification is
as accurate as pre- stratification (Cochran 1977), post stratification of this
category can be used as a statistically acceptable option.
25/10/2002
Stanford Paper 3 9
Formation of cluster of villages:
The procedure for identifying the clusters with a particular characteristic
consists of listing the village-wise per capita data of the above-mentioned land
use categories (agricultural, forest and culturable wasteland). From this data, a
list of contiguous villages (denoted by sequential census numbering) satisfying
conditions of low and high per capita land can be grouped into clusters for
which, say 80% of the villages must satisfy the criteria for the “ low” or “ high”
classification. Villages can then be randomly selected from within the clusters as
well as outside the clusters so as to be statistically representative.
Sample selection methodology
The following list contains some of the practical considerations which are
required for cluster formation prior to the survey and the actual selection of
villages for the survey :
1. The limitation of considering per capita land without considering the
productivity of land is a shortcoming of using per capita agricultural land
as a criterion for cluster formation. Usually the most agriculturally
prosperous villages do not correspond to the villages with high per capita
agricultural land; the converse is often true. Hence, while selecting the
clusters, the land productivity should also account in some form.
2. A particular problem arises with respect to the Forest Villages. The
formation of forest villages occurred in the late 1970’s when the Forest
Department leased agricultural land to households on forestland. As a
result of being situated at the forest fringes, these villages had access to the
forest resources as well and kind of depended on them to a very large
extent mainly due to the fact that the leased lands were of low quality and
unsuitable for agriculture. The leased plots however were large in size,
thereby indicating high per capita agricultural land whereas the
predominant characteristics of these villages is easy access to biomass.
3. Although it is desirable to incorporate per capita livestock population in
the sample selection procedure through the formation of clusters, very
often-non availability of data defeats the objective.
It would be worthwhile to look into the above and then evolve a general
methodology replicable at the district level.
Survey instruments
25/10/2002
Stanford Paper 3 10
Structured questionnaires were used as survey instruments and had two
components- village schedule and household schedule. The design of the
questionnaire took place in two stages: detailed questionnaires were designed
for the village and households, administered in few villages and in the second
stage; they were modified on the basis of the first survey. The process of addition
or deletion of questions was guided by the desire to avoid situations in which, to
quote Robert Chambers,
“Much of the material remains unprocessed, or if processed, unanalysed, or
if analysed, not written up, or if written up, not read, or if read, not
remembered, or if remembered, not acted upon.”
(Chambers 1983:53)
The final version of the questionnaire therefore is brief and contains information
selected with care , to be relevant for the purpose.
Survey results
The data that was collected through the interviews based on the questionnaires
were compiled on master sheets, computerized, processed and then analysed.
The statistical properties of the concerned variables were summarized and
tabulated. The analysis was directed towards examining the statistical
distribution of the collected data and unlike previous rural energy surveys where
the normal distribution was assumed; an effort was made to find alternative
distribution functions which were more relevant to the information collected.
Energy demand
For the purpose of planning, there are at least two basic information
requirements: the demand aggregate in the region relevant to the planning
exercise and the projection of future demands over the planning horizon.
The aggregation of energy demand was deduced from the distribution of the
consumption of biofuels which had been computed already. This was then
aggregated to the useful energy demand provided by the biofuels.
Demand projections require good knowledge of the explanatory variables
affecting energy demand. As a first approximation, the population is the
dominant factor in the change of energy consumption over time. The population
projections were based on the growth pattern evident from the census records.
Development priorities
Often in the past, the development priorities of the region have not received
adequate attention while conducting energy planning exercises. The result was
25/10/2002

Stanford Paper 3 11
that the suggested energy interventions could not be appropriately integrated
into the overall development strategy and thus failed to succeed. The success of
any energy planning exercise lies in designing energy schemes which are
congruent with the needs and the perceptions of the people who are supposed to
be the direct beneficiaries.
Implementation
A Proper management system, or the lack of it, has been one of the major
shortcomings in the implementation of energy plans in the past. Therefore it is
imperative to design an appropriate management system to ensure successful
implementation of the proposed energy plan.
Lessons learnt
Though similar techniques of energy planning were adopted, the outcomes
varied largely depending on geographic location, resource endowments and the
technological feasibility of providing commercial energy to these places.
In the tribal- dominated region of Mandla in Madhya Pradesh the planning
exercise indicated efficient use of available biomass resources, while in the hilly
regions of North Tripura the stress was more on renewable sources like biomass
gasifiers, solarphotovoltaic lighting systems and mini-micro hydel power
systems for power generation due to the intersection of hilly rivers in the region.
Similarly, the prescription for the mountainous regions of Ladakh constituted
renewable sources due to the abundance of sunshine, wind and streams and the
technological infeasibility of providing commercial sources of energy to such
remote and sparsely populated areas.
The three case studies exemplify the fact that given the diverse features of
rural India, a simple stock planning exercise cannot be the solution. The
objective of energy planning should not only be integrated with the larger goal of
overall rural development, but should be exclusive for each region. This requires
time, manpower, management and expertise from the planning agency. If each
region is to be scrutinized to evaluate its energy status, then a huge army of
trained personnel is required to carry out the detailed surveys and analyze the
results. Coupled with such efforts, the agency or the body carrying out the
exercise should also be assured of ready cooperation from the district offices and
all the stakeholders, so that maximum and accurate data is available within a
reasonable time period. And lastly, there should be adequate budget allocation
so that funds are available to carry out such extensive and expensive exercises.
This also throws light on the economic reality that since the planning
exercise involves multiple parties, the underlying incentive structure of each of
25/10/2002
Stanford Paper 3 12
the participants should be very strong and compelling. If the incentive structures
are well defined and in lines with the objectives of each of the stakeholders, then
maximum participation and cooperation among them can be ensured.
So, if on one hand we have survey-based energy planning, on the other hand
there is the option of sophisticated mathematical energy modelling. The need for
such modelling arose after the first oil embargo in mid 1970’s and ever since the
US has taken up modelling as an integral part of its national energy planning,
while the developing countries including India have not lagged behind in this
respect.
Why energy modelling
Traditionally, energy planning has been a part of macro-
economic multi-sectoral projections, but with the beginning of the era of
liberalization in mid eighties, it was felt that energy planning required a niche of
its own to provide strategies for optimising the efficiency of the growth process
by reducing the energy cost of the economy (Sengupta. R, Planning Commission,
New Delhi 1993). Mathematical modelling emerged as a feasible technique
which allows handling of myriad energy-economy variables and data, along with
the comprehensive coverage of all the energy sources, uses and sectors, which
are all enmeshed together in order to develop a criterion of choice which would
be objective, quantifiable and capable of systematically reflecting changing
situations and priorities( (Sengupta.R, Planning Commission , New Delhi 1993).
Ideally, a model is based on a series of assumptions and inter-relations
between various quantitative and qualitative variables, expressed
mathematically so that the effect of a change in one variable or more variables
on the system as a whole becomes evident. Energy models broadly fall under two
categories: top down and bottom up. The former are characterized by aggregate,
economic parameters, along with the consumption choices of the consumer,
technology. And the relationship between the factors of production within the
firms. These relationships explain how the relative use of inputs will change in
response to changes in their relative costs and how the relative consumption of
goods and services will change in response to changes in their relative prices. On
the other hand, the bottom up models describe the economic system from the
perspective of equipment, energy and sometimes labour and material output.
They miss the value added component of many of the service sectors with minor
energy changes. An integrated model combines both of the above, where in the
25/10/2002

Stanford Paper 3 13
results of each module feed into each other, in the process fine-tuning the
model.
Different energy models in TERI and the extent to which they
incorporate the rural sector
To assist in policy analysis, TERI has developed/used three energy modelling
exercises. The TEESE model and the MARKAL model are macro level models
encompassing all the energy supply and demand sectors of India and include the
rural sector to the extent of its contribution in energy demand from the
perspective of agriculture and households. Thus, rural India features as one of
the component sectors of the models since the focus remains on economy wide
energy planning.
One micro level model was developed by TERI in the late 1980’s, which
concentrates only on rural energy planning and hence takes into consideration
the nitty-gritty of rural energy supply and demand factors.
As in the following pages we go through the models and see the extent to
which they take into account the rural sector, one thing clearly stands out in the
process. While survey and case study based energy planning are the best
approximations of the ground realities, they do not provide an opportunity to
carry out comparative static exercises typically constituting of ‘if-then’
situations. Modelling compensates for this disadvantage as it allows for
evaluating alternative energy policies/scenarios in the wake of new technologies
or price regimes and their impacts on other macro-economic variables. As we go
through the synopsis on the energy models used by TERI, this feature becomes
all the more evident and promises to be a powerful tool to plan implementation.
The TEESE Model (Teri Energy Economy Simulation and Evaluation
Model)
The TEESE model is a static optimisation macro-model consisting of three
separate modules: the RES (Reference Energy System), an Input/Output model,
and a LP (Linear Programming) framework. The model aims to integrate the
energy supply and demand considerations and study the end use energy demand
patterns of various sectors, in the process of minimizing system cost of energy
and energy - utilizing activities.
This model takes into account 10 primary energy sources, 15 secondary
energy sources and about 43 non-energy sectors. The rural perspective that is
present in the model comes from the agricultural sector and the domestic sector.
25/10/2002
Stanford Paper 3 14
In the agricultural sector, the two energy- intensive activities are land
preparation and irrigation.
In case of irrigation, the water requirement of different crops have been
taken into account along with the percentage of crop being irrigated by pumps.
On the basis of this, irrigation requirements in cubic metres of water per rupee
output of crop have been estimated. The efficiencies of the pump sets, electric
and diesel have been measured in terms of the units of energy required per
cu.m. of water pumped out under the assumptions of average pump size,
efficiency etc.
The demand for energy for land preparation has been calculated on
similar lines. The crop wise land preparation demand has been estimated, taking
into account the sources of meeting such demand viz. tractors and animal
power. Along with the energy content, the time factor too has been considered
explicitly in terms of tractor hours of work and animal pair days of work.
The domestic sector, which is one of the primary energy, demand sectors
has been further disaggregated into urban and rural components. End uses
relating to the domestic sector: lighting, cooking, water heating, refrigeration,
Television loads and the use of fans have been worked out based on the energy-
norms of these energy services. The demand for these uses is categorized for
different income classes in the urban and the rural population. NCAER’s
(National Council for Applied Economic Research) domestic fuel survey with
special reference to kerosene serves as the data source for consumption norms
of different forms of energy for various end uses and income classes.
Sample results from the model (rural focus only)
This model was first validated for the year 1984-85 and run for the year 1989-
90 to estimate energy demands by using the final demands vector projected by
the Planning Commission in the technical note to the Seventh Five -Year plan
and assuming that technology would remain more or less constant over these 5
years.
In the base case scenario, assuming a rate of growth of 15% in tractor
population over the 5 year period from 1984-85, it was found that all tractor
capacity was being used (2.14 MT of diesel) up with a residual demand of ten
million head of cattle for land preparation. The irrigation water demand was
estimated at 440 billion cu.m assuming that 66% of rice production would be
from irrigated areas by 1989-90 and that 80% of wheat would be irrigated as per
7th Plan document. The demand for diesel for irrigation purposes was estimated
at 2.86 million tones.
25/10/2002
Stanford Paper 3 15
All of the traditional forms of energy were consumed within the domestic
sector- approximately 95 million tones of animal dung, 43 million tones of crop
waste and 63 million tones of firewood. The Seventh Five-year plan document
had estimated firewood availability in the year 1989-90 at only 50 million
tonnes.
However, the estimates for domestic sector showed 26.8 TWh of electricity
were consumed for lighting purposes and 6.8 TWh in the use of fans, 9.9 million
tonnes of kerosene and 830000 tonnes of LPG. These estimates are not
disaggregated for the urban and the rural household sectors.
Apart from the base case scenario, alternative scenarios were also attempted
to capture the fallouts of a 10% shortfall in electricity, 20% shortfall in electricity
and a 10% shortfall in electricity with oil consumption pegged to 1985-86 level.
As is evident from the results of the model, though rural energy planning
cannot be addressed exclusively as the rural economy falls within the greater set
of the macro-economy, this modeling exercise gives a precise clue to how
different policy scenarios would influence the rural sector. A change in policy at
the highest level of the economy like decisions to peg oil imports or use more
renewable energy, will have concomitant effects on the availability of fuels to the
rural sector. To that extent, this model can serve the purpose of providing
insights into rural India’s energy scenario.
The MARKAL Model at TERI
The MARKAL or the Market Allocation Model, which is the present energy
model in use at TERI , bears resemblance to the TEESE model save the fact that
it is a dynamic modelling exercise. The Indian MARKAL has been designed with
1996-97 as the base year and consists of a 45-year timeframe. The model allows
for identification of the key technologies for promoting environmentally
responsible sustainable development and the evaluation of the implications of
global climate change deliberation and policies in addition to its primary
objective of deciding on the least cost fuel mix for the economy.
Apart from the inclusion of the agricultural sector and the rural domestic
sector, the model encompasses non-commercial or traditional energy forms on
the supply side to capture a unique feature of developing economies. Hence,
unlike most energy balances, this model incorporates both the commercial and
the non-commercial energy forms.
Presence of the rural sector in this model
25/10/2002

Stanford Paper 3 16
Like the TEESE model, the agricultural and the rural residential sectors find
their place in the demand side. On the supply side, traditional fuels now find a
place as fuelwood, dung and crop residues are included in the optimisation
exercise.
The supply figures of fuelwood are provided by the Integrated Rural Energy
Program (IREP), 1992 and the future estimates are based on the forecast figures
of area under forest as in DISHAa (Directions Innovations And Strategies For
Harnessing Action For Sustainable Development) 2000.
Data on the availability of animal residue is not available and is calculated
indirectly using the cattle population, the proportion of dung collected and the
shared use for energy purposes. Similarly, in the absence of data on crop
residues, the quantum is calculated indirectly from the proportion of total crop
available as fuel.
Under the alternative assumptions of 6% and 6.5% growth of GDP (Gross
Domestic Product) along with the population forecasts and the urbanization
index available from the projections of the Planning Commission, the model was
run and validated for the base year 1996-97. With satisfactory outcomes for the
base year, the model indicates a gradual decline in the net availability of biomass
resources from 276.14 MT in 1996-97 to about 242.2 MT in 2011/12. From the
demand perspective, going by the model outputs, the kerosene consumption in
agriculture would escalate from 1 MT in 1996-97 to 4.56 in 2010-11, while power
consumption in the same sector would show a rising trend from 280.4 TWh to
533.09 TWh in the similar time frame. Since the model output for energy
demand figures in the residential sector gives the aggregate of both the urban
and the rural centres, one needs to cull out the rural component to get a hint of
energy consumption in the rural domestic sector.
Notes of caveat:
The above models are optimisation models and hence the results available
indicate the system cost-minimized numbers which might actually be quite
different from reality. For the base year or years already elapsed, one can
validate the model by imposing the institutional restrictions reigning in the
economy, thereby indicating the extent to which they diverge from the optimal
values.
Secondly, the estimation of energy demand is exogenous to the models. They
are typically estimated using econometric methods, and the results obtained
a Directions Innovations And Strategies For Harnessing Action For Sustainable Development
, TERI 2001
25/10/2002
Stanford Paper 3 17
thereafter are fed into the models. So one should keep in mind that MARKAL is
not a model to forecast energy demands, it is a model that guides planning by
producing optimal results.
In this respect, it can be mentioned that comparison of MARKAL output with
those of other models which forecast energy (like the Planning Commission
model , i.e. MEEDEs model), is irrational.
A Rural Energy Model for Energy Planning at TERI
Contrary to the two macro level energy models depicted above, there is a micro-
level energy-planning model devised in TERI in the late 1980’s. It is a village
level energy-economy model to identify an optimal mix of
centralized/decentralized, conventional/non-conventional energy systems from
the point of view of the farmer or social cost-benefit cost analysis.
The optimisation model which is an application of Mixed Integer
Programming integrates the database provided by the village level RES. The
significance of the model lies in the fact that it focuses on the role of biomass in
the village energy planning, thereby incorporating details in its supply and
demand structure. The model addresses special problem of a village, related to
accessibility and availability of biomass, alternative uses of biomass and the
alternative options to biomass.
A pre-tested questionnaire was used to acquire relevant and reliable data
from 10 villages in the plain region of Haryana and 10 other villages in the
deserts of Rajasthan and then the model outputs are analysed under three
scenarios: business as usual (BAU), where only the existing options are
considered, scenario 2 where renewable options like biogas plants, PV irrigation
system, biomass gasifiers for irrigation, solar cookers, solar hot water systems
etc are considered at non subsidized prices, while scenario 3 resembles the
preceding one except for subsidized prices attached as cost coefficients to
renewable energy technologies.
In all scenarios, cooking, water heating and fodder preparation are met by
crop residues. 60% of the lighting demand is satisfied by electricity and the
balance met by kerosene in scenarios 1 and 2.In scenario 3, as a result of
subsidizing the cost of renewables, biogas for lighting accounts for 36% and
kerosene 4%.
Irrigation is totally electricity based in scenario 1 but with introduction of
renewable technologies in scenarios 2 and 3, the share of electricity declined to
48.5% and .18% respectively.
25/10/2002

Stanford Paper 3 18
A significant point that emerges from the three runs is that the household
income does not change significantly with the introduction of renewable energy
resources. Subsidization yielded a marginal increase of 0 .4% in average income
of household. This result reflects the fact that the villagers have no incentive to
switch over from the existing energy systems to the renewable ones. This income
encompasses land income only since paucity of data prevented the insertion
of non-land income.
As the model tries to assist in designing an effective energy plan for the
selected villages in Haryana and Rajasthan, planning at a wider perspective
should ideally allow for the interaction of the rural sector with the rest of the
economy. This integrated approach however requires the following additional
data on:
The geographical characteristics of the area, the soil qualities and the
sustainability of different crops.
The comparative advantages of a particular block in production of certain
goods which will determine the kind of industries that might be set up. This
in turn might impact the cropping mix.
Data on the resource endowments and capital stock at the block level,
existing demographic details and likely changes in the demographic pattern,
impact of socio-economic growth on energy and non-energy requirements
etc.
A brief look at the nature of data-use and assumptions in the TERI
working model of energy(MARKAL)
As far as the model data requirements are concerned, they can be segregated
into the supply side and the demand side components. Taking into account the
rural perspective in the model, on the supply side, one needs data on the
traditional fuels viz. the fuelwood, crop residues and animal wastes as well as
those on commercial energy like kerosene, diesel and electricity used in
agriculture and rural residential sectors.
Since MARKAL is the working energy model at TERI, we present below in
detail the data requirements, the estimated values and the normative energy
consumption figures.
On the supply side:
Traditional fuels
Bio-fuels play an important role in the energy scenarios of developing countries.
In terms of their use in physical energy terms, bio-fuels constitute nearly the
25/10/2002

Stanford Paper 3 19
same levels as coal in the country. However, due to the low calorific content of
these fuels as well as the low end-use efficiencies associated with their use, the
useful energy met by these sources is much smaller.
The Indian residential sector continues to be dominated by the use of bio-
fuels, with about 95% of rural households and 40% of urban households still
relying mainly on traditional energy forms. All these fuels are generally collected
free of cost and do not find their way to commercial markets. Moreover, the
supply RES of the traditional energy forms is simplistic and consists of only the
domestic availability of the resource, as there are no associated imports or
exports for these fuels.
Fuelwood
The supply of fuelwood was estimated at 169 million tonnes (3294 PJ) according
to the Integrated Rural Energy Programme (IREP), 1992. However, this level of
fuelwood use is considered to be unsustainable in the long-run. The sustainable
fuelwood supply is therefore estimated based on future estimates of the area
under forests and a sustainable yield of 55 tonnes per square kilometre of
forestland. In 1997, the land area under forests was 63 million hectaresa and
this is projected to increase to 93 million hectares by 2020b. Accordingly, the
supply of fuelwood is assumed to decline from the current levels to a level of 51.2
mt (998 PJ) by 2020 and remain at this level henceforth. The supply of
fuelwood is considered at zero cost in the model.
cTraditional stove for ooking
firewood to residential sector
Improved cook stove (fixed)
improved cook stove(portable)
Firewood availiability producer gas for agriculture pumps
gasifier for agriculture pumpsets
Firewood based commercial stoves
Cooking in commercial sector
25/10/2002
a 100 hectares = 1 sqkm b DISHA 2000
Stanford Paper 3 20
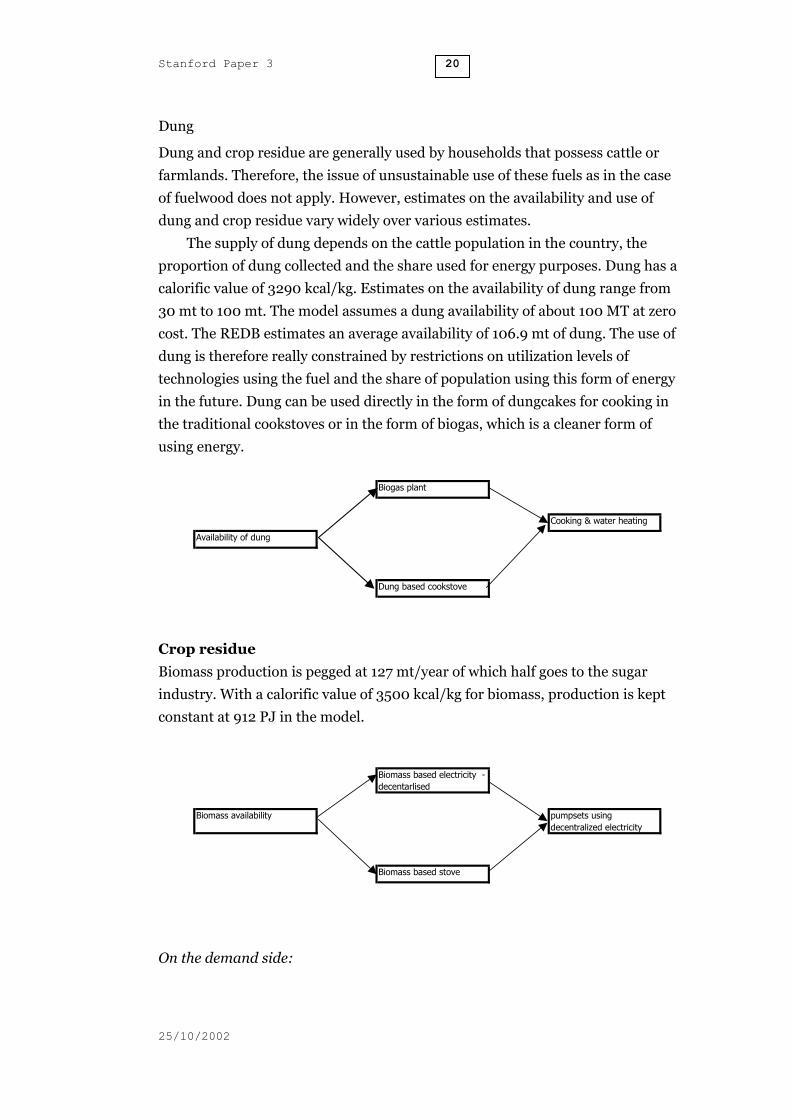
Dung
Dung and crop residue are generally used by households that possess cattle or
farmlands. Therefore, the issue of unsustainable use of these fuels as in the case
of fuelwood does not apply. However, estimates on the availability and use of
dung and crop residue vary widely over various estimates.
The supply of dung depends on the cattle population in the country, the
proportion of dung collected and the share used for energy purposes. Dung has a
calorific value of 3290 kcal/kg. Estimates on the availability of dung range from
30 mt to 100 mt. The model assumes a dung availability of about 100 MT at zero
cost. The REDB estimates an average availability of 106.9 mt of dung. The use of
dung is therefore really constrained by restrictions on utilization levels of
technologies using the fuel and the share of population using this form of energy
in the future. Dung can be used directly in the form of dungcakes for cooking in
the traditional cookstoves or in the form of biogas, which is a cleaner form of
using energy.
Biogas plant
Cooking & water heating
Availability of dung
Dung based cookstove
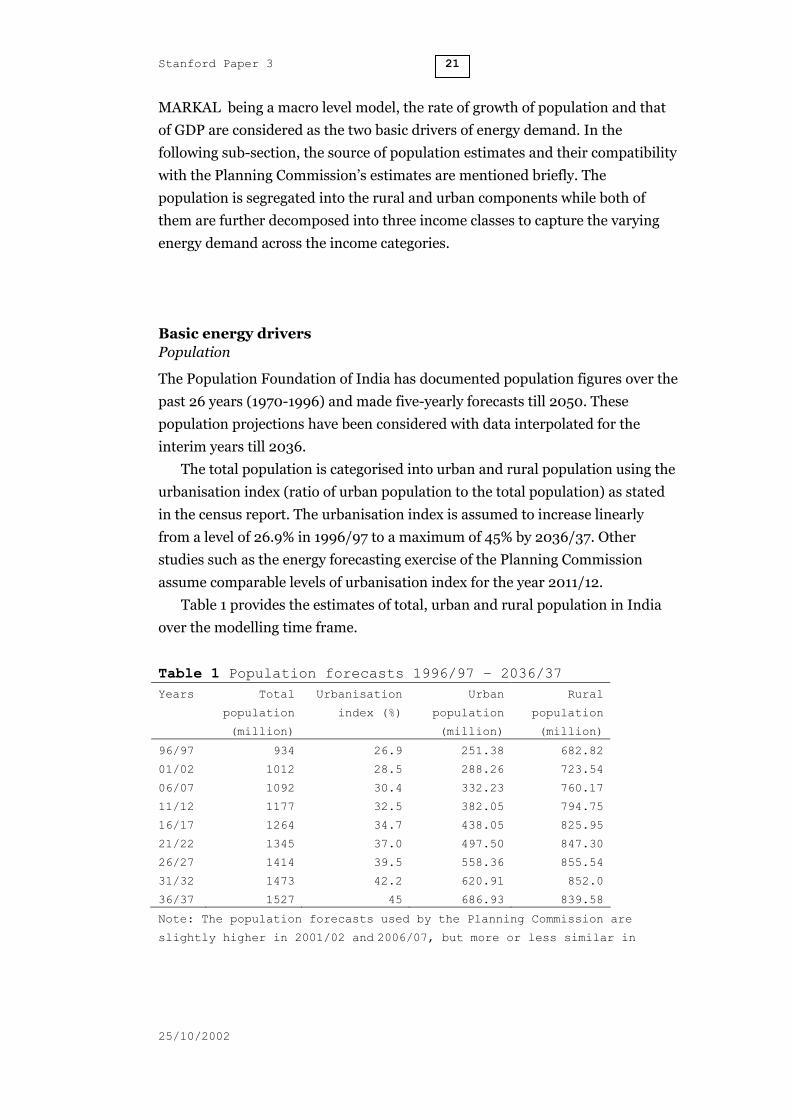
Crop residue
Biomass production is pegged at 127 mt/year of which half goes to the sugar
industry. With a calorific value of 3500 kcal/kg for biomass, production is kept
constant at 912 PJ in the model.
Biomass based electricity - decentarlised
Biomass availability pumpsets using decentralized electricity
Biomass based stove
On the demand side:
25/10/2002
Stanford Paper 3 21
MARKAL being a macro level model, the rate of growth of population and that
of GDP are considered as the two basic drivers of energy demand. In the
following sub-section, the source of population estimates and their compatibility
with the Planning Commission’s estimates are mentioned briefly. The
population is segregated into the rural and urban components while both of
them are further decomposed into three income classes to capture the varying
energy demand across the income categories.
Basic energy drivers Population
The Population Foundation of India has documented population figures over the
past 26 years (1970-1996) and made five-yearly forecasts till 2050. These
population projections have been considered with data interpolated for the
interim years till 2036.
The total population is categorised into urban and rural population using the
urbanisation index (ratio of urban population to the total population) as stated
in the census report. The urbanisation index is assumed to increase linearly
from a level of 26.9% in 1996/97 to a maximum of 45% by 2036/37. Other
studies such as the energy forecasting exercise of the Planning Commission
assume comparable levels of urbanisation index for the year 2011/12.
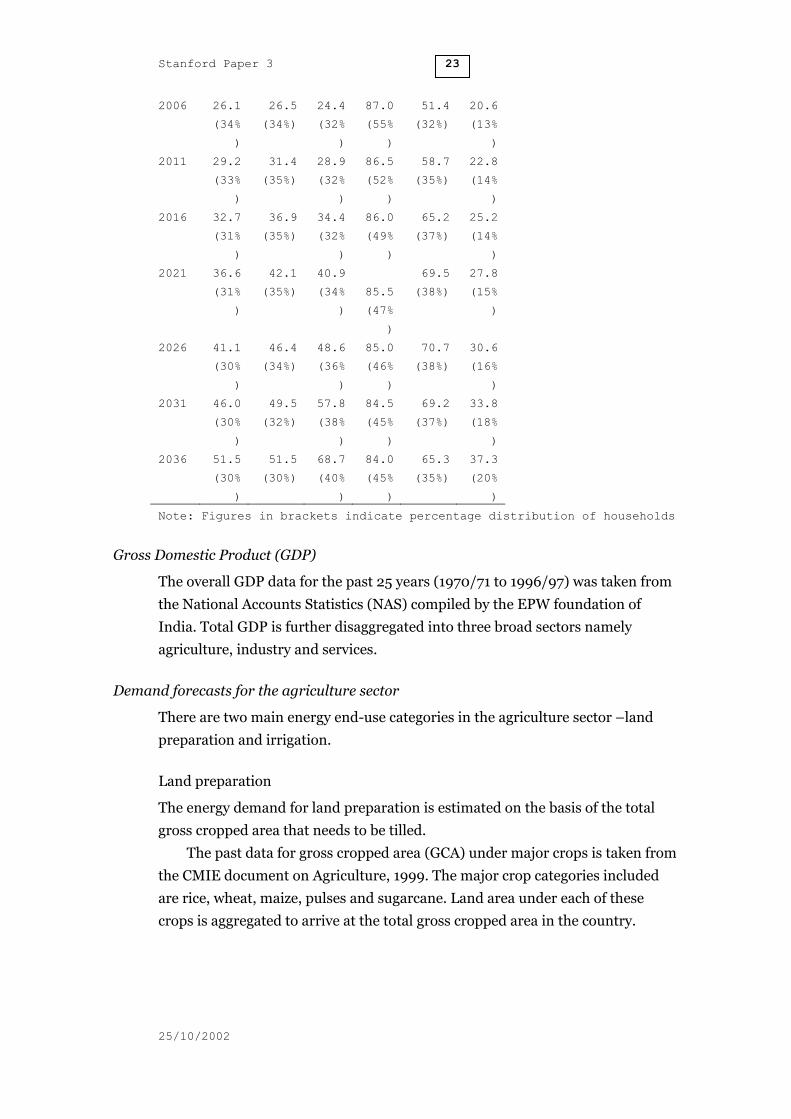
Table 1 provides the estimates of total, urban and rural population in India
over the modelling time frame.
Table 1 Population forecasts 1996/97 – 2036/37 Years Total
population
(million)
Urbanisation
index (%)
Urban
population
(million)
Rural
population
(million)
96/97 934 26.9 251.38 682.82
01/02 1012 28.5 288.26 723.54
06/07 1092 30.4 332.23 760.17
11/12 1177 32.5 382.05 794.75
16/17 1264 34.7 438.05 825.95
21/22 1345 37.0 497.50 847.30
26/27 1414 39.5 558.36 855.54
31/32 1473 42.2 620.91 852.0
36/37 1527 45 686.93 839.58
Note: The population forecasts used by the Planning Commission are
slightly higher in 2001/02 and 2006/07, but more or less similar in
25/10/2002

Stanford Paper 3 22
2011/12. Information from the Household Consumption Expenditure Surveys,
NSSO has been used for categorisation across income groups.
The average size of an urban household was 4.456 in 1994/95 while the
average rural household size was 4.896 in the same year (Planning Commission
report). The household size in the urban and rural areas are assumed to
decrease to 4 and 4.5 respectively by 2036/37. Accordingly, the numbers of
households in the urban and rural areas are estimated for the modelling period.
The households in the urban areas have been further split up into 3 income
categories - viz. low, medium and high. These categories correspond to 1994/95
income levels in the range of Rs 75,000 and 150,000 per annum, Rs 150,000
and 300,000 per annum and incomes above Rs 300,000 per annum
respectivelya. Although rural population was also classified into 3 categories
comprising low (incomes below Rs 25,000 per annum), middle (income
between Rs 25,000 and 50,000 per annum) and high (income levels between Rs
50,000 and 75,000 per annum) income classes, the usage norms were applied to
the total rural population due to lack of disaggregate data on penetration rates
and usage of appliances.
The distribution of households by income category for 1994/95 in the urban
and rural areas is based on the actual proportions as indicated by the Indian
market Demographics Report (1996) of the NCAER. Over the 45- year modelling
period, it is assumed that living standards would improve and the proportion of
the high-income category would increase from 30% in 1994/95 to 40% in
2036/37 while the proportion of the low-income group decreases from 37% in
1994/95 to 30% by 2036/37.
Table 2 Distribution of households by income categories in
rural & urban areas (millions) Urban Rural
Low Mediu
m
High Low Mediu
m
High
1996 20.8
(37%
)
18.7
(33%)
17.2
(30%
)
88.1
(63%
)
35.0
(25%)
17.0
(12%
)
2001 23.3
(35%
)
22.1
(34%)
20.5
(31%
)
87.6
(58%
)
43.6
(29%)
18.7
(12%
)
a Indian Market Demographics, I Natrajan 1996
25/10/2002
Stanford Paper 3 23
2006 26.1
(34%
)
26.5
(34%)
24.4
(32%
)
87.0
(55%
)
51.4
(32%)
20.6
(13%
)
2011 29.2
(33%
)
31.4
(35%)
28.9
(32%
)
86.5
(52%
)
58.7
(35%)
22.8
(14%
)
2016 32.7
(31%
)
36.9
(35%)
34.4
(32%
)
86.0
(49%
)
65.2
(37%)
25.2
(14%
)
2021 36.6
(31%
)
42.1
(35%)
40.9
(34%
)
85.5
(47%
)
69.5
(38%)
27.8
(15%
)
2026 41.1
(30%
)
46.4
(34%)
48.6
(36%
)
85.0
(46%
)
70.7
(38%)
30.6
(16%
)
2031 46.0
(30%
)
49.5
(32%)
57.8
(38%
)
84.5
(45%
)
69.2
(37%)
33.8
(18%
)
2036 51.5
(30%
)
51.5
(30%)
68.7
(40%
)
84.0
(45%
)
65.3
(35%)
37.3
(20%
)
Note: Figures in brackets indicate percentage distribution of households
Gross Domestic Product (GDP)
The overall GDP data for the past 25 years (1970/71 to 1996/97) was taken from
the National Accounts Statistics (NAS) compiled by the EPW foundation of
India. Total GDP is further disaggregated into three broad sectors namely
agriculture, industry and services.
Demand forecasts for the agriculture sector
There are two main energy end-use categories in the agriculture sector –land
preparation and irrigation.
Land preparation
The energy demand for land preparation is estimated on the basis of the total
gross cropped area that needs to be tilled.
The past data for gross cropped area (GCA) under major crops is taken from
the CMIE document on Agriculture, 1999. The major crop categories included
are rice, wheat, maize, pulses and sugarcane. Land area under each of these
crops is aggregated to arrive at the total gross cropped area in the country.
25/10/2002

Stanford Paper 3 24
Past trends have been used to extrapolate the area under each of the crops in the
future. Accordingly, the GCA of different crops grows at different rates (based on
past data) while the total gross cropped area grows at 0.71% per annum over the
40-year period. The demand for land preparation is provided as billion hectares
of land to be tilled. The land preparation by tractor accounts for roughly about
75% of the total demand for land preparation. Table 5 gives the demand for land
preparation in billion hectares.
Table 5 Demand for land preparation Years Billion
hectares
1996/97 0.092
2001/02 0.095
2006/07 0.098
2011/12 0.101
2016/17 0.105
2021/22 0.109
2026/27 0.113
2031/32 0.117
2036/37 0.122
Irrigation
The energy demand for this end-use is estimated on the basis of the total water
requirement by various crops in the country. Crop-wise data on the gross
cropped area (million hectares) in the country was taken from the CMIE
document on Agriculture. The net production of each crop was derived using
average yields (kg/ha) for different crops after which average norms of water
requirement (cu m /kg) for each crop were used to estimate the total water
requirement for all the major crops. The proportion of area under crops
irrigated by pumpsets was used to determine the demand for energy in this end-
use sector. Table 6 provides the demand for water pumping in the agriculture
sector in billion cubic meters of water required to be pumped.
Table 6 Demand for water pumping Years Billion cubic
meters (b cu m)
1996/97 333
2001/02 407
2006/07 495
2011/12 598
2016/17 719
25/10/2002

Stanford Paper 3 25
2021/22 1286
2026/27 1525
2031/32 1796
2036/37 2100
Forecasting of residential sector demands
Residential demands are estimated on the basis of user populations and
estimated usage norms for each end-use category. The total urban population
has been further split up into the low, medium and high income categories while
the rural population is considered as a whole. The number of households in each
of these categories have been determined as explained in the section on energy
drivers. The main end-use categories in the residential sector are lighting,
cooking, space-conditioning, water heating, refrigeration and use of other
electrical appliances.
Energy demands for space conditioning, water heating and refrigeration are
based on usage norms and penetration rates as discussed below.
Table 8 gives the penetration rates (number per 1000 households) of the various
appliances across different income categories. The energy demand is estimated
as the product of the penetration rates and the usage norms.
Table 8 Penetration rates of various appliances (nos./000
hhs) End use Rural ULIG UMIG UHIG
1996 2036 1996 2036 1996 2036 1996 2036
Fans 323 420 430 1180 1191 1721 1727 2000
Water
heating
0.8 4.1 4.4 70.6 72.7 237 237 260
Refrigera
tion
20.6 29.8 31.6 316.
7
321.
6
600 600 650
Coolers 0 0 0 0 629 1717 0 0
AC 0 0 0 0 0 0 575 2290
Residential demand for lighting
The demand for lighting is estimated separately for the rural population and for
the low, middle and high-income categories among urban households. The
norms for lighting demand per household in each of the categories is estimated
based on the following assumptions:
Rural households: 33% of the rural households are assumed to use
hurricane lanterns, 33% assumed to use petromax lanterns and the rest
use a bulb for 4 hours a day.
25/10/2002
Stanford Paper 3 26
Low-income urban households: A typical household in this category is
assumed to use one 60W bulb for 7 hours/day and two 25W bulbs for 2
hours/day.
Middle-income urban households: A typical household in this category
uses an average of the consumption in the in the low-income and high-
income households.
High-income urban households - A typical household in this category is
assumed to use one fluorescent tube light for 5 hours/day, two 60W
bulbs for 7 hours/day, and one 25W bulb for 2 hours/day.
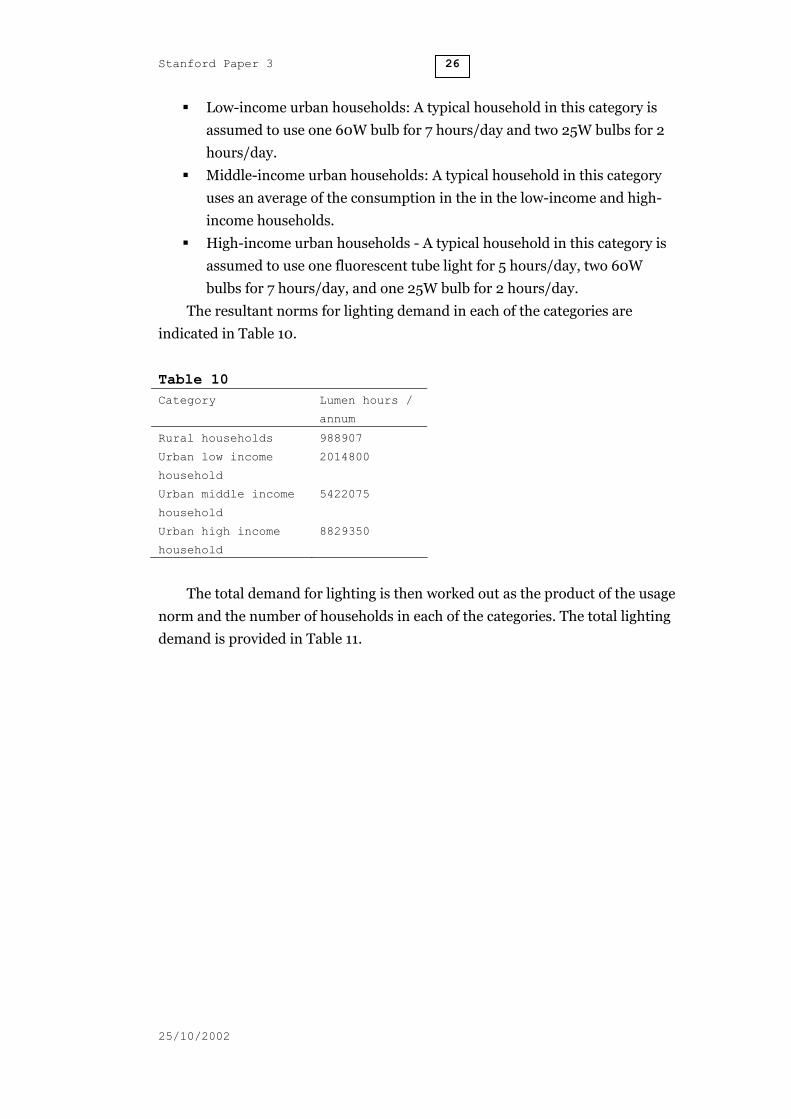
The resultant norms for lighting demand in each of the categories are
indicated in Table 10.
Table 10 Category Lumen hours /
annum
Rural households 988907
Urban low income
household
2014800
Urban middle income
household
5422075
Urban high income
household
8829350
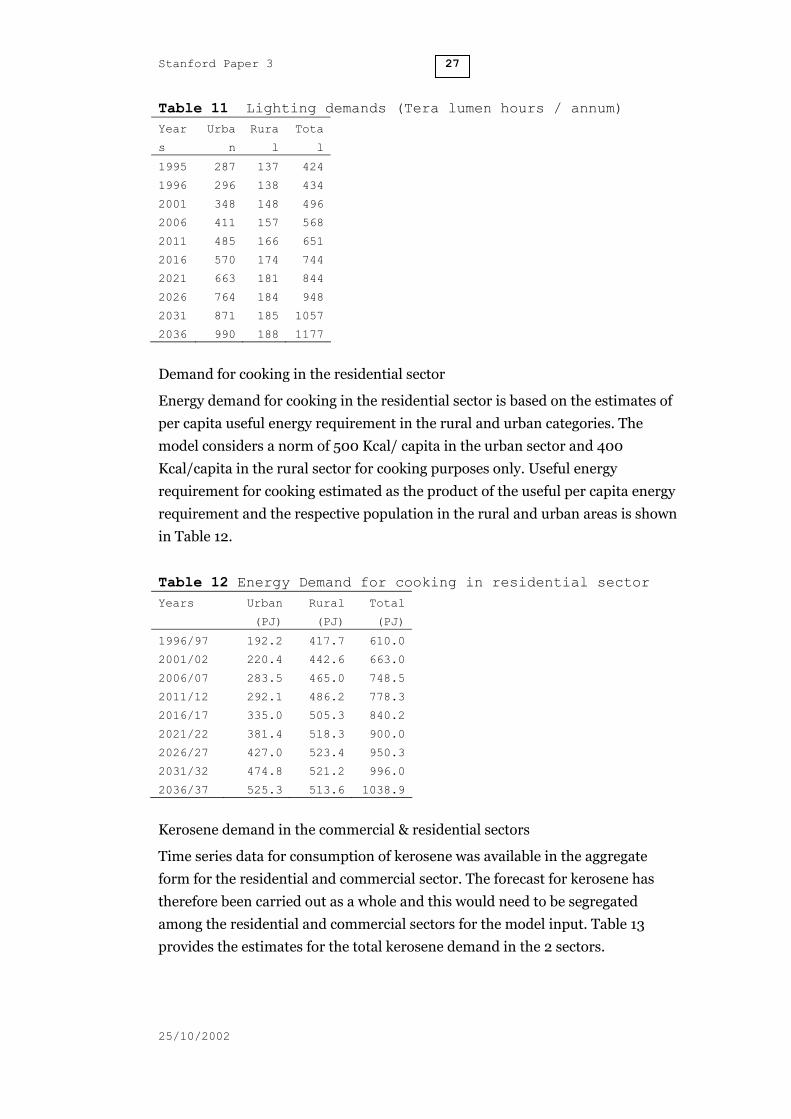
The total demand for lighting is then worked out as the product of the usage
norm and the number of households in each of the categories. The total lighting
demand is provided in Table 11.
25/10/2002
Stanford Paper 3 27
Table 11 Lighting demands (Tera lumen hours / annum) Year
s
Urba
n
Rura
l
Tota
l
1995 287 137 424
1996 296 138 434
2001 348 148 496
2006 411 157 568
2011 485 166 651
2016 570 174 744
2021 663 181 844
2026 764 184 948
2031 871 185 1057
2036 990 188 1177
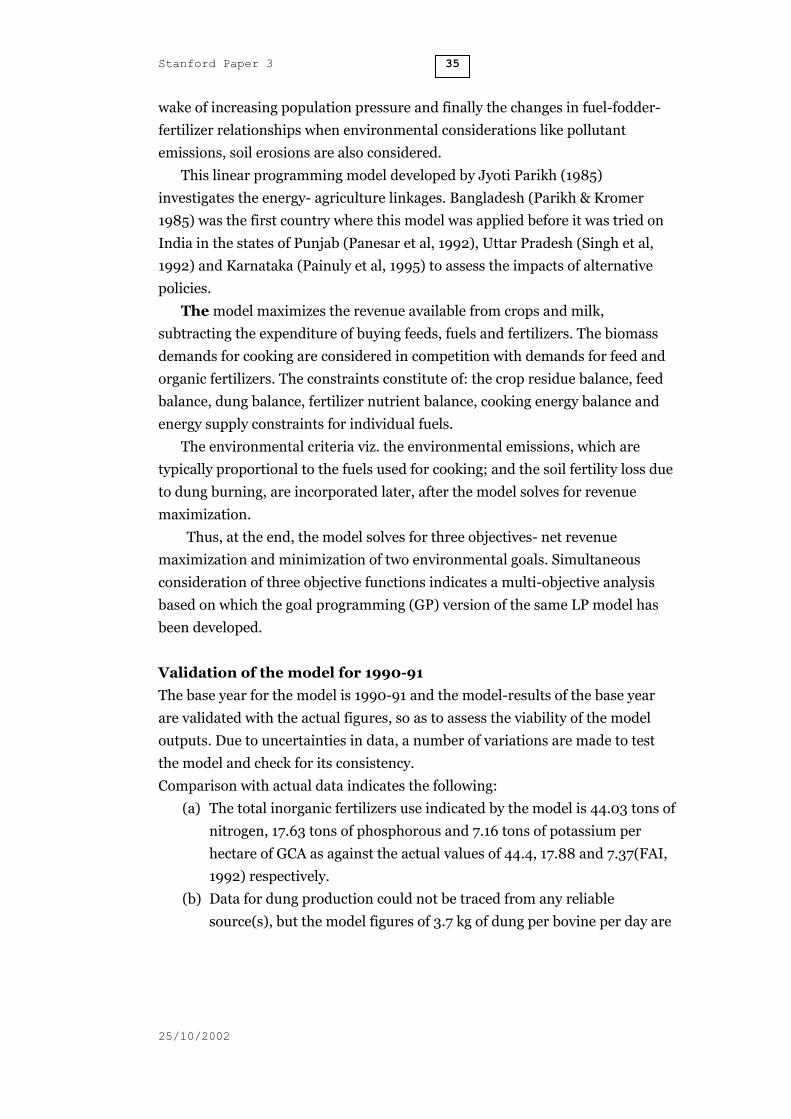
Demand for cooking in the residential sector
Energy demand for cooking in the residential sector is based on the estimates of
per capita useful energy requirement in the rural and urban categories. The
model considers a norm of 500 Kcal/ capita in the urban sector and 400
Kcal/capita in the rural sector for cooking purposes only. Useful energy
requirement for cooking estimated as the product of the useful per capita energy
requirement and the respective population in the rural and urban areas is shown
in Table 12.
Table 12 Energy Demand for cooking in residential sector Years Urban
(PJ)
Rural
(PJ)
Total
(PJ)
1996/97 192.2 417.7 610.0
2001/02 220.4 442.6 663.0
2006/07 283.5 465.0 748.5
2011/12 292.1 486.2 778.3
2016/17 335.0 505.3 840.2
2021/22 381.4 518.3 900.0
2026/27 427.0 523.4 950.3
2031/32 474.8 521.2 996.0
2036/37 525.3 513.6 1038.9
Kerosene demand in the commercial & residential sectors
Time series data for consumption of kerosene was available in the aggregate
form for the residential and commercial sector. The forecast for kerosene has
therefore been carried out as a whole and this would need to be segregated
among the residential and commercial sectors for the model input. Table 13
provides the estimates for the total kerosene demand in the 2 sectors.
25/10/2002

Stanford Paper 3 28
Table 13 Total kerosene demand (‘000 tons) Year
s
Scenario 1 (6%
GDP growth)
Scenario 2 (6.5%
GDP growth)
96/9
7
9878 9878
01/0
2
13487 13614
06/0
7
18479 19094
11/1
2
25317 26781
16/1
7
34687 36692
21/2
2
45334 50272
26/2
7
59250 68876
31/3
2
77437 92172
36/3
7
101208 123347
On the basis of the above assumptions, data and estimations, the following
results were derived.
MARKAL Output
Traditional fuels
Table Traditional fuels (MT)
1996/97 2001/02 2006/07 2011/12
Markal Markal Markal Markal
Supply (A+B-C)
A. Production 276.14 271.60 269.94 242.00
Firewood 115.84 116.21 119.45 96.41
CR 62.26 62.26 62.26 62.26
Dung 98.04 93.14 88.24 83.34
Consumption 276.14 271.60 269.94 242.00
FW Domestic 74.72 83.63 91.61 81.34
Commerci
al 41.13 32.58 27.84 15.07
25/10/2002

Stanford Paper 3 29
CR Domestic 61.47 60.89 60.28 59.74
Power 0.78 1.37 1.97 2.51
Dung Domestic 98.0 93.1 88.2 83.3
25/10/2002

Stanford Paper 3 30
Traditional Fuels:BAU
T r a d i t io n a l f u e ls - B A U
0
5 0
1 0 0
1 5 0
2 0 0
2 5 0
3 0 0
1996 /97
2001 /02
2006 /07
2011 /12
2016 /17
2021 /22
2025 /26
2031 /32
2036 /37
Y e a r s
Mill
ion
tonn
es
C r o p r e s id u e F ir e w o o d A n im a l d u n g
Oil Demand: Agriculture and Residential Sectors only
Table Oil Demand projections Oil (MT)
1996/9
7
1999/0
0
2001/0
2
2006/0
7
2011/1
2
Actu
al Markal Actual Markal Markal Markal
Supply
(A+B-
C)
82.7
2 85.93 100.06 162.56 231.93 234.05
A.
Productio
n
32.9
0 32.90 31.90 35.02 37.14 39.26
B.
Imports
52.9
8 57.77 104.46 137.99 220.68
C.
Exports 3.16 4.74 0.93 10.65 10.45 25.90
Consumpti
on
64.4
1 64.8 80.0 108.0 150.1
Agricultu
re Diesel 0.62 1.74 2.68 3.62 4.56
Domestic LPG 3.35 7.95 9.79 11.76 14.24
Kerose
ne 8.1 9.90 0.03 0.00 0.00
Power Demand: Agriculture and Residential Sectors only
Power demand projections {Power (TWh)} 1996/97 2000/01 2001/02 2006/07 2011/12
Actual Markal Actual Markal Markal Markal
I.
Generation (A+B+C+D+E) 436.65 444.07 543.00 535.56 663.58 849.03
25/10/2002

Stanford Paper 3 31
1996/97 2000/01 2001/02 2006/07 2011/12
Actual Markal Actual Markal Markal Markal
A. Thermal 317.03 327.94 408.00 360.92 417.67 534.18
Coal 289.37 301.11 325.01 366.35 428.25
Diesel 0.68 0.00 0.00 0.00 0.00
Gas 26.98 26.83 35.91 51.32 105.94
B. Hydro 68.90 69.25 74.00 92.00 131.61 171.22
C. Nuclear 9.07 8.13 17.00 8.13 9.29 10.45
D. Wind 0.88 0.54 0.93 1.31 1.69
E. Captive 40.78 38.75 44.00 74.51 105.01 133.18
Coal 29.12 27.86 50.86 74.09 99.20
Diesel 6.62 4.18 8.07 9.80 11.69
Biogas 2.42 3.72 4.97 6.16
Gas 5.04 4.30 11.86 16.15 16.14
II. Generation
excluding captive 395.87 405.32 499.00 461.04 558.57 715.85
III.
Consumption 280.18 280.04 326.36 407.28 533.09
Agriculture 84.01 84.54 97.85 114.39 134.46
Domestic 55.26 56.28 66.90 81.47 103.88
IV. T& D
Losses
Excluding
captive 29.22 30.91 29.21 27.09 25.53
25/10/2002

Stanford Paper 3 32
Other projections:
Apart from the MARKAL projections, given below are the biomass demand
figures estimated by the Planning Commission, Power and Energy Division, July
2000, in its draft Energy Policy Committee Report.
The figures pertain to three scenarios-
(a) Frozen Efficiency Scenario (FE): where the efficiency in energy use in
different sectors of consumption continues to remain at the same level as
in the base year 1994-95
(b) Business-as-usual Scenario(BAU): where the efficiency of energy used is
assumed to increase at the rate of 0.5% to 1% per annum.
Energy Demand Projections
Non-Commercial Energy
Source Scenario 2001-02 2006-07 2011-12
Fuelwood FE 165.64 215.34 235.72
(Million Tonnes) BAU 181.94 182.64 180.83
EFF 160.19 131.53 118.18
Dung Cake FE 103.88 112.24 120.78
(Million Tonnes) BAU 100.69 100.87 101.87
EFF 92.27 79.94 75021
Crop Waste FE 60.77 66.78 72097
(Million Tonnes) BAU 60.02 64.24 69013
EFF 50.61 42.03 40.46
BioGas FE 1537 1902 2273
(Million Cubic Meters) BAU 1537 1902 2273
EFF 1464 1665 1911
(c) Efficiency Scenario (EF): where changes in efficiency improvements in
energy production and utilization in addition to improvements that may
be achieved in the BAU scenario is assumed in order to realize the full
potential for energy saving and inter-fuel substitution possibilities.
25/10/2002

Stanford Paper 3 33
In the wake of the above results from MARKAL which give the macro level
optimum values of energy demand from which the rural sector has to be
segregated, the by I. Natarajan forecasts demand for the biofuel in rural Indian
households.
The paper by Natarajan focuses exclusively on the biomass energy
consumption of the rural households and projects the future demands for the
same. However, this paper captures only rural biofuel consumption for heating
purpose only and excludes the use of any commercial fuel or energy
consumption for any other purposes.
25/10/2002

Stanford Paper 3 34
In predicting the future biofuel demand, Natarajan uses the data on energy
use and the pattern of fuel consumption collected from sample households
available from the “Evaluation of NPIC” studies, conducted by NCAER for the
years 1992-93 and 1996-97. Keeping the baseline survey of 1978-79 of NCAER
at the backdrop, the paper attempts to estimate the biofuel demand in rural
India by the end of the Ninth and Tenth Five Year Plans of India.
The table below gives a synopsis of the projected demand for biofuels ,
though they cannot be pitted against the MARKAL output since the latter gives
cost minimized values only.
Projected demand for heating energy and likely pattern of fuel use in rural
households, 2001-2 and 2006-7
2001-2 2006-7
Fuel Unit Qty ktcr shar
e
Qty ktcr Shar
e
Coal/ Soft
coke
103 t 420 572 0.3% 420 572 0.2%
Kerosene 103
kl
1,559 9,666 4.8% 1,901 11,786 4.8%
Dung cake 103 t 103,09
3
31,959 15.8
%
113,48
1
35,179 14.3
%
Firewood:
logs
103 t 74,714 70,979 35.0
%
94,760 90,022 36.5
%
Firewood:
twigs
103 t 95,091 58,006 28.6
%
120,60
4
73,568 29.8
%
Crop wastes 103 t 39,102 23,852 11.8
%
41,615 25,385 10.3
%
Biogas 106
m3
1,108 3,878 1.9% 1,521 5,324 2.2%
Others -- 4,059 2.0% 4,935 2.0%
Total -- 202,97
0
100% 246,77
1
100%
Source:Natarajan.I, Demand Forecast for Biofuels in Rural Households.
Some other models
Outside the boundaries of TERI, there exists the INGRAM Energy Model
envisaged by Jyoti Parikh, R.Ramanathan and J.P.Painuly. Given the fact that
rural India is heavily dependent on biomass-based energy sources, this model
focuses on the policy questions regarding the fuel-fodder-fertilizer relationships
for biomass utilization in rural areas of developing countries like India, the
impact of price change on commercial fuels on the biomass sources, role of
livestocks in this context, the implications of reduced biomass availability in the
25/10/2002
Stanford Paper 3 35
wake of increasing population pressure and finally the changes in fuel-fodder-
fertilizer relationships when environmental considerations like pollutant
emissions, soil erosions are also considered.
This linear programming model developed by Jyoti Parikh (1985)
investigates the energy- agriculture linkages. Bangladesh (Parikh & Kromer
1985) was the first country where this model was applied before it was tried on
India in the states of Punjab (Panesar et al, 1992), Uttar Pradesh (Singh et al,
1992) and Karnataka (Painuly et al, 1995) to assess the impacts of alternative
policies.
The model maximizes the revenue available from crops and milk,
subtracting the expenditure of buying feeds, fuels and fertilizers. The biomass
demands for cooking are considered in competition with demands for feed and
organic fertilizers. The constraints constitute of: the crop residue balance, feed
balance, dung balance, fertilizer nutrient balance, cooking energy balance and
energy supply constraints for individual fuels.
The environmental criteria viz. the environmental emissions, which are
typically proportional to the fuels used for cooking; and the soil fertility loss due
to dung burning, are incorporated later, after the model solves for revenue
maximization.
Thus, at the end, the model solves for three objectives- net revenue
maximization and minimization of two environmental goals. Simultaneous
consideration of three objective functions indicates a multi-objective analysis
based on which the goal programming (GP) version of the same LP model has
been developed.
Validation of the model for 1990-91
The base year for the model is 1990-91 and the model-results of the base year
are validated with the actual figures, so as to assess the viability of the model
outputs. Due to uncertainties in data, a number of variations are made to test
the model and check for its consistency.
Comparison with actual data indicates the following:
(a) The total inorganic fertilizers use indicated by the model is 44.03 tons of
nitrogen, 17.63 tons of phosphorous and 7.16 tons of potassium per
hectare of GCA as against the actual values of 44.4, 17.88 and 7.37(FAI,
1992) respectively.
(b) Data for dung production could not be traced from any reliable
source(s), but the model figures of 3.7 kg of dung per bovine per day are
25/10/2002
Stanford Paper 3 36
in lines with the figures prescribed in Painuly (1992; 1995), Singh et al
(1992), Safely et al (1992) and Stout (1990).
(c) The actual figures for kerosene consumption for cooking purposes in
rural India during 1990-91 was not collected and it has been estimated
as a certain percentage of the total kerosene consumption in Indian
households equal to 10800 litres (CMIE, 1992b). The model estimates a
consumption of 1261 litres of kerosene for cooking purpose in the rural
households, approximately equal to 11.68% of total kerosene
consumption which compares well with the share (9.5%) of cooking
estimated by Natarajan (1985) for the year 1978.
Thus the model results are pretty close to the original data, indicating the
validity of the model structure and the values of the parameters. Alternative
scenarios are also incorporated in the model to make room for alternative
policies.
The Planning Commission of India used the MEEDE-S approach in 1991 to
estimate the energy demand in India till the year 2009. The MEEDE-S approach
provides a quantitative analytical framework to estimate energy demand in the
long run since the conventional econometric techniques are fairly consistent in
the short run and medium run, but not in the long run. The end-use demand
driven model permits analysis with reference to technological options and fuel-
mix choices while allowing for structural changes in the economy.
Besides the macroeconomic assumptions of 6% growth in GDP during the
1987-2009 and population touching the 1140 million mark by the year 2009, the
rural component of the model assumes large scale energization of pump sets by
the year 2009 in the agricultural sector, while changes in the pattern of income
distribution along with its repercussions on the standard of living and
consumption of fuel are also incorporated in the model. Emphasis on rural
electrification is reflected in the base case scenario, by taking into account the
increasing demand for electricity from rural households for lighting purpose
along with the implications of substituting traditional fuels by the commercial
ones on the demand for kerosene and LPG.
The Planning Commission report based on the MEEDE-S exercise mentions
the need to estimate the energy requirements with reference to different agro-
climatic regions, especially to obtain data on the extent to which diesel and
electric pump sets as well as tractors are utilized in the different regions. The
report also touches upon the fact that numerous studies carried out on energy
consumption in the household sector are not comparable. It also stresses on the
25/10/2002
Stanford Paper 3 37
necessity to carry out periodical surveys (every three to five years) on the
patterns of energy consumption with reference to fuel mix, income variation,
urban/rural differences and the end use efficiencies of different types of
domestic appliances, so as to analyse accurately. The report also identifies the
lacuna of not including decentralized energy systems based on renewable
sources along with the drawback of not incorporating structural changes in the
economy that could lead to drastic changes in the overall energy efficiencies.
Along side the optimisation models sketched above, there is an energy
accounting model like the Long-range Energy Alternatives Planning
Model (LEAP) which stands out as a simulation model used to represent the
current energy scenario for a given area and to develop forecasts for the future
under certain assumptions.
This end-use, demand driven model consists of five modules comprising of
demand, transformation, biomass, environment and evaluation. There is
provision for an explicit inclusion of biomass as a source of energy in this model.
The evaluation of the biomass resources is incorporated through land use
evaluation where the study area is divided in a tree structure of sub areas, zones
and land use types. For all land use types, the acreage, productivity and the
access fraction is mentioned. The last factor accounts for the maximum amount
of annual yields and stocks that can be used for energy purpose taking into
account the limiting elements like the distance, land tenure and the harvesting
constraints.
The figure below explains the nature of disaggregation for biomass
resources. In this example, two areas- north and central have been considered,
each comprising of two zones-forest and non-forest, each with the type of land
use. The percentages specified indicate the share of the resource on that type of
land that is available for energy use.
25/10/2002

Stanford Paper 3 38
SUB-AREA ZONE LAND USE TYPE STOCK, YIELD & ACCESS FRACTIONNorthern Forest Natural Forest (14,000 ha) 125 ton/ha, 1.2 ton/ha/yr, 20%Region Forest Plantations (6,500 ha) 60 ton/ha, 4.0 ton/ha/yr, 40%
Watershed Forest (3,200 ha) 100 ton/ha, 1.0 ton/ha/yr, 15%
Non-Forest Village Land (4,500 ha) 37 ton/ha, 1.5 ton/ha/yr, 80%Fruit Plantations (6,000 ha) 45 ton/ha, 2.5 ton/ha/yr, 60%Crop Land (21,000 ha) 10 ton/ha, 0.5 ton/ha/yr, 80%
Central Forest Forest Plantation (9,500 ha) 55 ton/ha, 3.5 ton/ha/yr, 40%Region
Non-Forest Village Land (3,300 ha) 31 ton/ha, 1.4 ton/ha/yr, 80%Fruit Plantations (5,700 ha) 53 ton/ha, 2.7 ton/ha/yr, 60%Crop Land (17,500 ha) 12 ton/ha, 0.6 ton/ha/yr, 80%City (1,300 ha) 1 ton/ha, 0.1 ton/ha/yr, 50%
Figure 1. Example of a wood resource structure in the biomass model of LEAP
Source: (Joost Siteur, RWEDP, LEAP and Wood Energy Planning)
The crop residues and animal dung are also calculated on a sub-area basis, to allow
for the evaluation of the supply of these biomass fuels. The figure below sketches the
fuel flow in the LEAP Model.
25/10/2002
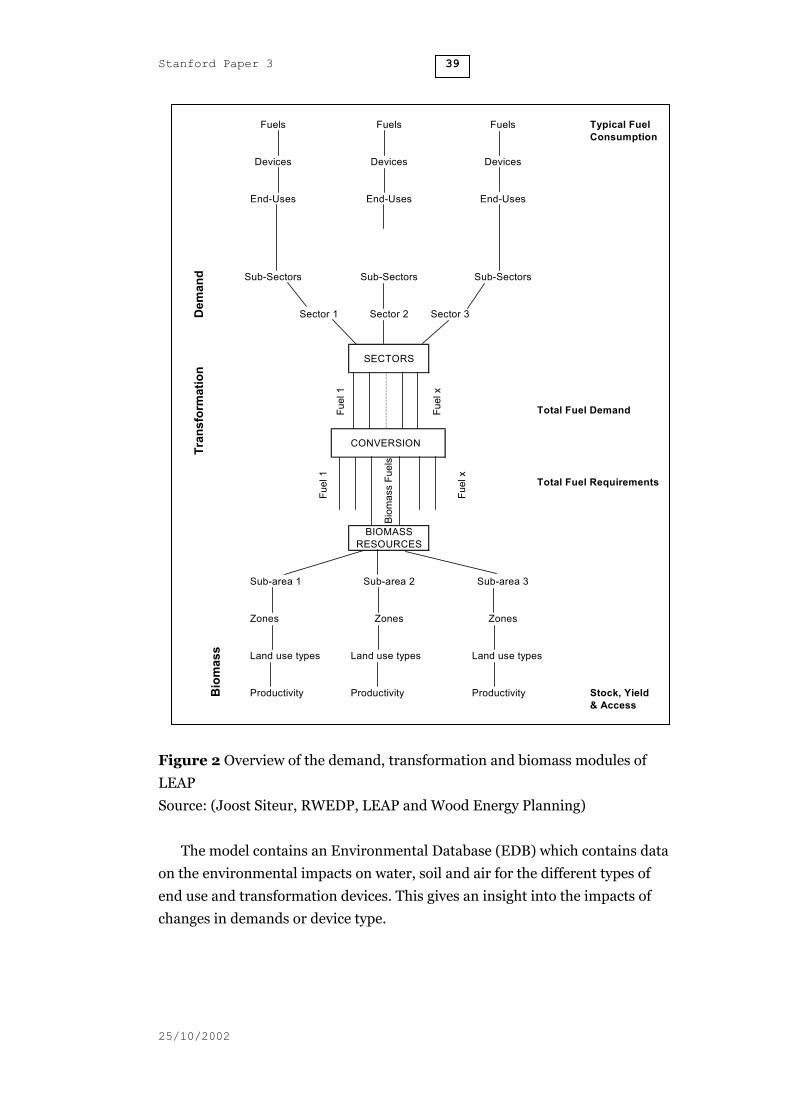
Stanford Paper 3 39
Fuels Fuels Fuels Typical FuelConsumption
Devices Devices Devices
End-Uses End-Uses End-Uses
Sub-Sectors Sub-Sectors Sub-Sectors
Sector 1 Sector 2 Sector 3
SECTORS
Fuel
1
Fuel
x
Total Fuel Demand
CONVERSION
Total Fuel Requirements
BIOMASSRESOURCES
Sub-area 1 Sub-area 2 Sub-area 3
Zones Zones Zones
Land use types Land use types Land use types
Productivity Productivity Productivity Stock, Yield& Access
Dem
and
Tran
sfor
mat
ion
Bio
mas
s
Fuel
1
Biom
ass
Fuel
s
Fuel
x
Figure 2 Overview of the demand, transformation and biomass modules of
LEAP
Source: (Joost Siteur, RWEDP, LEAP and Wood Energy Planning)
The model contains an Environmental Database (EDB) which contains data
on the environmental impacts on water, soil and air for the different types of
end use and transformation devices. This gives an insight into the impacts of
changes in demands or device type.
25/10/2002

Stanford Paper 3 40
Apart from the base case scenario, other alternative scenarios can be
developed by changing the values of one or more factors. The last bit of the
model allows the evaluation of the alternative scenarios pitted against one
another or the base case. This directs the modeller towards an optimised and
feasible solution.
The preceding description of the model throws a hint on the fact that this
can be used for biomass energy planning. The model provides a comprehensive
framework for the whole energy flow from the biomass sources through
conversion to the end use consumption. And since biomass still remains the
lifeline of energy in the rural sectors, in the process, the model takes care of
rural energy planning as well.
(Source: Joost Siteur, RWEDP, LEAP and Wood Energy Planning)
Though the scope of the model includes a wide spectrum ranging from
integrated energy planning at the national and regional levels to possibilities of
energy conservation, GHG emission possibilities to global energy and climate
change studies, it can very well focus on rural energy planning as pioneered by
RWEDP and FAO of the UN in collaboration with Stockholm Environment
Institute (SEI), who have adopted LEAP as a tool for organizing and analysing
biomass and rural energy issues. (Source: SEI website)
Energy Models: what do we achieve?
A glimpse at the above mentioned models throws light on the fact that one stock
model is not the answer for an economy wide planning exercise. This becomes
all the more relevant in the Indian context since the country is a mosaic of
varying climatic and socio-economic zones. This kind of heterogeneity does not
get reflected in the macro models like TEESE or MARKAL, as they treat the
entire economy as one single unit.
Heterogeneity also exists at the smallest level of the economy, viz. the
villages. There are villages where it is easier to implement energy related
policies due to the conducive location or climate or the residents’ favourable
responses in adopting changes due to reasonable purchasing power and
advanced mindsets. All these factors become important in the wake of rural
energy planning apart from the normal energy demand/supply considerations.
It is imperative to include such micro considerations in the models since output
might very well indicate that optimal energy supply requires n units of
electricity to be provided to the villages, while reality might be that it is
technologically infeasible to connect certain villages to the grid due to their
remote positions. Thus one should not only get a clue as to how much energy
25/10/2002

Stanford Paper 3 41
should be supplied to meet a certain amount of demand, but should also be able
to get a solution as to how exactly this demand should be met.
Typically all these models answer the question of how much energy should
be provided but not on how they are to be provided. For that one needs to go
down to the village level and work things out in accordance to what suits the
particular village in question.
Even if one accepts that models can take care of such factors, then the next
question arises as regards to the time of planning and its subsequent
implementation. There exists a considerable time lag in data collection,
compilation, its incorporation in the model, obtaining the optimal solution and
finally its implementation. So we might very well face a situation where at the
time of implementation of the planned programs, ground realities have changed
to a large extent with its repercussions on energy forecasts. Its not very clear
whether the models discussed incorporate this revision in data
forecast/information arising due to time lag.
One again comes back to the question of the treatment of the regional
differences in the model. The calculation of rural energy demand for cultivation
and the domestic sector are based on the norms of energy consumption
standardized at the national level. This does not account for regional disparities
in consumption norms and hence the resultant demand calculations are also
generalized.
Even when planning is done specifically for the rural sector, there arises one
source of discrepancy. The supply of fuelwood, which is regarded as the lifeline
in the developing countries, is calculated on the basis of area under forestry,
while the actual usage is in terms of logs or branches. Hence there is a difference
in units in the fuelwood demand and supply figures.
Way ahead and future research scope:a
Future research scope lies in developing models which would dwell on the
objective of capturing the rural energy transition. This would be distinct from
the above mentioned models whose objective functions are either energy cost
minimization or maximization of revenues of the farmers.
This would require identifying the nature of transition, developing indicators
to capture the same, collecting relevant data and finally incorporating the
underlying assumptions and data in the concerned model. The key rural energy
transitions consist of:
a I am grateful to my colleague Vikram Dayal for his comments which helped in shaping up
this particular sub-section.
25/10/2002

Stanford Paper 3 42
Movements of households up or down the domestic energy ladder and the
associated huge improvements or deterioration in the indoor air
environment.
The shift from animal power to tractors and pumpsets for ploughing and
irrigation respectively
The shift of dependence from public or common land to private land and the
associated change in property rights regimes
The change in attitude towards "policy makers" from what may crudely be
termed top-down to bottom up, from keeping people out to involving them,
to handing out energy efficient devices to designing processes whereby
people choose to adopt energy devices that improve their well-being.
These transitions are nested within larger transitions in the rural landscape,
notably demographic change, both of the increase in numbers and urbanisation;
technological change and agricultural development, etc.
One issue that is particularly significant in rural energy transitions is scale
dependence: two villages close by may have very different profiles and local and
state transtions could possibly be different. Another issue is the possibly
different fortunes of different socio-economic groups.
Arguably, such macro models as TEESE and MARKAL simply haven't
attempted to answer questions of rural energy transitions. They have looked at
the national energy scene and take as given certain parameters.
What could a future modelling strategy for rural energy transitions be?
It would have to build from the numerous field and micro studies, and
investigate and explore different ideas of rural energy transitions. Perhaps some
simulation modelling done at different time and spatial scales along with studies
to test and improve key relationships is the way to go. These simulations would
be based on relationships between household choices, energy stocks and drivers.
At the end of it, what one can say is that modelling is only a tool or an
instrument. It is not a magic wand that can define a perfect path for the
economy or any of its component sectors. One can only get a clue or guidance
from them since such models are not “ prescriptive” but rather “ directive” in
nature. So, while staunch supporters of market economies denounce the idea of
planning including energy planning, in the words of Amulya Reddy one can
defend the entire planning exercise as a means to achieve an end, the end being
development.
Infact, with the Tenth Five Year Plan (2002-2007) shifting its focus from
industry-oriented growth to agriculture-led growth (Pant, The Statesman, New
25/10/2002
Stanford Paper 3 43
Delhi, 19.09.2002), the importance and the urgency to include the rural sector
in planning models becomes all the more imperative.
References:
• Application of a Rural Energy Model in Energy Planning (1997), TERI, New
Delhi
• Comprehensive Energy Plan for Ladakh Region (1998), TERI, New Delhi
• Developing Methodology for Rural Energy Planning at the District Level
(1992), TERI, New Delhi
• Development of a Quantitative Model for Systems Evaluation of Energy
Related Technologies (1988), TERI, New Delhi
• Energy Policy Committee Report(Draft), Planning Commission, Power
and Energy Division, July 2000.
• Loulou, Shukla & Kanudia (1997), Energy and Environment Policies, Allied
Publishers Limited
• Munasinghe & Meier (1993), Energy Policy Analysis and Modelling,
Cambridge University Press
• Natarajan, I, Demand Forecast for Biofuels in Rural Households, IEA
• Parikh Jyoti, Energy Models for 2000 and Beyond (1997), Tata McGraw Hill
• Parikh, J.K (1980), Modelling Approach to the Long Term Energy Demand
and Energy Policy Implications, New Delhi, Planning Commission
• Possibilities of Carbon Dioxide Emission Reduction in India (2000), TERI,
New Delhi
• Possibilities of Carbon Dioxide Emission Reduction in India (2000), TERI,
New Delhi
• Ramani, Reddy & Islam, Rural Energy Planning-A Government Enabled
Market-based Approach, APCD
• Ravindranath, N.H (1995), Biomass, Energy and Environment: Developing
Country Perspective from India, Oxford University Press
• Rural Energy and Development of Two Billion People, World Bank
Possibilities of Carbon Dioxide Emission Reduction in India (2000), TERI,
New Delhi
• Rural Energy Matters-the Dhanwas experience (2000), TERI, New Delhi
• Sectoral Energy Demand Studies in Asia: Synthesis Report (1992), United
Nations, New York
• Sectoral Energy Demand in India, Planning Commission (1991), New Delhi
25/10/2002

Stanford Paper 3 44
25/10/2002
• Sengupta, R, Energy Modelling for India: Towards a Policy for Commercial
Energy, Delhi, Controller of Publications
• Siteur, Joost, The Long-range Energy Planning model (LEAP) and Wood
Energy Planning, Overview and Exercises, RWEDP
• TERI Energy Data Directory and Yearbook 2001-02, TERI, New Delhi
• The Challenge of Rural Energy Poverty in Developing Countries, World
Energy Council
• The Statesman (19.09.2002), New Delhi
• Websites:
1. IEA
2. RWEDP
3. Planning Commission India
4. WEC
5. World Bank