Incipient damage detection and its propagation monitoring of rolling contact fatigue by acoustic...
9
Incipient damage detection and its propagation monitoring of rolling contact fatigue by acoustic emission Ziaur Rahman a, , Hiroaki Ohba a , Takeo Yoshioka b , Takashi Yamamoto b a Technical Research Center, Toyo Electric Mfg. Co., Ltd., 3-8 Fukuura, Kanazawa-ku, Yokohama, Kanagawa 236-0004, Japan b Department of Mechanical Systems Engineering, Tokyo University of Agriculture and Technology, 2-24-16 Naka-cho, Koganei, Tokyo 184-8588, Japan article info Article history: Received 25 December 2007 Received in revised form 30 July 2008 Accepted 28 October 2008 Available online 11 November 2008 Keywords: Rolling element Acoustic emissions AE source locator Incipient damage diagnosis Condition monitoring abstract The acoustic emission (AE) technique was applied to rolling contact fatigue tests using a test-rig running under constant load and speed for detecting the incipient damage and damage location. This incipiently-damaged roller was investigated in detail and monitored by further running to determine the damage severity and to understand the surface damage propagation process by applying the AE techniques. The conventional AE parameters and AE signal features were studied, and their relation with the AE source locator hit count rate were correlated. The results demonstrated the successful use of the AE measurement unit, which is principally, consists of the AE data analyzer and the AE source locator as a new system for detecting incipient damage produced by fatigue. Moreover, the system is able to forecast the position of the damage in the roller, capable of providing an indication of the severity of damage i.e. damage size, and thus it could allow the user to monitor the rate of further degradation of the rolling elements. & 2008 Elsevier Ltd. All rights reserved. 1. Introduction In railway industry, the challenge of today is to better control the performance of rolling contact elements such as gears, bearings etc. in driving devices of electric railcars in order to successfully avoid disturbances, failures, breakdowns and un- planned shutdowns. In the industry, clients prefer long intervals between inspections and long running periods of cars with no maintenance. Well-developed condition monitoring techniques give us the possibility to monitor the present status of moving parts in driving devices online, and help us by avoiding catastrophic in-service failure. The trend towards increasing power, weight-to-load factor, complexity and efficiency in rotating machinery pushed to rolling elements design limits, and their fault identification requires improved detection ability of incipi- ent damage mechanism which is one of the major concerns in the industry. The mechanical deterioration in rotating machines caused by wear is almost always noticeable itself by means of changes in the levels of vibrations and the acoustic emission (AE) at different points of the machine. One of the advanced fault identification procedures commonly used is the condition-based vibration or AE signature analysis. Since the sensing frequency is much higher in AE sensor based testing comparing with linear response accelerometers in vibration analysis, the AE technique can detect the incipient damage on a micro-scale, such as fatigue, stress corrosion, fretting wear and sliding friction [1]. Therefore, the AE technique was able to detect smaller damages in comparison with the well-established vibration measurement [1–3]. However, the application of the AE technique to monitor the damage formation and failures is comparatively recent and is still at an early stage in condition monitoring for rolling elements [4,5]. The AE is defined as the transient elastic waves generated by the rapid release of strain energy from localized sources within the material due to the changes in the internal structure [6]. The AE technique can detect crack initiation and growth, while the vibration accelerometer can only detect the appearance of spalling [7], or the crack growth at a later stage of the crack growth process [8]. Siores et al. [9] concluded that the AE results could be correlated to various damage conditions. However, to date, most researchers have performed the trial tests with the ‘artificial’ or ‘seeded’ damages in rolling elements. This damage or defect was artificially introduced by scratching the surface, introducing debris into the lubricant of machine with an electrical discharge or spark erosion method etc. [10–14]. Williams et al. [15] published a report on lifetime test with the undamaged bearing through to failure; however defect determination was analyzed by conventional vibration metrics. Furthermore, Yoshioka et al. [16,17] introduced a method for damage diagnosis and measure- ment of fatigue crack propagation by time intervals of the AE generation and observing the effecting area of the loading zone by an AE location method for life tests of radial ball bearing. ARTICLE IN PRESS Contents lists available at ScienceDirect journal homepage: www.elsevier.com/locate/triboint Tribology International 0301-679X/$ - see front matter & 2008 Elsevier Ltd. All rights reserved. doi:10.1016/j.triboint.2008.10.014 Corresponding author. Tel.: +8145 785 3702; fax: +8145 785 3053. E-mail address: [email protected] (Z. Rahman). Tribology International 42 (2009) 807–815
-
Upload
ziaur-rahman -
Category
Documents
-
view
214 -
download
0
Transcript of Incipient damage detection and its propagation monitoring of rolling contact fatigue by acoustic...

ARTICLE IN PRESS
Tribology International 42 (2009) 807–815
Contents lists available at ScienceDirect
Tribology International
0301-67
doi:10.1
� Corr
E-m
journal homepage: www.elsevier.com/locate/triboint
Incipient damage detection and its propagation monitoring of rolling contactfatigue by acoustic emission
Ziaur Rahman a,�, Hiroaki Ohba a, Takeo Yoshioka b, Takashi Yamamoto b
a Technical Research Center, Toyo Electric Mfg. Co., Ltd., 3-8 Fukuura, Kanazawa-ku, Yokohama, Kanagawa 236-0004, Japanb Department of Mechanical Systems Engineering, Tokyo University of Agriculture and Technology, 2-24-16 Naka-cho, Koganei, Tokyo 184-8588, Japan
a r t i c l e i n f o
Article history:
Received 25 December 2007
Received in revised form
30 July 2008
Accepted 28 October 2008Available online 11 November 2008
Keywords:
Rolling element
Acoustic emissions
AE source locator
Incipient damage diagnosis
Condition monitoring
9X/$ - see front matter & 2008 Elsevier Ltd. A
016/j.triboint.2008.10.014
esponding author. Tel.: +8145 785 3702; fax:
ail address: [email protected] (Z. Rahman
a b s t r a c t
The acoustic emission (AE) technique was applied to rolling contact fatigue tests using a test-rig running
under constant load and speed for detecting the incipient damage and damage location. This
incipiently-damaged roller was investigated in detail and monitored by further running to determine
the damage severity and to understand the surface damage propagation process by applying the AE
techniques. The conventional AE parameters and AE signal features were studied, and their relation with
the AE source locator hit count rate were correlated. The results demonstrated the successful use of the
AE measurement unit, which is principally, consists of the AE data analyzer and the AE source locator as
a new system for detecting incipient damage produced by fatigue. Moreover, the system is able to
forecast the position of the damage in the roller, capable of providing an indication of the severity of
damage i.e. damage size, and thus it could allow the user to monitor the rate of further degradation of
the rolling elements.
& 2008 Elsevier Ltd. All rights reserved.
1. Introduction
In railway industry, the challenge of today is to better controlthe performance of rolling contact elements such as gears,bearings etc. in driving devices of electric railcars in order tosuccessfully avoid disturbances, failures, breakdowns and un-planned shutdowns. In the industry, clients prefer long intervalsbetween inspections and long running periods of cars with nomaintenance. Well-developed condition monitoring techniquesgive us the possibility to monitor the present status of movingparts in driving devices online, and help us by avoidingcatastrophic in-service failure. The trend towards increasingpower, weight-to-load factor, complexity and efficiency in rotatingmachinery pushed to rolling elements design limits, and theirfault identification requires improved detection ability of incipi-ent damage mechanism which is one of the major concerns in theindustry. The mechanical deterioration in rotating machinescaused by wear is almost always noticeable itself by means ofchanges in the levels of vibrations and the acoustic emission (AE)at different points of the machine. One of the advanced faultidentification procedures commonly used is the condition-basedvibration or AE signature analysis. Since the sensing frequency ismuch higher in AE sensor based testing comparing with linearresponse accelerometers in vibration analysis, the AE technique
ll rights reserved.
+8145 785 3053.
).
can detect the incipient damage on a micro-scale, such as fatigue,stress corrosion, fretting wear and sliding friction [1]. Therefore,the AE technique was able to detect smaller damages incomparison with the well-established vibration measurement[1–3]. However, the application of the AE technique to monitorthe damage formation and failures is comparatively recentand is still at an early stage in condition monitoring for rollingelements [4,5].
The AE is defined as the transient elastic waves generated bythe rapid release of strain energy from localized sources withinthe material due to the changes in the internal structure [6]. TheAE technique can detect crack initiation and growth, while thevibration accelerometer can only detect the appearance of spalling[7], or the crack growth at a later stage of the crack growth process[8]. Siores et al. [9] concluded that the AE results could becorrelated to various damage conditions. However, to date, mostresearchers have performed the trial tests with the ‘artificial’ or‘seeded’ damages in rolling elements. This damage or defect wasartificially introduced by scratching the surface, introducingdebris into the lubricant of machine with an electrical dischargeor spark erosion method etc. [10–14]. Williams et al. [15]published a report on lifetime test with the undamaged bearingthrough to failure; however defect determination was analyzed byconventional vibration metrics. Furthermore, Yoshioka et al.[16,17] introduced a method for damage diagnosis and measure-ment of fatigue crack propagation by time intervals of the AEgeneration and observing the effecting area of the loading zone byan AE location method for life tests of radial ball bearing.
ARTICLE IN PRESS
Z. Rahman et al. / Tribology International 42 (2009) 807–815808
The objectives of this study were to detect and locate the non-artificially induced (natural) damage of the rollers at its incipientstage, and also damage growth monitoring to understand itsevolvement and propagation behavior with the relationship of AEparameters. The study involved in the monitoring of sound rollingelements (new undamaged rolling elements with no simulated orseeded damage) running in contacts through its incipient damageevolvement by collecting the AE signals from their healthconditions. The roller with the incipient damage was furtherfatigue tested up to its final damaged stage as the spallingoutbreak.
2. Test procedures
2.1. Test rollers
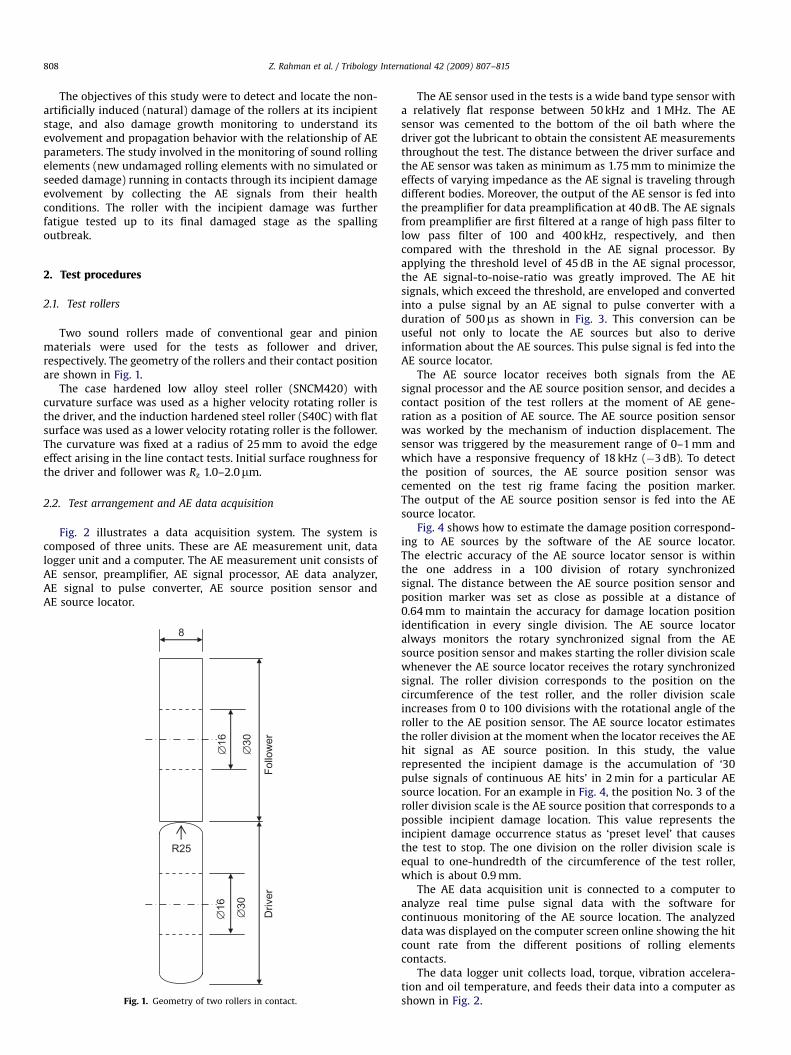
Two sound rollers made of conventional gear and pinionmaterials were used for the tests as follower and driver,respectively. The geometry of the rollers and their contact positionare shown in Fig. 1.
The case hardened low alloy steel roller (SNCM420) withcurvature surface was used as a higher velocity rotating roller isthe driver, and the induction hardened steel roller (S40C) with flatsurface was used as a lower velocity rotating roller is the follower.The curvature was fixed at a radius of 25 mm to avoid the edgeeffect arising in the line contact tests. Initial surface roughness forthe driver and follower was Rz 1.0–2.0mm.
2.2. Test arrangement and AE data acquisition
Fig. 2 illustrates a data acquisition system. The system iscomposed of three units. These are AE measurement unit, datalogger unit and a computer. The AE measurement unit consists ofAE sensor, preamplifier, AE signal processor, AE data analyzer,AE signal to pulse converter, AE source position sensor andAE source locator.
∅16
∅
16
8
R25
∅30
∅30
Follo
wer
D
river
Fig. 1. Geometry of two rollers in contact.
The AE sensor used in the tests is a wide band type sensor witha relatively flat response between 50 kHz and 1 MHz. The AEsensor was cemented to the bottom of the oil bath where thedriver got the lubricant to obtain the consistent AE measurementsthroughout the test. The distance between the driver surface andthe AE sensor was taken as minimum as 1.75 mm to minimize theeffects of varying impedance as the AE signal is traveling throughdifferent bodies. Moreover, the output of the AE sensor is fed intothe preamplifier for data preamplification at 40 dB. The AE signalsfrom preamplifier are first filtered at a range of high pass filter tolow pass filter of 100 and 400 kHz, respectively, and thencompared with the threshold in the AE signal processor. Byapplying the threshold level of 45 dB in the AE signal processor,the AE signal-to-noise-ratio was greatly improved. The AE hitsignals, which exceed the threshold, are enveloped and convertedinto a pulse signal by an AE signal to pulse converter with aduration of 500ms as shown in Fig. 3. This conversion can beuseful not only to locate the AE sources but also to deriveinformation about the AE sources. This pulse signal is fed into theAE source locator.
The AE source locator receives both signals from the AEsignal processor and the AE source position sensor, and decides acontact position of the test rollers at the moment of AE gene-ration as a position of AE source. The AE source position sensorwas worked by the mechanism of induction displacement. Thesensor was triggered by the measurement range of 0–1 mm andwhich have a responsive frequency of 18 kHz (�3 dB). To detectthe position of sources, the AE source position sensor wascemented on the test rig frame facing the position marker.The output of the AE source position sensor is fed into the AEsource locator.
Fig. 4 shows how to estimate the damage position correspond-ing to AE sources by the software of the AE source locator.The electric accuracy of the AE source locator sensor is withinthe one address in a 100 division of rotary synchronizedsignal. The distance between the AE source position sensor andposition marker was set as close as possible at a distance of0.64 mm to maintain the accuracy for damage location positionidentification in every single division. The AE source locatoralways monitors the rotary synchronized signal from the AEsource position sensor and makes starting the roller division scalewhenever the AE source locator receives the rotary synchronizedsignal. The roller division corresponds to the position on thecircumference of the test roller, and the roller division scaleincreases from 0 to 100 divisions with the rotational angle of theroller to the AE position sensor. The AE source locator estimatesthe roller division at the moment when the locator receives the AEhit signal as AE source position. In this study, the valuerepresented the incipient damage is the accumulation of ‘30pulse signals of continuous AE hits’ in 2 min for a particular AEsource location. For an example in Fig. 4, the position No. 3 of theroller division scale is the AE source position that corresponds to apossible incipient damage location. This value represents theincipient damage occurrence status as ‘preset level’ that causesthe test to stop. The one division on the roller division scale isequal to one-hundredth of the circumference of the test roller,which is about 0.9 mm.
The AE data acquisition unit is connected to a computer toanalyze real time pulse signal data with the software forcontinuous monitoring of the AE source location. The analyzeddata was displayed on the computer screen online showing the hitcount rate from the different positions of rolling elementscontacts.
The data logger unit collects load, torque, vibration accelera-tion and oil temperature, and feeds their data into a computer asshown in Fig. 2.

ARTICLE IN PRESS
AE signal to Pulse converter
(Envelope)
AE sensor
AE source position sensorTest
rollers
Pre-amp (40dB)
AE pulse signal
Position marker
Rotary synchronized signal
Signal to stop the test
Temperature
Data
logger
Torque
Load
Vibration acceleration
AE output signal
AE source locator
AEdata analyzer
AE signal processor
Computer
High pass filter: 100kHzLow pass filter: 400kHzThreshold: 45dB
Fig. 2. Data acquisition system.
Sig
nal v
olta
ge
1pulse
Threshold
Time
Envelopecurve
AE signal processorInput
1hit
AE signal to pulse converter
Output
Fig. 3. Definition of AE hit signal and pulse signal.
Estimated position of incipient damage
1
Rotary synchronized signal
Pulse signal due to AE hit
AE source position in roller
division scale 00199893211 cycle of AE source locator
AE source position in roller division scale
Pul
se s
igna
l cou
nts
Pre-set level: 30 hit counts/ 2 min (max)
0
(Accumulation for 2 min)
30
[1 revolution of test roller: 94mm]
0019989321
Fig. 4. The AE source locator data acquisition and estimation of damage position.
Z. Rahman et al. / Tribology International 42 (2009) 807–815 809

ARTICLE IN PRESS
Z. Rahman et al. / Tribology International 42 (2009) 807–815810
2.3. Rolling contact fatigue (RCF) tests
The test-rig for RCF tests was equipped with load sensor,torque sensor, vibration accelerometer, oil temperature monitor-ing sensor, revolutions counter, AE sensor and AE source positionsensor. The AE measurement conditions are shown in Table 1.
Fig. 5 shows the schematic diagram of the two-roller test-rig.The tests were carried out under a constant Hertzian stress of3.5 GPa by a spring loading system. The rollers were rotating atabout 800 and 730 rpm for driver and follower, respectively,which produced a slip ratio of 9% fixed by gears. An additive-freegear oil API: GL-5 was used for the tests. The minimum oil filmthickness hmin calculated from the Hamrock–Dowson equation[18] was less than 0.4mm at 50 1C. The tests were first conductedby sound rollers. All the tests were run until the two-roller test-rigstopped automatically due to the presence of an incipient damageon the roller. The AE source location was divided into 100divisions corresponding to the circumference of 94.25 mm for aprecise monitoring of the AE source location. Attempts were madeto detect and identify any damage in the roller by fatigue at itsearly stage as an incipient damage. The incipient damage istermed as micro-damage before any metal loss is evident in thelubricating system. In this study, the incipient damage wasconsidered as an early damage on roller before spalling. Tworelay circuits were designed to stop the rig when it reached themaximum cumulative revolution of 20 million cycles, or exceededa preset level of hit count per minutes to detect incipient damageappearance in the roller. After some initial trial run-in tests, 30 hitcounts/2 min received by the AE locator in a particular division on
Table 1AE measurement conditions.
High pass filter 100 kHz
Low pass filter 400 kHz
Threshold 45 dB
Preamplifier 40 dB
Sample rate 2 M-samples/s
Preset level (auto-stop level) for incipient damage 30 hit counts/2 min
AE sensor
Position sensor
Load
Oil out
Driver
Follower
Oil in
Fig. 5. Schematic diagram of two-roller test machine and arrangement of two
sensors.
the roller was determined as the preset level which correspondsto the incipient damage on the roller.
Further study was carried out after the occurrence of incipientdamage on the roller to investigate the damage propagationbehavior and its relationship with the AE parameters. Therefore,as the second step, the incipiently-damaged roller was set to thetest-rig again and further tested according to the RCF testprocedure except setting a preset level of the incipient damagedetection. For a certain cycles after running of the incipiently-damaged roller, the test was stopped and damage progress and/orseverity was observed with optical microscopy, and analyzed withtest run cycles after the incipient damage and the AE locator hitcount rate. A total of four after-tests were run further until thefinal stage of the fatigue damage i.e. spalling occurred on the samedivision on the roller where incipient damage was originallyoccurred. The four tests of the incipiently-damaged roller weretaken for 1700, 4200, 4700 and 16,400 number of cycles whichwere corresponding to the individual elapsed time of 2.1, 5.3, 5.9and 20.5 min, respectively.
3. Results and discussions
3.1. AE hit count rate
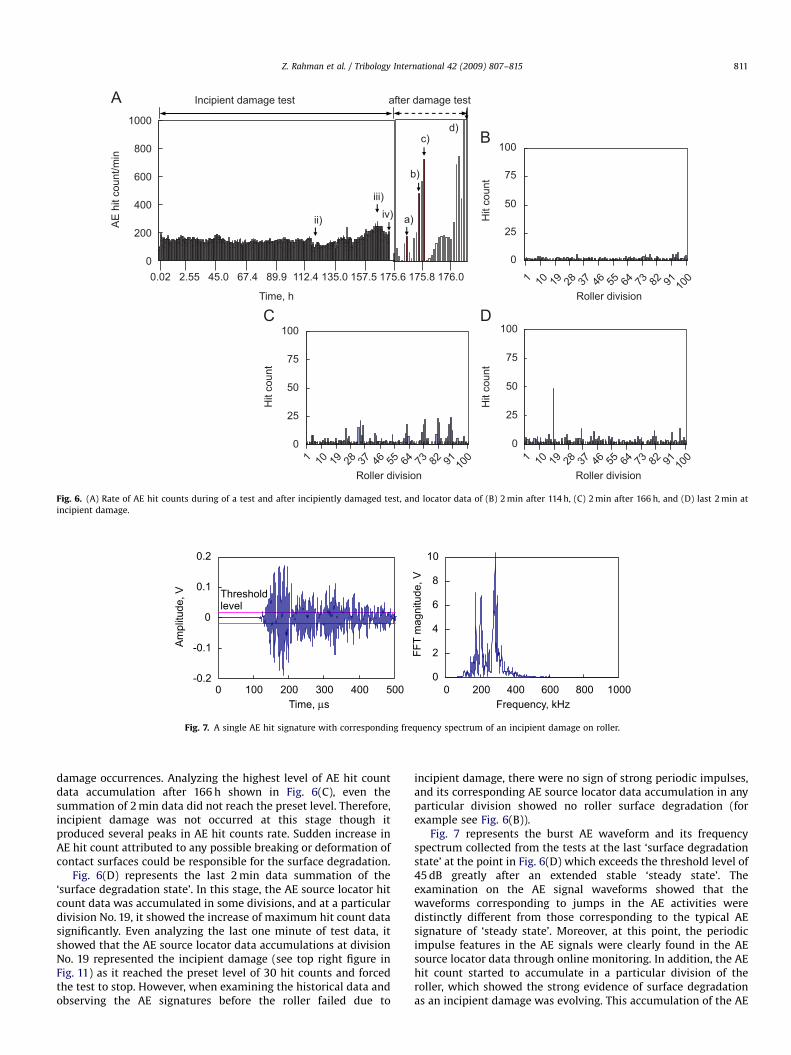
The typical AE features were employed to identify and classifyAE signatures. Fig. 6(A) displays the AE hit count rate (number ofAE hit signals per 1 min) with time during the RCF test andmultiple after tests of incipiently-damaged roller. In the begin-ning, plastic deformation and interference of the sharp edges ofthe initial surface roughness occurred by continued rolling contactwhich yields some higher AE hit count rate before the steady statecommences. The AE hit count rate showed a constant steady statestage for a period of 156 h (N ¼ 6.3�106 cycles) which was 88% ofthe total test hours. Following the steady state stage, AE hit countgradually increased until the incipient damage occurred. The stagecomprising with the increasing tendency of the AE hit count ratecould be termed as ‘surface degradation stage’. At the end of thisstage the AE hit count rate from a particular division of thefollower reached the preset level of incipient damage status, andthe test was ended at 175 h 37 min (Nf ¼ 7.1�106 cycles). Thesteady state persistency varied to some extent for other testsbecause of the surface properties of the rollers. However, it did notaffect the detection process of the incipient damage occurrence.
3.2. AE signal and AE source location
The AE signatures and their corresponding frequency spectrawere recorded throughout the tests. The typical AE signatureamplitude levels varied from 45 dB (0.017 V) to 78 dB (0.80 V)throughout the tests. In Fig. 6(A), there was a decrease in AE hitcounts per minute at approximately 115 h and again at 150 h. Thissubsequent drop might be attributed to healing [19] which maybe resulted from smoothing of the sharp edges of the surfaceroughness due to wear by continued rolling contact. Moreover,Fig. 6(B) shows that the hit count rate in the AE source locator didnot accumulate greatly at any particular division of the roller andthus did not reach the preset level (30 hit counts) after 2 min datasummation after 114 h. The frequent AE hit counts came from allthe divisions of the rollers in contact, which represented thefrictional hit count in the ‘steady state’. Some AE hit counts mightbe caused by entrapped wear particles in the contact interface.Figs. 6(C) and (D) are considered from the ‘surface degradationstate’ to estimate the correlation between the AE hit counts ratewith the AE locator data accumulation to identify the incipient
ARTICLE IN PRESS
0
25
50
75
100
Hit
coun
t
0
200
400
600
800
1000
0.02
Time, h
AE
hit
coun
t/min
175.6
a)
b)
c)d)
Incipient damage test after damage test
ii)
iii)
iv)
0
25
50
75
100
Hit
coun
t0
25
50
75
100
1
Roller division
Hit
coun
t
176.0175.82.55 45.0 67.4 89.9 112.4 135.0 157.5 10 19 28 37 46 55 64 73 82 91 100
1
Roller division10 19 28 37 46 55 64 73 82 91 10
01
Roller division10 19 28 37 46 55 64 73 82 91 10
0
Fig. 6. (A) Rate of AE hit counts during of a test and after incipiently damaged test, and locator data of (B) 2 min after 114 h, (C) 2 min after 166 h, and (D) last 2 min at
incipient damage.
0
2
4
6
8
10
0Frequency, kHz
FFT
mag
nitu
de, V
-0.2
-0.1
0
0.1
0.2
0
Am
plitu
de, V Threshold
level
Time, μs100 200 300 400 500 200 400 600 800 1000
Fig. 7. A single AE hit signature with corresponding frequency spectrum of an incipient damage on roller.
Z. Rahman et al. / Tribology International 42 (2009) 807–815 811
damage occurrences. Analyzing the highest level of AE hit countdata accumulation after 166 h shown in Fig. 6(C), even thesummation of 2 min data did not reach the preset level. Therefore,incipient damage was not occurred at this stage though itproduced several peaks in AE hit counts rate. Sudden increase inAE hit count attributed to any possible breaking or deformation ofcontact surfaces could be responsible for the surface degradation.
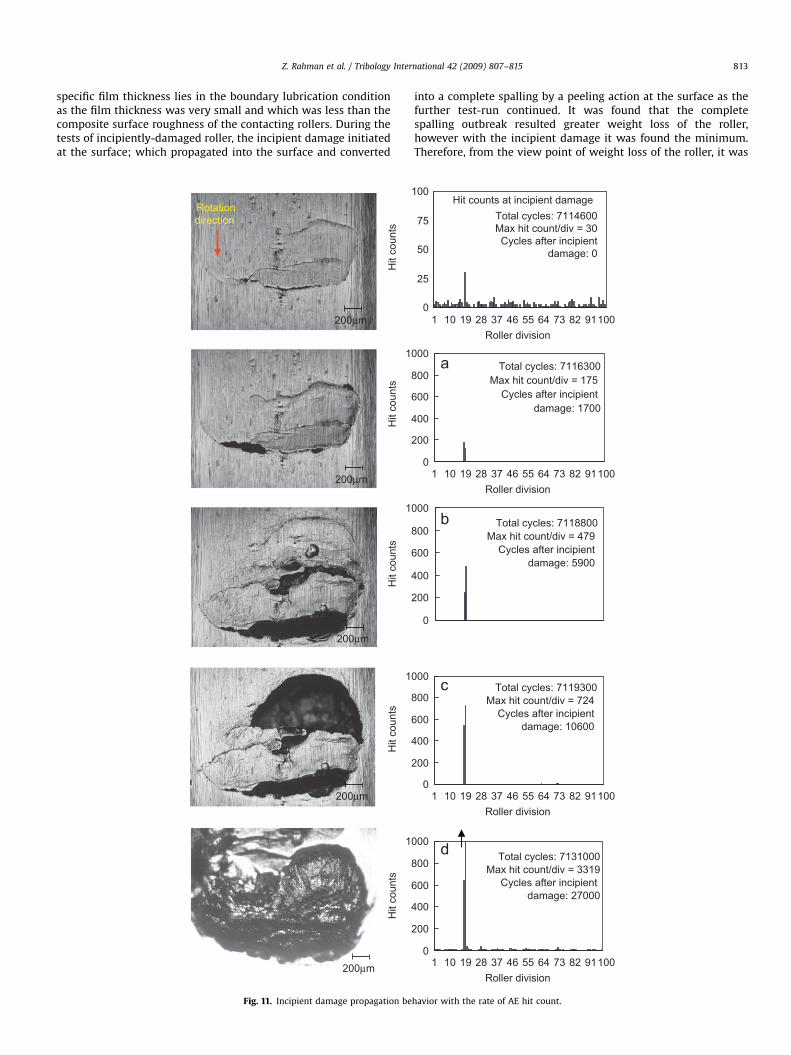
Fig. 6(D) represents the last 2 min data summation of the‘surface degradation state’. In this stage, the AE source locator hitcount data was accumulated in some divisions, and at a particulardivision No. 19, it showed the increase of maximum hit count datasignificantly. Even analyzing the last one minute of test data, itshowed that the AE source locator data accumulations at divisionNo. 19 represented the incipient damage (see top right figure inFig. 11) as it reached the preset level of 30 hit counts and forcedthe test to stop. However, when examining the historical data andobserving the AE signatures before the roller failed due to
incipient damage, there were no sign of strong periodic impulses,and its corresponding AE source locator data accumulation in anyparticular division showed no roller surface degradation (forexample see Fig. 6(B)).
Fig. 7 represents the burst AE waveform and its frequencyspectrum collected from the tests at the last ‘surface degradationstate’ at the point in Fig. 6(D) which exceeds the threshold level of45 dB greatly after an extended stable ‘steady state’. Theexamination on the AE signal waveforms showed that thewaveforms corresponding to jumps in the AE activities weredistinctly different from those corresponding to the typical AEsignature of ‘steady state’. Moreover, at this point, the periodicimpulse features in the AE signals were clearly found in the AEsource locator data through online monitoring. In addition, the AEhit count started to accumulate in a particular division of theroller, which showed the strong evidence of surface degradationas an incipient damage was evolving. This accumulation of the AE
ARTICLE IN PRESS
Z. Rahman et al. / Tribology International 42 (2009) 807–815812
locator data in a particular point was significantly different fromthe other states. The signal exhibited strong impulse periodicitybecause of the crack propagation around the incipient damage atcontact between test rollers and the impacts generated betweenthe driver and the incipient damage in the follower. Only a singleincipient damage occurred on the S40C induction hardeningmaterials of the lower velocity rotating roller (follower) specimenfor all tests. The presence of ‘incipient damage’ (see top left offigure in Fig. 11) on the roller surface was evidently found fromvisual examination at division No. 19, which reached the presetlevel after 1 min of the AE source locator data accumulation.Moreover, though the position of the AE sensor was submergedinto the lubricating oil and the AE signals travels through differentbodies of varying impedance and wave velocities, the system candetect the incipient damage with the higher accuracy of itsposition. The summarized data output of the system confirmedthe point of damage position accurately in the roller as theimpedances of AE traveling different bodies did not contrast withthe incipient damage identification results [20]. The cross-sectional view of the crack propagation behavior of the incipientdamage was also examined, and confirmed the existence of thesub-surface incipient damage but no occurrence of completespalling on the roller.
-10
-8
-6
-4
-2
0
inicipientdamage
After incipient damage, cumulative cycles
Rel
ativ
e w
eigh
t los
s, m
g
1700 5900 10600 27000
Fig. 8. Weight loss behavior of further multiple tests of incipiently-damaged roller.
0
200
400
600
800
1000
1200
After incipient damage, cumulative cycles (×100)
AE
rise
time,
μs
Before incipient damage, 7 min2.1 min5.3 min5.9 min20.5 min
0 17 59 106 270
Fig. 9. Relationship between AE risetime and AE duration
From the above discussion, it was found that the new AEmeasurement unit, which was effectively a combination ofsimultaneous use of the AE data analyzer and the AE sourcelocator, could be a better condition monitoring tool for detectingand locating the incipient damage in rolling elements in contacts.
3.3. Incipient damage propagation and severity of damage
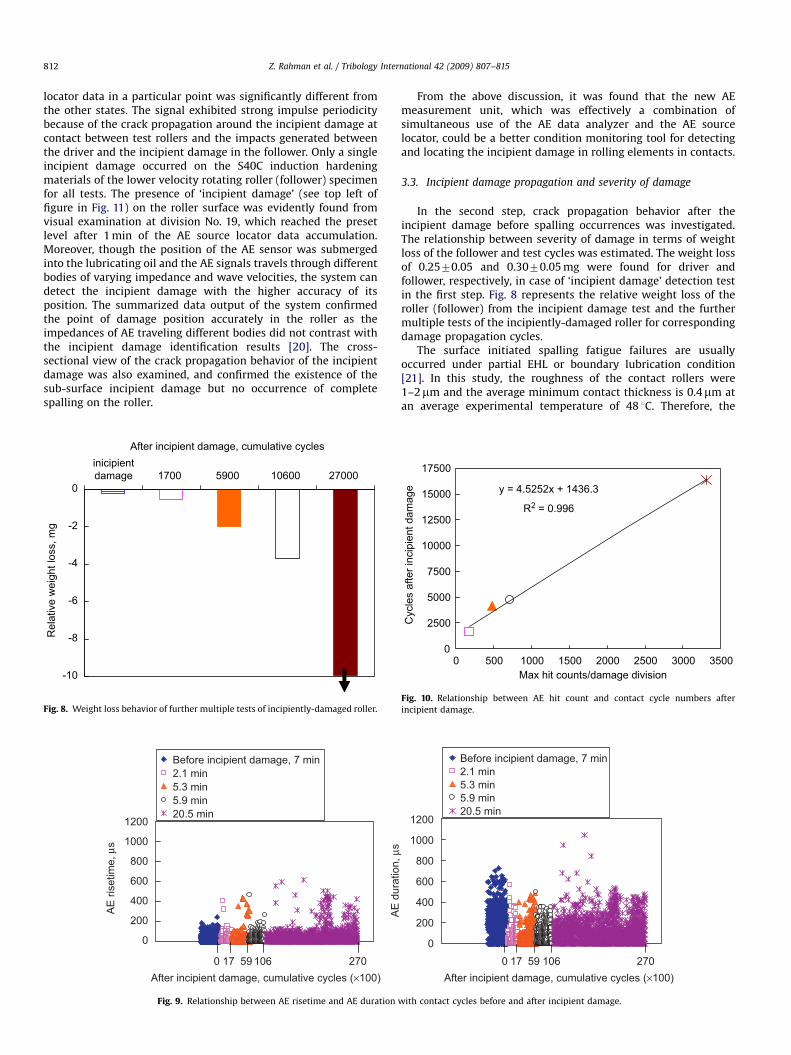
In the second step, crack propagation behavior after theincipient damage before spalling occurrences was investigated.The relationship between severity of damage in terms of weightloss of the follower and test cycles was estimated. The weight lossof 0.2570.05 and 0.3070.05 mg were found for driver andfollower, respectively, in case of ‘incipient damage’ detection testin the first step. Fig. 8 represents the relative weight loss of theroller (follower) from the incipient damage test and the furthermultiple tests of the incipiently-damaged roller for correspondingdamage propagation cycles.
The surface initiated spalling fatigue failures are usuallyoccurred under partial EHL or boundary lubrication condition[21]. In this study, the roughness of the contact rollers were1–2mm and the average minimum contact thickness is 0.4mm atan average experimental temperature of 48 1C. Therefore, the
0
200
400
600
800
1000
1200
After incipient damage, cumulative cycles (×100)
AE
dur
atio
n, μ
s
Before incipient damage, 7 min2.1 min5.3 min5.9 min20.5 min
0 17 59 106 270
with contact cycles before and after incipient damage.
y = 4.5252x + 1436.3
0
2500
5000
7500
10000
12500
15000
17500
0Max hit counts/damage division
Cyc
les
afte
r inc
ipie
nt d
amag
e
500 1000 1500 2000 2500 3000 3500
R2 = 0.996
Fig. 10. Relationship between AE hit count and contact cycle numbers after
incipient damage.
ARTICLE IN PRESS
Z. Rahman et al. / Tribology International 42 (2009) 807–815 813
specific film thickness lies in the boundary lubrication conditionas the film thickness was very small and which was less than thecomposite surface roughness of the contacting rollers. During thetests of incipiently-damaged roller, the incipient damage initiatedat the surface; which propagated into the surface and converted
1
Hit
coun
ts
Rotationdirection
200μm
200μm
200μm
200μm
Hit
coun
ts
1
Hit
coun
ts
1
Hit
coun
ts
1
Hit
coun
ts
200μm
Fig. 11. Incipient damage propagation be
into a complete spalling by a peeling action at the surface as thefurther test-run continued. It was found that the completespalling outbreak resulted greater weight loss of the roller,however with the incipient damage it was found the minimum.Therefore, from the view point of weight loss of the roller, it was
0
200
400
600
800
000
0
25
50
75
100
1Roller division
0
200
400
600
800
000
0
200
400
600
800
000
0
200
400
600
800
000
Hit counts at incipient damage
Cycles after incipient damage: 1700
Cycles after incipient damage: 5900
Cycles after incipient damage: 10600
Total cycles: 7116300
Total cycles: 7114600
Total cycles: 7118800
Total cycles: 7119300
Max hit count/div = 175
Max hit count/div = 479
Max hit count/div = 724
Max hit count/div = 30
Cycles after incipient damage: 27000
Total cycles: 7131000Max hit count/div = 3319
Cycles after incipient damage: 0
10 19 28 37 46 55 64 73 82 91100
1Roller division
10 19 28 37 46 55 64 73 82 91100
1Roller division
10 19 28 37 46 55 64 73 82 91100
1Roller division
10 19 28 37 46 55 64 73 82 91100
havior with the rate of AE hit count.
ARTICLE IN PRESS
0
20
40
60
80
100
inicipientdamage
1700
After incipient damage, cumulative cycles
Rat
io o
f spa
lling
are
a, %
5900 10600 27000
Fig. 12. Relationship between ratio of spalling area and contact cycles before and
after incipient damage.
Z. Rahman et al. / Tribology International 42 (2009) 807–815814
estimated that this system could detect the incipient damageacceptably, and as the tests of incipiently-damaged rollerprogressed, the weight loss of the roller increased.
3.4. Incipient damage propagation behavior with AE duration
From the multiple after tests of incipiently-damaged roller,damage propagation with the degree of damage was characterizedby the differences in AE risetime and AE durations. Fig. 9 showsthe influence of the incipiently-damaged state propagation andthe damage size increasing on the AE risetime and the AEduration. The change in AE risetime was profound than that of theAE duration as amplitudes took a comparably longer time to reachits crest as the tests continued. However, the damage propagationincluding crack propagation around the damage after the incipientdamage was evidently different from each other because of thevariation in dynamic response and impact between damage areaof the follower and the contact surface of the driver. This implied amore clear evidence of the degree of damage by the AE risetimedata characteristics. Therefore, stable and unstable damagepropagation mechanisms were believed to be responsible for thedifferences in AE risetime and AE duration with each other testresults. A higher value of AE risetime and AE duration at the finaltest of the incipiently-damaged roller showed the spallingoccurrence as the severity of damage generated from thepropagating incipient damage. The higher intensity of AE para-meters (i.e. AE risetime, AE duration, AE hit count etc.) wasinstigated from the heavily damaged division on roller as a severespalling where the incipient damage existed before.
3.5. Incipient damage propagation behavior with AE hit count rate
The maximum AE hit counts at a particular damaged divisionduring the tests of incipiently-damaged roller are plotted in Fig. 10against the elapsed cycles after the incipient damage up to thesevere spalling occurrence at the division No. 19 on the rollersurface. A line of the best fit was obtained, as well as theconfidence (R2
¼ 0.996), of the line fit to the data. A linearrelationship between AE hit count and contact cycles numberafter incipient damage was identified. This relationship illustratedthe effectiveness of the AE source locator use in this test fordamage identification and its propagation monitoring in rollingelements in contact.
Moreover, Fig. 11 shows the micrographs of the rolling contactsurface of the incipient damage, and incipient damaged propaga-tion behavior with its corresponding AE hit count rate for definednumber of cycles. For all the tests of the incipiently-damagedroller, the AE hit count was mostly developed at the division No.19 of the roller where incipient damage was occurred during theRCF test. Therefore, the accumulation number of the AE hit countdepended on the degree of damage i.e. damage size. It was alsofound that the AE hit count data accumulation developed in twodivisions (Nos. 18 and 19), which represented to the larger damageon the roller surface and provided information of spallingoutbreak. The tests relationships between the AE hit count rateand the incipient damage propagation rate suggested thepossibility of predicting the remaining fatigue life of a rollingelement, based on short term AE monitoring of rolling contact.
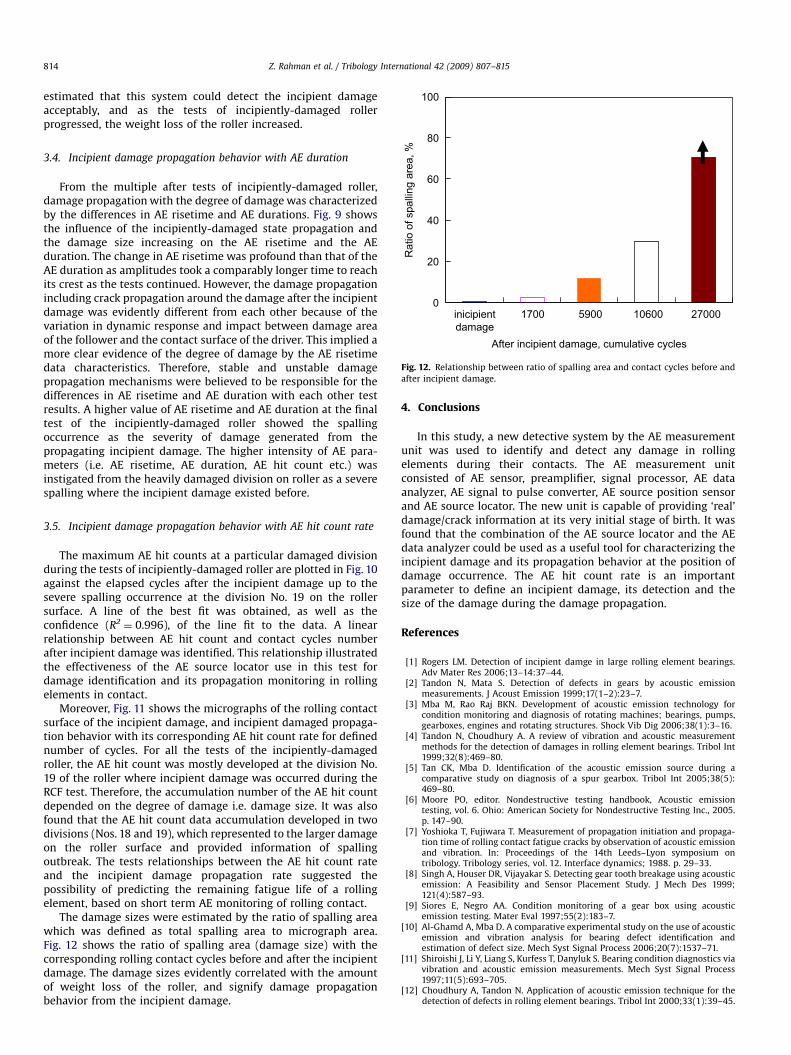
The damage sizes were estimated by the ratio of spalling areawhich was defined as total spalling area to micrograph area.Fig. 12 shows the ratio of spalling area (damage size) with thecorresponding rolling contact cycles before and after the incipientdamage. The damage sizes evidently correlated with the amountof weight loss of the roller, and signify damage propagationbehavior from the incipient damage.
4. Conclusions
In this study, a new detective system by the AE measurementunit was used to identify and detect any damage in rollingelements during their contacts. The AE measurement unitconsisted of AE sensor, preamplifier, signal processor, AE dataanalyzer, AE signal to pulse converter, AE source position sensorand AE source locator. The new unit is capable of providing ‘real’damage/crack information at its very initial stage of birth. It wasfound that the combination of the AE source locator and the AEdata analyzer could be used as a useful tool for characterizing theincipient damage and its propagation behavior at the position ofdamage occurrence. The AE hit count rate is an importantparameter to define an incipient damage, its detection and thesize of the damage during the damage propagation.
References
[1] Rogers LM. Detection of incipient damge in large rolling element bearings.Adv Mater Res 2006;13–14:37–44.
[2] Tandon N, Mata S. Detection of defects in gears by acoustic emissionmeasurements. J Acoust Emission 1999;17(1–2):23–7.
[3] Mba M, Rao Raj BKN. Development of acoustic emission technology forcondition monitoring and diagnosis of rotating machines; bearings, pumps,gearboxes, engines and rotating structures. Shock Vib Dig 2006;38(1):3–16.
[4] Tandon N, Choudhury A. A review of vibration and acoustic measurementmethods for the detection of damages in rolling element bearings. Tribol Int1999;32(8):469–80.
[5] Tan CK, Mba D. Identification of the acoustic emission source during acomparative study on diagnosis of a spur gearbox. Tribol Int 2005;38(5):469–80.
[6] Moore PO, editor. Nondestructive testing handbook, Acoustic emissiontesting, vol. 6. Ohio: American Society for Nondestructive Testing Inc., 2005.p. 147–90.
[7] Yoshioka T, Fujiwara T. Measurement of propagation initiation and propaga-tion time of rolling contact fatigue cracks by observation of acoustic emissionand vibration. In: Proceedings of the 14th Leeds–Lyon symposium ontribology. Tribology series, vol. 12. Interface dynamics; 1988. p. 29–33.
[8] Singh A, Houser DR, Vijayakar S. Detecting gear tooth breakage using acousticemission: A Feasibility and Sensor Placement Study. J Mech Des 1999;121(4):587–93.
[9] Siores E, Negro AA. Condition monitoring of a gear box using acousticemission testing. Mater Eval 1997;55(2):183–7.
[10] Al-Ghamd A, Mba D. A comparative experimental study on the use of acousticemission and vibration analysis for bearing defect identification andestimation of defect size. Mech Syst Signal Process 2006;20(7):1537–71.
[11] Shiroishi J, Li Y, Liang S, Kurfess T, Danyluk S. Bearing condition diagnostics viavibration and acoustic emission measurements. Mech Syst Signal Process1997;11(5):693–705.
[12] Choudhury A, Tandon N. Application of acoustic emission technique for thedetection of defects in rolling element bearings. Tribol Int 2000;33(1):39–45.

ARTICLE IN PRESS
Z. Rahman et al. / Tribology International 42 (2009) 807–815 815
[13] Miettinen J, Andersson P. Acoustic emission of rolling bearings lubricatedwith contaminated grease. Tribol Int 2000;33(11):777–87.
[14] Toutountzakis T, Tan CK, Mba D. Application of acoustic emission to seededgear fault detection. NDT E Int 2005;38(1):27–36.
[15] Williams T, Ribadeneira X, Billington S, Kurfess T. Rolling element bearingdiagnostics in run-to-failure lifetime testing. Mech Syst Signal Process 2001;15(5):979–93.
[16] Yoshioka T, Korenaga A, Mano H, Yamamoto T. Diagnosis of rolling bearing bymeasuring time interval of AE generation. Trans ASME 1999;121(3):468–72.
[17] Mano H, Yoshioka T, Korenaga A, Yamamoto T. Prediction of rolling contactfatigue failure in radial rolling bearing by observing effective area on
propagation of fatigue crack within loading zone. In: Proceedings of theinternational tribology conference. Nagasaki, Japan: The Society of Tribolo-gists and Lubrication Engineers; 2000. Session 2F3-2. p. 1761–66.
[18] Hamrock BJ, Dowson D. Ball bearing lubrication. New York: Wiley; 1981.[19] Jiaa CL, Dornfeld DA. Experimental studies of sliding friction and wear via
acoustic emission signal analysis. Wear 1990;139(2):403–24.[20] Rahman MZ, Ohba H, Yamamoto T, Yoshioka T. A Study on incipient damage
monitoring in rolling contact fatigue process using acoustic emission. TribolTrans 2008;51(5):543–51.
[21] Averbach BL, Bamberger EN. Surface-initiated spalling fatigue in M-50 andM-50 nil bearings. Tribol Trans 1991;47(10):837–43.