Incidence of Total Cognizable Crime (IPC)...
53
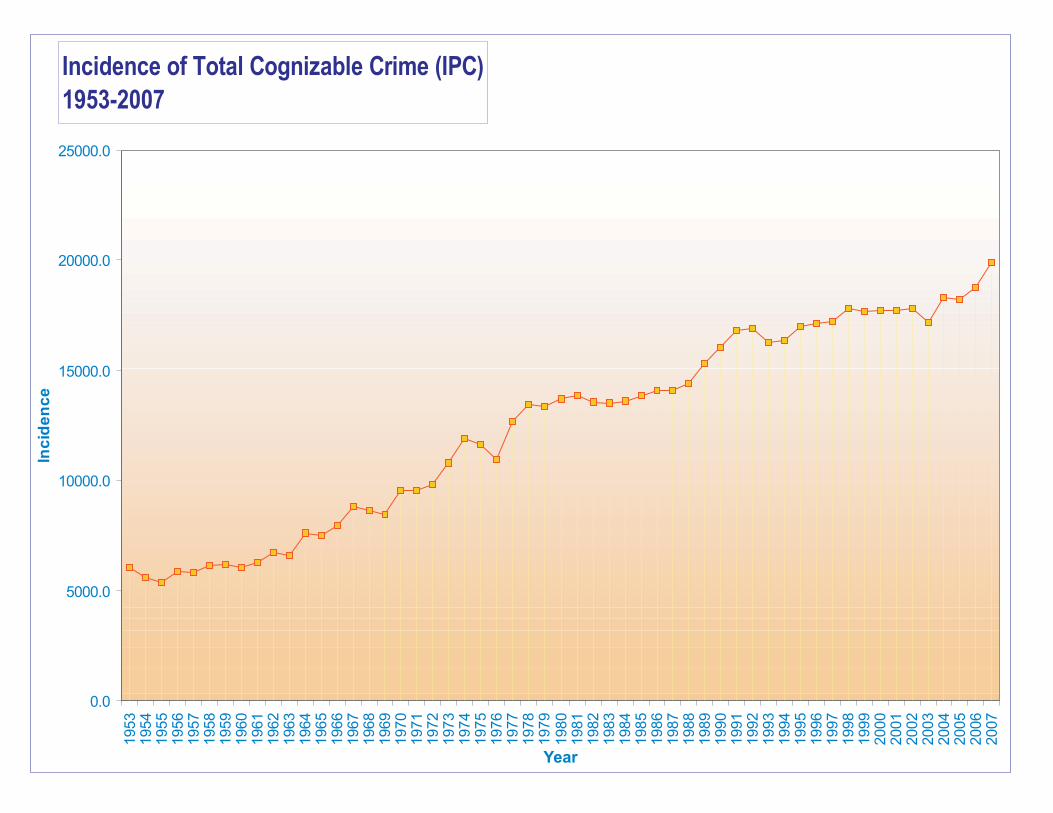
Incidence of Total Cognizable Crime (IPC) 1953-2007 0.0 5000.0 10000.0 15000.0 20000.0 25000.0 1953 1954 1955 1956 1957 1958 1959 1960 1961 1962 1963 1964 1965 1966 1967 1968 1969 1970 1971 1972 1973 1974 1975 1976 1977 1978 1979 1980 1981 1982 1983 1984 1985 1986 1987 1988 1989 1990 1991 1992 1993 1994 1995 1996 1997 1998 1999 2000 2001 2002 2003 2004 2005 2006 2007 Year Incidence
Transcript of Incidence of Total Cognizable Crime (IPC)...
Incidence of Total Cognizable Crime (IPC)
1953-2007
0.0
5000.0
10000.0
15000.0
20000.0
25000.0
1953
1954
1955
1956
1957
1958
1959
1960
1961
1962
1963
1964
1965
1966
1967
1968
1969
1970
1971
1972
1973
1974
1975
1976
1977
1978
1979
1980
1981
1982
1983
1984
1985
1986
1987
1988
1989
1990
1991
1992
1993
1994
1995
1996
1997
1998
1999
2000
2001
2002
2003
2004
2005
2006
2007
Year
Inc
ide
nc
e
0
50000
100000
150000
200000
250000
300000
350000
400000
450000
500000
Inc
ide
nc
e
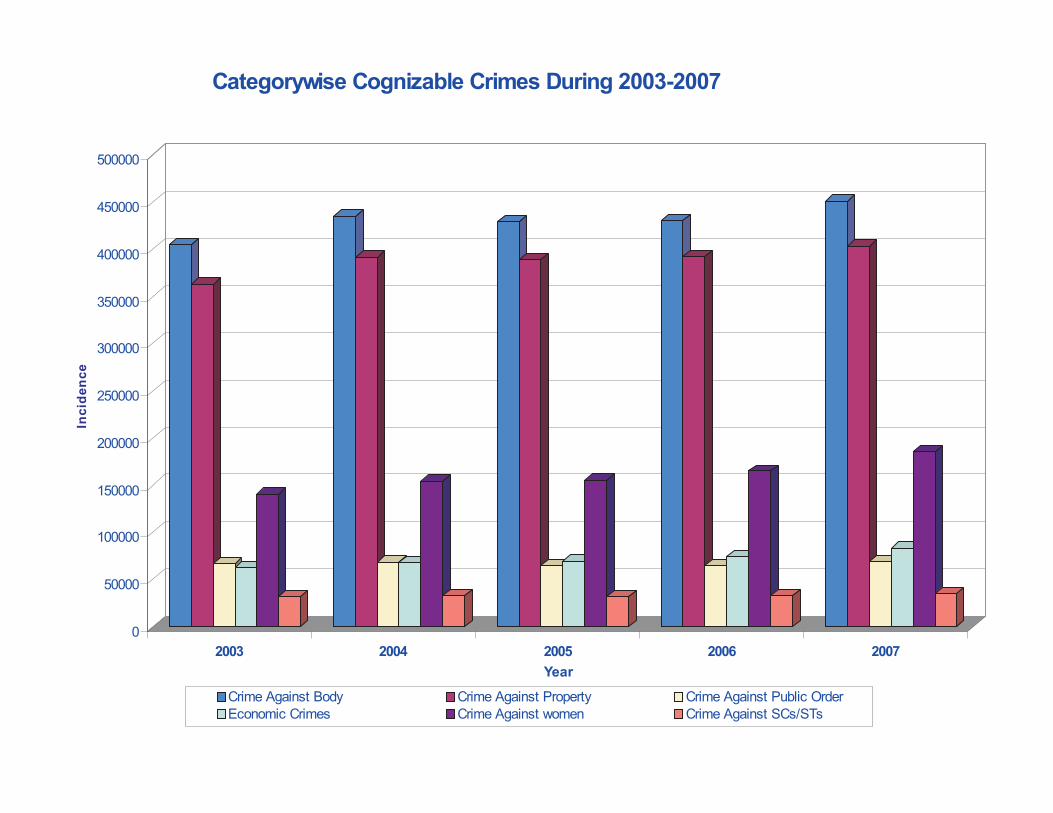
2003 2004 2005 2006 2007
Year
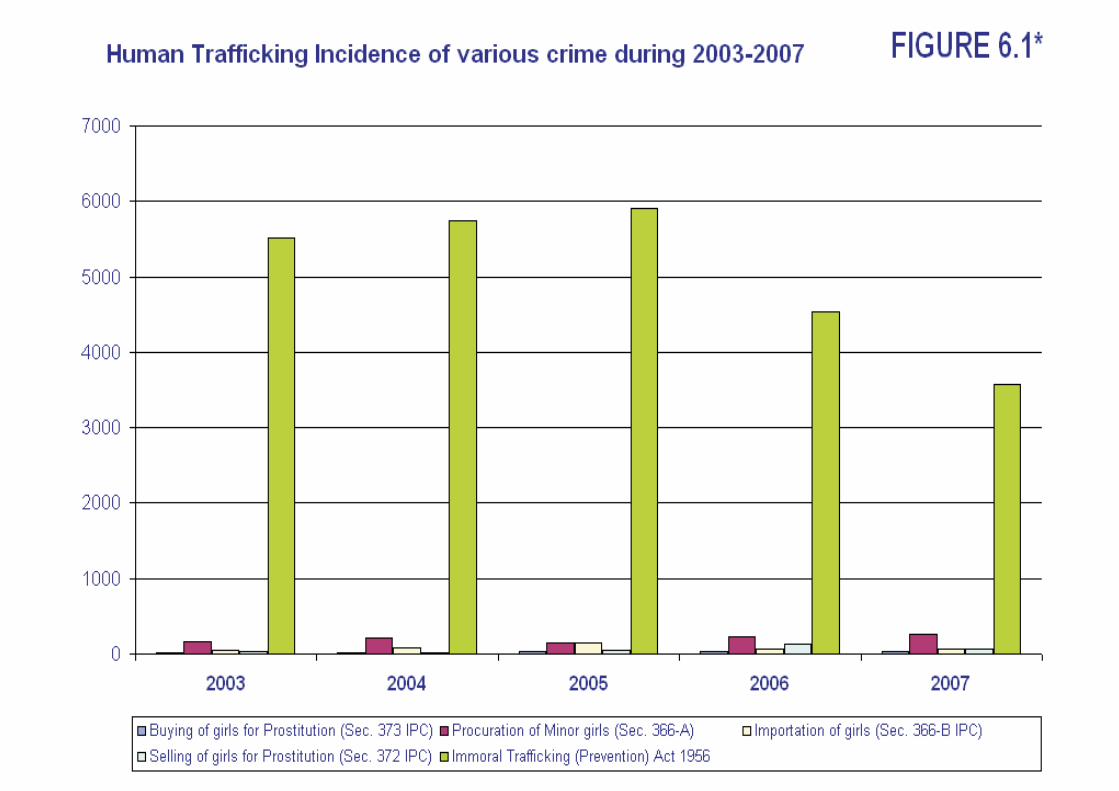
Categorywise Cognizable Crimes During 2003-2007
Crime Against Body Crime Against Property Crime Against Public Order
Economic Crimes Crime Against women Crime Against SCs/STs
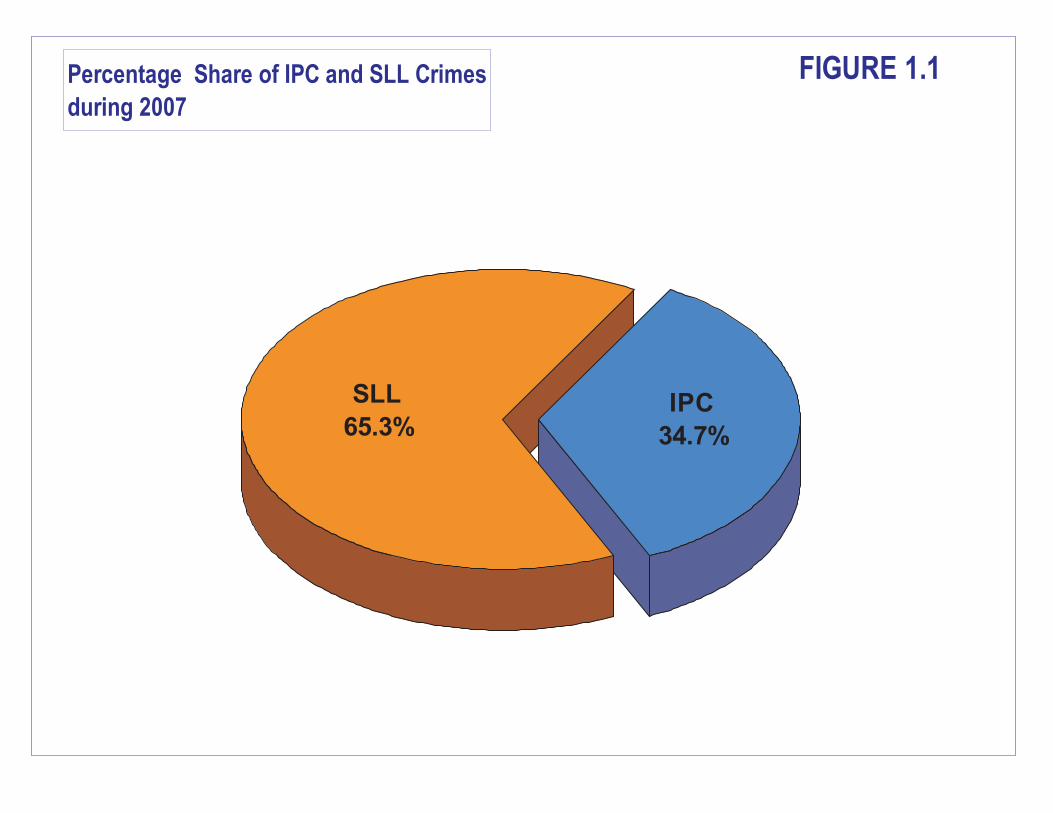
Percentage Share of IPC and SLL Crimes
during 2007
IPC
34.7%
SLL
65.3%
FIGURE 1.1
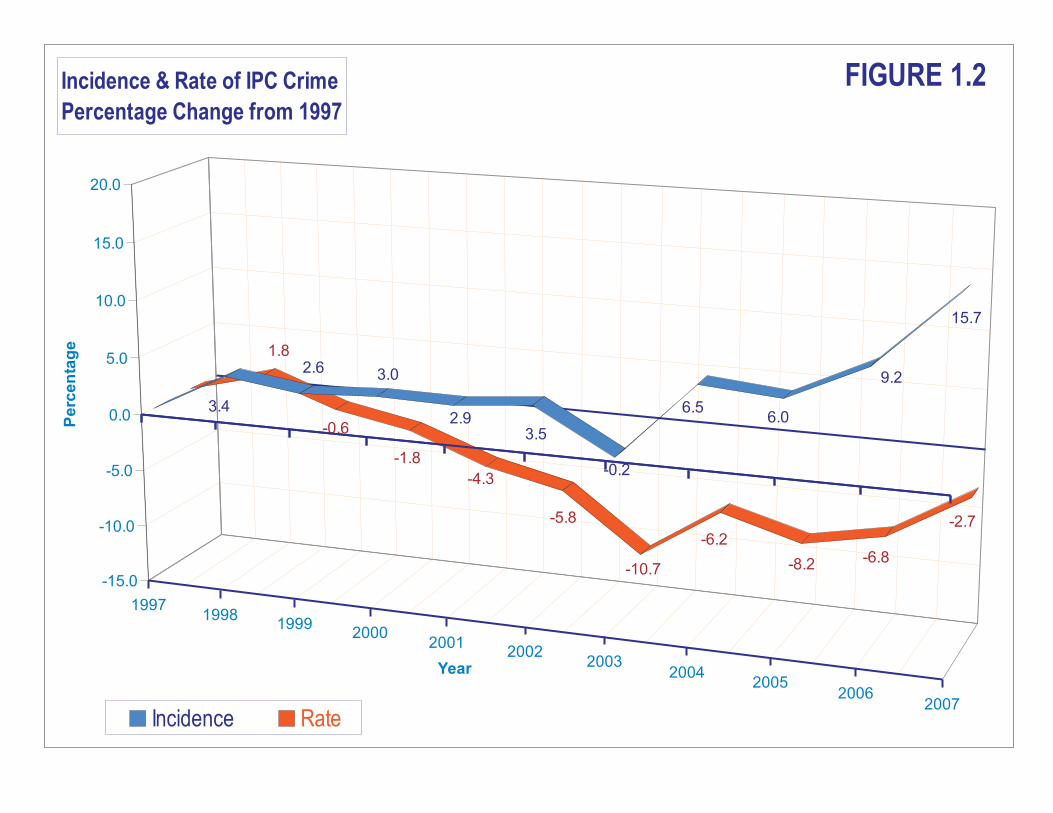
19971998
19992000
20012002
20032004
20052006
2007
1.8
-0.6
-1.8
-4.3
-5.8
-10.7
-6.2
-8.2 -6.8
-2.7
3.4
2.6 3.0
2.93.5
-0.2
6.56.0
9.2
15.7
-15.0
-10.0
-5.0
0.0
5.0
10.0
15.0
20.0
Pe
rce
nta
ge
Year
Incidence & Rate of IPC Crime
Percentage Change from 1997
Incidence Rate
FIGURE 1.2
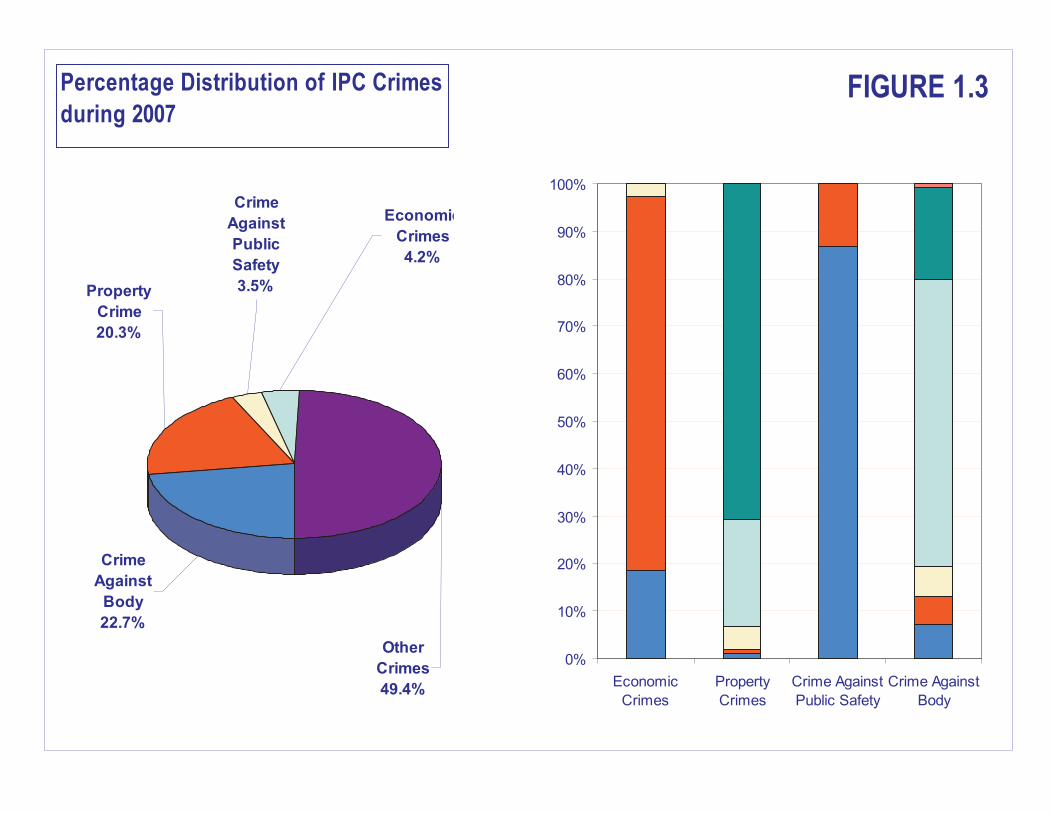
Crime
Against
Body
22.7%
Property
Crime
20.3%
Other
Crimes
49.4%
Crime
Against
Public
Safety
3.5%
Economic
Crimes
4.2%
0%
10%
20%
30%
40%
50%
60%
70%
80%
90%
100%
Economic
Crimes
Property
Crimes
Crime Against
Public Safety
Crime Against
Body
Percentage Distribution of IPC Crimes
during 2007FIGURE 1.3
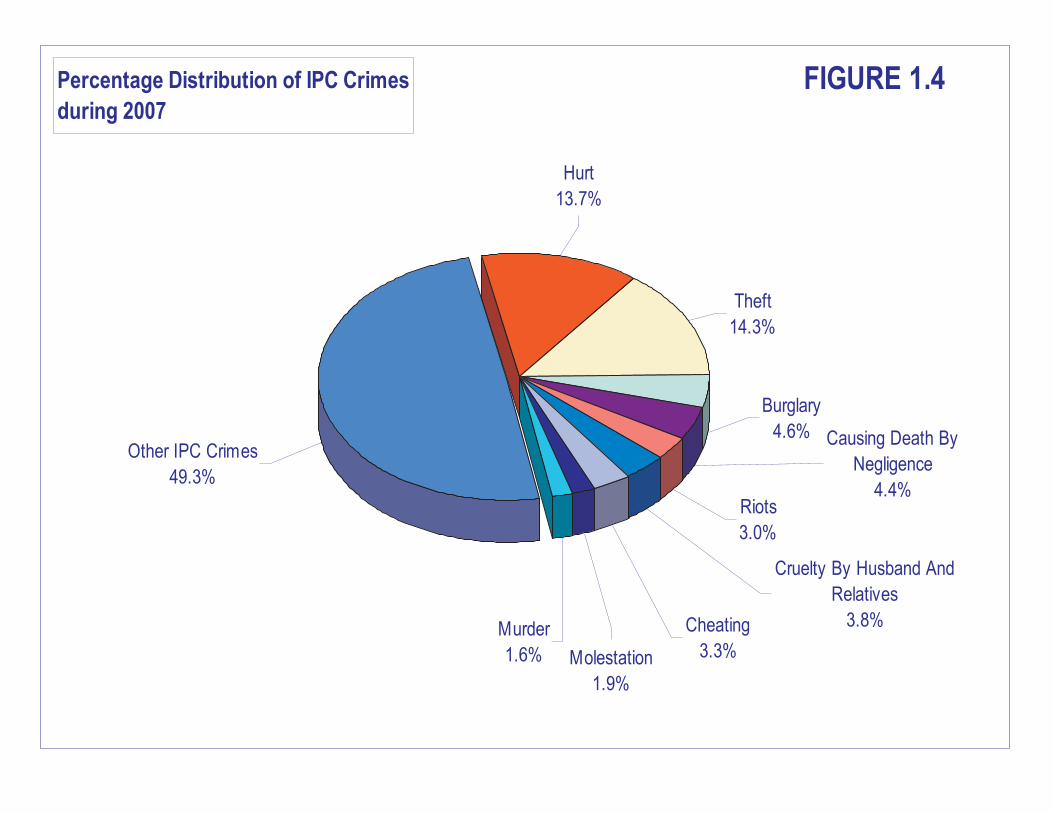
Percentage Distribution of IPC Crimes
during 2007
Other IPC Crimes
49.3%
Hurt
13.7%
Theft
14.3%
Burglary
4.6% Causing Death By
Negligence
4.4%Riots
3.0%
Cheating
3.3%Molestation
1.9%
Murder
1.6%
Cruelty By Husband And
Relatives
3.8%
FIGURE 1.4
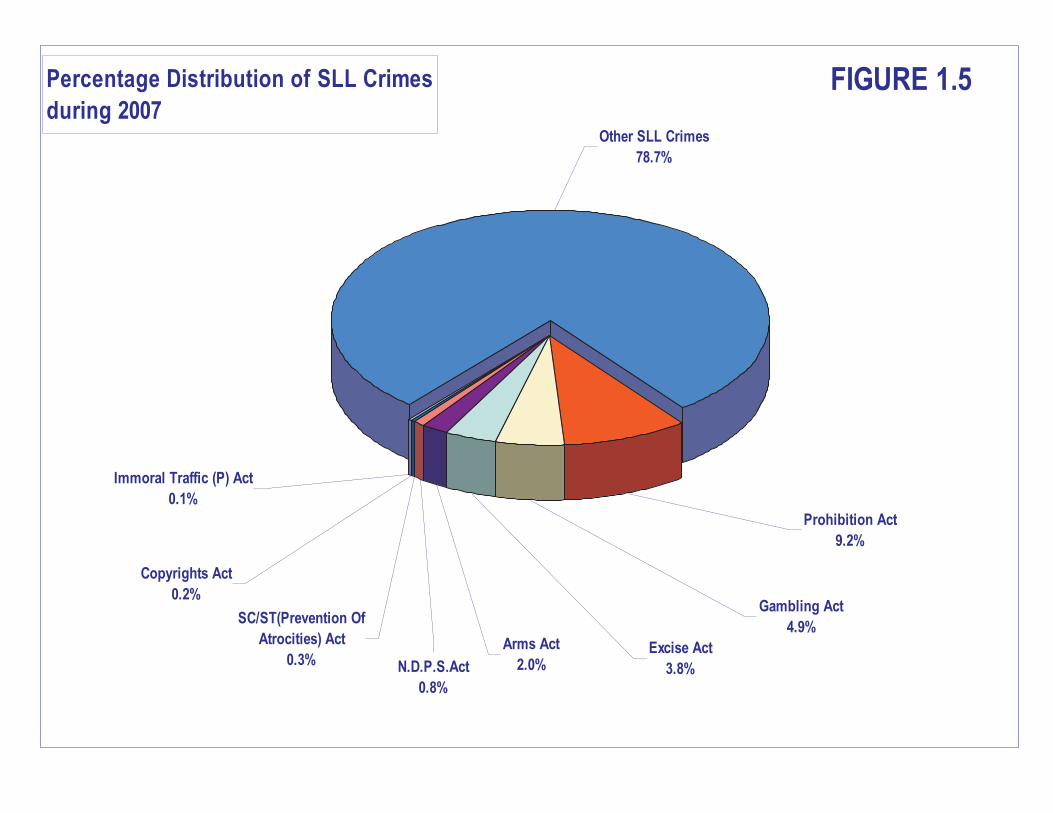
Percentage Distribution of SLL Crimes
during 2007Other SLL Crimes
78.7%
SC/ST(Prevention Of
Atrocities) Act
0.3%
Copyrights Act
0.2%
Arms Act
2.0%
Gambling Act
4.9%
Prohibition Act
9.2%
N.D.P.S.Act
0.8%
Excise Act
3.8%
Immoral Traffic (P) Act
0.1%
FIGURE 1.5
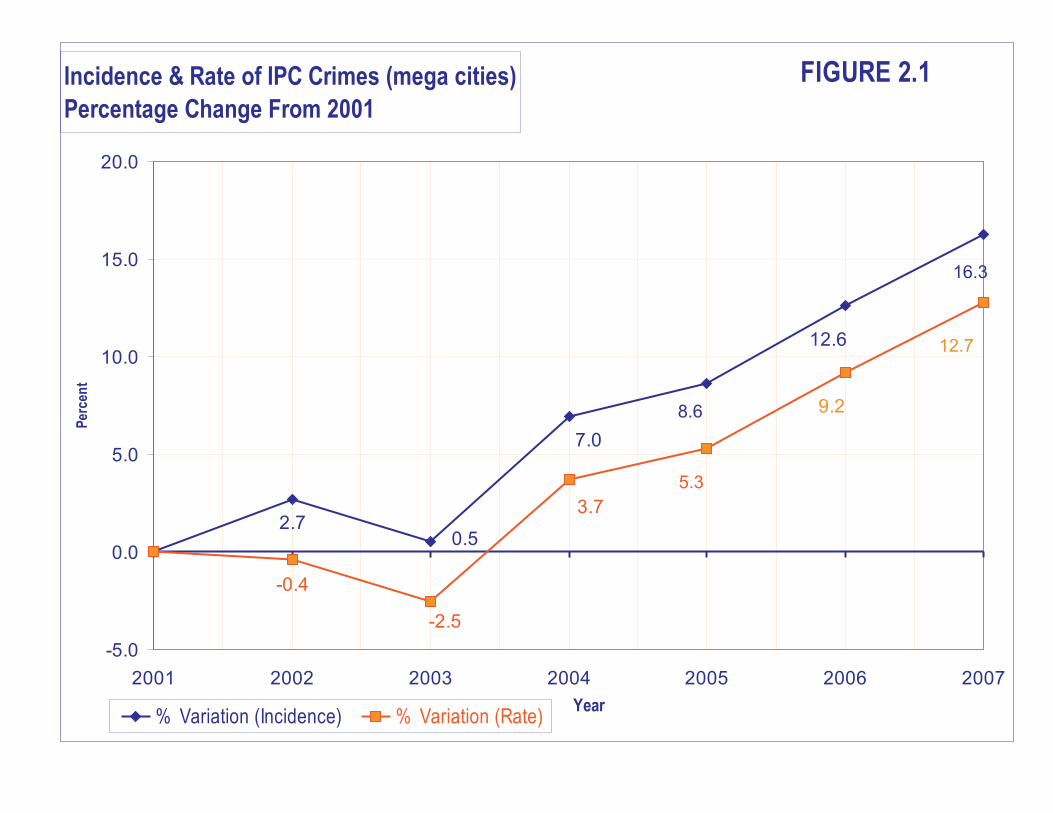
Incidence & Rate of IPC Crimes (mega cities)
Percentage Change From 2001
2.7
-0.4
7.0
0.5
8.6
12.6
16.3
12.7
9.2
5.3
3.7
-2.5
-5.0
0.0
5.0
10.0
15.0
20.0
2001 2002 2003 2004 2005 2006 2007
Year
Per
cen
t
% Variation (Incidence) % Variation (Rate)
FIGURE 2.1

IPC Crime (mega cities)
Percentage distribution during 2007
9.1
10.5
9.7
8.6
16.8
15.7
19.8
8.8
24.7
22.5
21.2
30.6
42.0
24.4
8.0
23.2
25.9
23.0
3.8
11.4
8.8
8.9
16.3
15.8
10.6
15.4
16.9
90.9
89.5
90.3
91.4
83.2
84.3
80.2
91.2
75.3
77.5
78.8
69.4
58.0
75.6
92.0
76.8
74.1
77.0
96.2
88.6
91.2
91.1
83.7
84.2
95.1
89.4
84.6
83.1
4.9
0.0 10.0 20.0 30.0 40.0 50.0 60.0 70.0 80.0 90.0 100.0
Murder
Attempt To Commit Murder
C.H. Not Amounting Murder
Rape
Kidnapping & Abduction
Kidnapping & Abduction Of Women & Girls
Kidnapping & Abduction Of Others
Dacoity
Preparation & Assembly For
Robbery
Burglary
Theft
Auto Theft
Other Theft
Riots
Criminal Breach Of Trust
Cheating
Counterfeiting
Arson
Hurt
Dowry Death
Molestation
Sexual Harassment
Cruelty By Husband And Relatives
Importation Of Girls
Causing Death By Negligence
Other IPC Crimes
Total Cogni. Crimes Under IPC
Cri
me
Hea
d
Percentage
Mega Cities Rest of Country
All India Cities
Population (in lakhs) 11365.53 1078.8
Incidence 1989673 336889
Rate 175.1 312.3
FIGURE 2.2
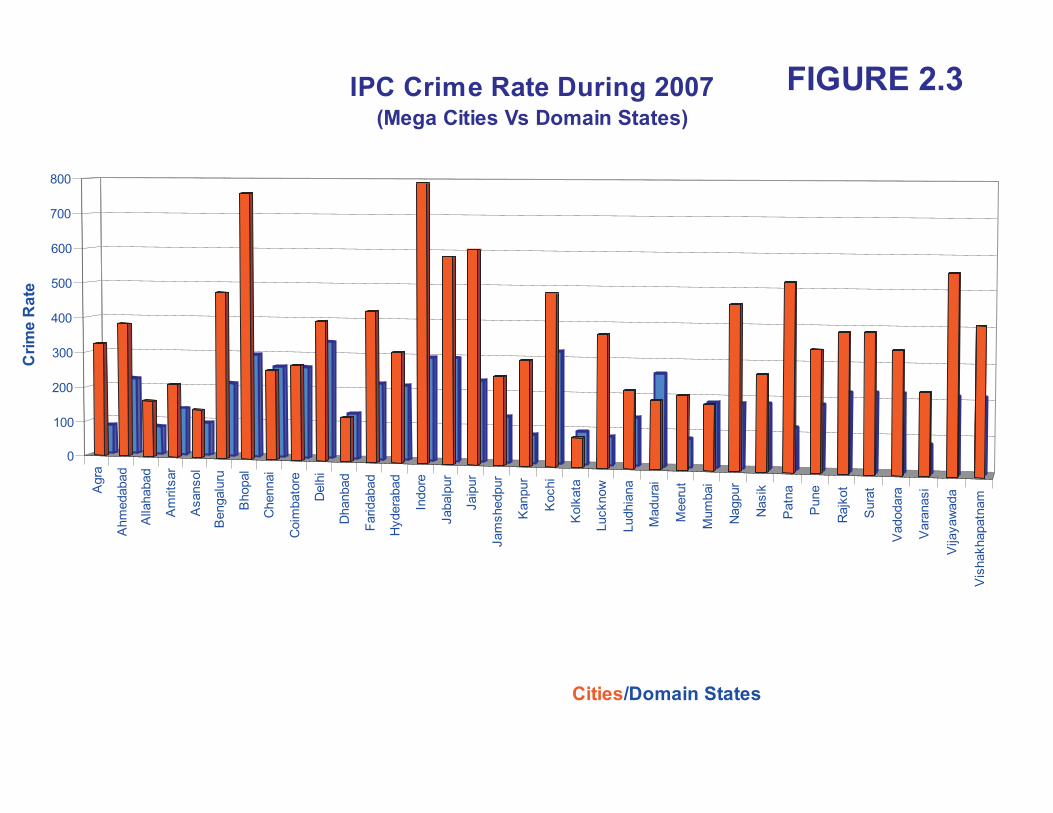
Agra
Ahm
edabad
Alla
habad
Am
rits
ar
Asansol
Bengalu
ru
Bhopal
Chennai
Coim
bato
re
Delh
i
Dhanbad
Faridabad
Hydera
bad
Indore
Jabalp
ur
Jaip
ur
Jam
shedpur
Kanpur
Kochi
Kolk
ata
Lucknow
Ludhia
na
Madura
i
Meeru
t
Mum
bai
Nagpur
Nasik
Patn
a
Pune
Rajk
ot
Sura
t
Vadodara
Vara
nasi
Vija
yaw
ada
Vis
hakhapatn
am
0
100
200
300
400
500
600
700
800
Cri
me
Ra
te
Cities/Domain States
FIGURE 2.3IPC Crime Rate During 2007(Mega Cities Vs Domain States)
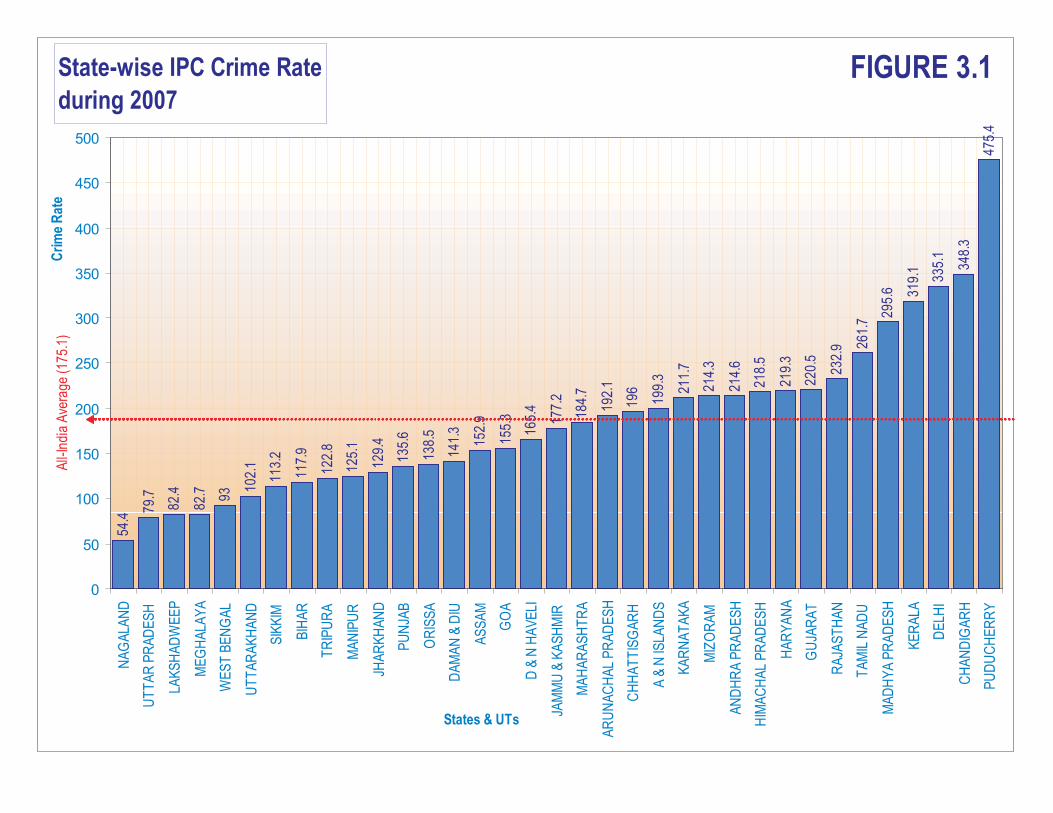
State-wise IPC Crime Rate
during 200754
.4
79.7
82.4
82.7 93
102.
1
113.
2
117.
9
122.
8
125.
1
129.
4
135.
6
138.
5
141.
3
152.
9
155.
3
165.
4
177.
2
184.
7
192.
1
196
199.
3
211.
7
214.
3
214.
6
218.
5
219.
3
220.
5
232.
9 261.
7 295.
6 319.
1
335.
1
348.
3
475.
4
0
50
100
150
200
250
300
350
400
450
500N
AG
ALA
ND
UT
TA
RP
RA
DE
SH
LAK
SH
AD
WE
EP
ME
GH
ALA
YA
WE
ST
BE
NG
AL
UT
TA
RA
KH
AN
D
SIK
KIM
BIH
AR
TR
IPU
RA
MA
NIP
UR
JHA
RK
HA
ND
PU
NJA
B
OR
ISS
A
DA
MA
N&
DIU
AS
SA
M
GO
A
D&
NH
AV
ELI
JAM
MU
&K
AS
HM
IR
MA
HA
RA
SH
TR
A
AR
UN
AC
HA
LP
RA
DE
SH
CH
HA
TT
ISG
AR
H
A&
NIS
LAN
DS
KA
RN
AT
AK
A
MIZ
OR
AM
AN
DH
RA
PR
AD
ES
H
HIM
AC
HA
LP
RA
DE
SH
HA
RY
AN
A
GU
JAR
AT
RA
JAS
TH
AN
TA
MIL
NA
DU
MA
DH
YA
PR
AD
ES
H
KE
RA
LA
DE
LHI
CH
AN
DIG
AR
H
PU
DU
CH
ER
RY
States & UTs
Cri
me
Rat
eA
ll-In
dia
Ave
rage
(175
.1)
FIGURE 3.1
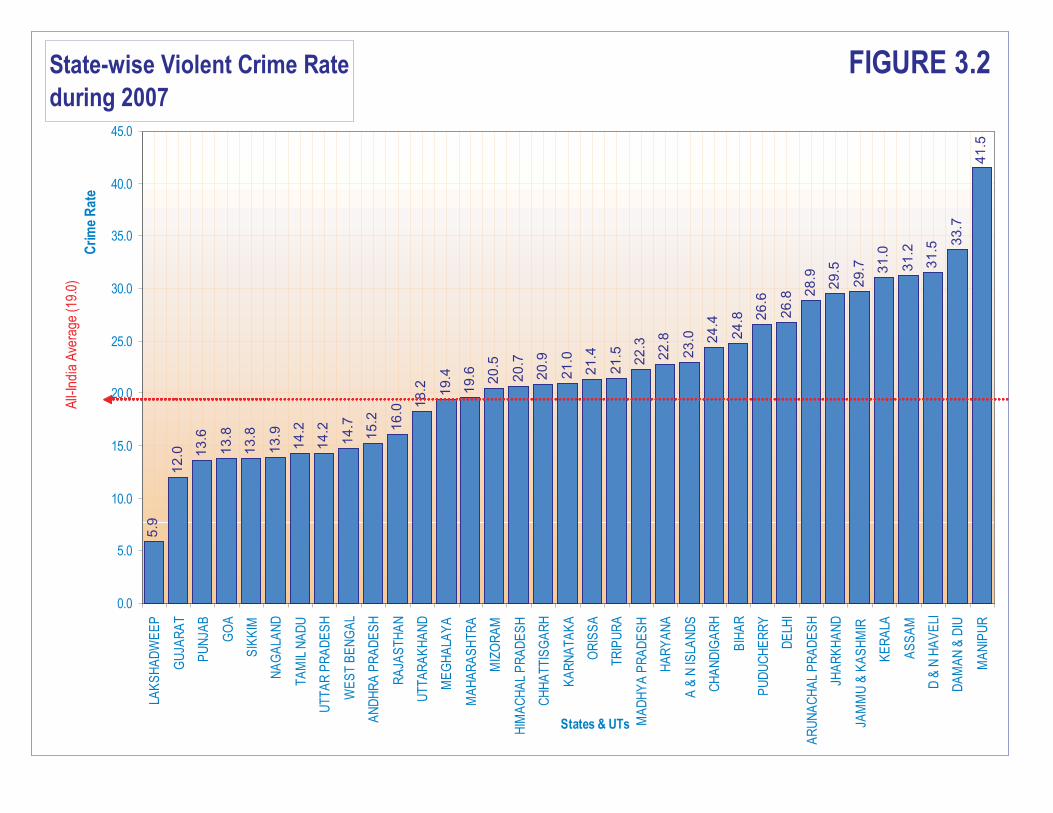
State-wise Violent Crime Rate
during 2007
5.9
12
.0 13
.6
13
.8
13
.8
13
.9
14
.2
14
.2
14
.7
15
.2
16
.0
18
.2 19
.4
19
.6 20
.5
20
.7
20
.9
21
.0
21
.4
21
.5
22
.3
22
.8
23
.0 24
.4
24
.8 26
.6
26
.8 28
.9
29
.5
29
.7 31
.0
31
.2
31
.5
33
.7
41
.5
0.0
5.0
10.0
15.0
20.0
25.0
30.0
35.0
40.0
45.0
LAK
SH
AD
WE
EP
GU
JAR
AT
PU
NJA
B
GO
A
SIK
KIM
NA
GA
LAN
D
TA
MIL
NA
DU
UT
TA
RP
RA
DE
SH
WE
ST
BE
NG
AL
AN
DH
RA
PR
AD
ES
H
RA
JAS
TH
AN
UT
TA
RA
KH
AN
D
ME
GH
ALA
YA
MA
HA
RA
SH
TR
A
MIZ
OR
AM
HIM
AC
HA
LP
RA
DE
SH
CH
HA
TT
ISG
AR
H
KA
RN
AT
AK
A
OR
ISS
A
TR
IPU
RA
MA
DH
YA
PR
AD
ES
H
HA
RY
AN
A
A&
NIS
LAN
DS
CH
AN
DIG
AR
H
BIH
AR
PU
DU
CH
ER
RY
DE
LHI
AR
UN
AC
HA
LP
RA
DE
SH
JHA
RK
HA
ND
JAM
MU
&K
AS
HM
IR
KE
RA
LA
AS
SA
M
D&
NH
AV
ELI
DA
MA
N&
DIU
MA
NIP
UR
States & UTs
Cri
me
Rat
e
All-
Indi
aA
vera
ge(1
9.0)
FIGURE 3.2
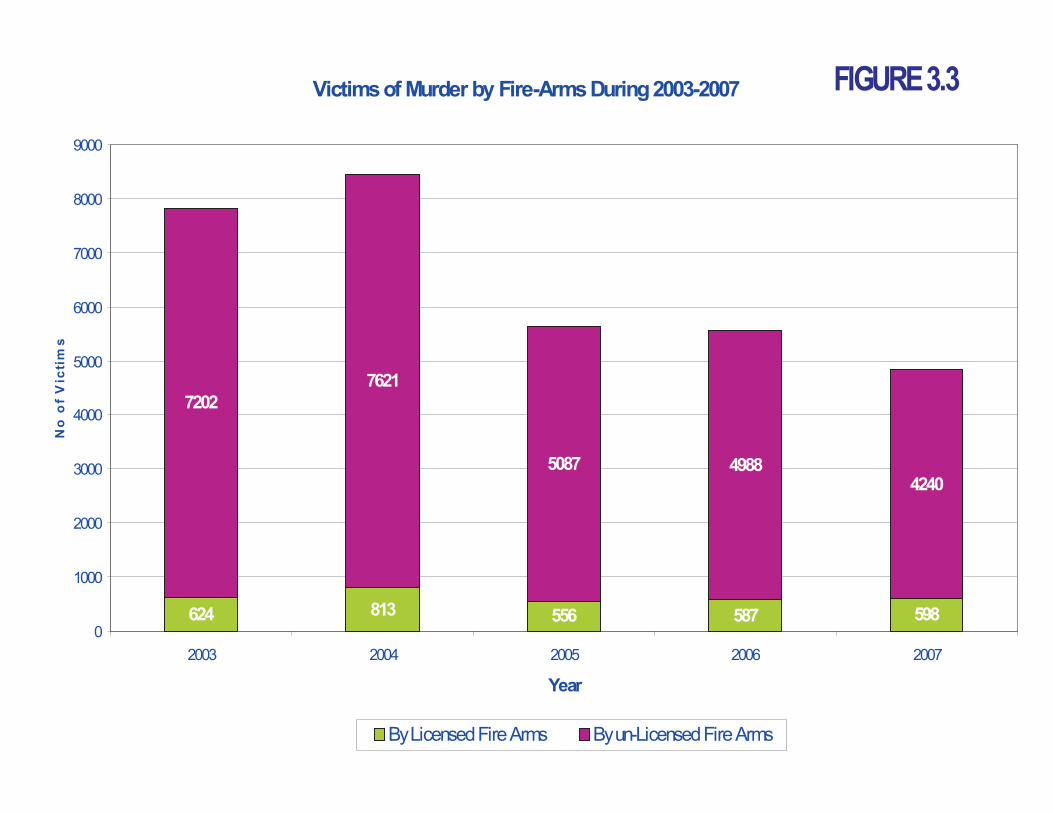
Victimsof Murder by Fire-ArmsDuring2003-2007
624 813 556 587 598
7202
7621
5087 49884240
0
1000
2000
3000
4000
5000
6000
7000
8000
9000
2003 2004 2005 2006 2007
Year
No
of
Vic
tim
s
ByLicensedFireArms Byun-LicensedFireArms
FIGURE3.3

88,887
25,117
66,699
15,847
95,786
26,109
68,608
18,233
93,947
25,648
64,686
18,359
94,855
26,332
65,121
19,348
99,017
26,920
68,939
20,737
0
50,000
100,000
150,000
200,000
250,000
Incid
en
ce
2003 2004 2005 2006 2007
Years
Category-wise violent crimes during 2003 - 2007
Affecting Life Affecting Property Affecting Public Safety Affecting Women
FIGURE 3.4
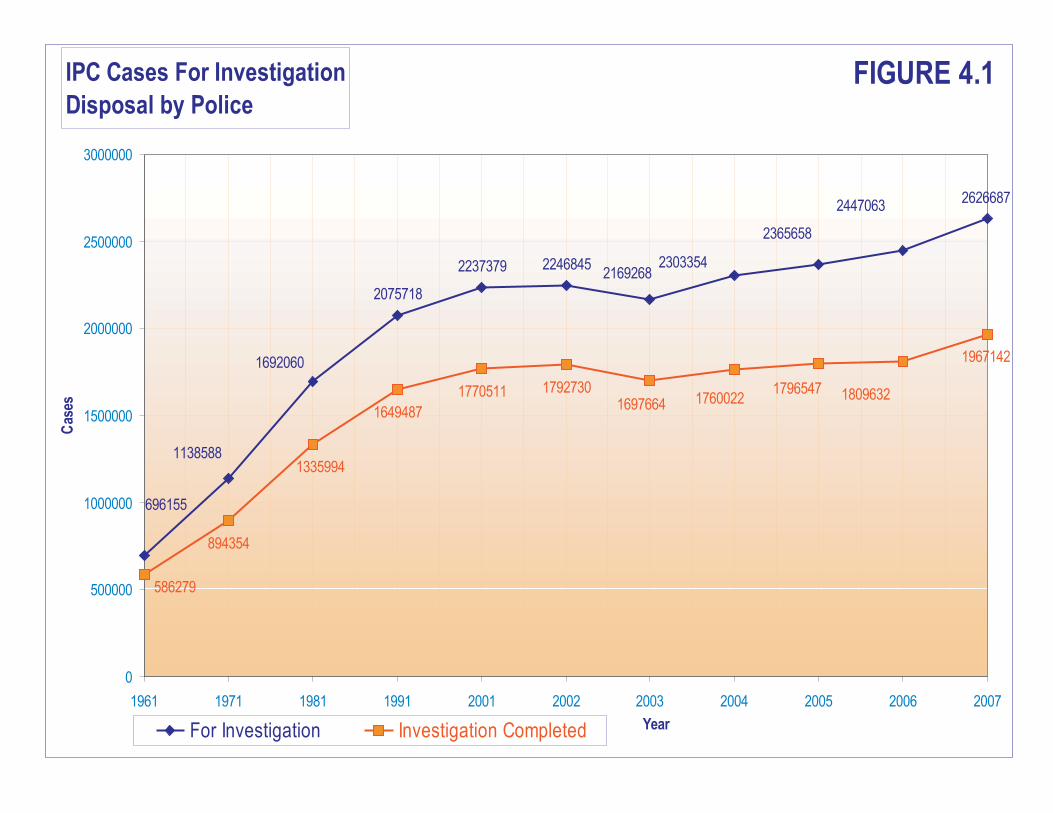
IPC Cases For Investigation
Disposal by Police
2075718
2237379 2246845
2626687
894354
1649487
1770511 1792730
1967142
2447063
2365658
2303354
1138588
1692060
2169268
696155
1809632179654717600221697664
586279
1335994
0
500000
1000000
1500000
2000000
2500000
3000000
1961 1971 1981 1991 2001 2002 2003 2004 2005 2006 2007
Year
Cas
es
For Investigation Investigation Completed
FIGURE 4.1
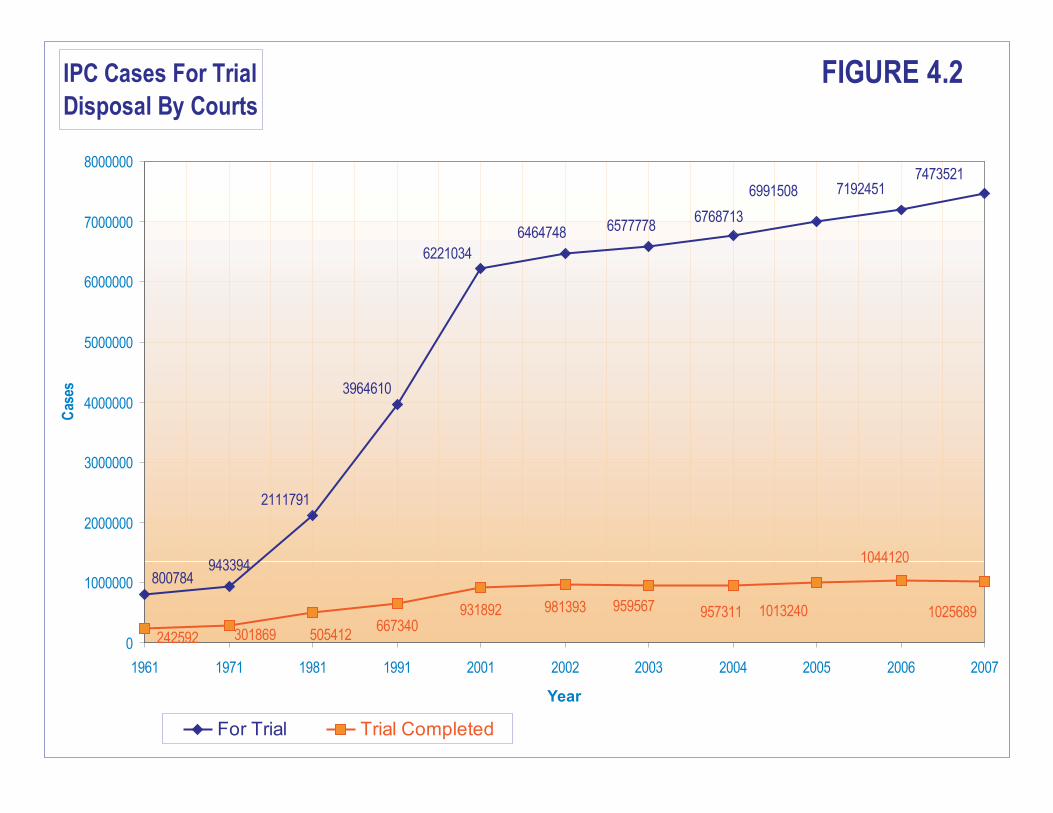
IPC Cases For Trial
Disposal By Courts
943394
667340931892 981393
747352171924516991508
676871365777786464748
2111791
3964610
6221034
800784
1025689
505412
1044120
1013240957311
301869
959567
2425920
1000000
2000000
3000000
4000000
5000000
6000000
7000000
8000000
1961 1971 1981 1991 2001 2002 2003 2004 2005 2006 2007
Year
Cas
es
For Trial Trial Completed
FIGURE 4.2

Percent Disposal of IPC Cases by Police
Crime-wise 2007
Pendency
25.1%Disposal
74.9%
FIGURE 4.3
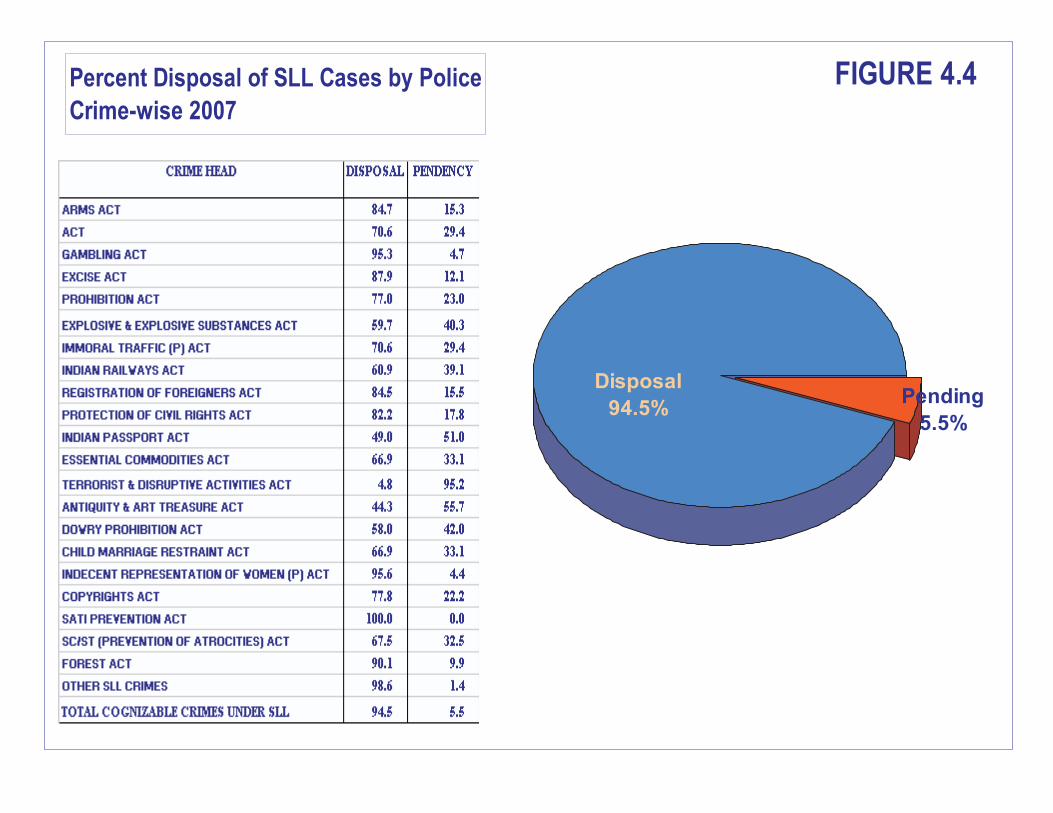
Percent Disposal of SLL Cases by Police
Crime-wise 2007
Disposal
94.5%Pending
5.5%
FIGURE 4.4
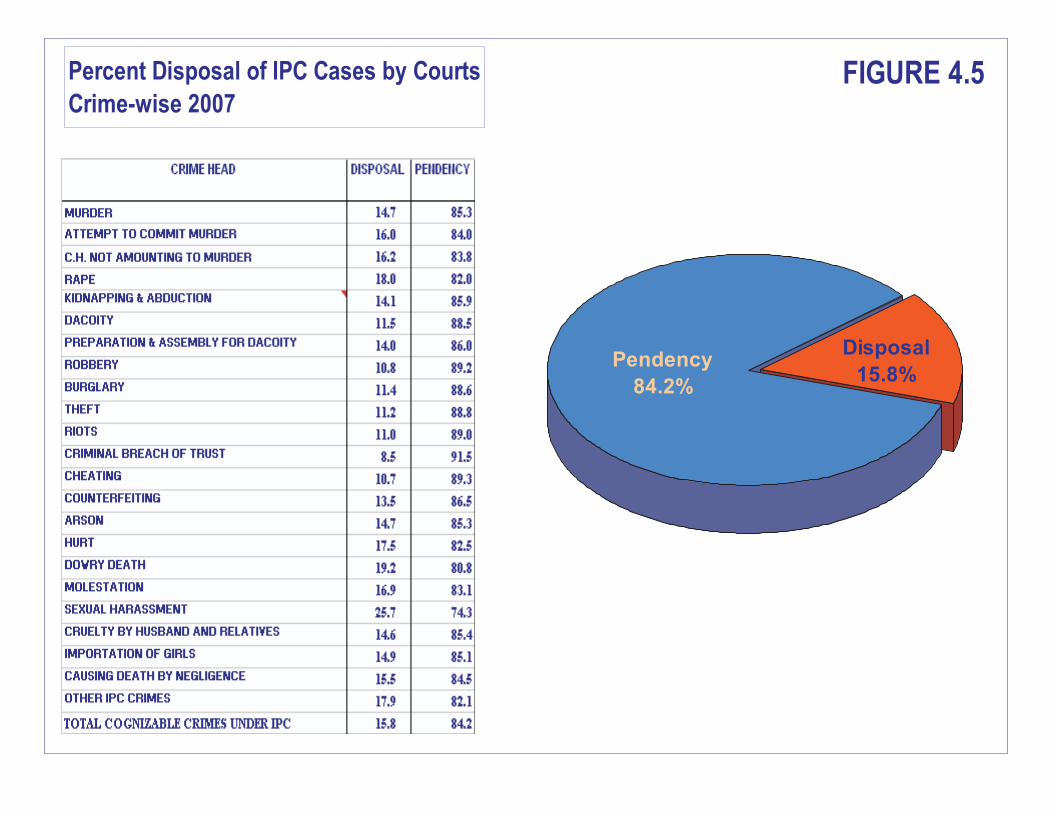
Percent Disposal of IPC Cases by Courts
Crime-wise 2007
Disposal
15.8%Pendency
84.2%
FIGURE 4.5
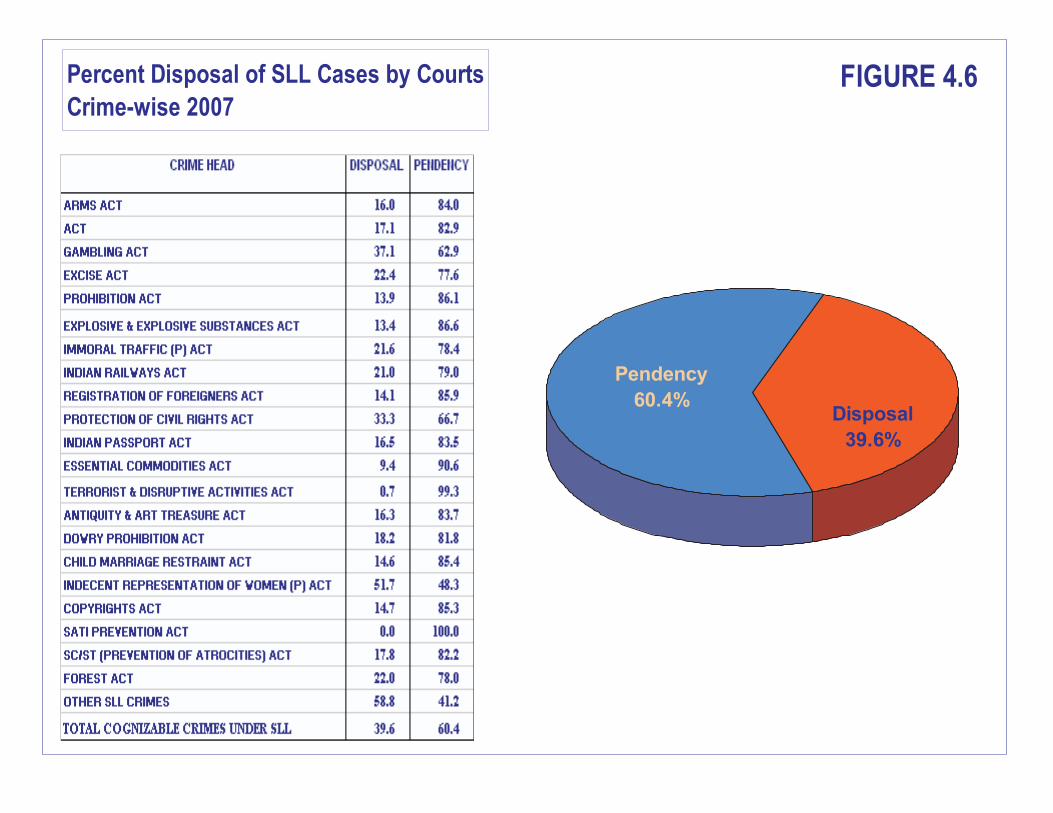
Percent Disposal of SLL Cases by Courts
Crime-wise 2007
Disposal
39.6%
Pendency
60.4%
FIGURE 4.6
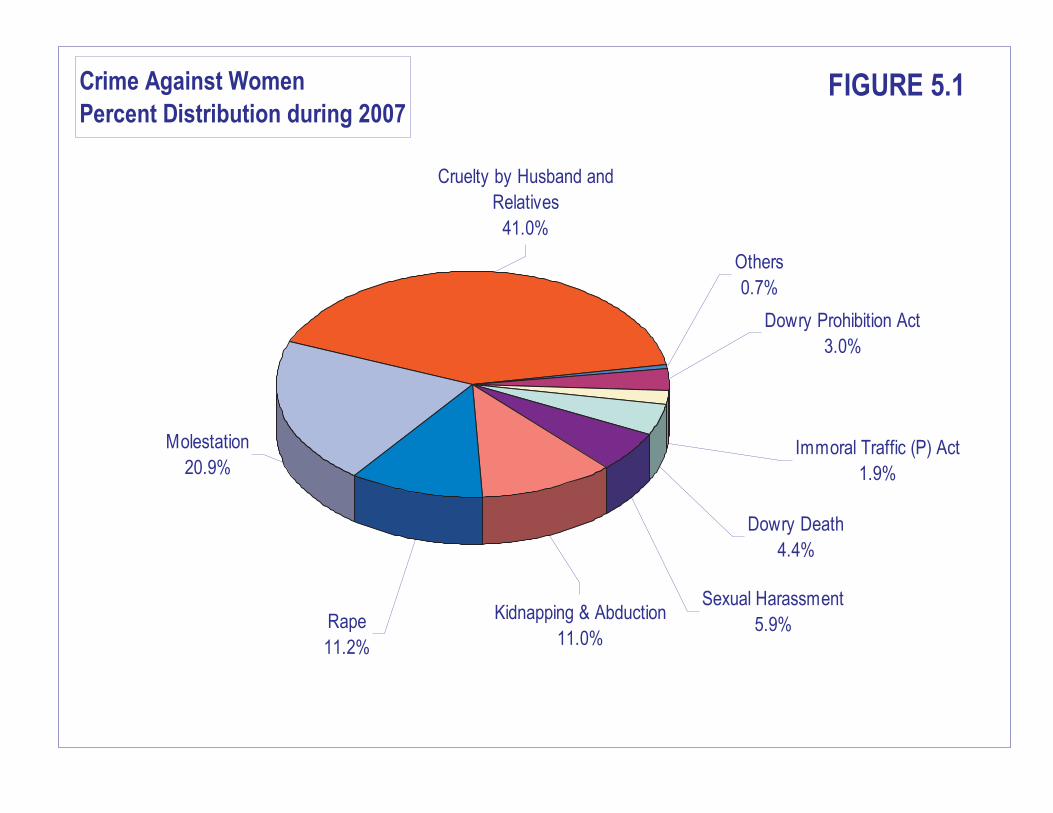
Crime Against Women
Percent Distribution during 2007
Cruelty by Husband and
Relatives
41.0%
Others
0.7%
Dowry Death
4.4%
Immoral Traffic (P) Act
1.9%
Dowry Prohibition Act
3.0%
Rape
11.2%
Sexual Harassment
5.9%Kidnapping & Abduction
11.0%
Molestation
20.9%
FIGURE 5.1
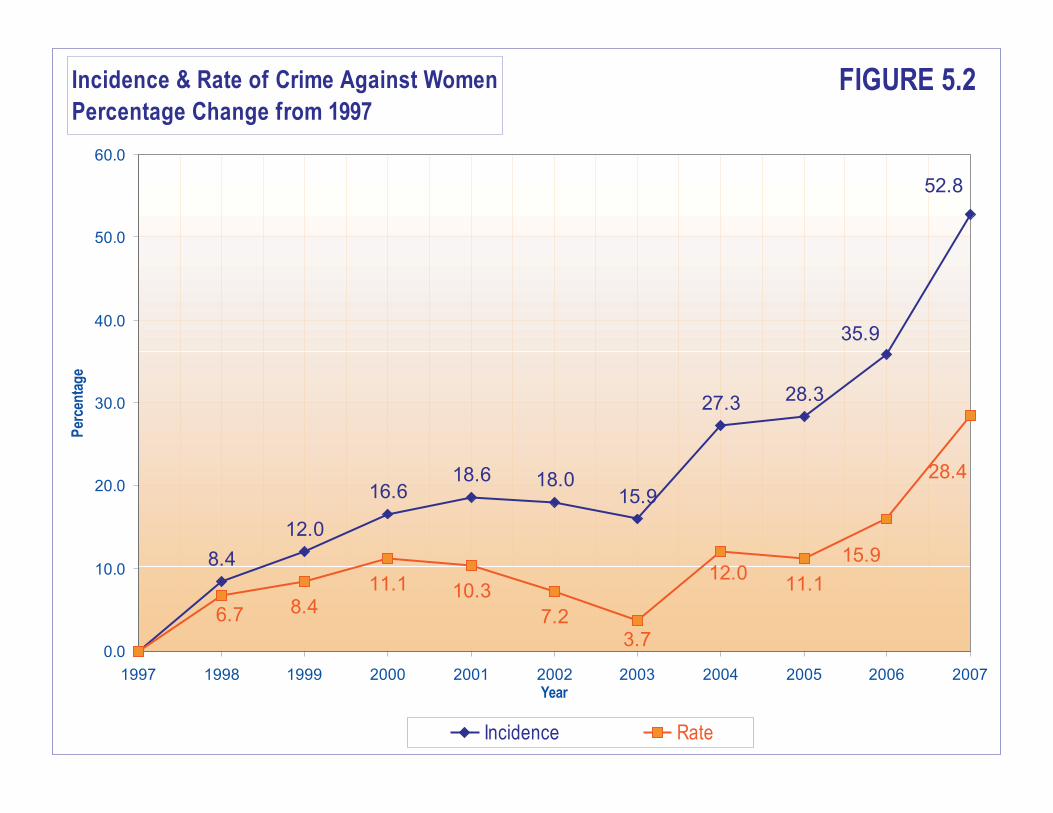
Incidence & Rate of Crime Against Women
Percentage Change from 1997
8.4
28.3
8.411.1 10.3
7.2
11.1
52.8
27.3
15.918.018.6
16.6
12.0
35.9
3.7
6.7
28.4
12.015.9
0.0
10.0
20.0
30.0
40.0
50.0
60.0
1997 1998 1999 2000 2001 2002 2003 2004 2005 2006 2007Year
Per
cen
tag
e
Incidence Rate
FIGURE 5.2
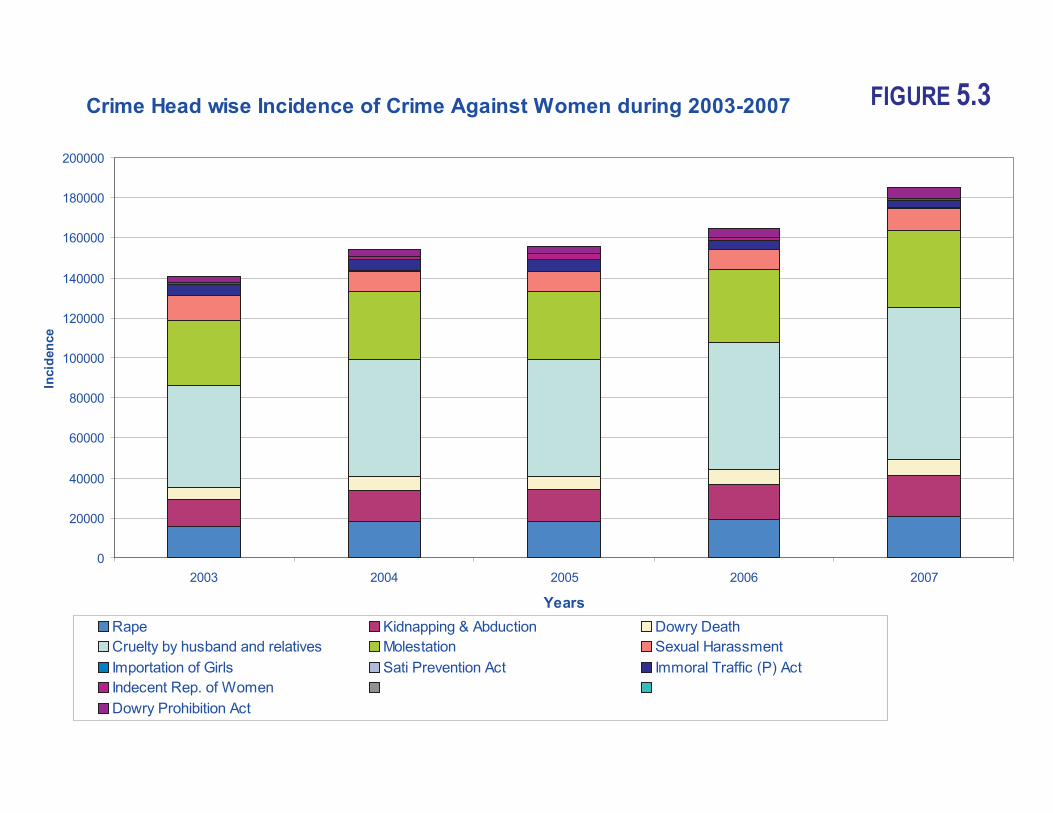
Crime Head wise Incidence of Crime Against Women during 2003-2007
0
20000
40000
60000
80000
100000
120000
140000
160000
180000
200000
2003 2004 2005 2006 2007
Years
Incid
en
ce
Rape Kidnapping & Abduction Dowry Death
Cruelty by husband and relatives Molestation Sexual Harassment
Importation of Girls Sati Prevention Act Immoral Traffic (P) Act
Indecent Rep. of Women
Dowry Prohibition Act
FIGURE 5.3
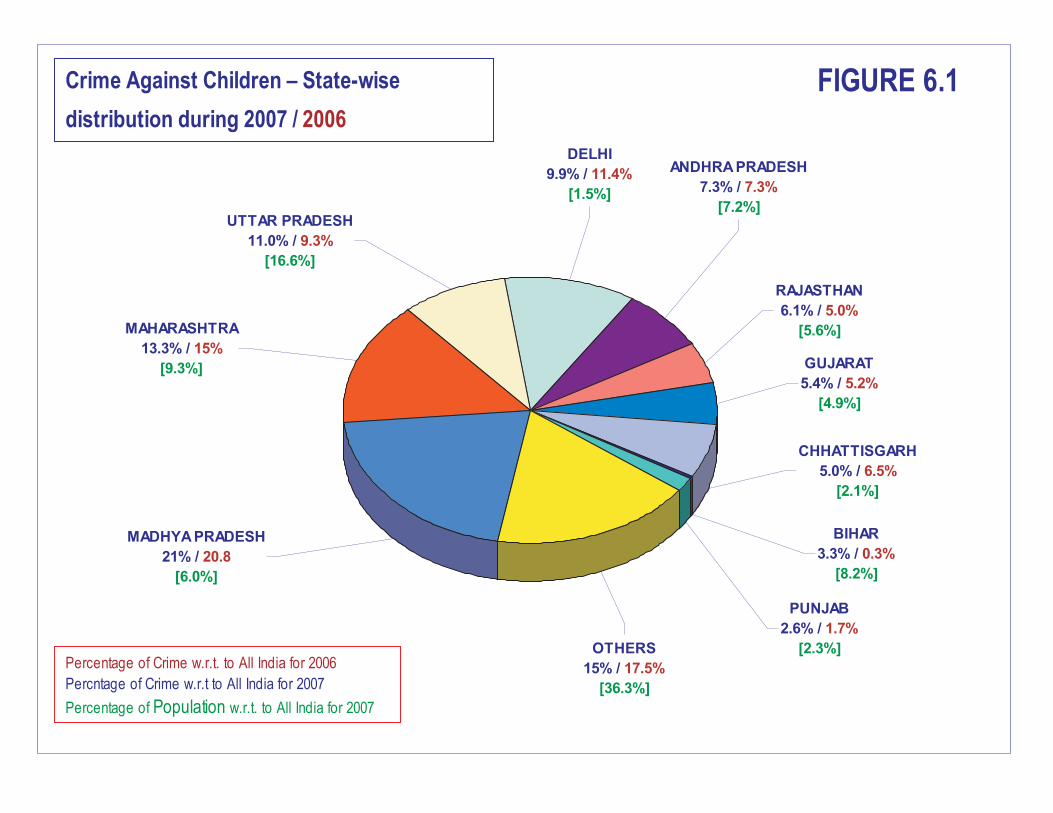
UTTAR PRADESH
11.0% / 9.3%
[16.6%]
DELHI
9.9% / 11.4%
[1.5%]
ANDHRA PRADESH
7.3% / 7.3%
[7.2%]
RAJASTHAN
6.1% / 5.0%
[5.6%]
GUJARAT
5.4% / 5.2%
[4.9%]
CHHATTISGARH
5.0% / 6.5%
[2.1%]
OTHERS
15% / 17.5%
[36.3%]
PUNJAB
2.6% / 1.7%
[2.3%]
BIHAR
3.3% / 0.3%
[8.2%]
MAHARASHTRA
13.3% / 15%
[9.3%]
MADHYA PRADESH
21% / 20.8
[6.0%]
Crime Against Children – State-wise
distribution during 2007 / 2006
Percentage of Crime w.r.t. to All India for 2006
Percntage of Crime w.r.t to All India for 2007
Percentage of Population w.r.t. to All India for 2007
FIGURE 6.1
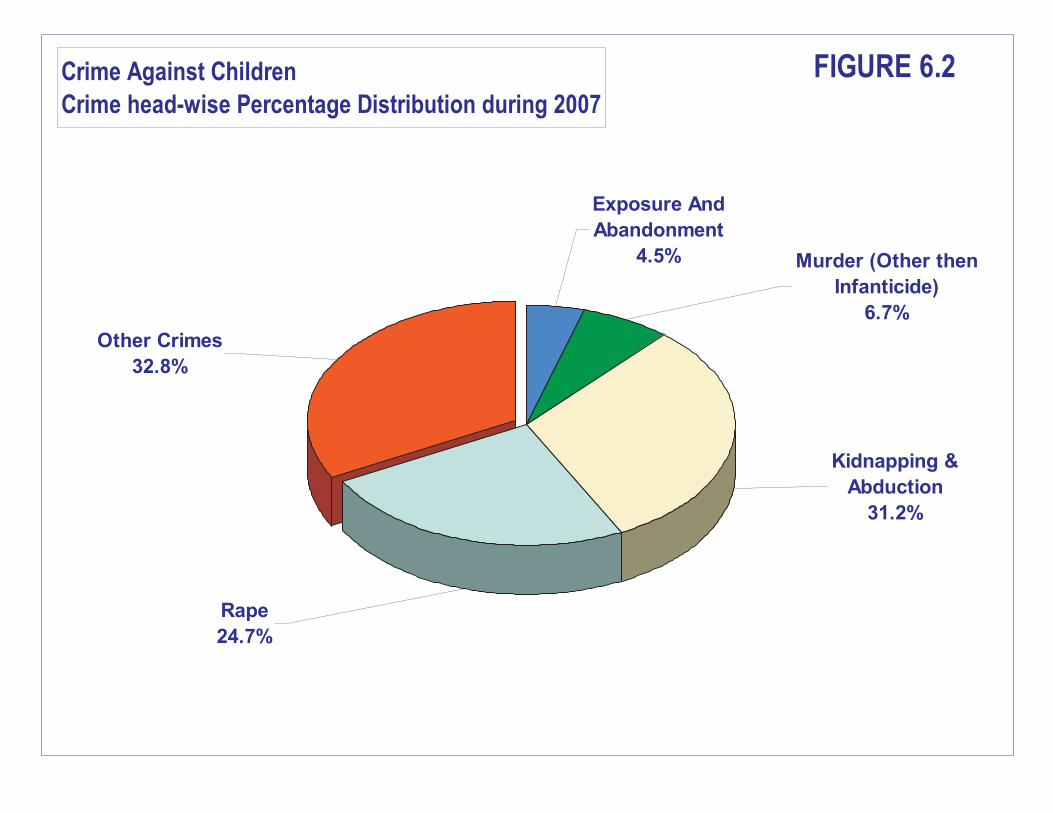
Crime Against Children
Crime head-wise Percentage Distribution during 2007
Rape
24.7%
Kidnapping &
Abduction
31.2%
Murder (Other then
Infanticide)
6.7%
Exposure And
Abandonment
4.5%
Other Crimes
32.8%
FIGURE 6.2
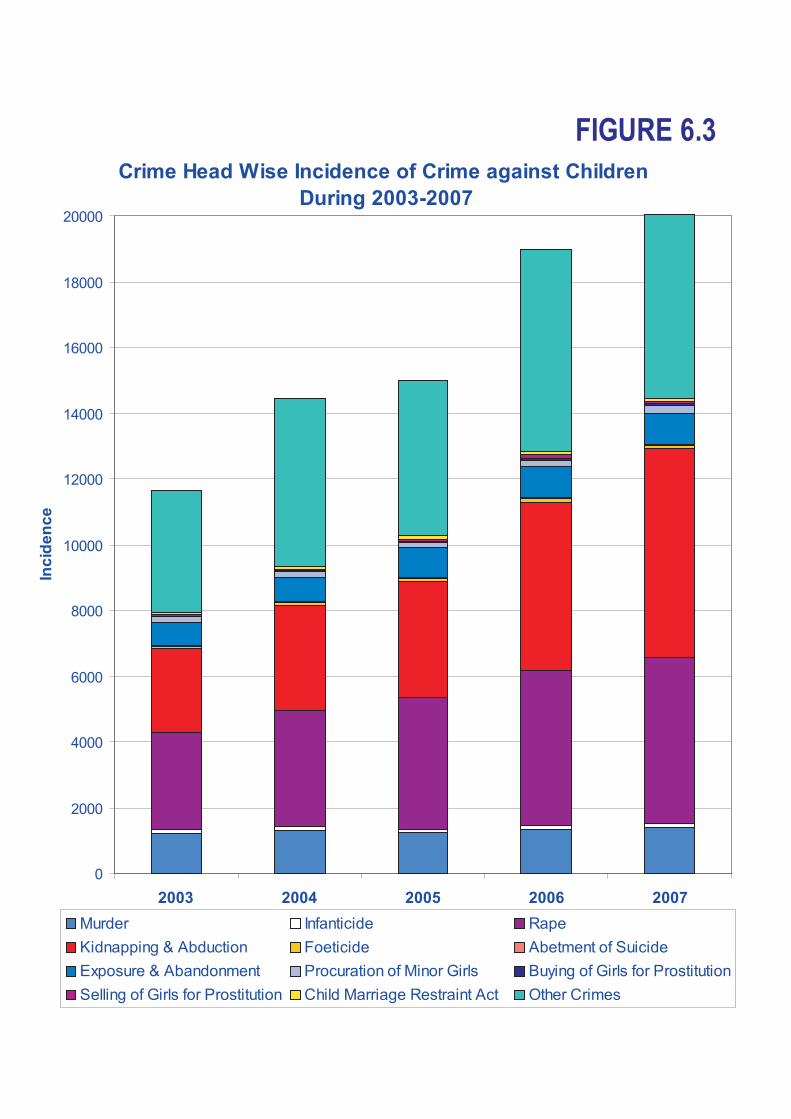
Crime Head Wise Incidence of Crime against Children
During 2003-2007
0
2000
4000
6000
8000
10000
12000
14000
16000
18000
20000
2003 2004 2005 2006 2007
Years
Inc
ide
nc
e
Murder Infanticide Rape
Kidnapping & Abduction Foeticide Abetment of Suicide
Exposure & Abandonment Procuration of Minor Girls Buying of Girls for Prostitution
Selling of Girls for Prostitution Child Marriage Restraint Act Other Crimes
FIGURE 6.3
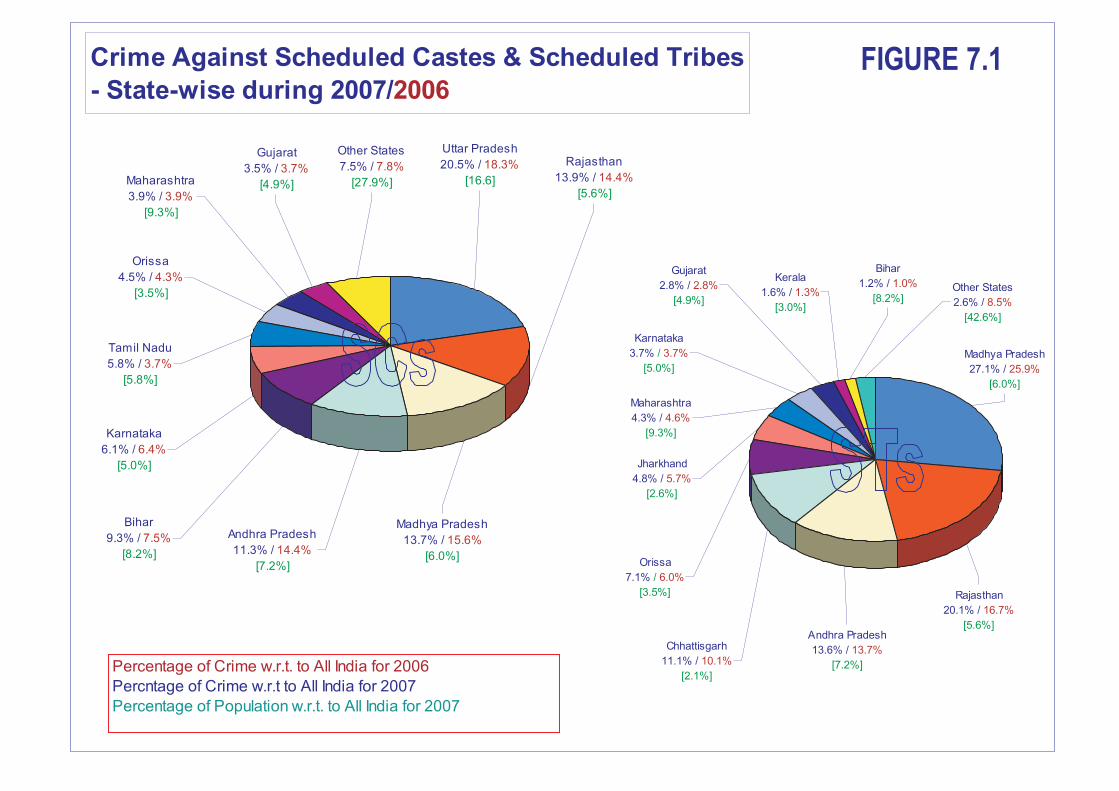
Crime Against Scheduled Castes & Scheduled Tribes
- State-wise during 2007/2006
Uttar Pradesh
20.5% / 18.3%
[16.6]
Rajasthan
13.9% / 14.4%
[5.6%]
Madhya Pradesh
13.7% / 15.6%
[6.0%]
Andhra Pradesh
11.3% / 14.4%
[7.2%]
Bihar
9.3% / 7.5%
[8.2%]
Karnataka
6.1% / 6.4%
[5.0%]
Tamil Nadu
5.8% / 3.7%
[5.8%]
Orissa
4.5% / 4.3%
[3.5%]
Other States
7.5% / 7.8%
[27.9%]
Gujarat
3.5% / 3.7%
[4.9%]Maharashtra
3.9% / 3.9%
[9.3%]
Kerala
1.6% / 1.3%
[3.0%]
Gujarat
2.8% / 2.8%
[4.9%]
Karnataka
3.7% / 3.7%
[5.0%]
Bihar
1.2% / 1.0%
[8.2%]
Andhra Pradesh
13.6% / 13.7%
[7.2%]
Rajasthan
20.1% / 16.7%
[5.6%]
Madhya Pradesh
27.1% / 25.9%
[6.0%]
Other States
2.6% / 8.5%
[42.6%]
Maharashtra
4.3% / 4.6%
[9.3%]
Jharkhand
4.8% / 5.7%
[2.6%]
Orissa
7.1% / 6.0%
[3.5%]
Chhattisgarh
11.1% / 10.1%
[2.1%]Percentage of Crime w.r.t. to All India for 2006
Percntage of Crime w.r.t to All India for 2007
Percentage of Population w.r.t. to All India for 2007
FIGURE 7.1
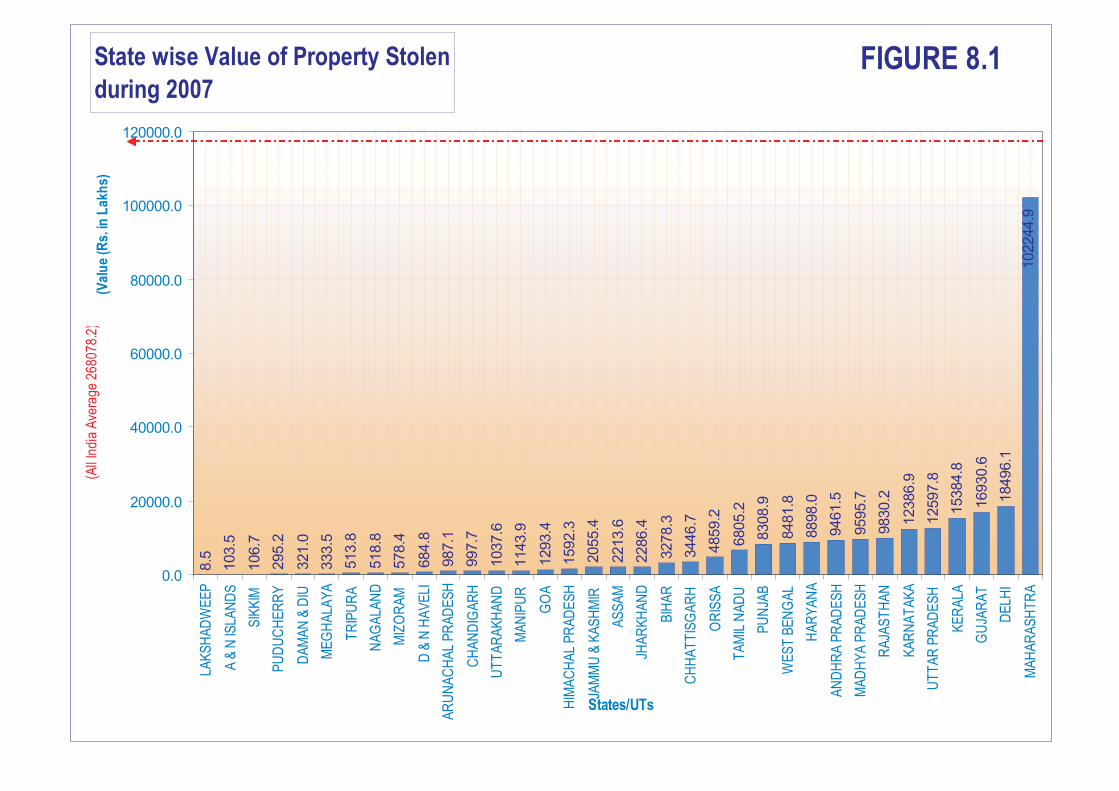
State wise Value of Property Stolen
during 2007
8.5
103.5
106.7
295.2
321.0
333.5
513.8
518.8
578.4
684.8
987.1
997.7
1037.6
1143.9
1293.4
1592.3
2055.4
2213.6
2286.4
3278.3
3446.7
4859.2
6805.2
8308.9
8481.8
8898.0
9461.5
9595.7
9830.2
12386.9
12597.8
15384.8
16930.6
18496.1
102244.9
0.0
20000.0
40000.0
60000.0
80000.0
100000.0
120000.0
LAK
SH
AD
WE
EP
A&
NIS
LAN
DS
SIK
KIM
PU
DU
CH
ER
RY
DA
MA
N&
DIU
ME
GH
ALA
YA
TR
IPU
RA
NA
GA
LAN
D
MIZ
OR
AM
D&
NH
AV
ELI
AR
UN
AC
HA
LP
RA
DE
SH
CH
AN
DIG
AR
H
UT
TA
RA
KH
AN
D
MA
NIP
UR
GO
A
HIM
AC
HA
LP
RA
DE
SH
JAM
MU
&K
AS
HM
IR
AS
SA
M
JHA
RK
HA
ND
BIH
AR
CH
HA
TT
ISG
AR
H
OR
ISS
A
TA
MIL
NA
DU
PU
NJA
B
WE
ST
BE
NG
AL
HA
RY
AN
A
AN
DH
RA
PR
AD
ES
H
MA
DH
YA
PR
AD
ES
H
RA
JAS
TH
AN
KA
RN
AT
AK
A
UT
TA
RP
RA
DE
SH
KE
RA
LA
GU
JAR
AT
DE
LHI
MA
HA
RA
SH
TR
A
States/UTs
(Val
ue
(Rs.
inL
akh
s)
FIGURE 8.1(A
llIn
dia
Ave
rage
2680
78.2
)
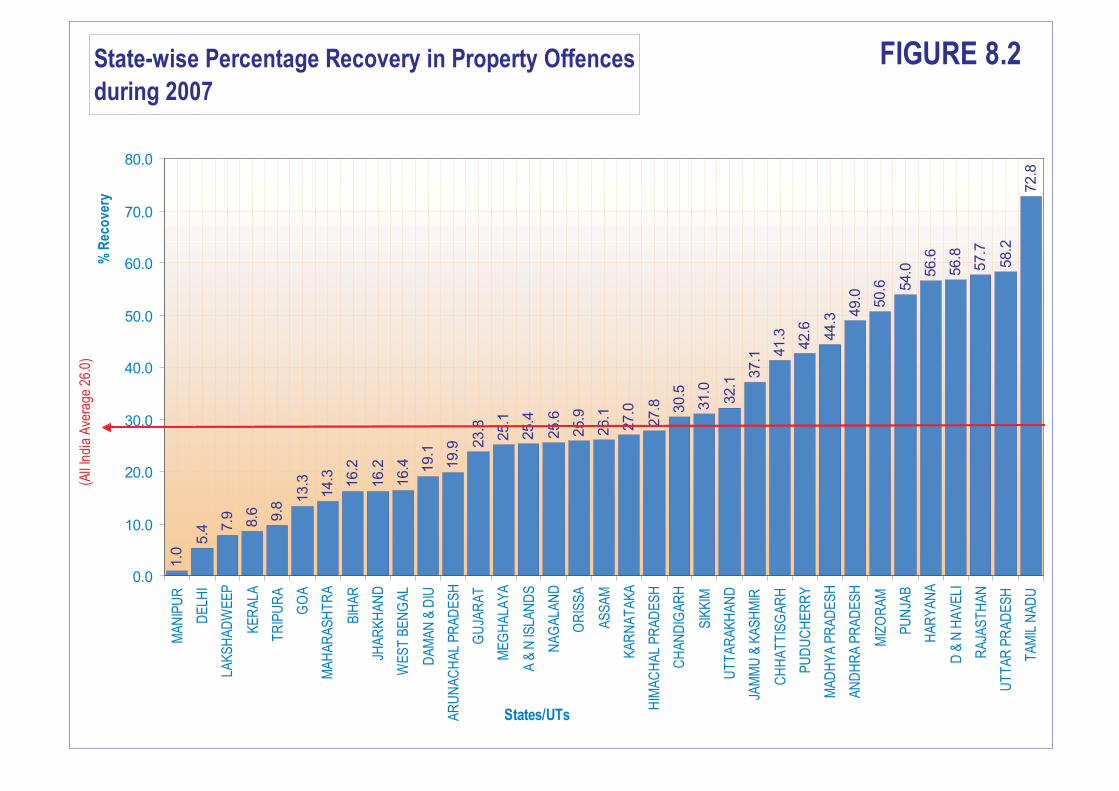
State-wise Percentage Recovery in Property Offences
during 2007
1.0
5.4 7
.9 8.6 9.8
13.3
14.3 16.2
16.2
16.4 19.1
19.9 2
3.8
25.1
25.4
25.6
25.9
26.1
27.0
27.8 30.5
31.0
32.1
37.1 4
1.3
42.6 44.3
49.0 50.6 5
4.0 56.6
56.8
57.7
58.2
72.8
0.0
10.0
20.0
30.0
40.0
50.0
60.0
70.0
80.0
MA
NIP
UR
DE
LHI
LAK
SH
AD
WE
EP
KE
RA
LA
TR
IPU
RA
GO
A
MA
HA
RA
SH
TR
A
BIH
AR
JHA
RK
HA
ND
WE
ST
BE
NG
AL
DA
MA
N&
DIU
AR
UN
AC
HA
LP
RA
DE
SH
GU
JAR
AT
ME
GH
ALA
YA
A&
NIS
LAN
DS
NA
GA
LAN
D
OR
ISS
A
AS
SA
M
KA
RN
AT
AK
A
HIM
AC
HA
LP
RA
DE
SH
CH
AN
DIG
AR
H
SIK
KIM
UT
TA
RA
KH
AN
D
JAM
MU
&K
AS
HM
IR
CH
HA
TT
ISG
AR
H
PU
DU
CH
ER
RY
MA
DH
YA
PR
AD
ES
H
AN
DH
RA
PR
AD
ES
H
MIZ
OR
AM
PU
NJA
B
HA
RY
AN
A
D&
NH
AV
ELI
RA
JAS
TH
AN
UT
TA
RP
RA
DE
SH
TA
MIL
NA
DU
States/UTs
%R
eco
very
(All
Indi
aA
vera
ge26
.0)
FIGURE 8.2

Juvenile IPC Crime Incidence
1997 - 2007
9267
8888
9352
7909
16509
18560
17819
19929
18939
21088
22865
0
5000
10000
15000
20000
25000
1997 1998 1999 2000 2001 2002 2003 2004 2005 2006 2007
Year
Inci
den
ce
Note : The significant increase in 2001 was mainly due to increase in the upper age of Male Juvenile from 16 years to 18 years as per Juvenile
Justice Act, 2000.
FIGURE 10.1
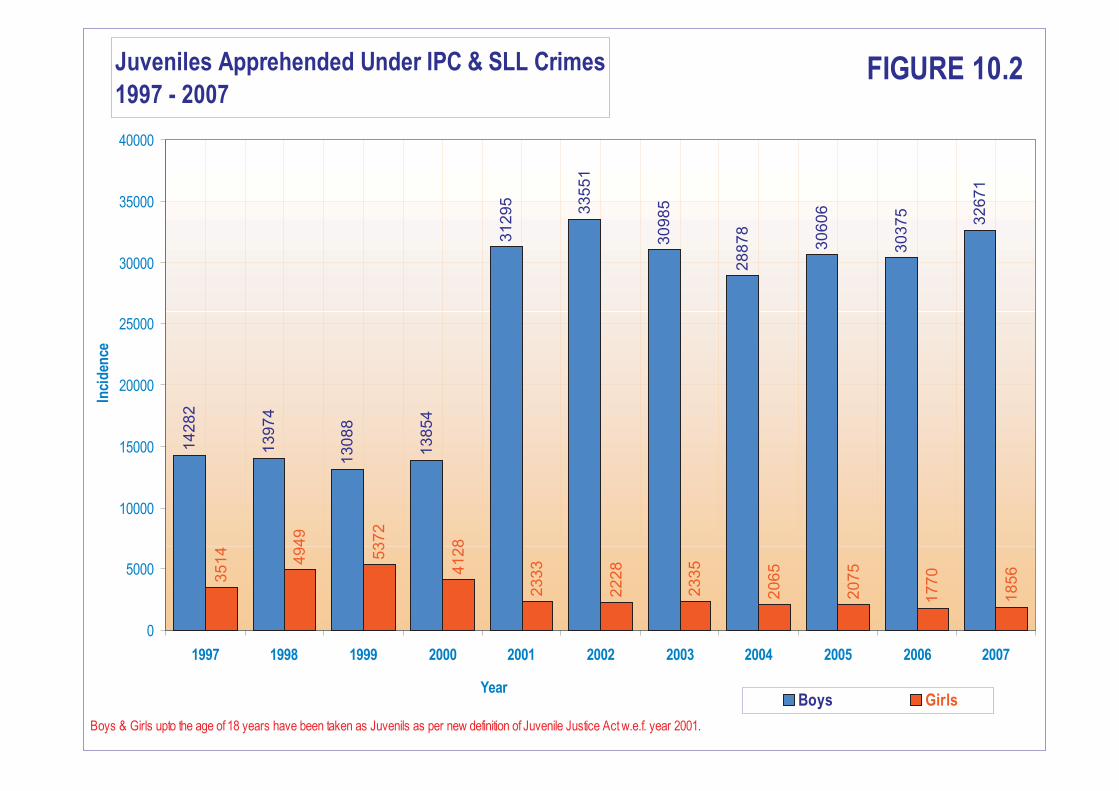
Juveniles Apprehended Under IPC & SLL Crimes
1997 - 2007
14
28
2
13
97
4
13
08
8
13
85
4
31
29
5
33
55
1
30
98
5
28
87
8
30
60
6
30
37
5
32
67
1
35
14
49
49
53
72
41
28
23
33
22
28
23
35
20
65
20
75
17
70
18
56
0
5000
10000
15000
20000
25000
30000
35000
40000
1997 1998 1999 2000 2001 2002 2003 2004 2005 2006 2007
Year
Inci
den
ce
Boys Girls
Boys & Girls upto the age of 18 years have been taken as Juvenils as per new definition of Juvenile Justice Act w.e.f. year 2001.
FIGURE 10.2

Disposal of Juveniles Arrested During 2007
Pending Disposal,
41.4%
Sent to Home after
Advice/Admonition,
13.0%
Released on Probation
under the care of
Parents/Guardians,
18.3%
Released on Probation
under the care of Fit
Institutions,
3.9%Sent to Special Home,
14.7%
Dealt with Fine,
4.5%
Acquitted or otherwise
disposed of,
4.3%
FIGURE 10.3

Age-Group Wise Juveniles Apprehended
Under IPC During 2007
12 - 16 Years
35.9%
7 - 12 Years
3.9%
16 - 18 Years
60.3%
FIGURE10.4
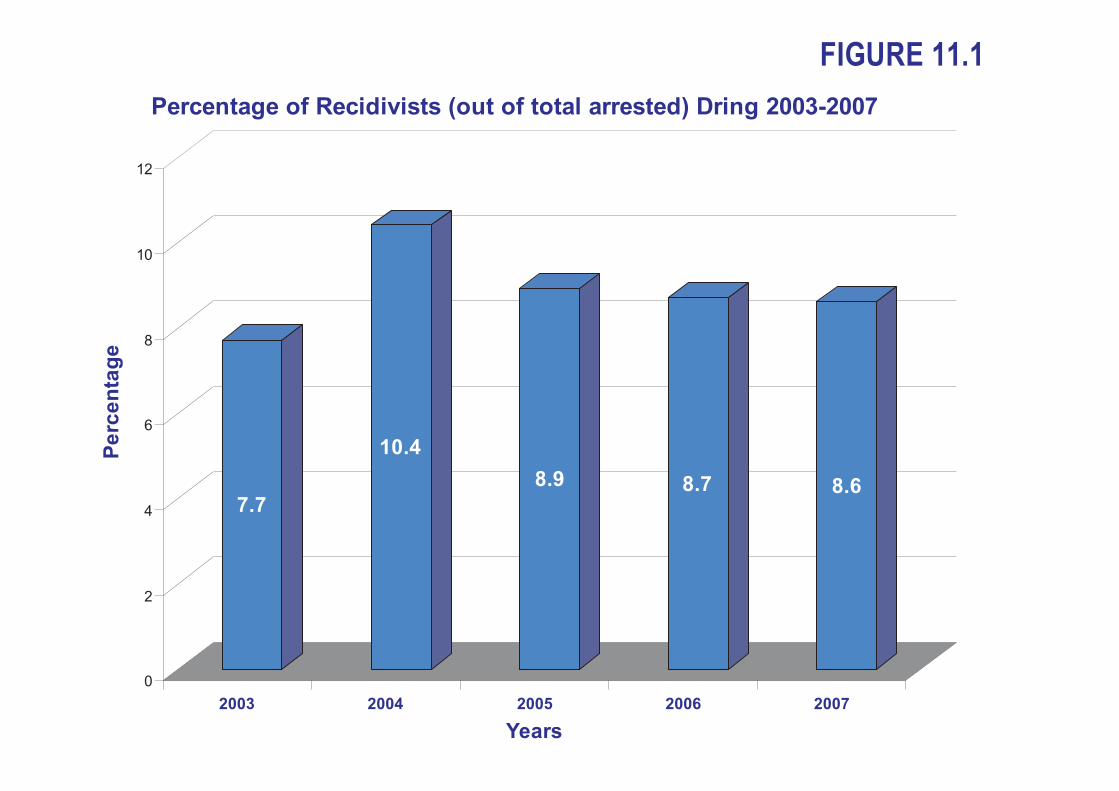
7.7
10.4
8.9 8.7 8.6
0
2
4
6
8
10
12
Pe
rce
nta
ge
2003 2004 2005 2006 2007
Years
Percentage of Recidivists (out of total arrested) Dring 2003-2007
FIGURE 11.1
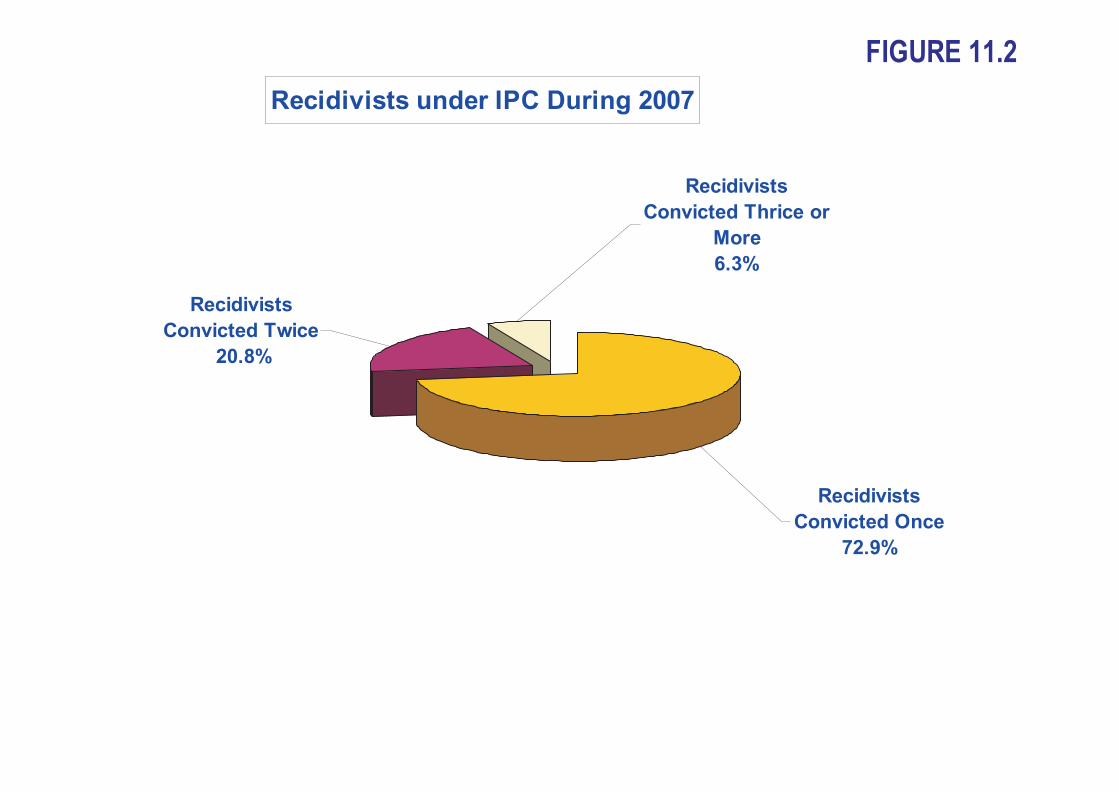
Recidivists under IPC During 2007
Recidivists
Convicted Once
72.9%
Recidivists
Convicted Twice
20.8%
Recidivists
Convicted Thrice or
More
6.3%
FIGURE 11.2
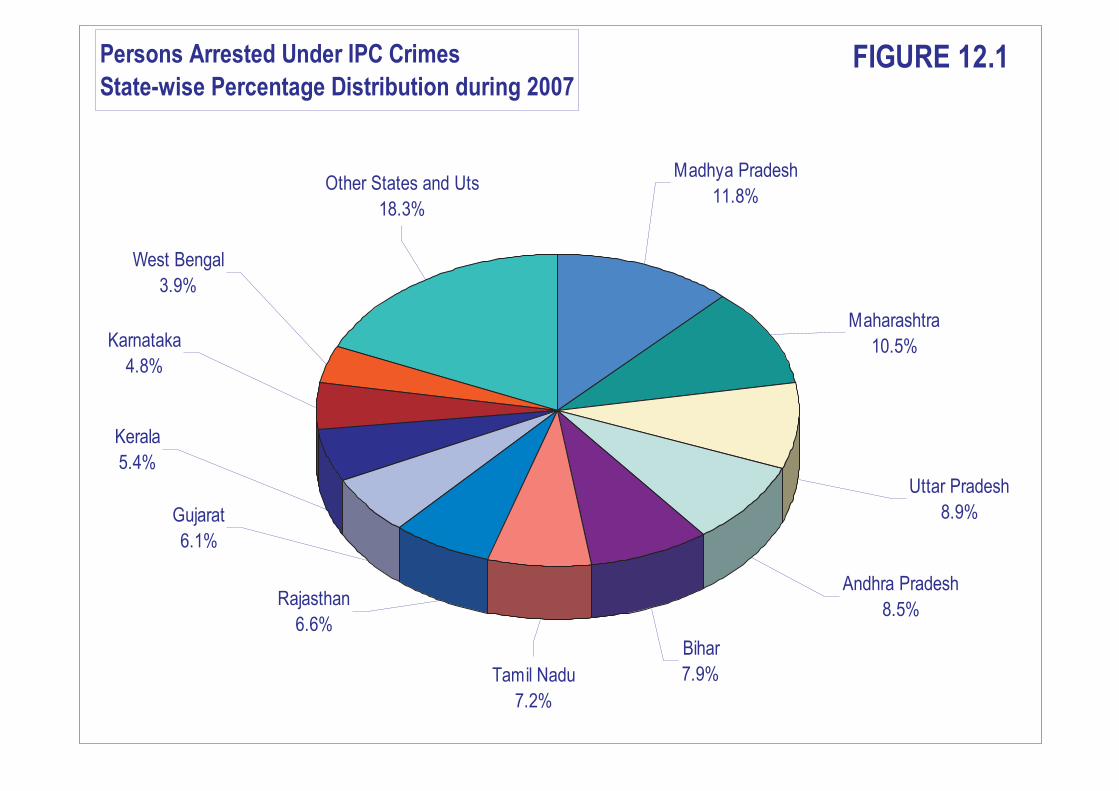
Persons Arrested Under IPC Crimes
State-wise Percentage Distribution during 2007
Bihar
7.9%
Andhra Pradesh
8.5%
Maharashtra
10.5%
Other States and Uts
18.3%
Uttar Pradesh
8.9%
Tamil Nadu
7.2%
Rajasthan
6.6%
Gujarat
6.1%
Kerala
5.4%
Karnataka
4.8%
Madhya Pradesh
11.8%
West Bengal
3.9%
FIGURE 12.1
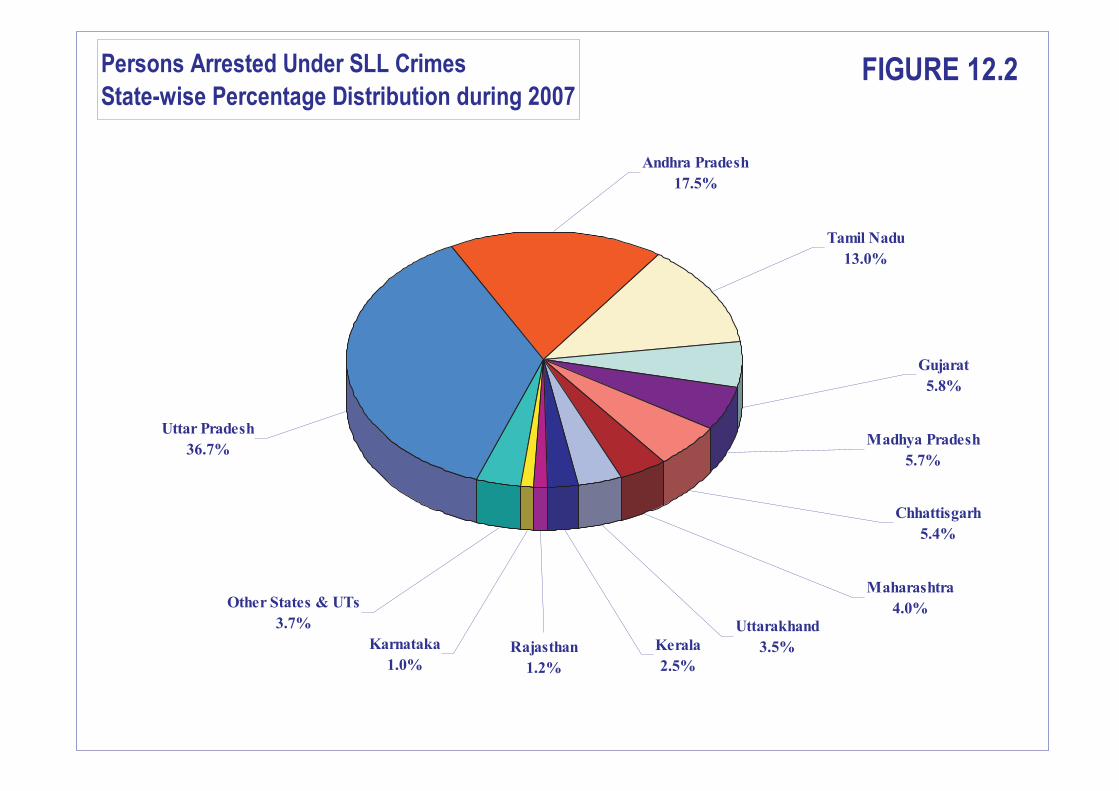
Persons Arrested Under SLL Crimes
State-wise Percentage Distribution during 2007
Kerala
2.5%
Rajasthan
1.2%
Karnataka
1.0%
Andhra Pradesh
17.5%
Gujarat
5.8%
Tamil Nadu
13.0%
Uttar Pradesh
36.7%Madhya Pradesh
5.7%
Chhattisgarh
5.4%
Uttarakhand
3.5%
Maharashtra
4.0%Other States & UTs
3.7%
FIGURE 12.2
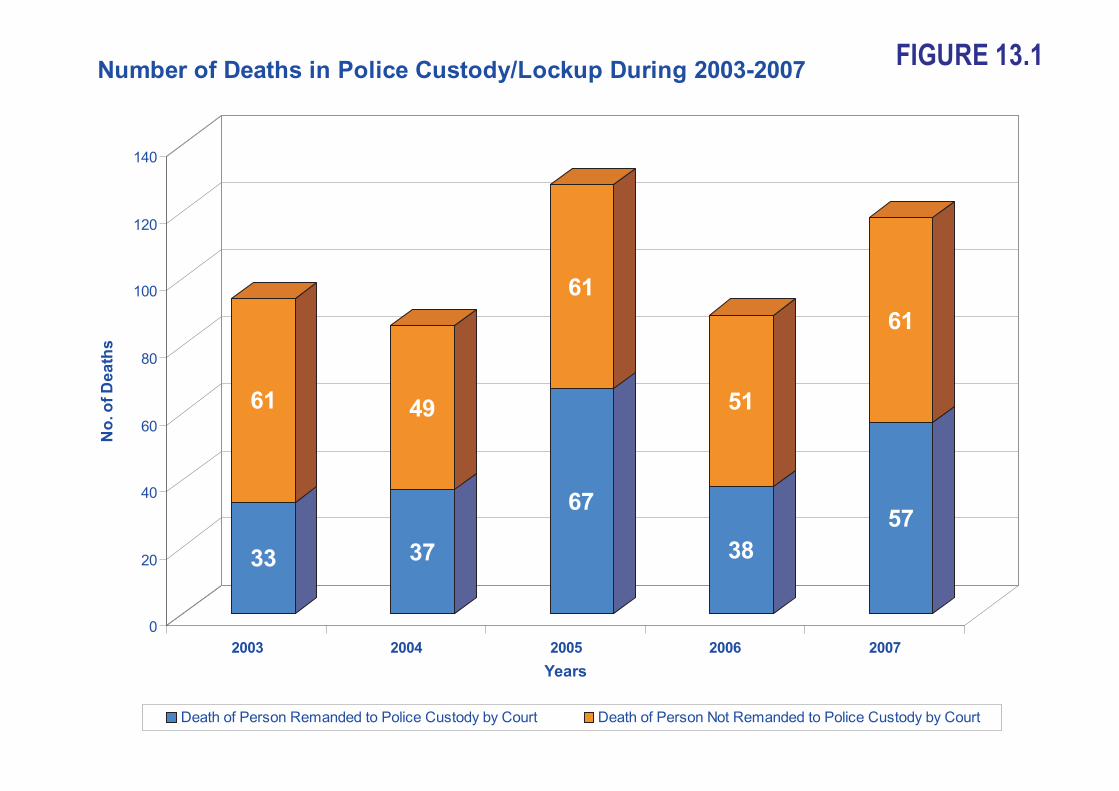
33
61
37
49
67
61
38
51
57
61
0
20
40
60
80
100
120
140
No
.o
fD
ea
ths
2003 2004 2005 2006 2007
Years
Number of Deaths in Police Custody/Lockup During 2003-2007
Death of Person Remanded to Police Custody by Court Death of Person Not Remanded to Police Custody by Court
FIGURE 13.1

20032004
20052006
2007
0
200
400
600
800
1000
1200
1400
1600
Nu
mb
er
Years
Escapees from Police Custody During 2003 - 2007
No. of Cases Registered (U/S 224, 225b) No. of Persons Escaped in Above Cases
FIGURE 13.2

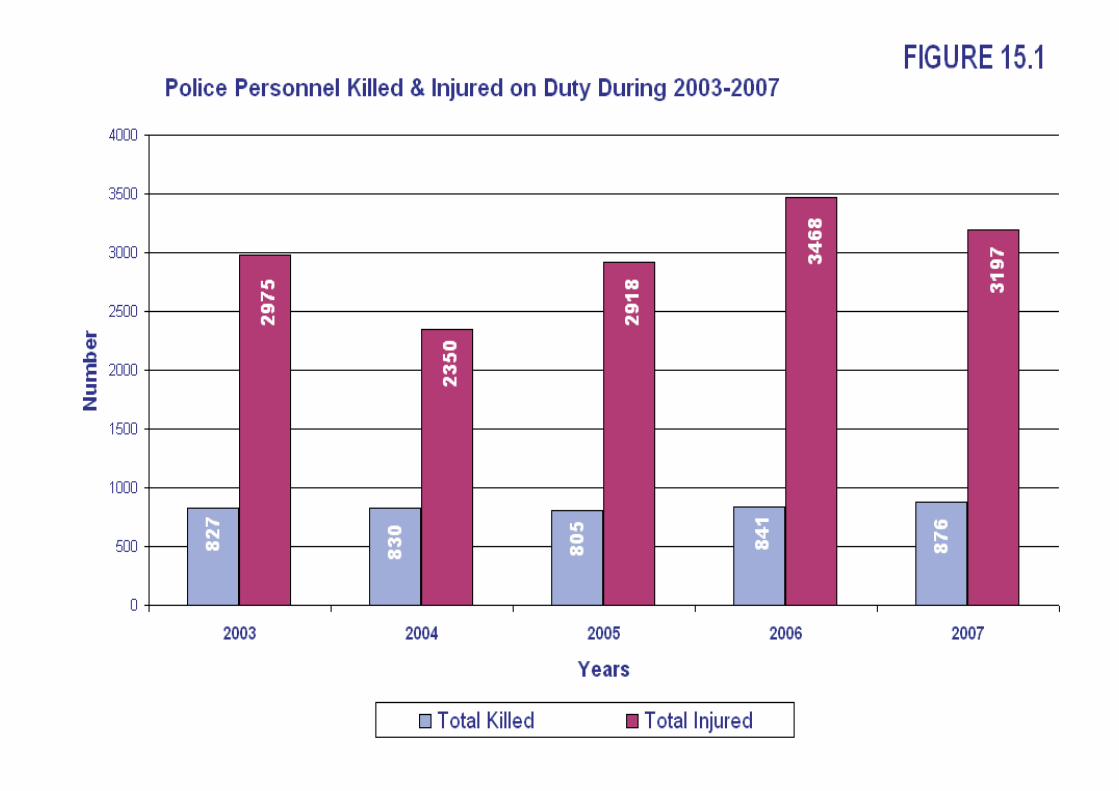
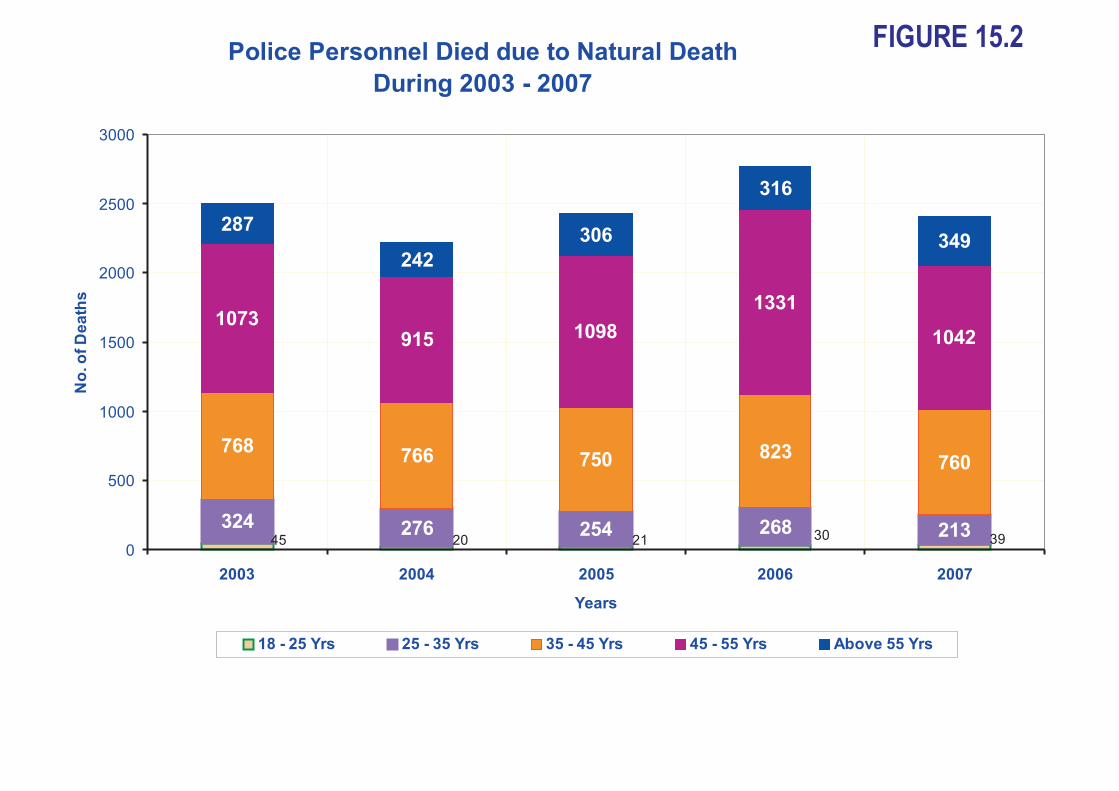
Police Personnel Died due to Natural Death
During 2003 - 2007
324 276 254 268 213
768766 750 823
760
1073915 1098
1331
1042
287
242
306
316
349
39302120450
500
1000
1500
2000
2500
3000
2003 2004 2005 2006 2007
Years
No
.o
fD
ea
ths
18 - 25 Yrs 25 - 35 Yrs 35 - 45 Yrs 45 - 55 Yrs Above 55 Yrs
FIGURE 15.2
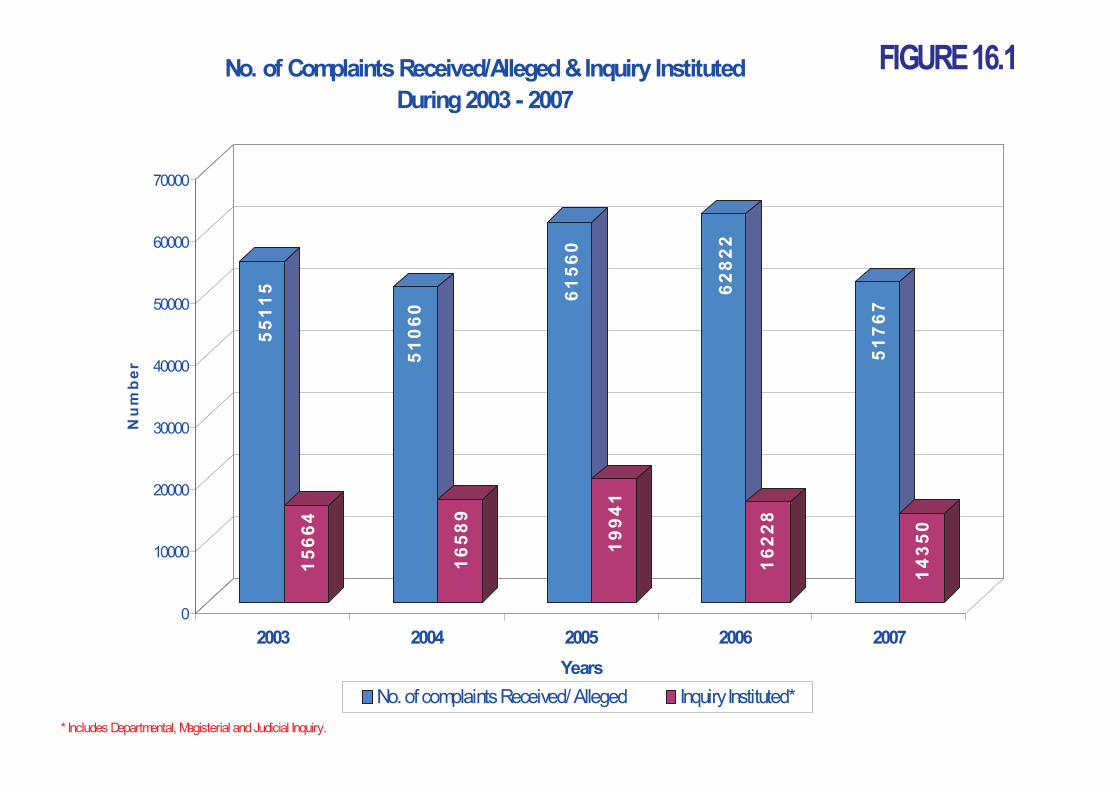
55
11
5
15
66
4
51
06
0
16
58
9
61
56
0
19
94
1
62
82
2
16
22
8
51
76
7
14
35
0
0
10000
20000
30000
40000
50000
60000
70000
Nu
mb
er
2003 2004 2005 2006 2007
Years
No. of Complaints Received/Alleged&Inquiry Instituted
During2003 - 2007
No.ofcomplaintsReceived/Alleged InquiryInstituted*
* Includes Departmental, Magisterial andJudicial Inquiry.
FIGURE16.1
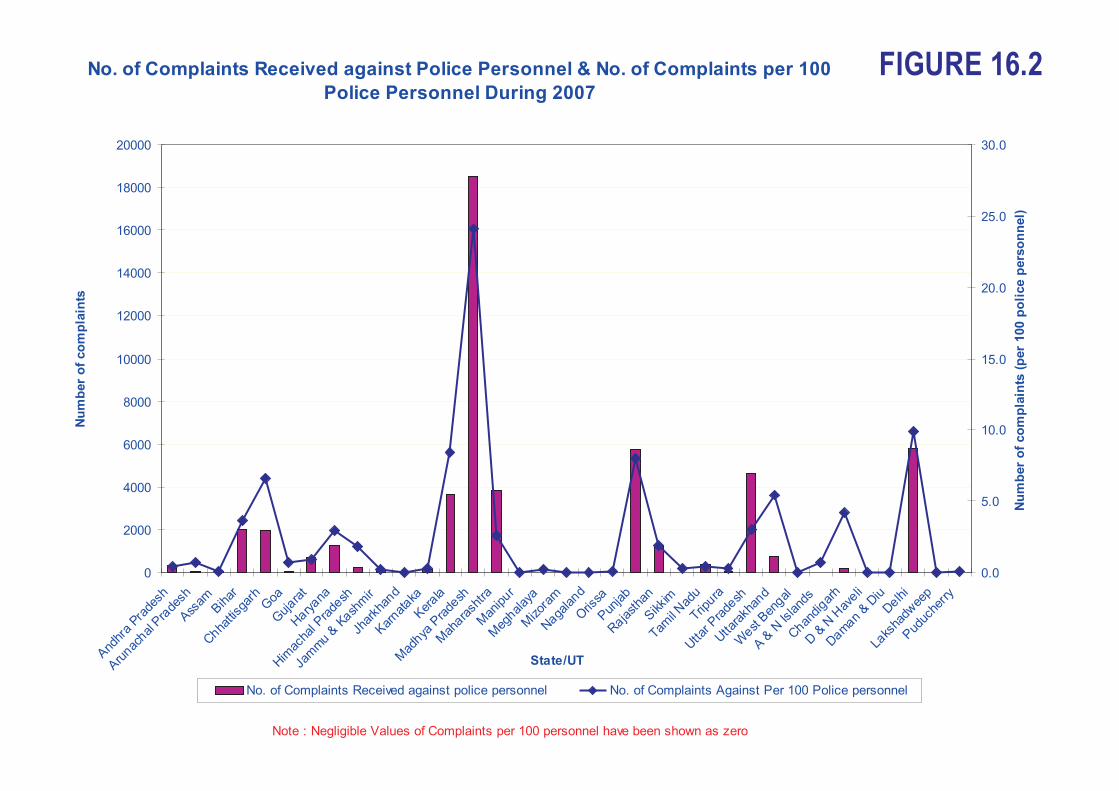
No. of Complaints Received against Police Personnel & No. of Complaints per 100
Police Personnel During 2007
0
2000
4000
6000
8000
10000
12000
14000
16000
18000
20000
And
hra
Prade
sh
Aru
nachal
Pra
desh
Ass
amB
ihar
Chha
ttisg
arh
Goa
Guj
arat
Hary
ana
Him
acha
l Pra
desh
Jam
mu
&Kash
mir
Jhar
khan
dK
arnat
akaK
erala
Mad
hyaP
rade
sh
Mah
arash
traM
anip
ur
Meg
halay
aM
izor
amN
agala
ndO
rissa
Pun
jab
Raja
stha
nS
ikki
mTam
ilN
adu
Tripura
Utta
r Pra
desh
Utta
rakh
and
West
Ben
gal
A&
NIs
land
s
Chan
digar
h
D&
NH
aveli
Dam
an&
Diu
Delh
i
Laks
hadw
eep
Pud
uche
rry
State/UT
Nu
mb
er
of
co
mp
lain
ts
0.0
5.0
10.0
15.0
20.0
25.0
30.0
Nu
mb
er
of
co
mp
lain
ts(p
er
100
po
lice
pers
on
nel)
No. of Complaints Received against police personnel No. of Complaints Against Per 100 Police personnel
Note : Negligible Values of Complaints per 100 personnel have been shown as zero
FIGURE 16.2

93.2
134
95.5
134
97.1
135
98.7
134
100.2
129
102.7
127
105.1
125
106.8
123
108.6
123
110.3
122
112.0
126
113.7
125
0.0
20.0
40.0
60.0
80.0
100.0
120.0
140.0
1996 1997 1998 1999 2000 2001 2002 2003 2004 2005 2006 2007
Year
Population, Ratio of Police Personnel
during 1996 to 2007
Population (in 10 million) Ratio Ratio : No. of Policemen per lakh of population
FIGURE 17.1
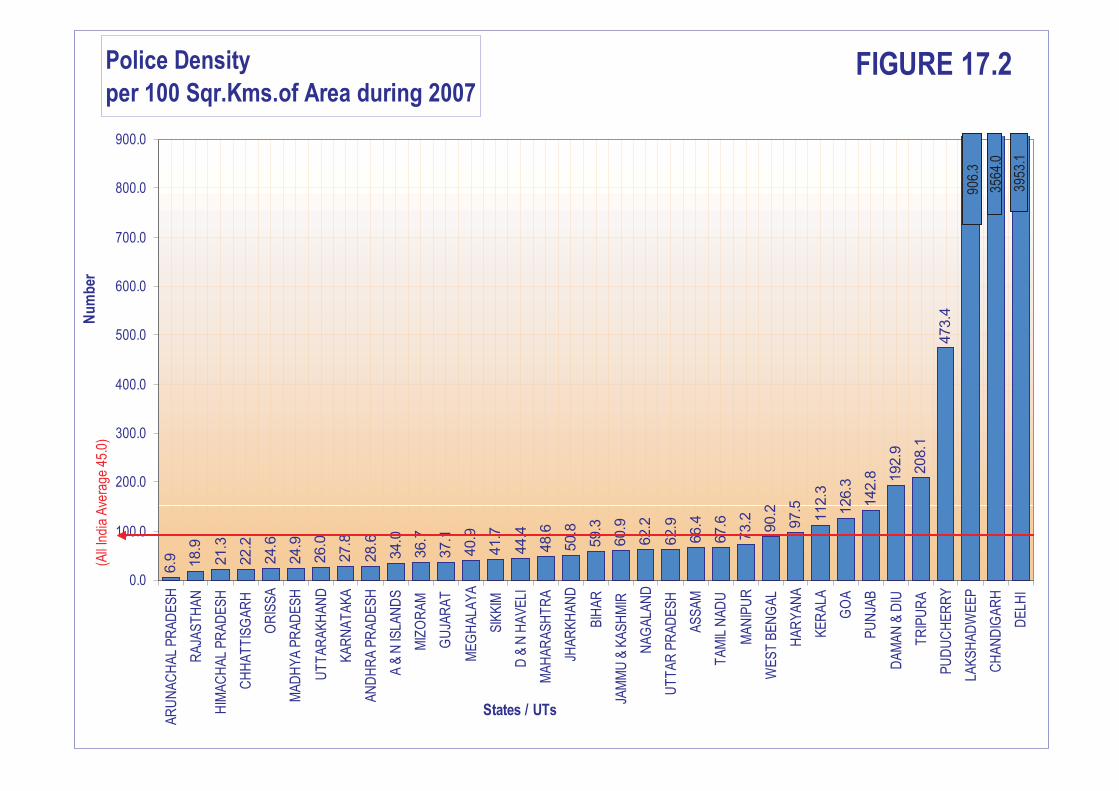
Police Density
per 100 Sqr.Kms.of Area during 2007
6.9 18.9
21.3
22.2
24.6
24.9
26.0
27.8
28.6
34.0
36.7
37.1
40.9
41.7
44.4
48.6
50.8
59.3
60.9
62.2
62.9
66.4
67.6
73.2
90.2
97.5
112.3
126.3
142.8 1
92.9
208.1
473.4
0.0
100.0
200.0
300.0
400.0
500.0
600.0
700.0
800.0
900.0
AR
UN
AC
HA
LP
RA
DE
SH
RA
JAS
TH
AN
HIM
AC
HA
LP
RA
DE
SH
CH
HA
TT
ISG
AR
H
OR
ISS
A
MA
DH
YA
PR
AD
ES
H
UT
TA
RA
KH
AN
D
KA
RN
AT
AK
A
AN
DH
RA
PR
AD
ES
H
A&
NIS
LAN
DS
MIZ
OR
AM
GU
JAR
AT
ME
GH
ALA
YA
SIK
KIM
D&
NH
AV
ELI
MA
HA
RA
SH
TR
A
JHA
RK
HA
ND
BIH
AR
JAM
MU
&K
AS
HM
IR
NA
GA
LAN
D
UT
TA
RP
RA
DE
SH
AS
SA
M
TA
MIL
NA
DU
MA
NIP
UR
WE
ST
BE
NG
AL
HA
RY
AN
A
KE
RA
LA
GO
A
PU
NJA
B
DA
MA
N&
DIU
TR
IPU
RA
PU
DU
CH
ER
RY
LAK
SH
AD
WE
EP
CH
AN
DIG
AR
H
DE
LHI
States / UTs
Nu
mb
er(A
llIn
dia
Ave
rage
45.0
)
906.
3
3564
.0
FIGURE 17.2
3953
.1

Cyber Crimes / Cases Registered and Persons Arrested
under IT Act during 2004-2007
2
26
34
0
6
10
74
88
1
5
10
59
69
0 0
11
76
99
4
9
0
20
40
60
80
100
120
Tam
peri
ng
Hackin
g
Ob
scen
ce
pu
blicati
on
/tra
nsm
issio
n
Failu
re
Bre
ach
of
co
nfi
den
tiality
2004 2005 2006 2007
0
32
21
0
7
10
41
125
0
13
8
63
81
0 02
48
86
1 3
0
20
40
60
80
100
120
140
Tam
peri
ng
Hackin
g
Ob
scen
ce
pu
blicati
on
/tra
nsm
issio
n
Failu
re
Bre
ach
of
co
nfi
den
tiality
2004 2005 2006 2007
Cases Registered Persons Arrested
FIGURE 18.1

Cyber Crimes / Cases Registered and Persons Arrested
under IPC during 2004 - 2007
0 0 0
77
173
29
0 0 0
48
186
68
0 0 0
160
90
61
0 0 0
217
73
49
0
50
100
150
200
250
Public
Serv
ant
Offences
by/A
gain
st
Fals
eele
ctr
onic
evid
ence
Destr
uctio
nof
ele
ctr
onic
evid
ence
Forg
ery
Crim
inalB
reach
of
Tru
st/F
raud
Counte
rfeiti
ng
2004 2005 2006 2007
0 0 0
81
18
1
67
0 0 0
71
21
5
91
0 0 0
19
4
12
1
96
0 0 0
26
4
85
80
0
50
100
150
200
250
300
Public
Serv
ant
Offences
by/A
gain
st
Fals
eele
ctr
onic
evid
ence
Destr
uctio
nof
ele
ctr
onic
evid
ence
Forg
ery
Crim
inalB
reach
of
Tru
st/F
raud
Counte
rfeiti
ng
No
.of
Ca
se
s
2004 2005 2006 2007
Cases Registered Persons Arrested
FIGURE 18.2

Incidence of IPC Crimes Reported
by Govt. Railway Police (GRP)
20078
19498
19163
18600
18800
19000
19200
19400
19600
19800
20000
20200
Inc
ide
nc
e
2005 2006 2007
Year
Percentage of Incidence of Various IPC Crimes
Reported by GRP During 2005
Note : Other IPC Crimes in Railw ays include figures of Kid. & Abduction (0.5%);
Attempt to Commit Murder (0.4%); Causing Death by Negligence (0.4%);
Rape (0.2%); C.H. Not Amounting to Murder (0.1%); Arson (Negligible).

Murder
1.2%
Riots
0.8%
Robbery,
1.6%
Hurt
2.2%
Preparation & Assembly
for Dacoity
0.2%Burglary
0.4%
Dacoity
0.6%
Other IPC Crimes
28.8%
Theft
64.1%
Theft Other IPC Crimes Hurt Robbery Murder Riots Preparation & Assembly for Dacoity Burglary Dacoity
0
500
1000
1500
2000
2500
3000
3500
Inc
ide
nc
e
AN
DH
RA
PR
AD
ES
H
AS
SA
M
BIH
AR
CH
HA
TT
ISG
AR
H
GU
JA
RA
T
HA
RY
AN
A
HIM
AC
HA
LP
RA
DE
SH
JA
MM
U&
KA
SH
MIR
JH
AR
KH
AN
D
KA
RN
AT
AK
A
KE
RA
LA
MA
DH
YA
PR
AD
ES
H
MA
HA
RA
SH
TR
A
OR
ISS
A
PU
NJA
B
RA
JA
ST
HA
N
TA
MIL
NA
DU
UT
TA
RP
RA
DE
SH
WE
ST
BE
NG
AL
DE
LH
IU
T
States/UT
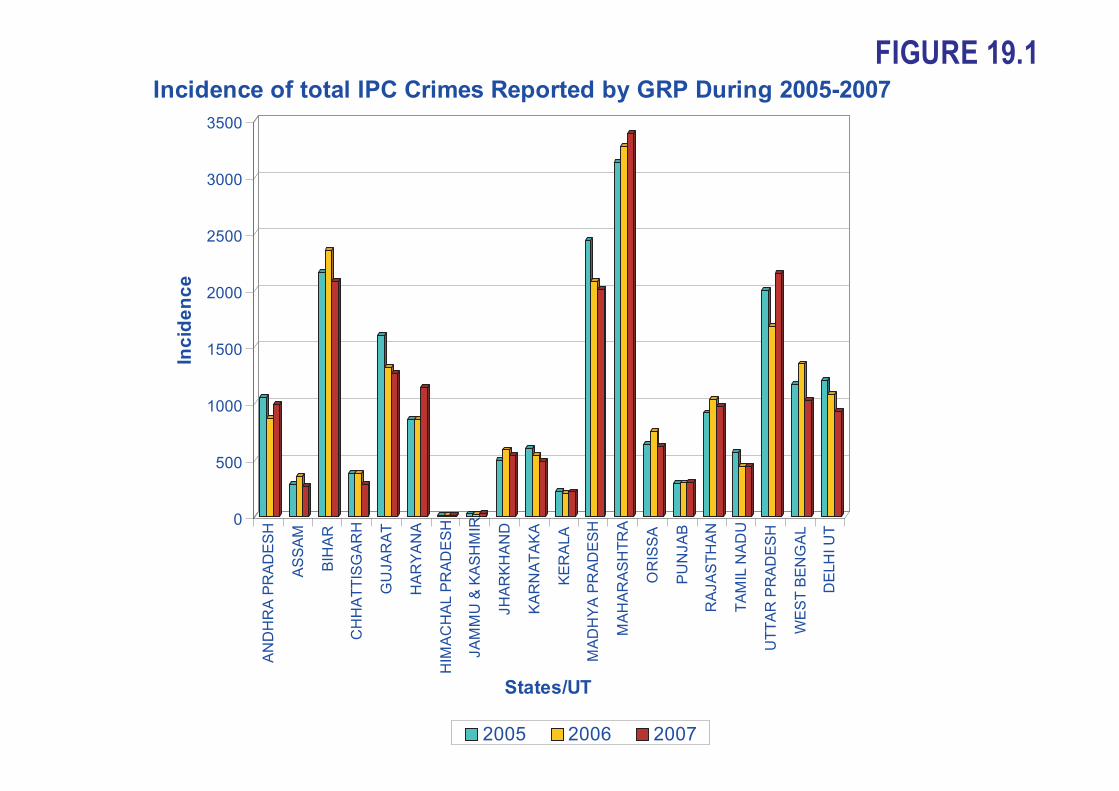
Incidence of total IPC Crimes Reported by GRP During 2005-2007
2005 2006 2007
FIGURE 19.1