Unilateral Multilateralism versus Reciprocity: Impacts of ...

Incentives versus Reciprocity: Insights from a Field Experiment
Doug J. Chung,
Das Narayandas*
June 2016
* Doug J. Chung is an Assistant Professor of Business Administration at Harvard Business School ([email protected]) and Das Narayandas is the Edsel Bryant Ford Professor of Business Administration at Harvard Business School ([email protected]). The authors thank the co-editor, associate editor, and three anonymous reviewers for their constructive feedback during the review process. The authors also thank Teresa Amabile, Saloni Chaturvedi, Suresh Goklaney, Brian Hall, Elizabeth Keenan, Vineet Kumar, Donald Ngwe, Mike Norton, Julio Rotemberg, Marzin Shroff and the conference participants at the 2014 Thought Leadership on the Sales Profession Conference, 2014 ISBM Academic Conference, 2015 Winter Marketing Educator’s Conference, 2015 Sales Force Productivity Conference, 2015 Marketing Science Conference, 2015 Summer Marketing Educator’s Conference, and 2015 Northeast Marketing Conference for their comments and suggestions. Finally, the authors thank Harvard Business School for providing financial support and the anonymous firm for cooperating in this study.
Incentives versus Reciprocity: Insights from a Field Experiment
Abstract
We conduct a field experiment in which we vary the sales force compensation scheme at an
Asian enterprise that sells consumer durable goods. With variation generated by the experimental
treatments, we model sales force performance to identify the effectiveness of various forms of
conditional and unconditional compensation. We account for salesperson heterogeneity by using a
hierarchical Bayesian framework to estimate our model. We find conditional compensation in the
form of quota-bonus incentives to improve performance; however, it may lead to lower future
performance. We find little evidence that effectiveness differs between a quota-bonus plan and a
punitive-bonus plan framed as a penalty for not achieving quota. We find unconditional
compensation in the form of reciprocity to be effective at improving sales force performance only
when given as a delayed reward of which the effectiveness decreases with repeated exposure. We
also find heterogeneity in the impact of compensation on performance across salespeople;
unconditional compensation is more effective for salespeople with high base performance, whereas
conditional compensation is equally effective across all types of salespeople.
Key words: sales force compensation, field experiment, heterogeneity, loss aversion, reciprocity.

1
1 Introduction
Personal selling is a significant part of the world economy. The more than 14 million people
employed in personal selling in the United States alone represent about 10 percent of the entire
U.S. labor force (U.S. Department of Labor, 2012). The number becomes even larger in more
populous countries, with over 65 million people being employed in personal selling in China
(National Bureau of Statistics of China, 2012). The involvement of so many people renders both
strategically important and high investment in the design and management of the sales force.
Averaging about 10% of sales revenues, sales force costs represent the single largest investment for
firms generally, and can amount to as much as 40% of sales revenues for firms in some B2B
industries (Albers and Mantrala, 2008). The $800 billion U.S. businesses spend annually
maintaining their sales forces is 4.7 times the total spending on all media advertising (Steenburgh
and Ahearne, 2012; Zoltners et al., 2013). Such expenditures are a strong motivator of effective
sales force management.
Incentive-based compensation plans are among the most widely deployed instruments used by
management to spur greater effort by the sales force. Such plans vary in complexity, from simple
piece rate schemes for retail salespeople to sophisticated financial instruments for sales agents that
sell big-ticket capital equipment systems and solutions.1
Incentives, although known to increase productivity, are costly to the firm and agent alike,
the former bearing the cost of additional compensation, the latter confronting disutility from
additional effort. The effectiveness of incentives can be more precisely understood only by 1 The term ”incentive-based compensation,” or simply ”incentives,” is hereafter used to denote compensation conditional on meeting a specific criterion.

2
evaluating salespeople’s responses to various incentive schemes. Estimating such models with
naturally occurring data is challenging because a researcher (or firm) typically does not observe
much, if any, variation in the compensation contract, which is typically stationary over the time
horizon of analysis.
There have been recent advances in identification of response to incentives, particularly those
by Misra and Nair (2011) and Chung et al. (2014) where they use variations in sales in response to
sales agents’ distance-to-quota, along with structural estimation methods, to identify the
effectiveness of incentives. However, these methods can only be utilized in response to quota-based
plans. That is, the incentive plan must have a cutoff point (quota) such that it provides different
stimuli for agents at different areas of this cutoff (far away from quota; quit, moderately away
from quota; work hard, close to or met quota; reduce effort). Consequently, these methods are
unable to identify the effect of other forms of compensation, such as punitive types of
compensation and unconditional compensation awarded as gifts.
We attempt to circumvent this limitation by conducting a randomized field experiment.
Specifically, we systematically vary, in a controlled environment over multiple time periods, the
compensation scheme of a prominent Indian firm with one of the largest field sales forces in Asia.
Sales response to random variations in treatment conditions enables us to precisely identify the
effectiveness of different forms of compensation. In addition to validating the positive effect of
quota-based bonuses, we seek in the literature on behavioral economics insights that might inform
and enhance the effectiveness of traditional sales force compensation practices. Specifically, we
explore, by investigating the differential effects, if any, of normal versus punitive forms of

3
compensation on the performance of individual sales agents, whether agents’ reference-dependent
preferences behavior is consistent with the notion of loss aversion (as defined by Kahneman and
Tversky, 1979; Tversky and Kahneman, 1991). Furthermore, we empirically examine the
effectiveness of unconditional compensation to test the theory of gift exchange (Adams, 1963) that
assumes a positive relation between effort and wages whereby a salesperson reciprocates to higher
wages with higher levels of effort; a different behavior than the self-interested behavior outcome
predicted in agency theory.
Overall, we uniquely contribute to the sales force management literature in several ways.
First, we conduct a multi-period field experiment by exogenously changing the compensation plan
over time, which, to the best of our knowledge, is the first ever to be conducted over actual full-
time salespeople in a real selling environment at such a grand scale. Second, we validate the
effectiveness of quota-based bonus plans that are routinely adopted in practice across a broad
range of industries. Third, we test the effectiveness of other forms of compensation, specifically
punitive and unconditional compensation that are based on prescriptions from the field of
Behavioral Economics. Fourth, we investigate the long-term effect of conditional and unconditional
compensation. Finally, we examine the heterogeneous effects of various forms of compensation on
sales productivity across individual salespeople.
We conducted the field experiment with an Indian company of national scale across four
cities. We collected weekly sales data from 80 full-time salespeople for a period of six months, with
each regional sales force under a different compensation scheme across multiple time periods. The
primary form of (conditional) incentive compensation was a quota-bonus plan whereby a lump-

4
sum bonus was awarded at the end of each week if a preset quota was met. The conditional
compensation category included three different treatment conditions: bonus, punitive, and real-
punitive. The bonus condition was where we gave a bonus payment after a salesperson met a
weekly sales quota, similar to standard bonus compensation schemes. The punitive condition was
identical to the bonus condition except that not being paid the bonus was framed to the sales rep
as a penalty for not achieving quota. In the real-punitive condition, the bonus amount was
awarded at the start, but if the quota was not met, it was withdrawn at the end of the period.
Our two treatment conditions in the unconditional compensation form, whereby monetary
payments were made irrespective of sales performance, were specified as gift and real-gift
conditions. In the gift condition, the treatment condition was communicated at the start, and
payment was made at the end of the period. In the real-gift condition, salespeople were
simultaneously informed of and awarded the payment at the start of the period. We randomized
each regional sales force to be in different conditions at different times throughout the
experimental period.
People being known to differ in response to stimuli, we anticipated, in our context, substantial
variation in salespeople’s responses to the various compensation schemes. Individual heterogeneity
thus had to be taken into account in modeling salesperson behavior. Significant advances have
recently been made in estimation methodology dealing with individual heterogeneity. The most
common method is to allow agents to be classified into discrete segments (Kamakura and Russell,
1989; Sriram, et al., 2010). A clear downside of this approach is that it is merely an approximation
of heterogeneity and is inconsistent with the notion that everyone is different. Consequently, a

5
continuous form of heterogeneity through Bayesian analysis has been found to better fit the data
in various studies (Allenby and Rossi, 1999). Thus, we use the Bayesian framework to allow for a
flexible continuous form of heterogeneity in our model.
We find that both conditional and unconditional compensation increase sales force
productivity, but that their mechanisms in inducing effort are different. We find little evidence of
a difference in effectiveness between a quota-bonus and punitive-bonus plan (framed as a penalty
for not achieving quota). The results of our study offer some suggestive indication that while a
punitive-bonus plan can initially induce salespeople to exert marginally higher effort, its
effectiveness tends to decrease and possibly turns negative from multiple exposures. Furthermore,
we find that conditional compensation can potentially demotivate salespeople from exerting effort
in future periods. We also find that unconditional compensation improves sales force performance
in the form of reciprocity, which supports the prescriptions of the theory of gift exchange. The
magnitude of effectiveness is, however, on average, only half that observed for the conditional
compensation plan. We further find that unconditional compensation is effective only when
distributed as a delayed reward, and that its effectiveness decays with time.
As expected, our results show that salespeople are heterogeneous in response to various
compensation plans. For example, we find unconditional compensation to be more effective for
salespeople with high base performance and conditional compensation to be equally effective
across all types of salespeople.
6
The rest of the paper is organized as follows. Section 2 summarizes the related literature. We
explain the institutional details and experimental design in Section 3. We present the model and
empirical estimation in Section 4. We discuss the results in Section 5. Section 6 concludes.
2 Related Literature
Figuring out how firms can use incentives to motivate improvements in employee performance
has long been a focus of both theory and practice (Paarsch and Shearer, 1999, 2000; Lazear, 2000;
Copeland and Monet, 2009). Broadly, our research is situated in the vast stream of literature on
the functioning of incentives as a motivational mechanism. We contribute specifically to the sub-
field of sales compensation in the sales force management literature.
The design of sales force compensation plans has become one of the most visible and
successful applications of agency theory in real-world business settings (Mantrala et al., 1994).
Early research in sales force compensation focused on the development of conceptual theory,
mainly using the principal agent framework (Holmstrom, 1979). Specifically, this stream of
research focuses on efficacy, mostly on the design of an optimal compensation plan coinciding with
the proportion of fixed versus variable pay, assuming rational behavior of salespeople (Basu et al.,
1985; Lal and Srinivasan, 1993; and Rao, 1990). Correspondingly, the bulk of the early empirical
work has centered on validating theoretical predictions using aggregate data (Coughlan and Sen,
1986; John and Weitz, 1989; Coughlan and Narasimhan, 1992; Misra et al., 2005), and individual
cross-sectional survey data (Lal et al., 1994), again, focusing on the proportion of fixed pay to
total compensation.

7
Although firms remain tentative about sharing confidential compensation-related data,
researchers have begun to collaborate with firms and have analyzed data at the salesperson level
to investigate the effect of timing (Steenburgh, 2008), ratcheting (Misra and Nair, 2011), and
heterogeneous effects of compensation (Chung et al., 2014), again, using the agency theory
framework that assumes salespeople are fully rational with regard to their future expectations and
compensation structure. Recent research in behavioral economics and marketing have questioned
this rationality assumption and have looked into other behavioral aspects of salesforce
performance that are not explainable using the traditional agency theory framework. For example,
Ahearne et al. (2015) find that the punitive threat of replacement from a backup salesforce leads
to positive productivity. Similarly, Ying et al. (2013) find emotions in the form of pride and
disappointment affect sales effort, and Lim (2010) and Chen et al. (2011) find reference dependent
preferences in social settings to influence productivity (social loss aversion) in sales contest
settings.
Kahneman and Tversky’s (1979) Prospect Theory holds that an agent derives utility relative
to a reference point and not in absolute terms. Loss aversion, the notion that losses loom larger
than gains, is widely observed and known to be the cause of such economic anomalies as the
endowment effect (Thaler, 1980) and status-quo bias (Samuelson and Zeckhauser, 1988). Studies
of the impact of punitive compensation on agent performance across diverse domains include, in
economics, Herweg et al.’s (2010), Macera’s (2013), and Köszegi and Rabin’s (2006) examinations
of the optimality of contracts, assuming loss-averse agents, and, in the fields of marketing,

8
psychology, and behavioral economics, Dhar and Goldsmith’s (2013), Heath et al.’s (1999), and
Levitt et al.’s (2013) investigations of the impact of incentives framed as a loss.
Hence, in addition to validating the effectiveness of a quota-bonus compensation scheme
(Steenburgh, 2007; Chung et al., 2014), we examine, in this study, an incentive structure in light of
the foregoing streams of literature in an attempt to gain insight into the effect of punitive forms of
incentives that link compensation to a punishment cause in the arena of salesforce compensation.
Among commonly used real-world incentive contracts framed in a punitive form are contracts
where an upfront total compensation amount is guaranteed only on the condition that a certain
standard of performance is met. Incentive contracts in the professional services and sports sectors,
for example, are often presented in terms of total compensation, only a fraction of which is
guaranteed. In 2012, for example, Drew Brees signed a five-year, $100 million contract with the
New Orleans Saints, only $60 million of which was guaranteed.
Beyond looking at the effect of punitive forms of incentives, we also investigate the impact of
unconditional gifts, offered in addition to the expected level and form of compensation, that are
intended to intrinsically motivate sales agents to perform better. Firms commonly exceed the
market-clearing wage in employee salaries. The efficiency wage hypothesis in labor economics
maintains that wages are determined by more than simply supply and demand, and that
employees reciprocate higher wages from their employers with greater effort (Leibenstein, 1957;
Solow, 1979). This is claimed to also partly explain involuntary unemployment, which would be
nonexistent under frictionless neoclassical economies.

9
The principal sociological explanation for the efficiency wage hypothesis is that the agent is
motivated, even in the absence of monetary incentives, to exert, in return for a gift that elevates
the expected wage, effort that exceeds the minimum required (Akerlof, 1982; Akerlof and Yellen,
1988, 1990; Fehr et al., 1993). This contrasts with the neoclassical view that firms try to extract
every penny’s worth of surplus in return for which agents, as purely selfish individuals, exert the
least possible level of effort. Kube et al. (2012) and Gneezy and List (2006) have explored, in the
behavioral economics literature, the effect of monetary and non-monetary gift exchanges on worker
productivity, and substantial research in sales on the use of behavior- and outcome-based sales
force control systems has examined, among other factors, the impact of intrinsic motivation on
sales agent performance (Churchill et al., 1985; Anderson and Oliver, 1987; Challagala and
Shervani, 1996).
Another stream of research related to ours is that of motivation, both intrinsic and extrinsic.
People can be motivated because they value an activity or because of external cues. Intrinsic
motivation captures the former, i.e., the desire to perform because of the interest and enjoyment of
the task itself (in our case, selling), whereas extrinsic motivation indicates the latter, i.e., wanting
to perform because of a desired outcome such as conditional rewards (Ryan and Decai, 2010).
While intrinsic motivation can be long-lasting and self-sustaining, it takes a long time to develop,
and thus, in the sales force domain, extrinsic motivation via performance incentives is commonly
used. One of the shortcomings of performance incentives is that it may crowd out intrinsic
motivation. This has been found in lab studies (Deci et al., 1999) and we also find this to be true
in our field study as past conditional compensation is found to decrease future performance.

10
There being limited variation in the compensation contract, the standard method of
identification is to rely either solely on variation generated by economic assumptions, or on a
single regime change that likely is endogenous to the characteristics of agents and firms. Also,
most experimental research has been primarily lab-based or survey-based that, by design, has
focused on imaginary choices rather than actual choices. Even the few studies that have used field
data have relied on observations of temporary employees specifically hired for the experimentation
of a known hypothesis (for example, Kube et al., 2012; Gneezy and List, 2006), thus raising the
question of whether the findings might be generalizable in real-world working environments.
A randomized field experiment conducted on full-time, permanent employees that generates
exogenous variation in the data collection process is more suitable to gauge the effectiveness of
compensation plans, and recent research in a number of fields has taken an important step in this
direction. Hossain and List (2012), for example, employ a field experiment in a Chinese factory to
explore framing effects in an operational production setting, and Fryer et al. (2012) explore in a
field experiment, set in a Chicago suburb school district, the impact on student achievement scores
of a one-time change in teacher incentives framed as losses and gains.
The key difference from these prior studies and our study is the venue of the field experiment.
While factory workers and teachers are usually not compensated based on performance, it is well-
known that salespeople have a strong appetite for performance-based monetary compensation.
Furthermore, for a typical selling firm, the variable components in sales force compensation act as
primary motivating instruments that align the goals of the firm with those of its employees and,
thus, are of crucial strategic importance. The magnitude of these variable components as a
11
percentage of the overall sales force compensation is evidence for the importance that firms place
on these components of compensation.
In the sales force domain, although not an experimental study, Misra and Nair (2011) use
field data to validate the prediction accuracy of their model. In addition, Viswanathan et al.
(2015) use a field intervention to investigate the effectiveness of cash versus non-cash
compensation. We believe the use of field experiments, interventions, and validations will provide
the much needed bridge between theory and practice and can be a valid means to better
understand the effectiveness of sales force compensation. In this study, we take a modest step in
this direction and contribute to research in sales force compensation by conducting a large-scale
randomized field experiment that systematically varies the compensation scheme over multiple
periods using full-time salespeople in a real-world working environment.
3 Institutional Details and Experimental Design
The focal firm, an Indian enterprise highly regarded within that country, manufactures and
sells consumer durable goods. Its more than 5,000 person sales force is responsible for selling
multiple product lines, including water/air purifiers, vacuum cleaners, security systems, and
ancillary services. The 13-week field experiment, implemented during the second half of 2013 in
four urban cities, Delhi, Bangalore, Mumbai, and Hyderabad, involved 80 full-time salespeople.
Salespeople by region were assigned different compensation conditions on a weekly basis. Weekly
sales data acquired under the different compensation schemes being supplemented with 13 weeks

12
of individual sales data collected during the pre- and within-experimental periods with no
compensation conditions, the total duration of the experiment was approximately six months.
3.1 Experimental Design
Variation in compensation revolved largely around two treatments, which we defined as the
incentive and reciprocity conditions (see Figure 1 for an outline of compensation conditions). In
the incentive condition, salespeople had to meet a preset weekly quota to receive payment, and
thus, a conditional compensation plan, whereas the reciprocity condition was payment given to
salespeople as a gift, regardless of their weekly performance, and thus, unconditional
compensation. Furthermore, we created three subcategory treatment conditions within the
incentive condition that we specified as the bonus, punitive, and real-punitive conditions.
Salespeople in the bonus condition were told that they would receive a lump-sum cash payment if
the number of units sold at the end of the week met a preset quota. This is similar to bonus
compensation plans widely used by many real-world firms. Salespeople in the punitive condition
were told that they would receive a payment at the end of the week, which would be withdrawn if
the weekly quota had not been met. The bonus and punitive condition were thus identical in
terms of condition and payment, but only framed differently when presented to the salespeople.
Salespeople in the real-punitive condition received a cash payment at the start of the week, which
had to be returned if they didn’t make the quota, and thus, the timing of payment was different
than the bonus and punitive conditions. Our framing manipulation was meant to vary the level of
a reference point—only the existing compensation for the bonus condition and existing
13
compensation plus bonus for the punitive condition. That is, in the bonus condition, the
compensation obtained from reaching quota would be an additional reward on top of the firm’s
normal pay, whereas, in the punitive condition, this compensation would be something that is the
salesperson’s to lose. The real-punitive condition can, therefore, be thought of as the most extreme
case of loss-framed incentives. Interestingly, the head of the field sales and many regional
managers of the focal firm predicted the real-punitive condition to be the most effective at
increasing sales.
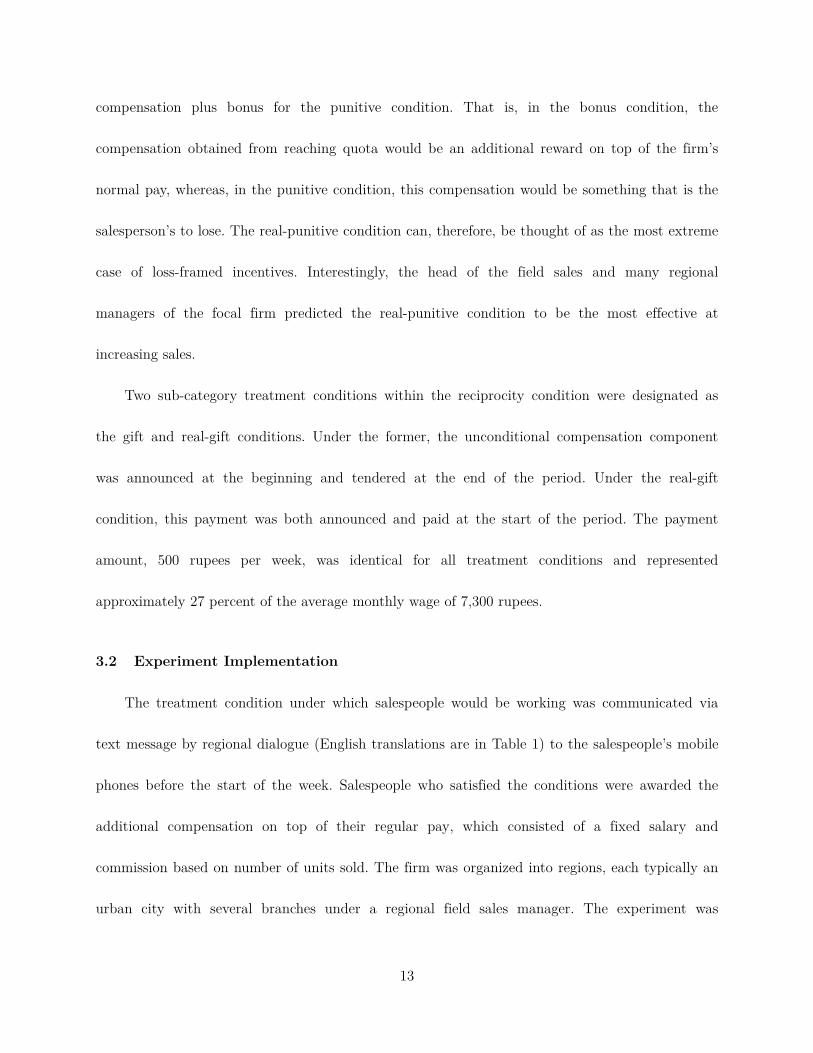
Two sub-category treatment conditions within the reciprocity condition were designated as
the gift and real-gift conditions. Under the former, the unconditional compensation component
was announced at the beginning and tendered at the end of the period. Under the real-gift
condition, this payment was both announced and paid at the start of the period. The payment
amount, 500 rupees per week, was identical for all treatment conditions and represented
approximately 27 percent of the average monthly wage of 7,300 rupees.
3.2 Experiment Implementation
The treatment condition under which salespeople would be working was communicated via
text message by regional dialogue (English translations are in Table 1) to the salespeople’s mobile
phones before the start of the week. Salespeople who satisfied the conditions were awarded the
additional compensation on top of their regular pay, which consisted of a fixed salary and
commission based on number of units sold. The firm was organized into regions, each typically an
urban city with several branches under a regional field sales manager. The experiment was

14
implemented in one branch in each region, and thus, in sum, salespeople in four regions—
Bangalore, Delhi, Hyderabad, and Mumbai—participated in the field experiment.
The treatment conditions were randomized by branch (and therefore, a region) so as to avoid
the “water cooler effect” that may motivate or demotivate salespeople within a branch.2 To
mitigate learning effects, we further limited the experiment to salespeople who had been with the
firm for more than two years.3 We specified as the base condition a two-week pre-experimental
period and several treatment-free periods during the course of the experiment, during which
salespeople were observed. A timeline of the different conditions by region is provided in Table 2.
As previously mentioned, we began by observing salespeople without any treatment
conditions for two weeks (base condition in the first two columns of Table 2 for all regions). Next,
we assigned different conditions across the four branches but maintained the same condition for
four consecutive weeks within each branch—bonus, punitive, real-punitive, and gift for Bangalore,
Delhi, Hyderabad, and Mumbai, respectively. We had four consecutive initial conditions in order
to check whether there would be any miscommunications or major flaws in each of the treatment
conditions (weeks 3 – 6).4 Next, we randomly chose conditions for each city but implemented them
for two weeks (weeks 7 and 8) instead of four. We repeated this exercise for weeks 9 and 10—that
2 The “water cooler effect,” the phenomenon of employees gathering around the office water cooler to talk, here references the flow of information that might influence salespeople’s motivation, and thus, the effect-size of the experimental treatments. We avoid this disturbance by assigning every salesperson within a branch (and thus, a region) the same treatment condition at a particular time. 3 Firm management provided this guideline for avoiding noise generated by on-the-job training or learning effects. 4 Because we only had the option of conducting the field experiment at four branches, we were limited to start with four treatment conditions. We chose the bonus, punitive, real-punitive, and gift as the initial conditions.

15
is, we randomly chose conditions and implemented them for two consecutive weeks.5 We then took
a break from the experiment for about two months (weeks 13–22), and afterwards, randomized
over the treatment conditions on a weekly basis throughout the remainder of the experiment
(weeks 23–26).6
Salespeople were told to keep their treatment conditions confidential and were unaware that
an experiment was in progress. Management assisted, prior to the experiment, with setting weekly
quotas based on prior performance data. Quotas were set to be 20 percent higher than what a
salesperson would normally sell. To ensure proper execution, a full-time research assistant was
present at the firm’s headquarters to check on the status of the experiment, and weekly conference
calls were held with field sales managers and the senior marketing manager of the retail consumer
division.
The subjects of the field experiment were salespeople in the retail sales division. Although
these salespeople were employed and compensated by the focal firm, they physically went to work
for a retail store where they were responsible for the sales of the firm’s water purification devices.
The mobile text messages that informed salespeople of the details of the specific condition under
which they would receive additional compensation were sent on Sunday afternoons before the start
of the work week. Salespeople assigned to a base condition did not receive a text message. Sales
were reported to their appropriate branch office at the end of each workday. Regional and branch
5 We also wanted to have two weeks of the same condition in weeks 11-12 but due to miscommunications between the focal firm’s sales headquarters and local operations, no treatment conditions were implemented in week 11. 6 We took a break for several reasons. First, the firm wanted to take a break because of firm circumstances. Second, we wanted to have several periods with no compensation conditions (base condition) in order obtain enough observations to precisely identify the base level of sales. Finally, we wanted to test for any changes in the effects of incentives and gifts over time.

16
field sales managers routinely visited the retail stores and periodically conducted independent
checks of sales volumes by salesperson and store-level inventory. No instances of misreporting of
sales volumes were observed across all salespeople over the entire six-month period.
3.3 Aggregate Analysis and Seasonality
Table 3 reports average unit sales per week under the different treatment conditions. It
appears that the real-punitive condition, on average, outperforms all other conditions, recording
the highest level of sales, and that both reciprocity conditions (gift and real-gift) have an effect,
increasing sales relative to the baseline. There appears to be no difference between the bonus and
base conditions.
Table 3 merely provides a basic overview of the effects of different compensation conditions.
Being durable goods, the products being sold are naturally subject to potential differences in
seasonal demand, which may be reflected in sales figures for different periods of the experiment.
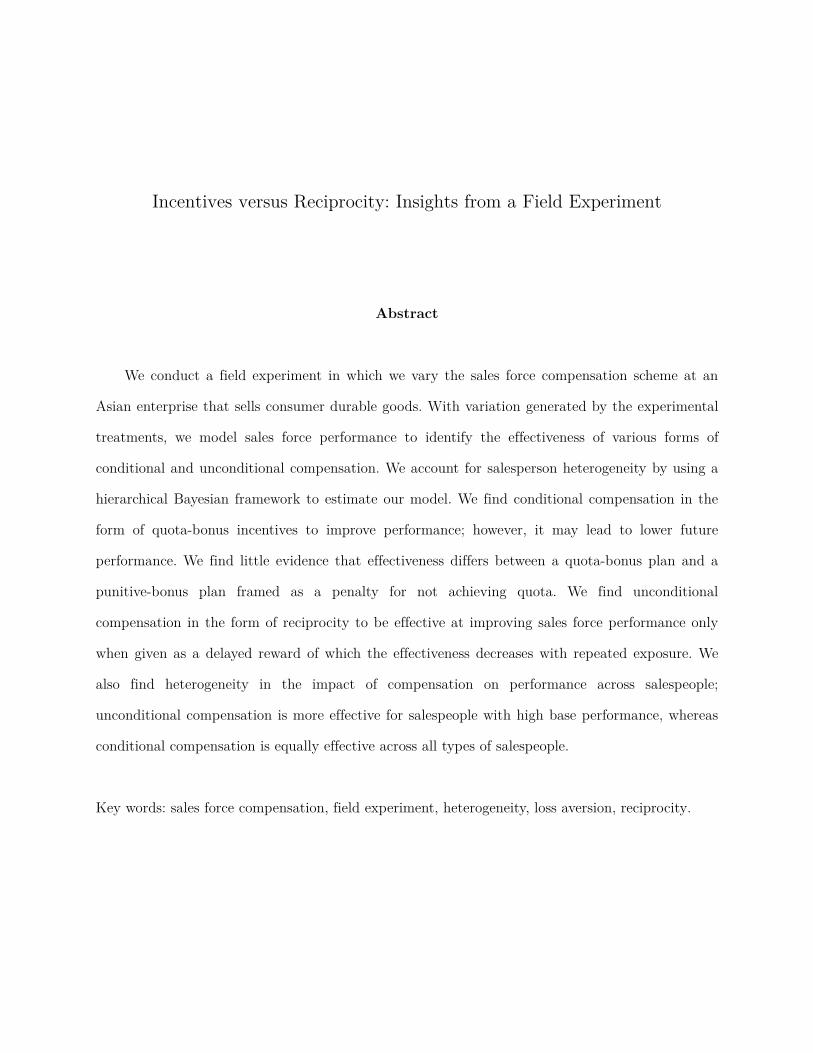
Figure 2 reports, by region, average unit sales for salespeople in other branches who have the same
characteristics as salespeople who participated in the experiment—that is, those who have been
with the firm for more than two years—but who did not take part in the experiment. As expected,
demand fluctuations are observed over time. These patterns, though similar, exhibit some
differences across regions. Hence, in the proceeding modeling section, to account for temporal
fluctuations in demand by geographical areas, we use the average unit sales of salespeople that
had more than two years’ tenure with the firm and that did not participate in the experiment by
region as a proxy for seasonality.

17
4 Model and Estimation
We model sales Yibt of salesperson i in branch b at time t as a multiplicative function of the
salesperson specific effect xib, branch specific effect ab, the compensation plan xibt, seasonality zibt,
and an idiosyncratic shock eibt such that
( )expit ib b ibt ib ibt ib ibtY x zx a b g e= + + + + (1)
where we assume that shocks eibt are independent and identically distributed across weeks for each
salesperson with zero mean and variance 2ibs . The parameter xib represents unobserved individual
performance that determines base unit sales; the parameter ab represents a branch specific effect
common across all salespeople in branch b; the parameter bib represents the magnitude of the
compensation treatment effects, in other words, the extra effort a salesperson exerts as a result of
additional compensation; and the idiosyncratic shock eibt represents any other elements unrelated
to a salesperson’s effort that affect sales, such as luck (good or bad). As is the case with standard
principal-agent models, neither the firm nor econometrician observes effort, so cannot distinguish
the basis of sales from effort to the idiosyncratic sales shock at any particular period in time.
The vector of compensation plan xibt consists of a series of dummy variables, thus, xibtbib, in
detail, is represented as
1 2 3 - 4 5 -ibt ib ib cibt incentive ib cibt punitive ib cibt real punitive ib cibt gift ib cibt real giftx I I I I Ib b b b b b= = = = == + + + +

18
where the dummy variable Icibt=incentive equals one if compensation condition c for salesperson i in
branch b at time t is the incentive condition (bonus or punitive or real-punitive), and zero
otherwise, and the dummy variables Icibt=gift and Icibt=real-gift equal one if the compensation condition
is the gift and real-gift conditions, respectively. Correspondingly, b1ib represents an increase in
salesperson effort as a result of (conditional) incentives, and b2ib and b3ib show additional effort, if
any, associated with the punitive and real-punitive compensation plans, respectively. Similarly, b4ib
represents additional effort in the form of reciprocity to unconditional compensation when
communicated at the beginning of a period (gift condition), and b5ib denotes additional effort when
the physical timing of the unconditional compensation is shifted towards the start of the period
(real gift condition).7
Notice that our parameters have a subscript i which represents an individual salesperson. We
use a hierarchical Bayesian framework in our estimation to allow for heterogeneity in both
unobserved individual effect xib and the slope parameter bib with regard to various compensation
plans and, thus, we are able to obtain parameters at the individual salesperson level. The major
advantage of this framework is its ability to incorporate an extremely flexible level of continuous
heterogeneity over individuals. We make some standard assumptions, as that the individual
7 We model the two punitive conditions as the difference from the bonus condition and the two unconditional compensation conditions as the difference from the base condition.

19
parameters come from a known population level distribution, and use the log-form of Equation (1)
as the likelihood function for estimation.8 Specifically, the empirical model we estimate is
( ) ( )2log , 0,ibt ibt ib ibt ib ibt ib ibt ibt ibY y x z Na b g e e s= = + + + ,
( )2, 0, ,ib b ib ib bNa a x x s= +
( ) ( )2 20 0, , ,b N Na a s a a s , (2)
( ) ( ), , 0,ib ib ib ib ib MVNb g h hQ = = Q + S
( )2 2 20 0, , 2 , 2ib b Gas s s n k- - - , ( )1
0 0,W r-S Y .
Because individual salespeople in a particular branch share many things in common—managers,
administrative assistance, training, etc.—we assume the individual specific random effects can be
decomposed into two products, a branch specific effect ab common to all salespeople in branch b
and a random individual component xib.9 We assume that these random individual components are
normally distributed with mean zero and branch specific variance 2bs . We model the branch-
specific effects to arise from a common population level distribution with mean a and variance
2s and the population level parameters to come from a normal distribution with hyper-
parameters ( )20 0,a s .
The coefficient Q is a K´1 vector of mean population level parameters and hib is a
salesperson i (from branch b)’s deviation from this mean, which is assumed to be normally
8 To avoid log (zero), we added a constant of one to our outcome variable. 9 We thank an anonymous reviewer for suggesting to control for branch level effects.

20
distributed with mean zero and a variance-covariance matrix of S. We assume the mean parameter
to come from a multivariate-normal distribution with hyper-parameters (m0, S0), and the inverse of
the variance-covariance matrix from a Wishart distribution with hyper-parameters (Y0, r0). We
further assume the salesperson-specific, branch-specific, and population level variances of the sales
shocks to come from an Inverse-Gamma distribution. Details of the conditional posterior
distributions are provided in the appendix.
Identification
We provide a brief and informal discussion about identification. Identification is fairly
straightforward, given that we conducted a randomized field experiment. The main source of
identification comes from variations in the compensation conditions over multiple periods. The
individual specific effect that determines base level sales under the regular compensation scheme,
which helps with identification, is purely identified off the base condition. Similarly, the branch-
specific effect is identified from variations in average sales across branches under the base
condition. The difference in performance between the base condition and the incentive condition
helps us identify the effectiveness of conditional compensation. The difference between the main
effects of the incentive condition and the subcategory conditions, punitive and real-punitive,
identifies the effects of the two punitive forms of compensation. The difference in sales from the
base and the two unconditional compensation conditions—gift and real-gift—identifies the
effectiveness of unconditional compensation as delayed and immediate rewards.

21
5 Results
5.1 Parameter Estimates
We begin by discussing the population level parameters and then assess salespeople’s
heterogeneous responses to different forms of compensation. We then perform several robustness
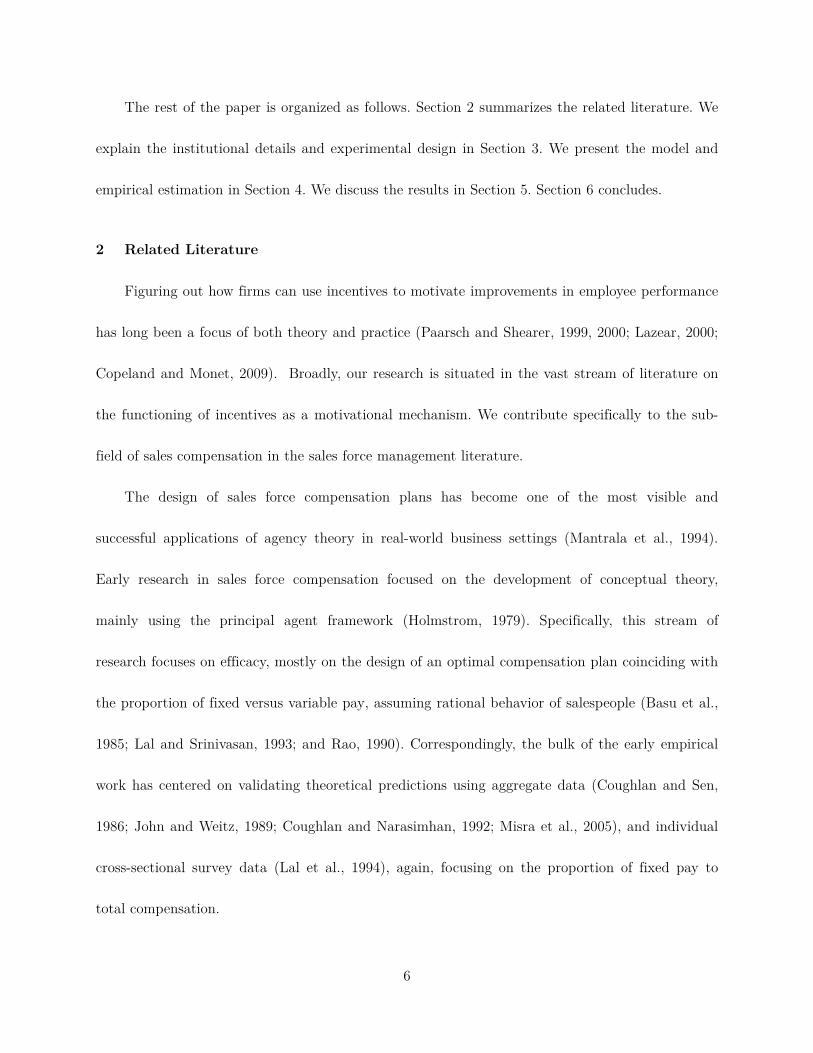
tests to check the validity of our parameter estimates. Figure 3 shows the level of convergence for
each population level parameter during the initial burn-in stage, for which we ran 50,000 initial
iterations. We saved the next 10,000 draws for model inference. For purposes of illustration, we
show only the initial 10,000 draws in Figure 3, in which we see that while seasonality, incentive,
and gift parameters converge to non-zero values, the punitive, real-punitive, and real-gift
parameters drift around zero. Table 4 shows the population level parameter estimates, for which
the mean, standard deviation, and 90-percent Bayesian coverage intervals are reported from the
posterior distribution. As expected, the seasonality parameter is positive and significant, implying
that base level of sales fluctuates with seasonal demand.
We find evidence that incentives increase salesperson effort to the extent that the incentive
condition—combination of bonus, punitive, and real-punitive conditions—is positive and
significant, increasing sales by approximately 24 percent.10 No additional gain in effort appears to
accrue due to the punitive or real-punitive forms of incentives, the corresponding parameters being
actually negative, quite small in magnitude, and statistically insignificant.
We find a positive and significant effect for the gift condition (delayed unconditional
compensation), and thus, provide support for the theory of gift exchange, although the magnitude 10 We calculated the magnitude of the treatment effect in percentage-increase using exp(0.216)-1=0.2411 due to the log-transformed dependent variable.

22
of improvement in performance is less than half that observed for the incentive condition.
However, surprisingly, we find no evidence of reciprocity from the real-gift condition (immediate
unconditional compensation), the subsequent parameter being small in magnitude and statistically
indifferent from base level performance. The bottom two rows of Table 4 show the 90-percent
Bayesian credible-intervals; that none, other than the two punitive and real-gift parameters, cross
zero lends credibility to our estimates. Table 5 shows the branch specific intercepts estimates.
They are all statistically significant, with the Mumbai branch having the highest level of base
sales.
Salesperson’s heterogeneity
Salesperson level parameter estimates for a select few salespeople are reported in Table 6.
Individual parameters, for the most part, mirror those of the population level parameters with
respect to direction, but exhibit substantial heterogeneity in magnitude. As expected, the
parameters associated with seasonality and the incentive condition are all positive and those
associated with the gift condition mostly positive. The remaining parameters don’t have any
concrete direction, consistent with the statistical insignificance of the parameters at the population
level in Table 4. Let us focus on the parameters that were significant at the population level—that
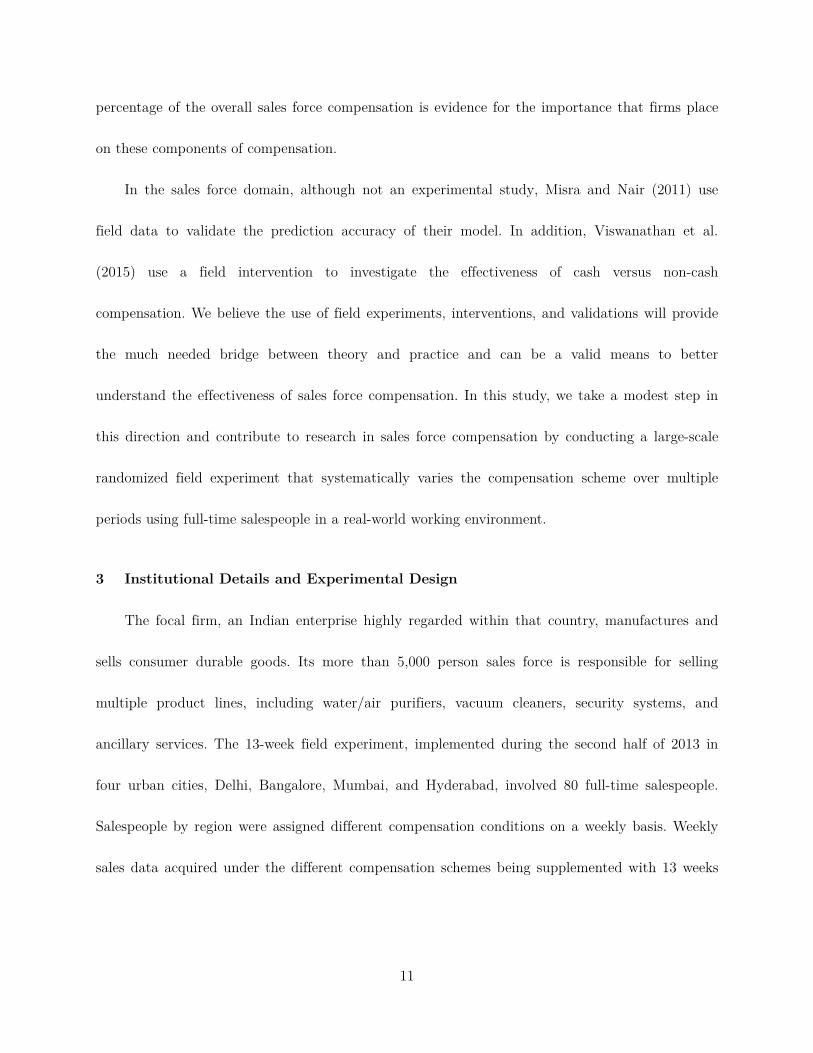
is, parameters associated with incentive and gift. We can see some interesting trends. It appears,
for example, that the effectiveness of gift slightly increases with base performance. For better
illustration we show the correlation between base performance and compensation effectiveness in
Figure 4, in which the x-axis is the value of the estimated base performance and the y-axis the
matching incentive and gift parameter, respectively, by salesperson. We see that the effectiveness

23
of incentives is positive and uniform across salespeople. That is, the use of conditional
compensation is likely to improve performance across all types of salespeople. Unconditional
compensation, however, is likely to have a greater effect on salespeople with high base-level sales
as we can see a marginally increasing relation.
5.2 Robustness Check
Repeated Exposure
In this section we check for robustness of our estimates. First, to test for repeated exposure,
we run a model with separate effects that account for the last two observations for each condition,
such that
( )log ibt ibt ib ibt ib last ibt ib last ibt ib ibtY y x I x za b b g e-= = + + + + (3)
where Ilast is an indicator function that equals one if t is one of the last two periods for each
condition.11 Accordingly, bib–last represents the difference from the main effect, if any, as a result of
multiple exposures to a compensation condition. That is, if the parameter is negative, there is
deterioration, and if positive, there is reinforcement in the effectiveness of compensation over time.
Table 7 shows the results of this analysis. There are several interesting trends. One can see that
the direction and statistical significance of the main effect is remarkably similar to results of
model (2) in Table 4, validating our analysis in the previous section. However, unlike the
seasonality parameter, which is literally identical across the two models, the main effect of the gift
condition is bigger with a negative latter effect that is statistically significant at the 80-percent
11 For a few conditions, the first time it was presented to the sales force equaled the last time—for example, real-punishment in Bangalore and real-gift in Delhi. We did not include such cases in the indicator function Ilast.
24
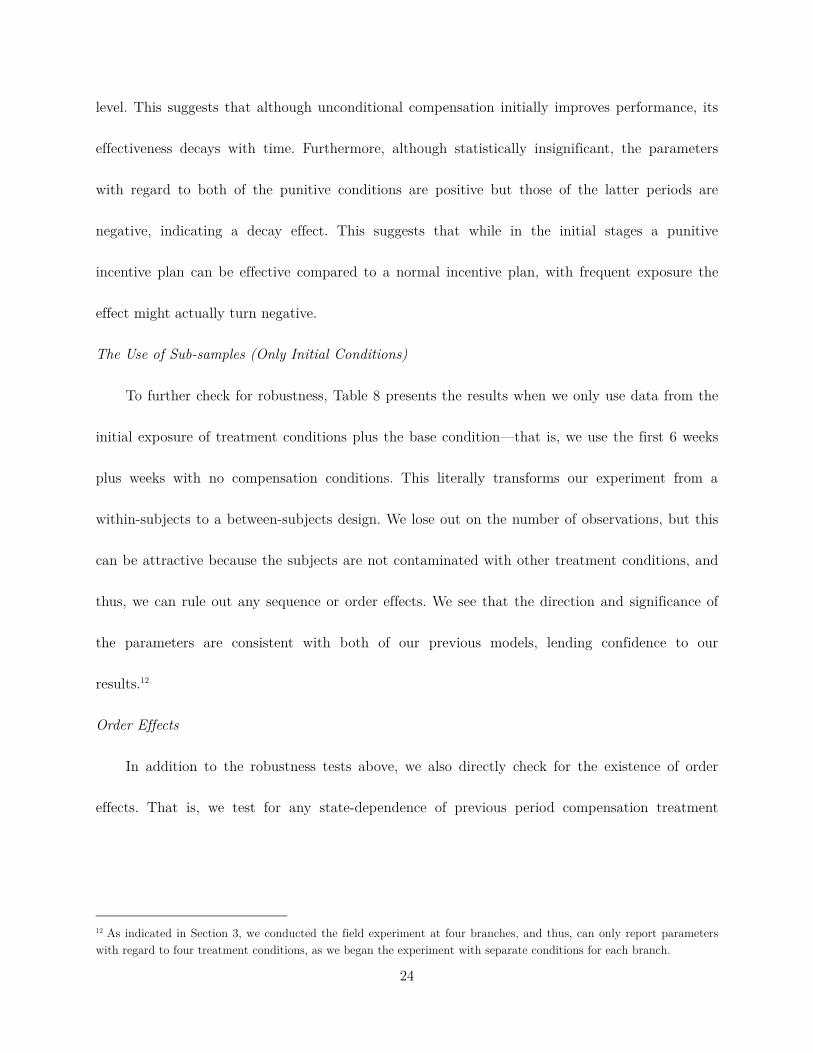
level. This suggests that although unconditional compensation initially improves performance, its
effectiveness decays with time. Furthermore, although statistically insignificant, the parameters
with regard to both of the punitive conditions are positive but those of the latter periods are
negative, indicating a decay effect. This suggests that while in the initial stages a punitive
incentive plan can be effective compared to a normal incentive plan, with frequent exposure the
effect might actually turn negative.
The Use of Sub-samples (Only Initial Conditions)
To further check for robustness, Table 8 presents the results when we only use data from the
initial exposure of treatment conditions plus the base condition—that is, we use the first 6 weeks
plus weeks with no compensation conditions. This literally transforms our experiment from a
within-subjects to a between-subjects design. We lose out on the number of observations, but this
can be attractive because the subjects are not contaminated with other treatment conditions, and
thus, we can rule out any sequence or order effects. We see that the direction and significance of
the parameters are consistent with both of our previous models, lending confidence to our
results.12
Order Effects
In addition to the robustness tests above, we also directly check for the existence of order
effects. That is, we test for any state-dependence of previous period compensation treatment
12 As indicated in Section 3, we conducted the field experiment at four branches, and thus, can only report parameters with regard to four treatment conditions, as we began the experiment with separate conditions for each branch.

25
conditions on current performance.13 To perform this robustness check, we estimate a model with
past states (compensation conditions) and their interactions with current states such that
( ) , 1 , 1log ibt ibt ib ibt ib ib t ib ib t ib ibt ibt ib ibtY y x x x B x za b d g e- -¢= = + + + + + (4)
where xib,t−1 is the past compensation condition and dib is the corresponding parameter which
represents the direct effect of state dependence. The matrix Bib represents any interaction effects
from a previous state to a current state. As we don’t observe the transitions from all of the states
to one another (for example, we don’t observe a transition from the gift to bonus condition), we
simplify the transition matrix such that the past states (xib,t−1) are categorized into incentive and
reciprocity conditions and the current states (x¢ibt) are categorized into incentive, gift, and real-gift
conditions. Hence, Bib would be a 2´3 matrix with rows and columns representing past and
current states, respectively. The results are shown in Table 9. Again, the directions of the
compensation effects are very close to those we see in Table 4. However, the effect of past incentive
condition on current performance is negative and significant. This implies that although a
conditional compensation bonus scheme can be effective at increasing the performance of
salespeople in the current period, it actually might hurt performance in future periods, and thus, a
one-time conditional bonus plan might be harmful in the long-run. None of the interaction effects
are found to be significant.
13 We thank the Associate Editor for suggesting this robustness check.

26
5.3 Discussion of Results and Managerial Implications
Several features of our results merit consideration. First, loss-aversion led us to expect the
punitive conditions to provide an additional inducement for salespeople to work. Our expectations
were based on results from past research and the intuition of the firm’s sales managers, who had
predicted the real-punitive condition to be likely the most effective. The lack of support for this
result in our study deserves further explanation. Our data being longitudinal and covering a
significant time frame, one could argue that the inducement to work hard under the punitive
conditions does occur in the initial period and possibly dissipates over time as sales agents
repeatedly exposed to the condition update their expectations. We find some support for this
argument in Table 7, where the initial punitive parameters are positive, although statistically
insignificant. We also explicitly tested whether there was a first time effect for punitive conditions
and found a small positive effect, but again not statistically significant. These results suggest that
while initially there is some marginal indication that loss aversion is prevalent, in the long-run, the
firm was unable to manipulate salespersons’ behavior by framing incentives as losses. Although
additional gains in effort might be realized from the punitive or real-punitive incentive forms in a
single period engagement (Fryer et al., 2012), this is unlikely to be obtained in the field of sales
management, in which the periodicity of incentives is more frequent. Further, our result is
consistent with the behavioral literature, in which loss aversion is not found to be associated with
intended exchangeable goods like money (Novemsky and Kahneman, 2005). Thus, firms are not
likely, in the case of frontline sales agents, to benefit from sales compensation systems that offer
bonus rewards up front (and impose a penalty for a performance shortfall).

27
The magnitude of the performance improvement in the reciprocity condition being less than
half that observed for the incentive condition supports the belief, prevalent in sales management
practice, that front line sales agents are driven more by extrinsic than by intrinsic cues. When we
discussed this result with the firm’s management, the following interesting explanation was
offered. In high inflationary environments, emerging markets like India, for example, additional
compensation is typically provided to employees as a cost-of-living adjustment. In the gift
condition, not being explicitly tied to performance, the additional payment was suspected by
senior managers to have been viewed by sales agents as a cost-of-living adjustment and, therefore,
an entitlement. Furthermore, reciprocity seems to decay with frequency as shown in Table 7. That
is, while salespeople initially reciprocate with regard to unconditional compensation, frequent
exposure makes such forms of compensation less effective.
Overall, our results support the argument that front line sales agents, being driven by direct
and extrinsic stimuli, are more likely to “get it” when told explicitly by the firm that their pay
increase is due to the additional effort they put in. This leads them to continue putting in the
added effort in the corresponding treatment condition that, in turn, leads to superior results. This
is evident even when accounting for salesperson heterogeneity, where all types of salespeople are
found to be equally and positively affected by conditional incentives.
The insignificant improvement in performance (and potentially negative) under the real-gift
condition can possibly be explained as a reframing of the timing of the gift, sales agents being
likely to regard a gift at the start of the period to be compensation for superior performance in
previous periods. That is, the immediate gift seems not to increase goodwill with respect to

28
salespeople reciprocating to the firm, but instead to signal good past performance, affording
reasons to not change (or decrease) effort in subsequent periods. An alternative explanation can be
an income effect due to a windfall where salespeople decide to relax once they have already
achieved their expected income for the week.
A conditional bonus compensation scheme is found to decrease performance in the future.
This is consistent with past behavioral research that suggests too much extrinsic motivation may
lead to a decrease in intrinsic motivation (Lepper et al., 1973). Offering an extrinsic incentive such
as a quota-based-bonus would shift a salesperson’s motivation cue to extrinsic and crowd out
intrinsic motivation. As a consequence, if such conditional incentives are only offered temporarily,
future performance may be lower than it would have been otherwise.
Because our subjects are retail salespeople working in exclusive–territory retail stores to which
they are assigned by the focal firm, we cannot tell precisely whether the estimated base
performance (individual effect) reflects a salesperson’s selling ability or demand characteristics of
the retail store (e.g., being situated in a high traffic area). It probably is a combination of both
factors. Interestingly, the firm’s management stated that it was salespeople who were with the firm
longer and had achieved high levels of past sales who were usually assigned to high-traffic area
retail stores. Thus, our estimated parameter of base performance likely is highly correlated with
the true selling ability of salespeople. Nevertheless, the positive correlation between base
performance and the effectiveness of unconditional compensation makes intuitive sense. A
salesperson with high level selling skills would likely have greater goodwill with the firm and thus
reciprocate more towards unconditional rewards.

29
6 Conclusion
Sales force compensation is one of the key instruments by means of which firms motivate and
enhance sales performance. There are a variety of ways in which firms compensate their sales
forces in the world today. Joseph and Kalwani (1998) report that over 95 percent of Fortune 500
firms surveyed use some combination of quotas, bonus, and commissions to incentivize their sales
forces. Incentive-based compensation, although known to increase productivity, is costly to the
firm and agent alike, the former bearing the cost of additional compensation, the latter facing
disutility from additional effort. It is necessary to evaluate salespeople’s responses to, in order to
assess the effectiveness of, the various forms of incentive plans.
Because compensation contracts are by nature stationary and exhibit little variation over the
time-horizon given to the researcher, evaluating various forms of compensation confronts
challenges that the empirical literature has thus far met by relying on simple regime changes
potentially beset by the problem of endogeneity. We avoid this problem by conducting a
randomized field experiment. The experimental setting was four regional sales forces of a
prominent firm in India. The experimental treatment conditions consisted of conditional and
unconditional bonus schemes, the former including both a regular-bonus scheme and a punitive-
bonus scheme framed as a penalty for not achieving quota, the latter incorporating varied timing
of the unconditional reward.
We find a quota-bonus plan to improve sales force performance; however, it potentially
demotivates salespeople from exerting effort in future periods. We find the effect of a punitive
bonus plan to not significantly differ from that of a normal bonus plan, consistent with the

30
infrequent real world use of punitive forms of sales force compensation. We find unconditional
bonuses to improve sales force performance, consistent with the theory of gift exchange, but the
magnitude of effectiveness to be less than half that of the conditional bonus plan. We further find
unconditional bonuses to be effective only when given as a delayed reward and that the
effectiveness decays with time.
Consistent with the vast literature in marketing that finds the preferences of individuals to be
heterogeneous with regard to marketing mix instruments, we find salespeople to be heterogeneous
in response to various compensation schemes. Although conditional compensation is equally
effective across all types of salespeople, unconditional bonuses seem to be more effective for those
with high base performance.
In addition to validating a few prevalent practices in sales force compensation, our findings
from this study provide guidance to firms on how to use conditional and unconditional
compensation to enhance sales agent productivity and better manage the achievement of sales
forecasts.
In a highly competitive world, when it comes to the variable component of sales agent
compensation, it is better for sales managers to explicitly connect rewards with outcomes than
not. However, although a conditional compensation bonus scheme can be effective at increasing
the performance of salespeople in the present period, it actually might hurt performance in future
periods. As a result, a temporary bonus plan might not be in the best interest of the firm in the
long-run.

31
At the same time, using a punitive framing for variable compensation is not likely to spur a
response from sales agents, especially in environments where such compensation are paid
frequently and are a fraction of a fixed compensation component—a common phenomenon in field
sales. Such a framing might possibly work when the variable compensation payments are
infrequent and paid as a reward for performance over an extended period of time (Fryer et al.,
2012).
Sales agents are accustomed to variable compensation being offered as a reward for favorable
performance outcomes and will likely be less responsive to gifts given in advance to spur extra
effort. Nevertheless, unconditional gifts can be used selectively to reward sales agents with higher
level selling skills. This result supports a commonly used approach by firms to reward their top-
tier sales reps with special additional rewards.
There are several limitations to note. Although our field experiment is significantly longer
than most field-based academic studies in sales compensation to date, we believe that extending
the time horizon of the study might shed more light on the long-term effects of different
compensation instruments, specifically with regard to the effect size of incentives and reciprocity.
There is also a need to replicate our study in other contexts. The setting for this study is short
sales-cycle consumer durables. As mentioned earlier, it would be illuminating to study the impact
of conditional and unconditional variable sales compensation in longer sales-cycle, high-ticketed
capital equipment goods. These areas would be exciting venues for future field-based research in
sales force compensation.

32
References
Adams, J. (1963), “Toward an Understanding of Inequality,” Journal of Abnormal Social
Psychology, LXVII, 422-436.
Ahearne, M, T. Steenburgh, J. Boichuk, F. Kraus (2015), “Man of the Bench: The Power of the
Stick in the Sales Force,” Working paper.
Akerlof, G. (1982), “Labor Contracts as Partial Gift Exchange,” Quarterly Journal of
Economics, 97(4), 543-569.
Akerlof, G., J. Yellen (1988), “Fairness and Unemployment,” American Economic Review,
Papers and Proceedings, 78(2), 44-49.
Akerlof, G., J. Yellen (1990), “The Fair Wage-Effort Hypothesis and Unemployment,” Quarterly
Journal of Economics, 105(2), 255-283.
Albers, S., M. Mantrala (2008), “Models for Sales Management,” Chapter 6 in Handbook of
Marketing Decision Models (ed: Berend Wierenga, Erasmus University), Springer Science +
Business Media International Series in Operational Research and Management Science, 163-210.
Allenby, G., P. Rossi (1999), “Marketing Models of Consumer Heterogeneity,” Journal of
Econometrics, 89(1-2), 57-78.
Anderson, E., R. Oliver (1987), “Perspectives on Behavior-Based versus Outcome-Based
Salesforce Control Systems,” Journal of Marketing, 51 (4), 76-88.
Basu, A., R. Lal, V. Srinivasan, R. Staelin (1985), “Salesforce Compensation Plans: An Agency
Theoretic Perspective,” Marketing Science, 4(4), 267-291.
Challagalla, G., T. Shervani (1996), “Dimensions and Types of Supervisory Control: Effects on
Salesperson Performance and Satisfaction,” Journal of Marketing, 60(1), 89–105.
Chen, H., S. Ham, N. Lim (2011), “Designing Multiperson Tournaments with Asymmetric
Contestants: An Experimental Study,” Management Science, 57(5), 864-883.

33
Chung, D., T. Steenburgh, K. Sudhir (2014), “Do Bonuses Enhance Sales Productivity? A
Dynamic Structural Analysis of Bonus-Based Compensation Plans,” Marketing Science, 33(2),
165-187.
Churchill, G., N. Ford, S. Hartley, O. Walker (1985), “The Determinants of Salesperson
Performance: A Meta-Analysis,” Journal of Marketing Research, 22(2), 103-118.
Copeland, A., C. Monnet (2009), “The Welfare Effects of Incentive Schemes,” Review of
Economic Studies, 76(1), 93-113.
Coughlan, A., C. Narasimhan (1992), “An Empirical Analysis of Sales-Force Compensation
Plans,” Journal of Business, 65(1), 93-121.
Coughlan, A., S. Sen (1986), “Salesforce Compensation: Theory and Managerial Implications,”
Marketing Science, 8(4), 324-342.
Deci, E., R. Koestner, R. Ryan (1999), “A Meta-Analytic Review of Experiments Examining
the Effects of Extrinsic Rewards on Intrinsic Motivation,” Psychological Bulletin 125(6), 627-668.
Dhar, R., K. Goldsmith (2013), “Negativity Bias and Task Motivation: Testing the
Effectiveness of Positively versus Negatively Framed Incentives,” Journal of Experimental
Psychology: Applied, 19(4), 358-366.
Fehr, E., G. Kirchsteiger, A. Riedl, (1993), “Does Fairness Prevent Market Clearing? An
Experimental Investigation,” Quarterly Journal of Economics, 108(2), 437-459.
Fryer, R., S. Levitt, J. List, S. Sadoff (2012), “Enhancing the Efficacy of Teacher Incentives
through Framing: A Field Experiment,” NBER Working Paper, No. 18237.
Gneezy, U., J. List (2006), “Putting Behavioral Economics to Work: Testing for Gift Exchange
in Labor Markets Using Field Experiments,” Econometrica, 74(5), 1365-1384.
Heath, C., R. Larrick, G. Wu (1999), “Goals as Reference Points,” Cognitive Psychology, 38, 79-
109.

34
Herweg, F., D. Müller, P. Weinschenk (2010), “Binary Payment Schemes: Moral Hazard and
Loss Aversion,” American Economic Review, 100(5), 2451-2477.
Holmstrom, B. (1979), “Moral Hazard and Observability,” Bell Journal of Economics, 10(1),
74-91.
Hossain, T., J. List (2012), “The Behavioralist Visits the Factory: Increasing Productivity
Using Simple Framing Manipulations,” Management Science, 58(12), 2151-2167.
John, G., B. Weitz (1989), “Salesforce Compensation: An Empirical Investigation of Factors
Related to Use of Salary Versus Incentive Compensation,” Journal of Marketing Research,
26(February), 1-14.
Joseph K., M. Kalwani (1998), “The Role of Bonus Pay in Sales Force Compensation Plans,”
Industrial Marketing Management, 27(2), 147-159.
Kahneman, D., A. Tversky (1979), “Prospect Theory: An Analysis of Decision under Risk,”
Econometrica, 47(2), 263-292.
Kamakura, W., G. Russell (1989), “A Probabilistic Choice Model for Market Segmentation and
Elasticity Structure,” Journal of Marketing Research, 26(4), 379-390.
Köszegi, B., M. Rabin (2006), “A Model of Reference-Dependent Preferences,” Quarterly
Journal of Economics, 121(4), 1133-1166.
Kube, S., M. Maréchal, C. Puppe (2012), “The Currency of Reciprocity: Gift Exchange in the
Workplace,” American Economic Review, 102(4), 1644-1662.
Lal, R., V. Srinivasan (1993), “Compensation Plans for Single- and Multi-Product Salesforces:
An Application of the Holmstrom-Milgrom Model,” Management Science, 39(7), 777-793.
Lal, R., D. Outland, R. Staelin (1994), “Salesforce Compensation Plans: An Individual-Level
Analysis,” Marketing Letters, 5(2), 117-130.
Lazear, E. (2000), “Performance, Pay, and Productivity,” American Economic Review, 90(5),
1346-1361.

35
Leibenstein, H. (1957), “The Theory of Underdevelopment in Densely Populated Backward
Areas,” in Economic Backwardness and Economic Growth, edited by H. Leibenstein. New York:
Wiley.
Lepper, M., D. Greene, R. Nisbet (1973), “Undermining Children’s Intrinsic Interest with
Extrinsic Reward; A Test of ‘Overjustification’ Hypothesis,” Journal of Personality and Social
Psychology 28, 129‐37.
Levitt, S., J. List, S. Neckermann, S. Sado (2013), “The Behavioralist Goes to School:
Leveraging Behavioral Economics to Improve Educational Performance,” NBER working paper
No. 18165.
Lim, N. (2010), “Social Loss Aversion and Optimal Contest Design,” Journal of Marketing
Research, 47(4), 777-787.
Macera, R. (2013), “Intertemporal Incentives with Expectation-Based Reference-Dependent
Preferences,” Working paper, Pontificia Universidad Católica de Chile.
Mantrala, M., P. Sinha, A., Zoltners (1994), “Structuring a Multiproduct Sales Quota-Bonus
Plan for a Heterogeneous Sales Force: A Practical Model-Based Approach,” Marketing Science,
13(2), 121-144.
Misra, S., A. Coughlan, C. Narasimhan (2005), “Salesforce Compensation: An Analytical and
Empirical Examination of the Agency Theoretic Approach,” Quantitative Marketing and
Economics, 3, 5-39.
Misra, S., H. Nair (2011), “A Structural Model of Sales-Force Compensation Dynamics:
Estimation and Field Implementation,” Quantitative Marketing and Economics, 9(3), 211-225.
National Bureau of Statistics of China (2012), China Statistical Yearbook 2010, Chinese
Statistics Press.
Novemsky, N., D. Kahneman (2005), “The Boundaries of Loss Aversion,” Journal of Marketing
Research, 42(2), 119-128.

36
Paarsch, H., B. Shearer (1999), “The Response of Worker Effort to Piece Rates: Evidence from
the British Columbia Tree-Planting Industry,” Journal of Human Resources, 34, 643-667.
Paarsch, H., B. Shearer (2000), “Piece Rates, Fixed Wages, and Incentive Effects: Statistical
Evidence From Payroll Records,” International Economic Review, 41(1), 59-92.
Rao, R. (1990), “Compensating Heterogeneous Salesforces: Some Explicit Solutions,” Marketing
Science, 9(4), 319-341.
Ryan, R., E. Decai (2000), “Self-determination Theory and the Facilitation of Intrinsic
Motivation, Social Development, and Well-being,” American Psychologist, 55(1), 68–78.
Samuelson, W., R. Zeckhauser (1988), “Status Quo Bias in Decision Making,” Journal of Risk
and Uncertainty, 1(1), 7-59.
Solow, R., (1979), “Another possible source of wage stickiness,” Journal of Macroeconomics
1(1), 79-82.
Sriram, S., P. Chintagunta, M. Agarwal (2010), “Investigating Consumer Purchase Behavior in
Related Technology Product Categories,” Marketing Science, 29(2), 291-314.
Steenburgh, T., M. Ahearne (2012), “Motivating Salespeople: What Really Works,” Harvard
Business Review, 90(7-8), 70-5, 160.
Thaler, R. (1980), “Toward a Positive Theory of Consumer Choice,” Journal of Economic
Behavior & Organization, 1(1), 39-60.
Tversky, A., D. Kahneman (1991), “Loss Aversion in Riskless Choice: A Reference-Dependent
Model,” Quarterly Journal of Economics, 106(4), 1039-1061.
Viswanathan, M., X. Li, O. Narasimhan, G. John (2015), “Is Cash King for Sales
Compensation Plans? A Large Scale Field Intervention,” Working paper.
U.S. Department of Labor, Bureau of Labor Statistics (2012), National Occupational
Employment and Wage Estimates, May.

37
Ying, Y., N. Syam, J. Hess (2013), “Thrill of Victory and Agony of Defeat: Emotional Rewards
and Sales Force Compensation,” Quantitative Marketing and Economics, 11(4), 379-402.
Zoltners, A., P. Sinha, S. Lorimer (2013) “Are You Paying Enough Attention to Your Sales
Force?” HBR Blog Network (blog), Harvard Business Review, April.

38
Appendix
The hierarchical draws from the conditional distribution are via the Gibb’s sampling
technique, iterated until convergence. The closed-forms for the conditional distribution are as
below. We assume conjugate prior distributions such that
( )20 0,Na a s , ( )0 0,MVN mQ S ,
( )2 2 20 0, , 2 , 2ib b Gas s s n k- - - , ( )1
0 0,W r-S Y .
Thus, the full conditional distributions are
( ) ( )20 12 0,
| , , , , ,2 2
ibT
ibt ib ibt ibt ibtibib ib ib ib ib ib
y x zTy x z Ga
k ans a =-
æ öé ù ÷ç + - - Q ÷+ç ê úë û ÷ç ÷Q ç ÷ç ÷ç ÷÷çè ø
å ,
( ) ( )( )2 2 1 2 2 11
| , , , , , , , , ibTib ib ib ib ib ib b b ib b b ib ibt ibt ibt ib ibt
y x z N d y x z da s a s s a s- - - -
=
é ùé ùQ = + - Qê úê úë ûë ûå ,
2 2ib b ib ibd Ts s- -= + ,
( ) ( )202 10| , ,2 2
bN
ib bibb ib b
NGa
k a ans a a- =
æ ö÷ç + -+ ÷ç ÷ç ÷ç ÷ç ÷ç ÷÷çè ø
å ,
( ) ( )2 2 1 2 2 11
| , , , , bNb ib b b b ib bi
N d da a s a s s a s a- - - -
=
é ù= +ê úë ûå ,
2 2b b bd Ns s- -= + ,
( ) ( )202 10| , ,2 2
Bbb
b
BGa
k a ans a a- =
æ ö÷ç + -+ ÷ç ÷ç ÷ç ÷ç ÷ç ÷÷çè ø
å ,
( ) ( )2 1 2 2 10 0 1
| , , Bb bb
N d da a s s a s a- - - -
=
é ù= +ê úë ûå ,
2 20d Bs s- -= + ,

39
( ) ( )2 1 1 2 11
| , , , , , , , , ibTib ib ib ib ib ib ib ib ibt ibt ibt ib ibt
y x z MVN D x z y Ds a s a- - - -
=
æ öé ù¢ ÷ç é ùê ú ÷Q Q S = S Q + -ç ÷ê úç ë ûê ú ÷çè øë ûå ,
1 2 , ,ibT
ib ib ibt ibt ibt ibttD x z x zs- - ¢é ù é ù= S + ê ú ê úë û ë ûå ,
( ) ( )1 1 1 10 0 1 1
| , , bB Nib ibb i
MVN D Dm- - - -
= =
é ùQ S Q = S +S Qê úë ûå å ,
1 10D N- -= S + S ,
( ) ( )( )10 01 1
| , ,bB N
ib ib ibb iW N r-
= =
æ ö¢ ÷çS Q Q Q -Q Q -Q + Y + ÷ç ÷ç ÷è øå å .

40
Table 1: Experimental Design—Message Communicated by Treatment Condition
Experimental conditions
Message communicated
Bonus This week if you sell more than (weekly quota) units, we will give you an additional bonus of 500 Rupees, which will be paid to you in addition to your normal monthly pay on (date of payday).
Punitive We have decided to give you a bonus of 500 Rupees this week, which will be paid to you in addition to your normal monthly pay on (date of payday). However, if you sell less than (weekly quota) units this week this payment of 500 Rupees will be taken away.
Real-punitive We have decided to give you a bonus of 500 Rupees this week, which is enclosed in the envelope. However, if you sell less than (weekly quota) units this week this payment of 500 Rupees will be taken away from you on the next payday (date of the payday).
Gift We have decided to give you a bonus of 500 Rupees this week, which will be paid to you in addition to your normal monthly pay on (date of the payday).
Real-gift We have decided to give you a bonus of 500 Rupees this week, which is enclosed in the envelope.
Table 2: Experiment Time Frame
Region/Week 1 2 3 4 5 6 7 8 9 10 11 12 13-22 23 24 25 26Bangalore b b B B B B P P G G b B b G P RG RPDelhi b b P P P P G G P P b RP b B G P RGHyderabad b b RP RP RP RP RG RG RP RP b G b RG P G RPMumbai b b G G G G P P G G b P b B G RP RG
b: base condition, B: bonus condition, P: punitive condition, RP: real-punitive condition, G: gift condition, RG: real-gift condition
Table 3: Descriptive Statistics—Sales Productivity by Treatment Condition
Base Bonus Punitive Real-
punitive Gift
Real- gift
Mean 4.13 4.10 4.64 6.07 5.87 4.93
Standard deviation
4.56 4.27 5.27 7.28 6.03 5.20
Min 0 0 0 0 0 0
Max 36 31 41 37 27 22

41
Table 4: Population Parameter Estimates
Seasonality Incentive Punitive Real-
punitive Gift Real-gift
Coefficient 0.045 0.216 -0.055 -0.031 0.095 -0.055SD 0.008 0.049 0.058 0.075 0.043 0.065
Credible intervals*
0.031 0.136 -0.147 -0.158 0.023 -0.1650.059 0.294 0.040 0.090 0.162 0.050
*90-percent Bayesian credible interval, significance in bold.
Table 5: Branch Effect Estimates
Delhi Bangalore Mumbai Hyderabad
Coefficient 0.867 0.889 1.548 1.378 SD 0.102 0.106 0.155 0.230
Credible intervals*
0.697 0.714 1.285 1.003 1.035 1.063 1.788 1.749
*90-percent Bayesian credible interval, significance in bold.
Table 6: Salesperson Parameter Estimates (Subsample of 20)
Salesperson Base
performance Seasonality Incentive Punitive
Real-punitive
Gift Real-gift
4 0.955 0.038 0.199 -0.111 -0.058 0.151 0.0148 0.670 0.064 0.256 -0.147 -0.127 0.172 0.04012 2.500 0.057 0.272 -0.109 -0.063 0.222 0.06316 1.440 0.005 0.088 -0.022 -0.045 -0.082 -0.15220 1.128 0.043 0.164 -0.020 -0.086 0.039 -0.13524 1.564 0.048 0.249 -0.045 -0.036 0.103 -0.06828 1.026 0.055 0.253 -0.048 -0.126 0.123 -0.02732 0.644 0.048 0.187 -0.030 -0.056 0.042 -0.11036 0.970 0.076 0.253 -0.112 -0.199 0.126 -0.03040 1.785 0.037 0.190 -0.104 -0.024 0.087 -0.05344 0.505 0.046 0.216 -0.014 -0.021 0.009 -0.16948 0.401 0.038 0.187 0.014 -0.054 -0.030 -0.18552 1.578 0.018 0.216 -0.048 0.132 0.165 -0.00356 1.579 0.046 0.252 -0.071 -0.025 0.167 0.01260 1.450 0.056 0.284 -0.076 0.087 0.269 0.10164 0.811 0.038 0.203 -0.104 0.047 0.174 0.031

42
68 0.261 0.016 0.161 -0.007 0.156 0.130 -0.06372 1.261 0.061 0.233 -0.096 -0.037 0.097 -0.06376 0.075 0.035 0.160 -0.004 -0.050 0.042 -0.12680 0.243 0.015 0.162 -0.076 -0.121 -0.030 -0.145
Note: A subsample of 20 (out of 80) salespeople are chosen for illustration.
Table 7: Robustness Check—Repeated Exposure
Seasonality Incentive Punitive
Real-punitive
Gift Real-gift
Coefficient 0.044 0.170 0.024 0.014 0.152 -0.056SD 0.009 0.061 0.075 0.091 0.065 0.075
Credible intervals*
0.029 0.067 -0.097 -0.134 0.047 -0.1770.060 0.267 0.147 0.165 0.259 0.067
Last two
Incentive Punitive Real-
punitive Gift Real-gift
periods ´
Coefficient 0.141 -0.226 -0.397 -0.121 -0.020SD 0.161 0.176 0.276 0.074 0.191
Credible intervals*
-0.103 -0.522 -0.908 -0.240 -0.355 0.413 0.044 0.020 0.003 0.301
*90-percent Bayesian credible interval, significance in bold.
Table 8: Robustness Check—Initial Exposure
Seasonality Incentive Punitive Real-
punitive Gift
Coefficient 0.032 0.270 0.123 -0.033 0.183 SD 0.010 0.071 0.096 0.118 0.096
Credible intervals*
0.016 0.161 -0.034 -0.231 0.017 0.048 0.396 0.284 0.158 0.337
*90-percent Bayesian credible interval, significance in bold.

43
Table 9: Robustness Check—State Dependence
a) Main Effects
Seasonality Incentive Punitive Real-
punitive Gift Real-gift
Incentive(t-1)
Reciprocity(t-1)
Coefficient 0.044 0.211 0.010 0.025 0.129 -0.129 -0.115 -0.063SD 0.009 0.061 0.070 0.085 0.103 0.238 0.060 0.088
Credible intervals
0.028 0.109 -0.099 -0.108 -0.033 -0.557 -0.218 -0.2130.059 0.307 0.128 0.173 0.308 0.254 -0.020 0.080
*90-percent Bayesian credible interval, significance in bold.
b) Interaction Effects
Parameter Estimates Coverage Intervals*
Incentive (t) Gift (t) Real-gift (t) Incentive (t) Gift (t) Real-gift (t)
Incentive (t-1) 0.035 0.128 0.172Incentive (t-1)
-0.110 -0.096 -0.212
SD 0.089 0.128 0.239 0.183 0.332 0.593
Reciprocity (t-1) -0.044 -0.084 0.008Reciprocity (t-1)
-0.231 -0.306 -0.706
SD 0.118 0.135 0.426 0.156 0.136 0.726*90-percent Bayesian credible interval, significance in bold.

44
Figure 1: Compensation Condition Categories
Figure 2: Seasonality – Average Sales by Region
Average unit sales (by region) of salespeople who did not participate in the field experiment
Treatment conditions
Incentive
Bonus Punitive Real-punitive
Reciprocity
Gift Real-gift
0.0
2.0
4.0
6.0
8.0
10.0
12.0
1 3 5 7 9 11 13 15 17 19 21 23 25
Ave
rage
uni
t sa
les
Week
a) Delhi and Mumbai
Delhi Mumbai
0.0
2.0
4.0
6.0
8.0
10.0
12.0
1 3 5 7 9 11 13 15 17 19 21 23 25
Ave
rage
uni
t sa
les
Week
b) Bangalore and Hyderabad
Bangalore Hyderabad

45
Figure 3: Model Convergence
Figure 4: Parameter Correlation—Base performance vs. Incentive and Gift
0 5000 10000-0.05
0
0.05
0.1
0.151) Seasonality
Iteration0 5000 10000
0
0.1
0.2
0.3
0.42) Incentive
Iteration0 5000 10000
-0.4
-0.2
0
0.2
0.4
0.63) Punitive
Iteration
0 5000 10000-0.4
-0.2
0
0.2
0.44) Real-punitive
Iteration0 5000 10000
-0.1
0
0.1
0.2
0.35) Gift
Iteration0 5000 10000
-0.4
-0.2
0
0.2
0.46) Real-gift
Iteration
-0.2-0.1-0.10.00.10.10.20.20.30.30.4
0.1 0.4 0.6 0.8 1.1 1.2 1.6 1.8
Par
amet
er e
stim
ates
Base performance
Incentive Gift