Incentives for industrially backward states
40
REPORT ON THE ROLE OF INCENTIVES IN THE DEVELOPMENT OF INDUSTRIALLY BACKWARD STATES/UTs M.C. SINGHI Senior Economic Adviser Ministry of Commerce & Industry Office of the Economic Adviser Paper No. 39
-
Upload
vuongtuyen -
Category
Documents
-
view
223 -
download
0
Transcript of Incentives for industrially backward states
REPORT ON THE ROLE OF INCENTIVES IN THE DEVELOPMENT OF INDUSTRIALLY BACKWARD
STATES/UTs
M.C. SINGHI Senior Economic Adviser
Ministry of Commerce & Industry Office of the Economic Adviser
Paper No. 39
Page no. 1
Table of Contents
Sl.No. Subject
Page No.
1 Introduction
2-3
2 Chapter -2 Identification of Backward Regions
3-5
3 Chapter – 3 Operation of specific schemes for Backward Area Development
6-10
4. Chapter – 4 Backward Area Development Through Greater Relative Allocation of Resources at Macro Level
11-12
5. Chapter – 5 Study of the outcome of these initiatives
13-18
6. Chapter – 6 Backward Area Grant Fund (BRGF) – A new approach to address regional imbalances
19-23
7. Annexures (1 – 10) 24-39
Page no. 2
REPORT ON THE ROLE OF INCENTIVES IN THE DEVELOPMENT OF INDUSTRIALLY BACKWARD STATES/UTs
*** Introduction
Balanced regional development has remained a central theme of our
development strategy. Industrial dispersal was envisaged to play an important role in correcting the regional imbalances and ensuring a balanced regional development. Industrial policy statements clearly indicated such an intent of the Government. The Industrial Policy Resolution, 1956 stated that “In order that industrialization may benefit the economy of the country as a whole, it is important that disparities in levels of development between different regions should be progressively reduced. The lack of industries in different parts of the country is very often determined by factors such as the availability of the necessary raw materials or other natural resources. A concentration of industries in certain areas has also been due to the ready availability of power, water supply and transport facilities which has been developed there. It is one of the aims of national planning to ensure that these facilities are steadily made available to areas which are at present lagging behind industrially or where there is greater need for providing opportunities for employment provided the location is otherwise suitable. Only by securing a balanced and coordinated development of the industrial and the agricultural economy in each region can be the entire country attains higher standards of living”.
1.2 The Industrial Policy Resolution of 1973 reiterated that “in the implementation of the licensing policy Government will ensure that licensing decisions confirm to the growth profile of the Plan and the techno-economic and social considerations such as economies of scale, appropriate technology, balanced regional development and development of backward areas are fully reflected. Government’s policy will continue to encourage competent small and medium entrepreneurs in all industries…..Such entrepreneurs will be preferred vis-à-vis the larger industrial houses and foreign companies in the setting up of new capacity. Licensing policy will
Page no. 3
seek to promote production of companies in the setting up of new capacity. Licensing policy will seek to promote production of ancillaries, wherever feasible and appropriate, in the medium or small scale sector. Co-operatives and small and medium entrepreneurs will be encouraged to participate in the production of mass consumption goods with the public sector also taking an increasing role. Other investors will be allowed to participate in the production of mass consumption goods only if there are special factor such as sizable economies of scale resulting in reduced prices, technological improvements, large investment requirements, substantial export possibilities or as part of modernization. Government also intends to enlarge and intensify a variety of positive measures designed to promote the growth of small and medium entrepreneurs”.
1.3 The Industrial Policy Resolution of 1977 further envisaged the industrial location policy to become an effective instrument of balanced regional industrial development. The policy stated that “the Government attaches great important to balanced regional development of the entire country so that disparities in levels of development between different regions are progressively reduced. Government have noted with concern that most of the industrial development that has taken place in our country since Independence has been concentrated around the metropolitan areas and large cities. The result has been a rapid deterioration in the living conditions especially for the working classes in the larger cities and attendant problems of slums and environmental pollution. The Government have decided that no more licenses should be issued to new industrial units within certain limits of large metropolitan cities having a population of more than 1 million and urban areas with a population of more than 5 lakh as per 1971 census. State Governments and financial institutions will be requested to deny support to new industries in these areas such as those which do not require an industrial license. The Government of India would also consider providing assistance to large existing industries which want to shift from congested metropolitan cities to approved locations in backward areas. For dispersal of industries and setting of units in industrially backward areas Government also provided special concessions and facilities.
Page no. 4
CHAPTER – 2 IDENTIFICATION OF BACKWARD REGIONS
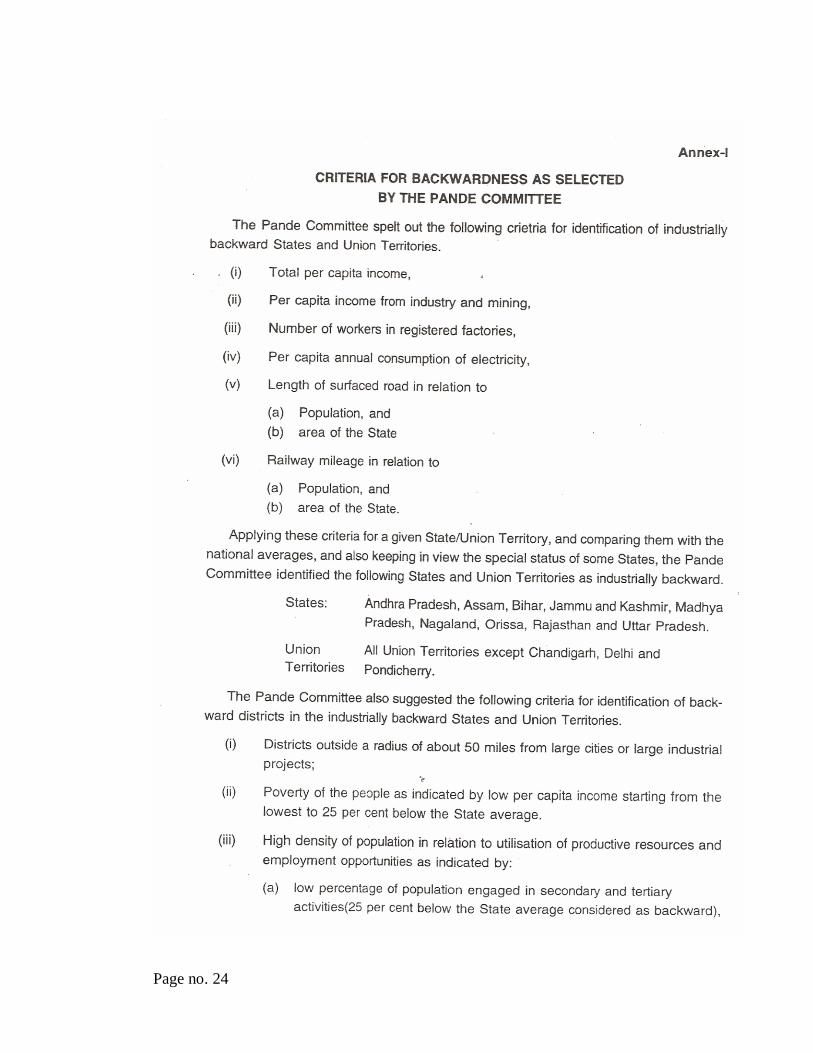
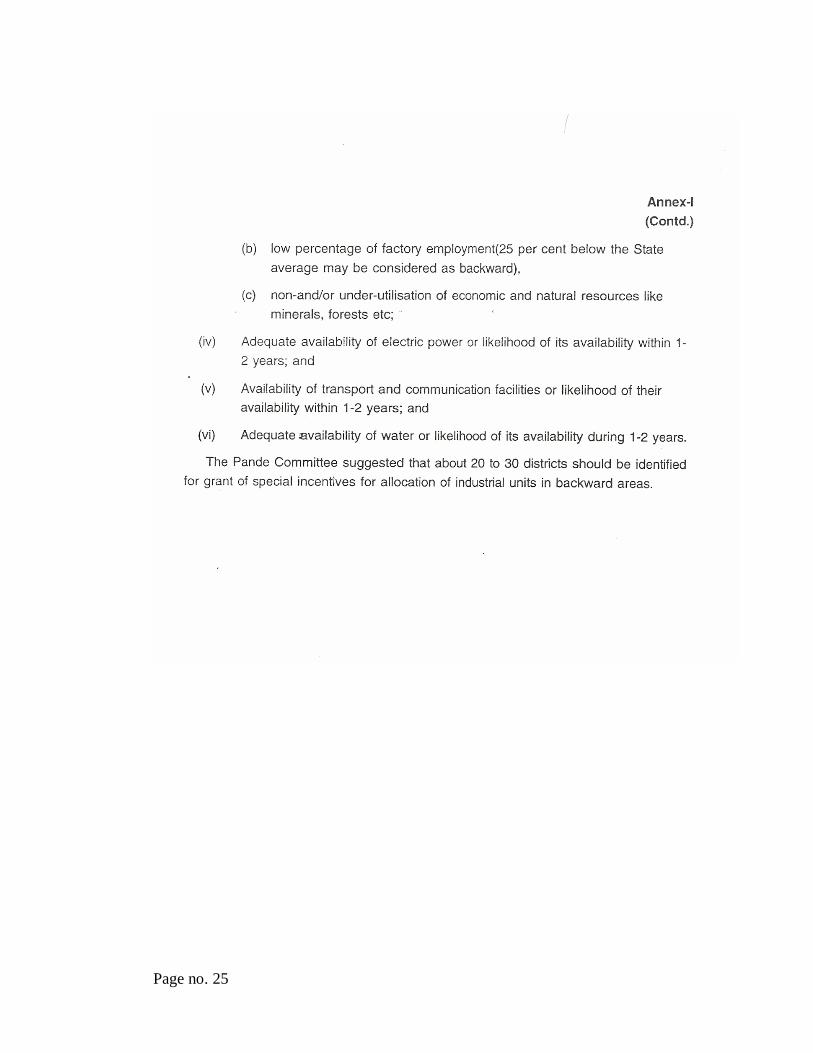
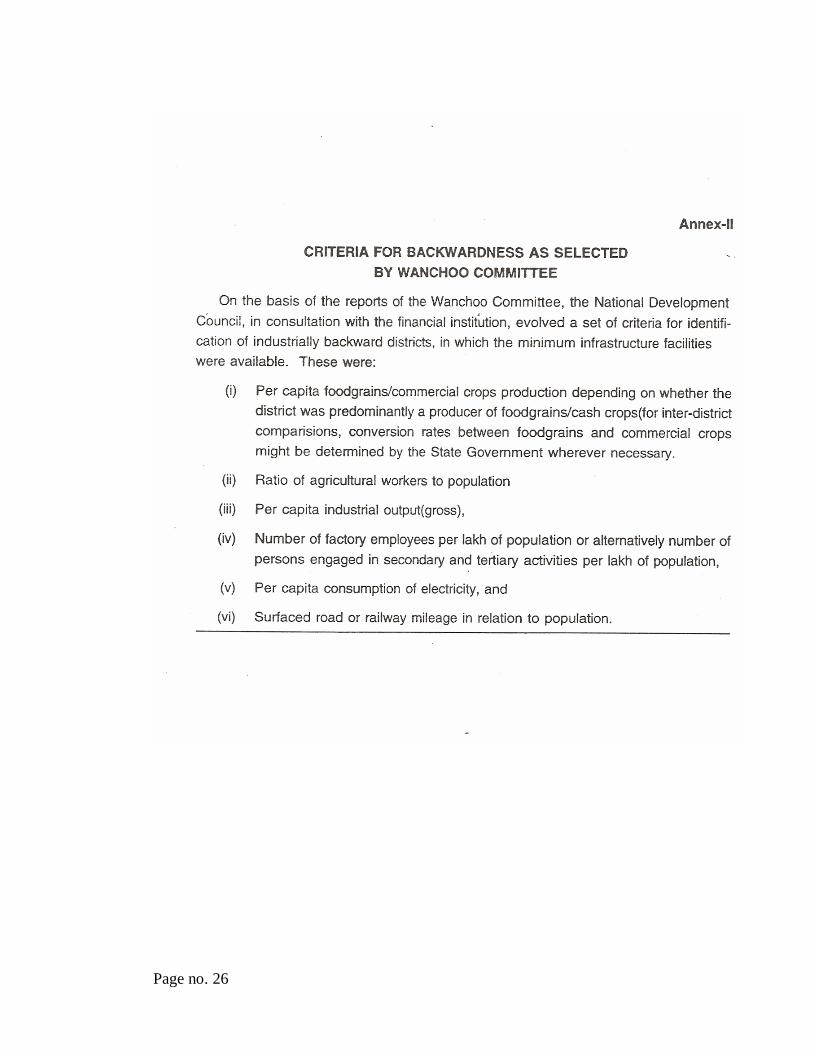
2.1 In 1968, Planning Commission set up two working groups, the “Pande Committee” (Annex I) to spell out the criteria for identifying industrially backward States/districts and Wanchoo Committee (Annex II) to look into fiscal and financial concessions necessary for promoting industries in backward areas. The reports of the groups were discussed by National Development Council and in consultation with the financial institutions, a set of criteria was evolved for identification of industrially backward areas in which minimum infrastructure facilities were available. Unfortunately, the criteria suggested by these committees were not followed by the State Governments and 245 out of a total of 396 districts were actually identified as backward districts for the purpose of concessions and incentives.
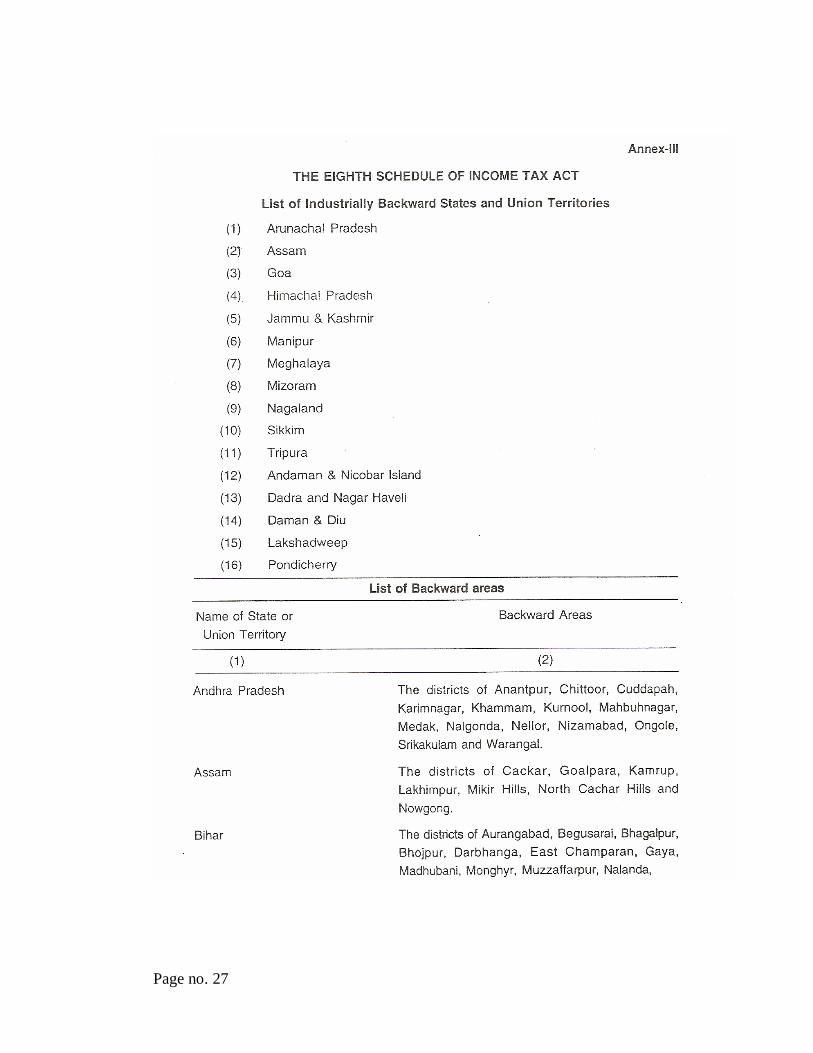
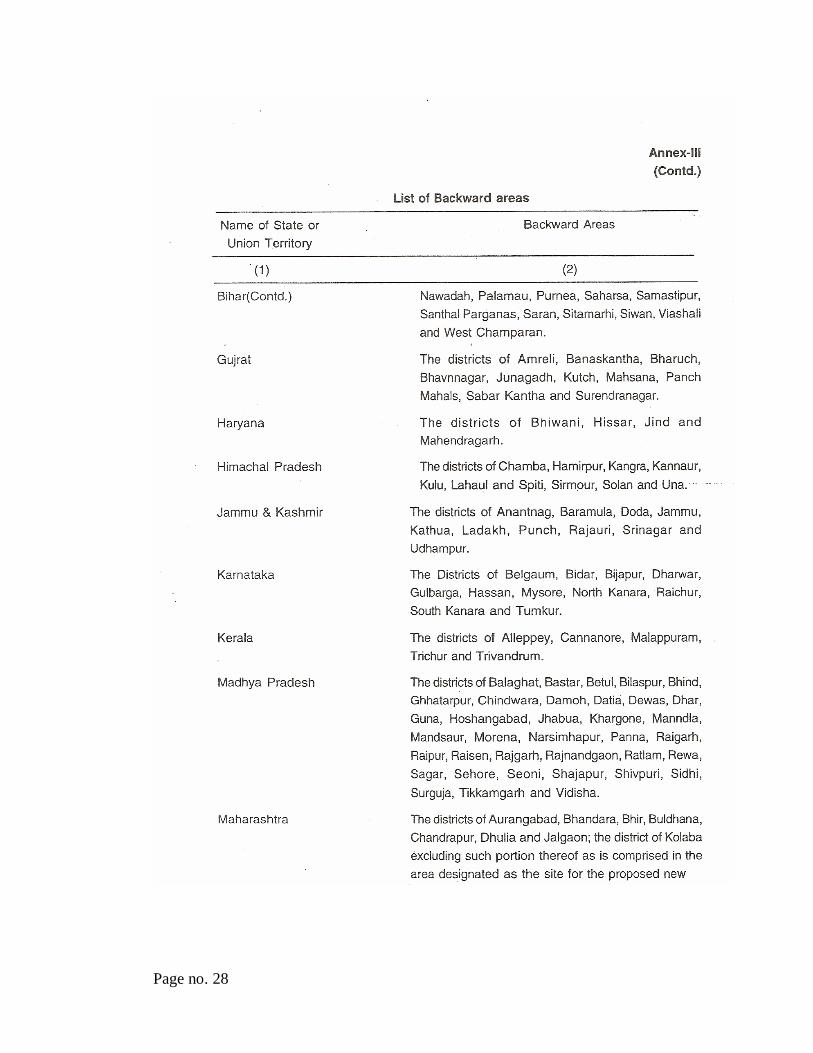
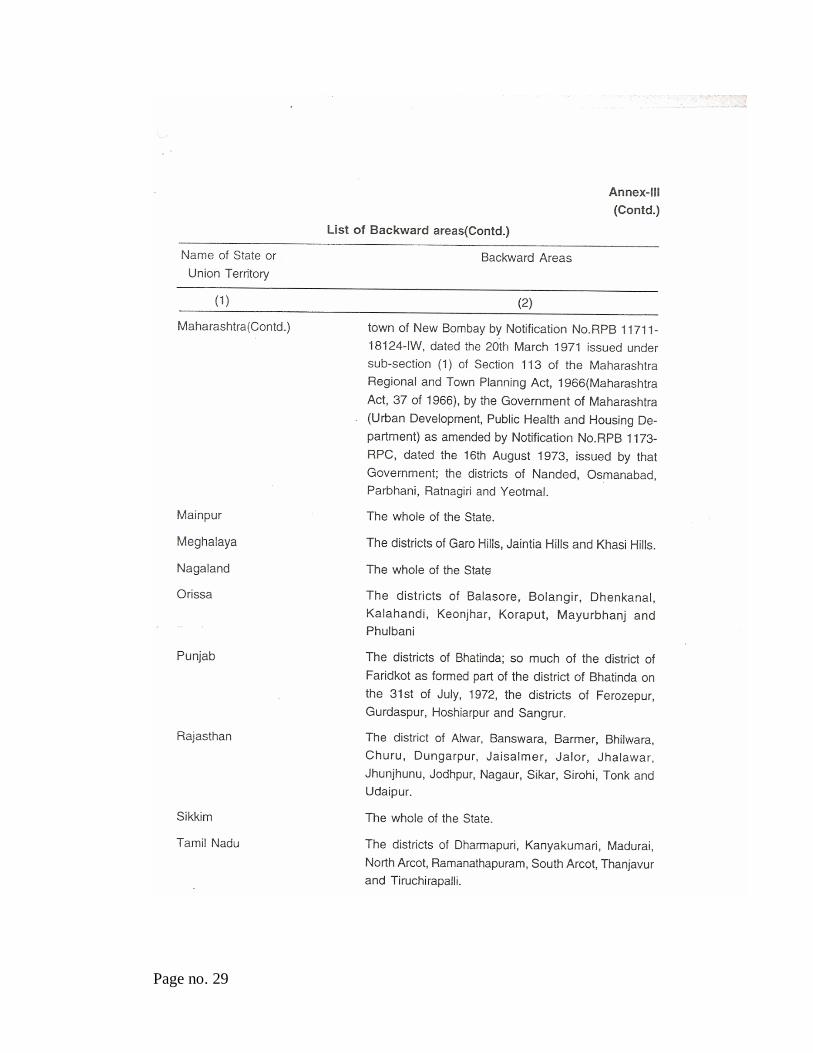
2.2 In 1987, at the instance of Central Board of Direct Taxes, National Institute of Public Finance and Policy, conducted a study to evaluate the impact of fiscal concessions on development of backward areas. The study concluded that while the fiscal incentives for backward areas development did successfully promote industrial dispersal, the criterion of identifying backward areas in a State with reference to its development indicators rather than all India norms favoured developed States. The study, however, suggested enlargement of the scope of tax incentives for new industrial establishments in Income Tax Act. This was the rationale for introduction of full tax holiday for the initial five years for the industrial policies in backward States or Union Territories specified in Eighth Schedule (Annex III).
2.3 Following the introduction of Finance Bill in 1993, many representations were received suggesting that industrially backward districts in otherwise backward States also needed same fiscal support. The Ministry of Finance accordingly constituted a Study Group on Fiscal Incentives for Industrialization under the Chairmanship of Dr. Shankar N Acharya, Chief Economic Adviser, Ministry of Finance. The study group suggested that there was need to redesign Central Government tax incentives for backward areas and that identification of backward districts
Page no. 5
in a State for any fiscal incentives should be based on objectivity and nationally determined norms and not on norms based on State averages. However, the study group did not identify the backward districts. This was left to another study group constituted in May, 1994 under the Chairmanship of Shri M K Kaw. This working group was specifically requested to suggest guidelines for identifying backward districts and to look into the issue of indicators for determining backwardness. The criteria for identifying the extent of backwardness, as suggested by the Study Group on Fiscal Incentives, were:
A. Financial criteria
- Per capital credit given by scheduled commercial banks - Per capital deposit received by Scheduled commercial
banks
B. Infrastructural criteria - Phones per thousand population - Per capital power consumption - Urbanisation (urban population of a districts as a
proportion of total population) - Metalled roads per 100 square kilometers
C. Industrial criteria - Workers in registered factories per thousand population
(excluding electrical undertakings and bidi & cigar units) - Per capital gross value added from registered
manufacturing sector (excluding electrical undertakings and bidi & cigar units)
2.4 On the basis of these two reports, 123 districts were identified as industrially backward. The scheme providing tax concessions (100 per cent for the first five years and 25 per cent thereafter) became effective from 1994 and remained in force until 2005.
Page no. 6
CHAPTER – 3 OPERATION OF SPECIFIC SCHEMES FOR BACKWARD AREA DEVELOPMENT
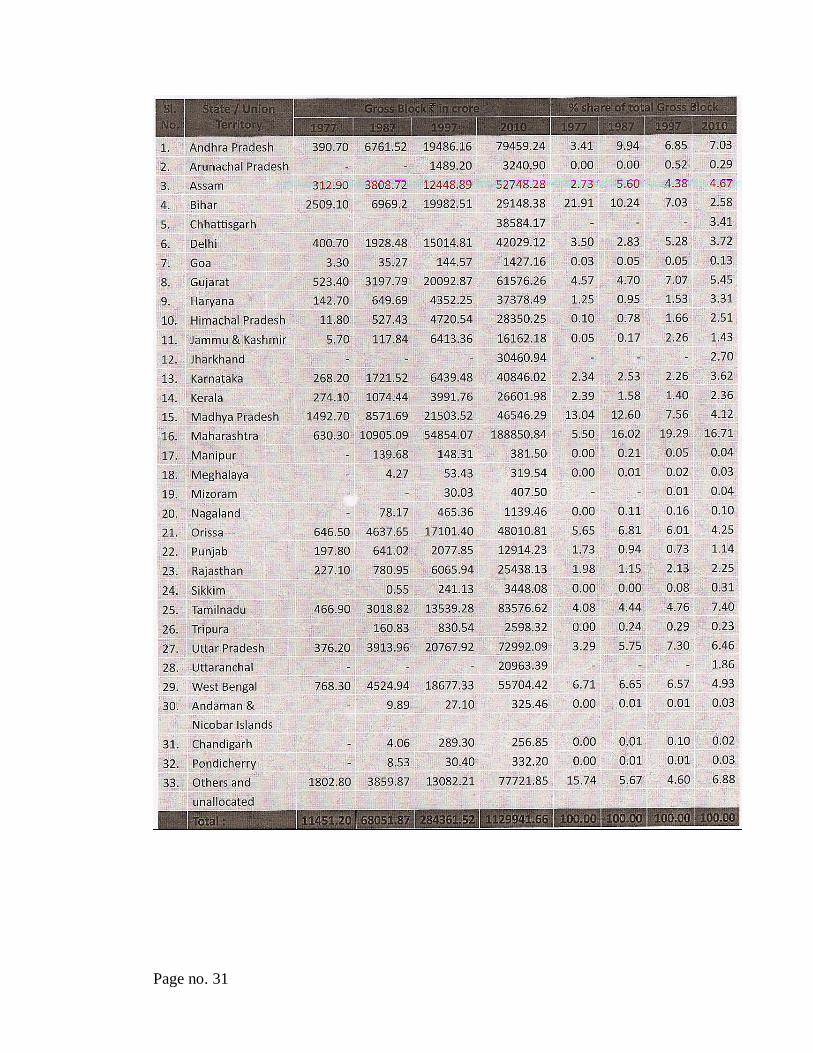
3.1 In the initial stages of planning, location of the public sector undertakings was one of the important instruments for balanced regional growth. PSUs were located in new regions and were expected to spur growth, both through their own investments and through the spill-over effects. PSUs were also conscious of their social responsibilities and helped in all-round development of their catchment areas. Investment by the Central sector PSUs in different States is indicated in Annex IV. The Government of India introduced a number of other schemes, which attempted to either make capital cheaper in the identified areas or have made transportation of raw materials and finished products cheaper or have provided economic infrastructure or all the three.
3.2 Government introduced a Central Investment Subsidy Scheme in 1971. This scheme classified backward areas into A, B and C categories depending on relative backwardness and proposed subsidy at differential rates of 10-25% on investment in land, building and plant & machinery subject to a maximum of Rs. 25 lakh. The scheme was discontinued in 1988 after being in operation for 17 years and over Rs 1,000 crore were reimbursed to the States as the results did not indicate any significant relative shift in favour of backward states/districts. In 1980, the National Committee on Development of backward areas reported that between 1971 & 1979, four relatively better off States (Tamil Nadu, Maharashtra, Gujarat and Karnataka) accounted for over 42% of the total subsidy disbursed. Assistance went more to the industrially backward regions of the States which had strong infrastructure support.
3.3 Lack of infrastructure was considered to be a critical constraint affecting the growth of industries. With a view to promoting industrialization of the backward areas in the country, the Government in June, 1988 announced a scheme of developing Growth Centres. A growth centre, each of which was to be developed in areas of 400-800 hectares was to be endowed with the basic infrastructural facilities like power, telecommunication, water and banking, enabling the centres to attract
Page no. 7
industries. Each growth centre was proposed to be developed at the cost of 25-30 crore, jointly funded by the centre, state and the financial institutions. The financing pattern of each growth centre was Rs. 10 crore from Central Government, Rs. 5 crore from al India Financial Institutions (including Rs. 2 crore as equity) besides Rs. 10 crore to be raised through market borrowings. The allocation of growth centres to the States was made on the basis combined criteria of population, area and the extent of industrial backwardness. Initially, 71 growth centres were identified under the scheme during 1992-1997. The scheme, prior to its being discontinued on March 31, 2009, had sanctioned 68 projects and an expenditure of nearly Rs 700 crore was made as central assistance. While some growth centres were able to attract industries, it took considerable time.
3.4 Department of Industrial Policy and Promotion also launched an Industrial Infrastructure Upgradation Scheme (IIUS) in 2003 as a Central Sector Scheme with a view to enhancing competitiveness of industry by providing quality infrastructure through public-private partnership in selected functional clusters. The objective of the scheme was to select and provide financial assistance to industrial clusters/locations with high growth potential which required strategic interventions in providing infrastructure like transport, road, water supply, common affluent treatment plant, hazardous waste management, information technology, R&D infrastructure etc for enhancing their competitiveness. 39 projects have so far been sanctioned. The scheme was evaluated in 2008 and based on the findings was re-casted in February 2009. Under the recast IIUS, Central assistance is provided by way of one time grant-in-aid (not equity) to the Special Purpose Vehicle (SPV) formed by the cluster of association for development of the infrastructure. The Central grant is restricted to 75% of the project cost subject to a ceiling of Rs.60 crore. The remaining 25% is financed by other stake holders of the respective cluster/location with a minimum industry contribution of 15% of the total project cost, which must be in form of cash and not in kind like the cost of land/existing building. In case of North Eastern States and Jammu and Kashmir, Himachal Pradesh and Uttarakhand, the central grant is up to 90% of the project cost with minimum industry contribution of 5% of the total project cost. Total approved cost under the scheme in the sanctioned
Page no. 8
projects is nearly Rs 2500 crore envisaging central assistance of Rs 1500 crore. An expenditure of Rs 1050 has already been incurred on the upgradation of infrastructure in selected clusters.
3.5 For small scale industries, a scheme of Integrated Infrastructure Development (IID) was also announced on 6th August, 1991. Until December 2010, 95 IID centres were sanctioned. The scheme envisaged setting up of the IID centres in the backward districts which were not covered under the growth centres scheme, to create and develop infrastructural facilities like developed sites, power distribution network, water, telecommunications, drainage and pollution control facilities, road, banks, raw material, storage and marketing outlets, common services facilities and technological back-up services. Each centre was to be setup at a cost of Rs. 5 crore, shared by the Union and the States.
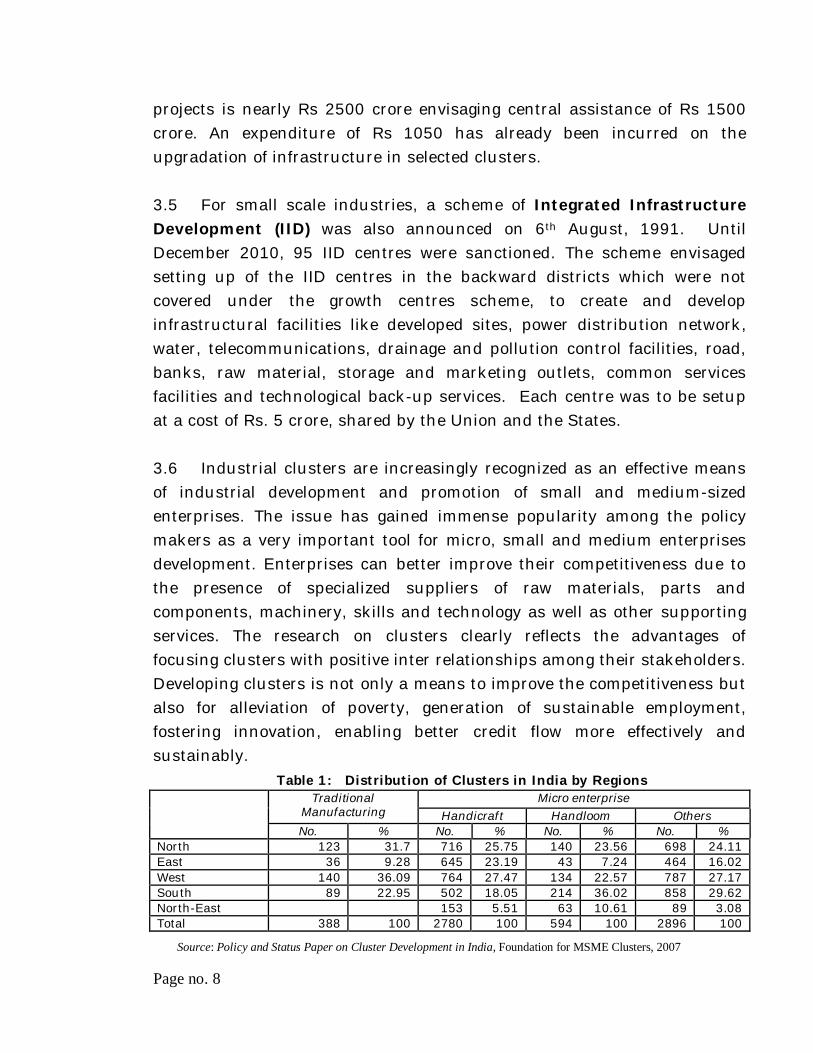
3.6 Industrial clusters are increasingly recognized as an effective means of industrial development and promotion of small and medium-sized enterprises. The issue has gained immense popularity among the policy makers as a very important tool for micro, small and medium enterprises development. Enterprises can better improve their competitiveness due to the presence of specialized suppliers of raw materials, parts and components, machinery, skills and technology as well as other supporting services. The research on clusters clearly reflects the advantages of focusing clusters with positive inter relationships among their stakeholders. Developing clusters is not only a means to improve the competitiveness but also for alleviation of poverty, generation of sustainable employment, fostering innovation, enabling better credit flow more effectively and sustainably.
Table 1: Distribution of Clusters in India by Regions Micro enterprise Traditional
Manufacturing Handicraft Handloom Others
No. % No. % No. % No. % North 123 31.7 716 25.75 140 23.56 698 24.11 East 36 9.28 645 23.19 43 7.24 464 16.02 West 140 36.09 764 27.47 134 22.57 787 27.17 South 89 22.95 502 18.05 214 36.02 858 29.62 North-East 153 5.51 63 10.61 89 3.08 Total 388 100 2780 100 594 100 2896 100
Source: Policy and Status Paper on Cluster Development in India, Foundation for MSME Clusters, 2007
Page no. 9
3.7 The Ministry of Micro, Small and Medium Scale Industries (MSME) adopted the cluster approach as a key strategy for enhancing the productivity and competitiveness as well as capacity building of small enterprises (including small scale industries and small scale service and business entities) and their collectives in the country. Among other things, this approach also facilitates substantial economies of scale in terms of deployment of available resources for effective implementation and more sustainable results in the medium to long term. There are over 6000 clusters and MSME has taken up 471 clusters so far for diagnostic studies, soft and hard intervention.
3.8 In spatial development of industries, special care was taken for the development of industries in remote and inaccessible areas, particularly the States in the North East. For accelerating industrial development in the North Eastern Region (NER), the Industrial Policy called the ‘North East Industrial Policy (NEIP), 1997’ was notified on 24.12.1997. The NEIP, 1997 was revised and the new ‘North East Industrial and Investment Promotion Policy (NEIIPP), 2007’ was notified on 1.4.2007 with an objective to stabilize existing investments and to attract new investment in the NER. Under the scheme benefit is available to new industrial units as well as existing industrial unit on their substantial expansion, for a period of 10 years from the date of commencement of commercial production. Besides the seven States (Arunachal Pradesh, Assam, Manipur, Meghalaya, Mizoram, Nagaland and Tripura), Sikkim has also been included in the Policy. The scheme also provides for benefit of exemption from Excise duty and income tax. Benefits available under the scheme are mainly in terms of Capital Investment subsidy; Central Interest subsidy and Comprehensive Insurance subsidy. Under the NEIIPP, over Rs 600 crore has so far been released.
3.9 A new Centrally Sponsored Scheme for boosting industrialization in the Special Category States of Jammu & Kashmir, Himachal Pradesh and Uttarakhand by way of incentives to the new industrial units as well as the existing industrial units in these States on the substantial expansion of their activities was announced in June 2002 for J&K and January 2003 for
Page no. 10
the other two States. Benefits of the similar nature as are available to industrial units in NE States are available to the industries in these states. Both these packages are for a period of 10 years from their date of launching. An amount of around Rs 250 crore has so far been released under this scheme to the beneficiary states.
3.10 Poor connectivity and high cost of transportation of raw materials and finished products or market access has been an important factor in poor growth of industries. Transport Subsidy Scheme was accordingly introduced in July, 1971 for promoting industrialization by way of subsiding transport cost of industrial units in the hilly, remote and inaccessible areas. The Scheme is applicable to all the industrial units (barring plantations, refineries and power generating units) irrespective of their size, both in private and the public sector located in the eight States of North-Eastern Region, Himachal Pradesh, Jammu and Kashmir, Sikkim, Darjeeling District of West Bengal, Union Territories of Andaman & Nicobar Islands and Lakshadweep, and the hilly districts of Uttarakhand. Under the scheme subsidy ranging between 50% and 90% of the transport cost incurred is admissible on the movement of raw material and finished goods from the designated rail-heads/ports up to the location of the industrial unit(s) and vice-versa for a period of five years from the date of commencement of commercial production. Since inception of the Scheme an amount of Rs. 2500 crore has been released to the various States/UT’s/Nodal Agencies.
Page no. 11
CHAPTER 4 BACKWARD AREA DEVELOPMENT THROUGH GREATER RELATIVE ALLOCATION OF RESOURCES AT MACRO LEVEL
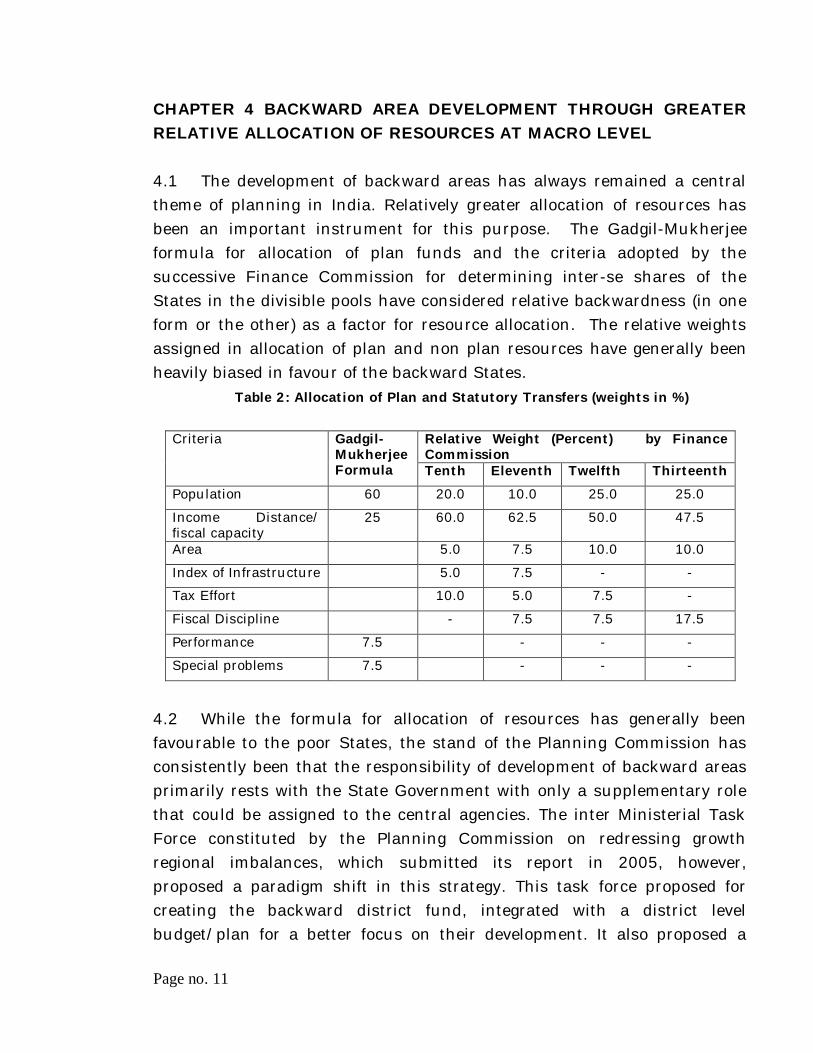
4.1 The development of backward areas has always remained a central theme of planning in India. Relatively greater allocation of resources has been an important instrument for this purpose. The Gadgil-Mukherjee formula for allocation of plan funds and the criteria adopted by the successive Finance Commission for determining inter-se shares of the States in the divisible pools have considered relative backwardness (in one form or the other) as a factor for resource allocation. The relative weights assigned in allocation of plan and non plan resources have generally been heavily biased in favour of the backward States.
Table 2: Allocation of Plan and Statutory Transfers (weights in %)
Relative Weight (Percent) by Finance Commission
Criteria Gadgil-Mukherjee Formula Tenth Eleventh Twelfth Thirteenth
Population 60 20.0 10.0 25.0 25.0
Income Distance/ fiscal capacity
25 60.0 62.5 50.0 47.5
Area 5.0 7.5 10.0 10.0
Index of Infrastructure 5.0 7.5 - -
Tax Effort 10.0 5.0 7.5 -
Fiscal Discipline - 7.5 7.5 17.5
Performance 7.5 - - -
Special problems 7.5 - - -
4.2 While the formula for allocation of resources has generally been favourable to the poor States, the stand of the Planning Commission has consistently been that the responsibility of development of backward areas primarily rests with the State Government with only a supplementary role that could be assigned to the central agencies. The inter Ministerial Task Force constituted by the Planning Commission on redressing growth regional imbalances, which submitted its report in 2005, however, proposed a paradigm shift in this strategy. This task force proposed for creating the backward district fund, integrated with a district level budget/plan for a better focus on their development. It also proposed a

Page no. 12
bottom of approach of development based on perceived needs and capacities of these areas. This dovetailing with regular district level planning and budgeting and it being based on local resource endowments was to ensure that the additionality provided is fully utilized within the specified time frame.
Page no. 13
CHAPTER – 5 STUDY OF THE OUTCOME OF THESE INITIATIVES
5.1 Most of these initiatives have been industry centric and have aimed at balanced regional dispersal of industries. The outcome of the policy initiatives has, therefore, been examined in terms of the following three parameters:
1. Whether there has been a convergence in terms of the per capita Gross State Domestic Products (GSDP) from the Industries;
2. Whether there has been convergence in terms of the share of the industries in GSDP; and
3. Whether there has been a convergence in terms of the per capita GSDP.
5.2 State wise data of GSDP for 10 years from 1999-2000 to 2009-2010 have been used for this purpose. Detailed results are in Annex V to VIII and the data used is indicated in Appendix A. Further, while the district has been the appropriate unit for identification of backwardness, this analysis has remained State centric. There are no doubt backward districts in the better off states and vice versa, the results at a district level disaggregation may not be significantly different.
Convergence of the share of per capita GSDP from industry
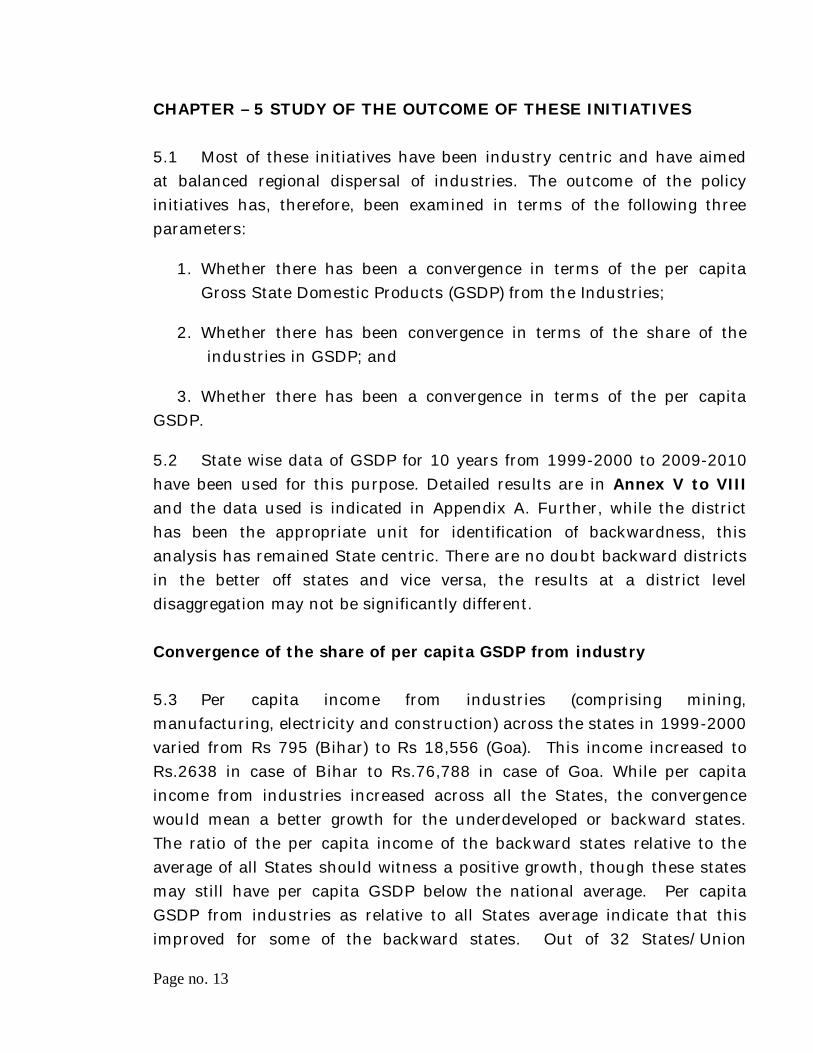
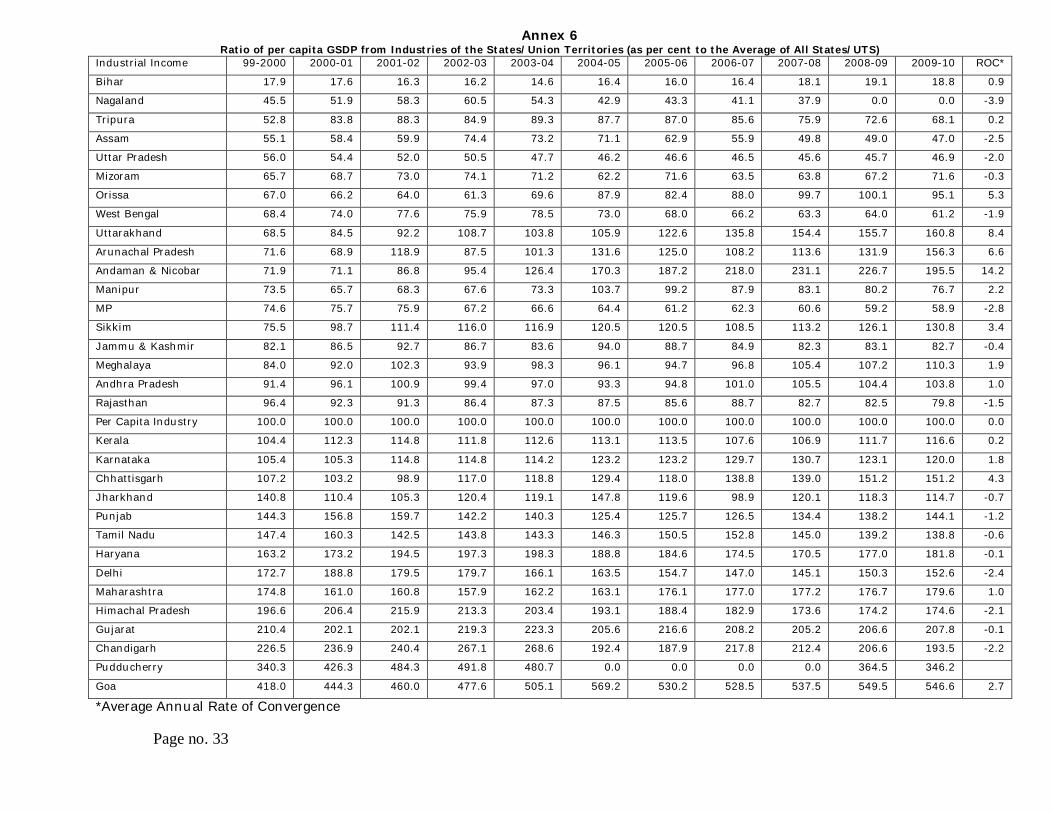
5.3 Per capita income from industries (comprising mining, manufacturing, electricity and construction) across the states in 1999-2000 varied from Rs 795 (Bihar) to Rs 18,556 (Goa). This income increased to Rs.2638 in case of Bihar to Rs.76,788 in case of Goa. While per capita income from industries increased across all the States, the convergence would mean a better growth for the underdeveloped or backward states. The ratio of the per capita income of the backward states relative to the average of all States should witness a positive growth, though these states may still have per capita GSDP below the national average. Per capita GSDP from industries as relative to all States average indicate that this improved for some of the backward states. Out of 32 States/Union
Page no. 14
Territories which compile GSDP numbers, 18 States/UTs were below the national average in 1999-2000. Six of these 18 States/UTS improved their relative share in per capita GSDP from industries to an extent that in 2009-10, this exceeded the national average in that year. In case of the remaining 12 States/UTs, 4 states/UTs had a positive rate of convergence, in the sense that the average annual increase in per capita industrial GSDP was higher than the average of all States. However, in case of Nagaland, Assam, Uttar Pradesh, Mizoram, West Bengal, Madhya Pradesh, Jammu and Kashmir and Rajasthan, rate of growth of per capita GSDP from industries was lower than the average of all States. The ratio of the per capita GSDP from industries in these States worsened in this decade. (Table 3)
Table 3: Ratio of Per Capita GSDP from Industries
relative to the National Average (per cent)
States with per capita GSTP lower than Average
1999-2000
2009-2010
Average annual rate of Convergence
States with per capita income higher than average
1999-2000
2009-2010
Average annual rate of Convergence
Bihar 17.9 18.8 0.9 Kerala 104.4 116.6 0.2
Nagaland* 45.5 37.9 -3.9 Karnataka 105.4 120.0 1.8
Tripura 52.8 68.1 0.2 Chhattisgarh 107.2 151.2 4.3
Assam 55.1 47.0 -2.5 Jharkhand 140.8 114.7 -0.7
Uttar Pradesh 56.0 46.9 -2.0 Punjab 144.3 144.1 -1.2
Mizoram 65.7 71.6 -0.3 Tamil Nadu 147.4 138.8 -0.6
Orissa 67.0 95.1 5.3 Haryana 163.2 181.8 -0.1
West Bengal 68.4 61.2 -1.9 Delhi 172.7 152.6 -2.4
Uttarakhand 68.5 160.8 8.4 Maharashtra 174.8 179.6 1.0
Arunachal Pradesh 71.6 156.3 6.6 Himachal Pradesh
196.6 174.6 -2.1
Andaman & Nicobar
71.9 195.5 14.2 Gujarat 210.4 207.8 -0.1
Manipur 73.5 76.7 2.2 Chandigarh 226.5 193.5 -2.2
Madhya Pradesh 74.6 58.9 -2.8 Pudducherry 340.3 346.2
Sikkim 75.5 130.8 3.4 Goa 418.0 546.6 2.7
Jammu & Kashmir 82.1 82.7 -0.4
Meghalaya 84.0 110.3 1.9
Andhra Pradesh 91.4 103.8 1.0
Rajasthan 96.4 79.8 -1.5
* Data pertains to 2007-08
Page no. 15
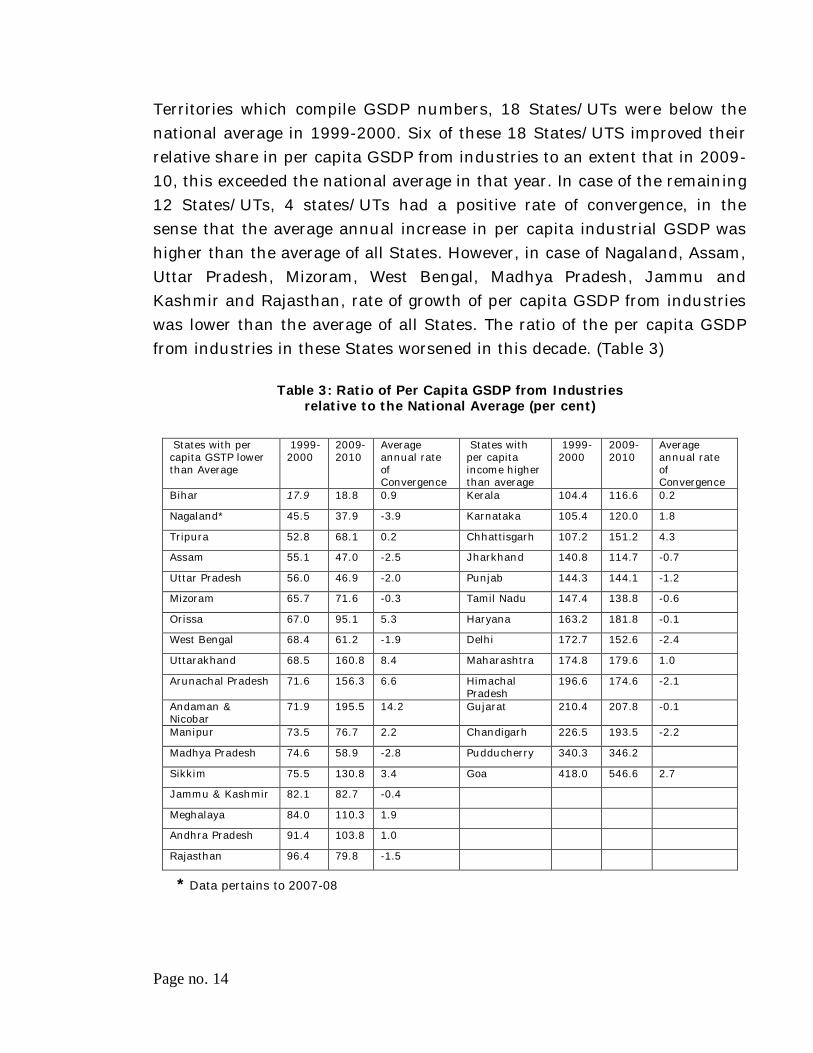
Convergence of the share of industry in GSDP
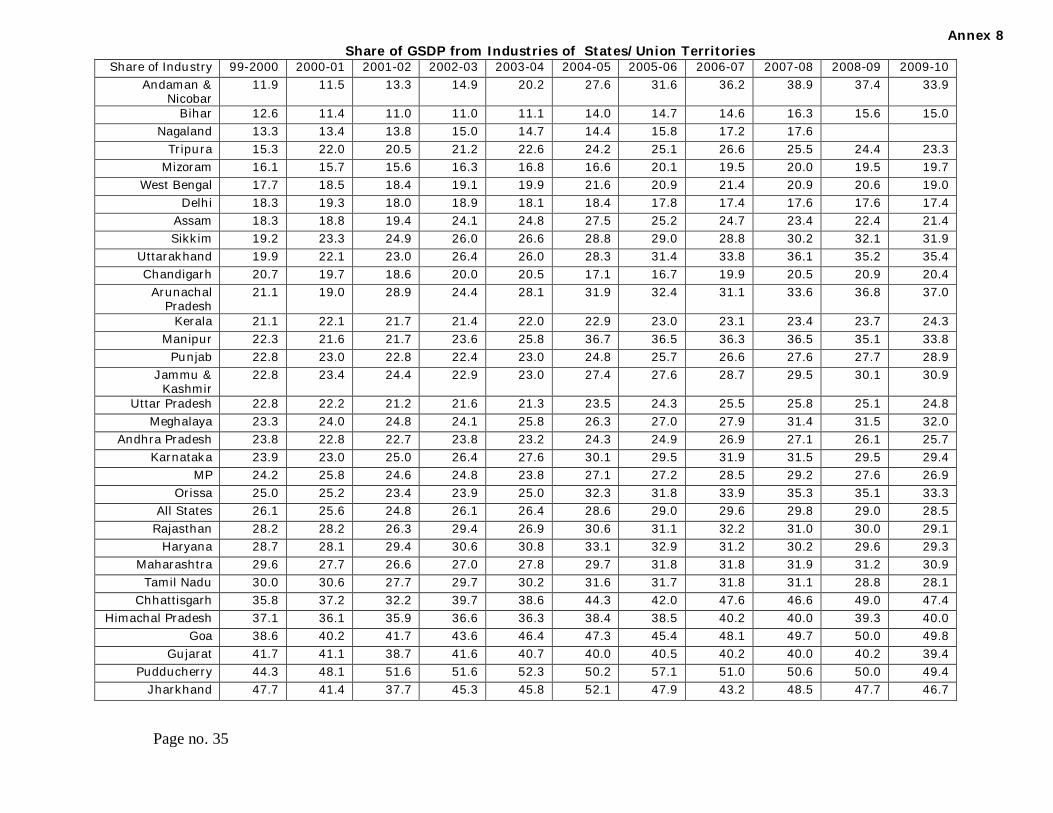
5.4 Another way of looking at the outcome of the backward area initiatives is to look at the share of industries in GSDP of the States. The share of GSDP from industries in overall GSDP of the States/UTs in 1999-2000, varied from 11.9 per cent (Andaman & Nicobar) to 47.7 per cent in Jharkhand. In 2009-10, the range widened from a low of 15 per cent in case of Bihar to 49.8 per cent for Goa. (Table 4)
Table 4: Share of GSDP from Industries (per cent)
States with share lower than average
1999-2000
2009-10 States with share higher than average
1999-2000
2009-2010
Andaman & Nicobar 11.9 33.9 Rajasthan 28.2 29.1
Bihar 12.6 15.0 Haryana 28.7 29.3
Nagaland 13.3 Maharashtra 29.6 30.9
Tripura 15.3 23.3 Tamil Nadu 30.0 28.1
Mizoram 16.1 19.7 Chhattisgarh 35.8 47.4
West Bengal 17.7 19.0 Himachal Pradesh 37.1 40.0
Delhi 18.3 17.4 Goa 38.6 49.8
Assam 18.3 21.4 Gujarat 41.7 39.4
Sikkim 19.2 31.9 Pudducherry 44.3 49.4
Uttarakhand 19.9 35.4 Jharkhand 47.7 46.7
Chandigarh 20.7 20.4 All States/UTs average 26.1 28.5
Arunachal Pradesh 21.1 37.0
Kerala 21.1 24.3
Manipur 22.3 33.8
Punjab 22.8 28.9
Jammu & Kashmir 22.8 30.9
Uttar Pradesh 22.8 24.8
Meghalaya 23.3 32.0
Andhra Pradesh 23.8 25.7
Karnataka 23.9 29.4
Madhya Pradesh 24.2 26.9
Orissa 25.0 33.3
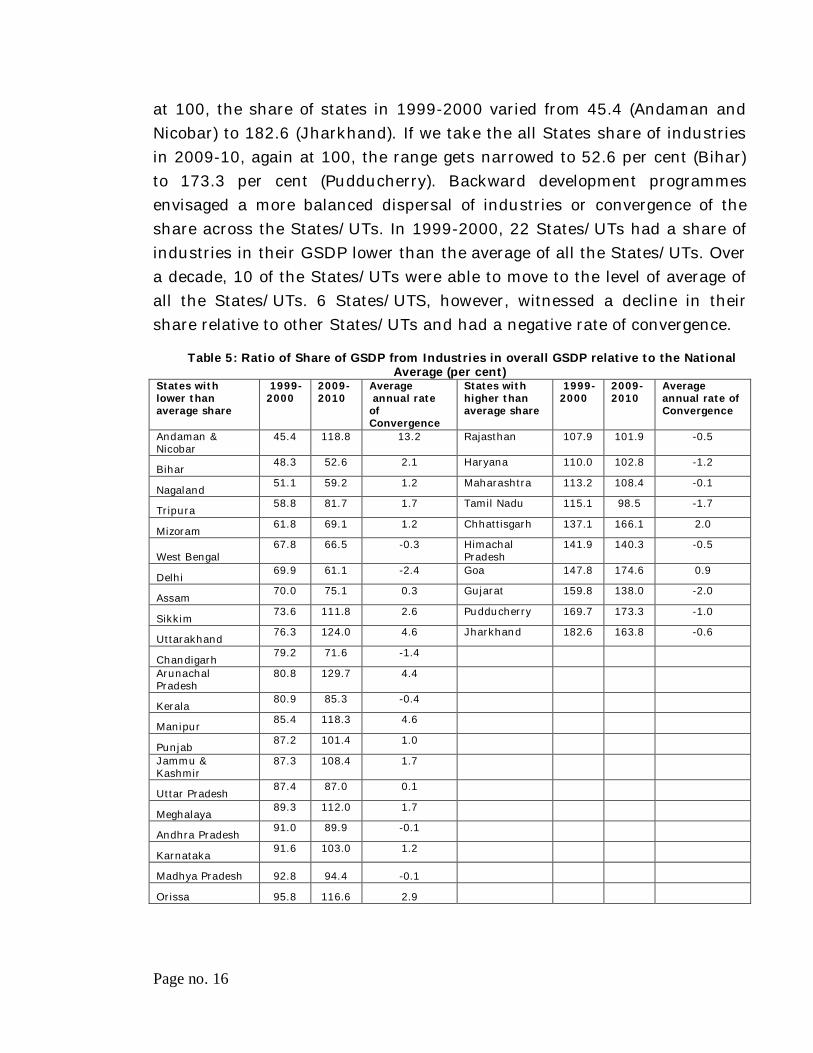
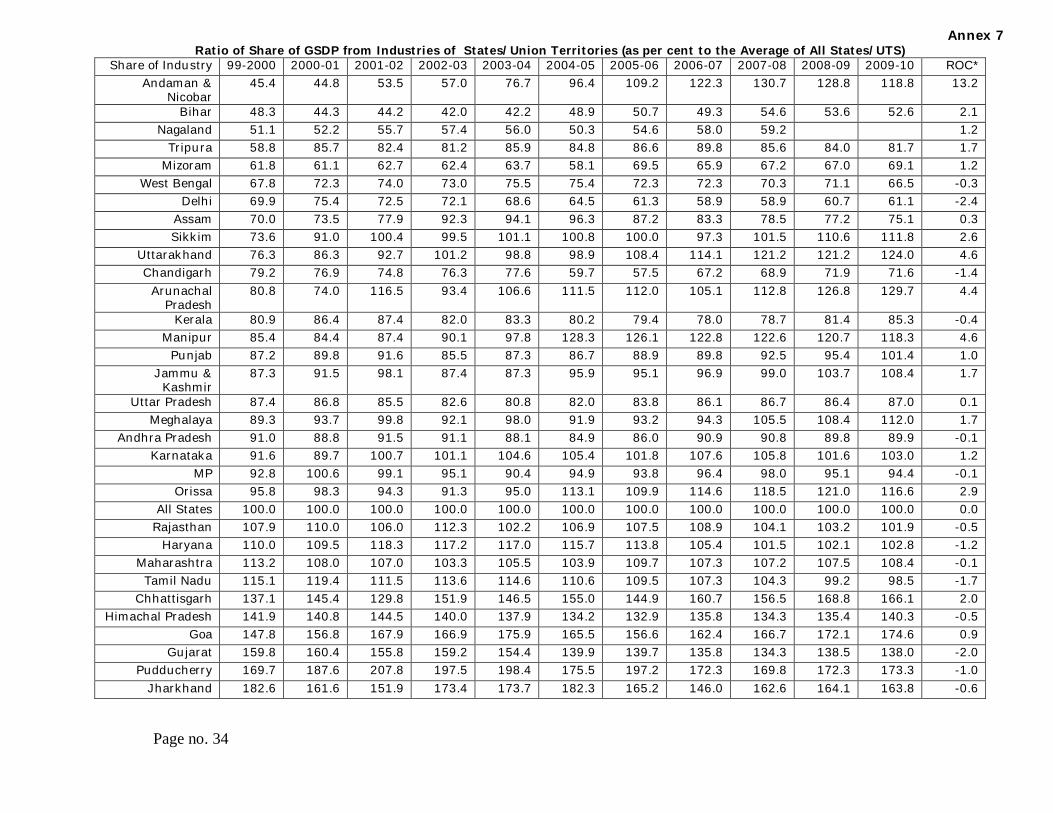
5.5 More than the share of industries in overall GSDP, for convergence, a more appropriate indicator could be the improvement in the share of industries in GSDP relative to the average of all States or simply relative to other states. (Table 4) If we take the all States share of industries in GSDP
Page no. 16
at 100, the share of states in 1999-2000 varied from 45.4 (Andaman and Nicobar) to 182.6 (Jharkhand). If we take the all States share of industries in 2009-10, again at 100, the range gets narrowed to 52.6 per cent (Bihar) to 173.3 per cent (Pudducherry). Backward development programmes envisaged a more balanced dispersal of industries or convergence of the share across the States/UTs. In 1999-2000, 22 States/UTs had a share of industries in their GSDP lower than the average of all the States/UTs. Over a decade, 10 of the States/UTs were able to move to the level of average of all the States/UTs. 6 States/UTS, however, witnessed a decline in their share relative to other States/UTs and had a negative rate of convergence.
Table 5: Ratio of Share of GSDP from Industries in overall GSDP relative to the National Average (per cent)
States with lower than average share
1999-2000
2009-2010
Average annual rate of Convergence
States with higher than average share
1999-2000
2009-2010
Average annual rate of Convergence
Andaman & Nicobar
45.4 118.8 13.2 Rajasthan 107.9 101.9 -0.5
Bihar 48.3 52.6 2.1 Haryana 110.0 102.8 -1.2
Nagaland 51.1 59.2 1.2 Maharashtra 113.2 108.4 -0.1
Tripura 58.8 81.7 1.7 Tamil Nadu 115.1 98.5 -1.7
Mizoram 61.8 69.1 1.2 Chhattisgarh 137.1 166.1 2.0
West Bengal 67.8 66.5 -0.3 Himachal
Pradesh 141.9 140.3 -0.5
Delhi 69.9 61.1 -2.4 Goa 147.8 174.6 0.9
Assam 70.0 75.1 0.3 Gujarat 159.8 138.0 -2.0
Sikkim 73.6 111.8 2.6 Pudducherry 169.7 173.3 -1.0
Uttarakhand 76.3 124.0 4.6 Jharkhand 182.6 163.8 -0.6
Chandigarh 79.2 71.6 -1.4
Arunachal Pradesh
80.8 129.7 4.4
Kerala 80.9 85.3 -0.4
Manipur 85.4 118.3 4.6
Punjab 87.2 101.4 1.0
Jammu & Kashmir
87.3 108.4 1.7
Uttar Pradesh 87.4 87.0 0.1
Meghalaya 89.3 112.0 1.7
Andhra Pradesh 91.0 89.9 -0.1
Karnataka 91.6 103.0 1.2
Madhya Pradesh 92.8 94.4 -0.1
Orissa 95.8 116.6 2.9
Page no. 17
Convergence of the per capita GSDP
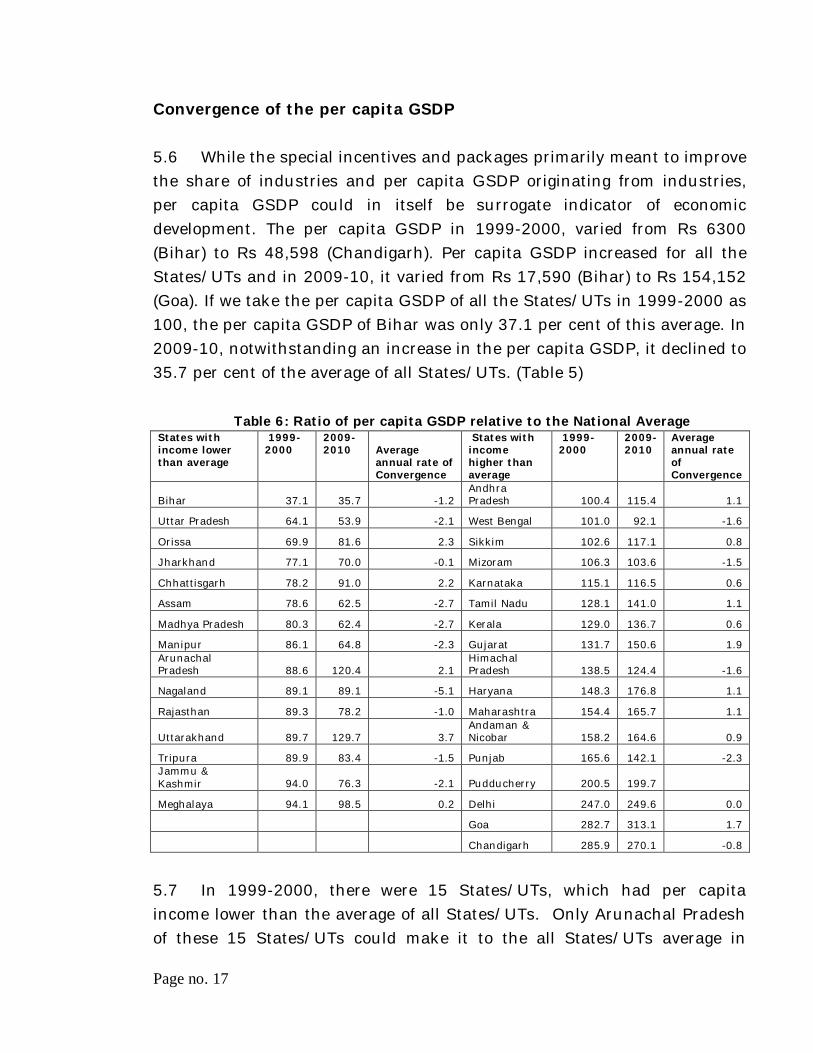
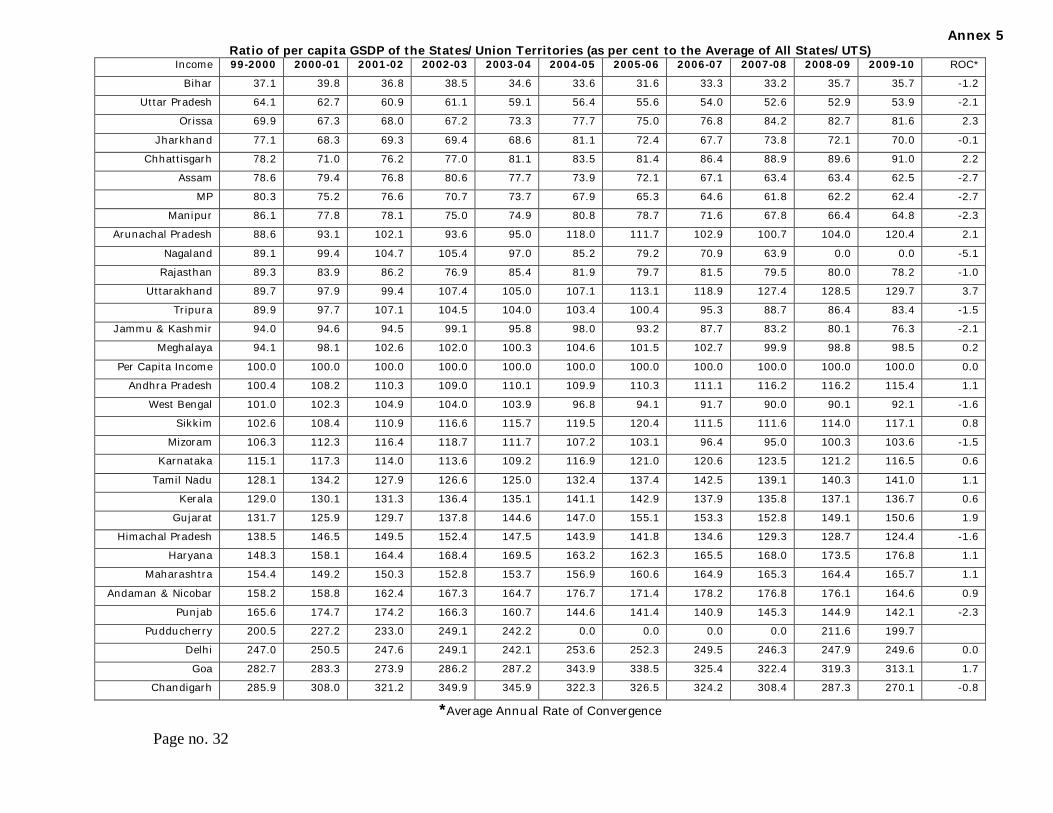
5.6 While the special incentives and packages primarily meant to improve the share of industries and per capita GSDP originating from industries, per capita GSDP could in itself be surrogate indicator of economic development. The per capita GSDP in 1999-2000, varied from Rs 6300 (Bihar) to Rs 48,598 (Chandigarh). Per capita GSDP increased for all the States/UTs and in 2009-10, it varied from Rs 17,590 (Bihar) to Rs 154,152 (Goa). If we take the per capita GSDP of all the States/UTs in 1999-2000 as 100, the per capita GSDP of Bihar was only 37.1 per cent of this average. In 2009-10, notwithstanding an increase in the per capita GSDP, it declined to 35.7 per cent of the average of all States/UTs. (Table 5)
Table 6: Ratio of per capita GSDP relative to the National Average
States with income lower than average
1999-2000
2009-2010 Average
annual rate of Convergence
States with income higher than average
1999-2000
2009-2010
Average annual rate of Convergence
Bihar 37.1 35.7 -1.2 Andhra Pradesh 100.4 115.4 1.1
Uttar Pradesh 64.1 53.9 -2.1 West Bengal 101.0 92.1 -1.6
Orissa 69.9 81.6 2.3 Sikkim 102.6 117.1 0.8
Jharkhand 77.1 70.0 -0.1 Mizoram 106.3 103.6 -1.5
Chhattisgarh 78.2 91.0 2.2 Karnataka 115.1 116.5 0.6
Assam 78.6 62.5 -2.7 Tamil Nadu 128.1 141.0 1.1
Madhya Pradesh 80.3 62.4 -2.7 Kerala 129.0 136.7 0.6
Manipur 86.1 64.8 -2.3 Gujarat 131.7 150.6 1.9 Arunachal Pradesh 88.6 120.4 2.1
Himachal Pradesh 138.5 124.4 -1.6
Nagaland 89.1 89.1 -5.1 Haryana 148.3 176.8 1.1
Rajasthan 89.3 78.2 -1.0 Maharashtra 154.4 165.7 1.1
Uttarakhand 89.7 129.7 3.7 Andaman & Nicobar 158.2 164.6 0.9
Tripura 89.9 83.4 -1.5 Punjab 165.6 142.1 -2.3 Jammu & Kashmir 94.0 76.3 -2.1 Pudducherry 200.5 199.7
Meghalaya 94.1 98.5 0.2 Delhi 247.0 249.6 0.0
Goa 282.7 313.1 1.7
Chandigarh 285.9 270.1 -0.8
5.7 In 1999-2000, there were 15 States/UTs, which had per capita income lower than the average of all States/UTs. Only Arunachal Pradesh of these 15 States/UTs could make it to the all States/UTs average in
Page no. 18
2009-10. The rate of convergence (average annual rate at which the per capita GSDP of a State /UT is converging to the national average) was only for 5 of these 15 States/UTs. West Bengal though had per capita GSDP higher than the average of all States/UTs in 1999-2000, had a negative convergence rate and its per capita GSDP fell below the average of all States/UTs in 2009-10.
Page no. 19
CHAPTER – 6 BACKWARD AREA GRANT FUND (BRGF) - A NEW APPROACH TO ADDRESS REGIONAL IMBALANCES
6.1 The policy intervention for the dispersal of industries, particularly the development of backward areas had a mixed success. Even in late 1990s, the approach towards the development of industries in backward areas had undergone major changes. The emphasis was shifted to provide incentives in remote and inaccessible regions, rather than the districts with in a State. The North East Industrial Policy of 1997 was a beginning this direction. The extension of such packages to the States of Jammu and Kashmir, Himachal Pradesh and Uttarakhand was extension of the same approach in subsequent years. The North East Industrial development package was further modified in 2007 and is in operation currently. Access and connectivity together with the infrastructure which facilitates exploitation of the resource potential of the area are critical for economic convergence. These gaps may need to be addressed before for any industry specific intervention to be successful.
6.2 In Planning Commission as well, the approach to the development of backward areas underwent a paradigm shift. Instead of a single proxy, either as per capita GSDP or share of industry, backwardness began to be viewed through a multiplicity of criteria, encompassing social and economic factors. The approach to development has also shifted from a top down planning to a “bottoms up” approach. While the district remains the appropriate administrative unit under this approach, it has centered round development of economic and social parameters in the administrative unit. Though not specifically stated, it perhaps signaled that manufacturing per se may not essentially lead to regional balances. Further, it may also be an indication that infrastructural development, covering both physical and social infrastructure, was the first order conditions and the manufacturing growth could only be build on these first order conditions. Manufacturing also had a very small share in overall GSDP of the backward states, so while the development of manufacturing was important, this in itself was not sufficient to ensure a balanced growth.
Page no. 20
6.3 The Tenth Five Year Plan adopted a new approach to deal with the issue of regional disparities. The Inter-Ministry Task Force (IMTF) constituted by the Planning Commission submitted its report on redressing growing regional imbalances in January 2005. While analyzing the approach adopted by the earlier committees, IMTF mentioned that, “on the whole, these committees did not extend their analysis to the manner in which Centrally Sponsored Schemes of key ministries and departments were also targeting progress and did not attempt to assess the impact of existing formulae employed to channel plan and non-plan resources.” It also mentioned that the approach so far has been to transfer resources in a top down manner. The preferred strategy of IMTF is on “creating a Backward District Fund, integrated with district level budget/plan developed from below through a system of village plans based on perceived needs and real capacities of these areas.”
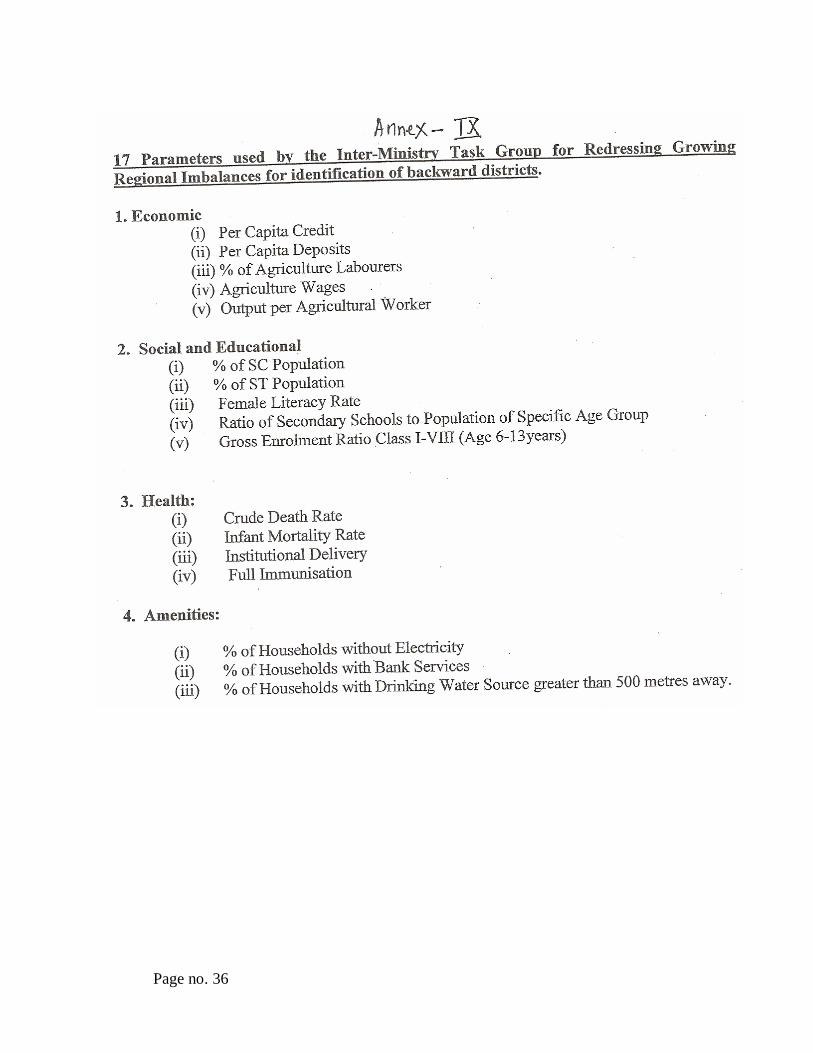
6.4 IMTF recognized that the regions have unequal resource endowments- physical, human, infrastructural and resources and these disparities or unequal endowments, caused by historical or cultural factors, require adoption of a unique strategy to deal with the imbalances. It is not the flow of resources alone, but dovetailing such transfers with the aspiration of the people and their resource endowments. The lack of convergence of per capita GSDP of share of industries in GSDP may have partly been because the interventions did not adopt bottoms up approach. Each region/district is endowed with specific resources and their optimal utilization based on perceived needs and the opportunities is critical for economic prosperity. ITMF, therefore, adopted a composite approach to identify backwardness consisting of multiple criteria (17 criteria- Annex 9) broadly grouped under four categories of physical resource endowments, human resources, availability of physical infrastructure and capacity to raise resources. ITMF identified 170 districts as the backward districts.
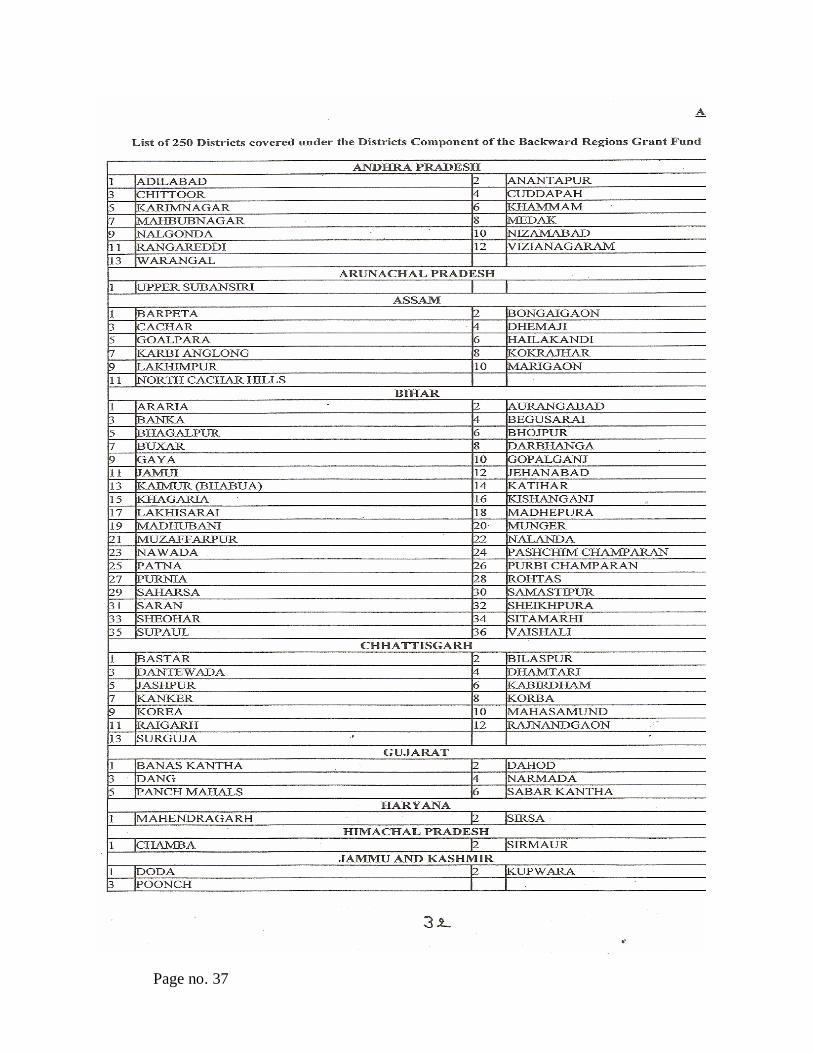
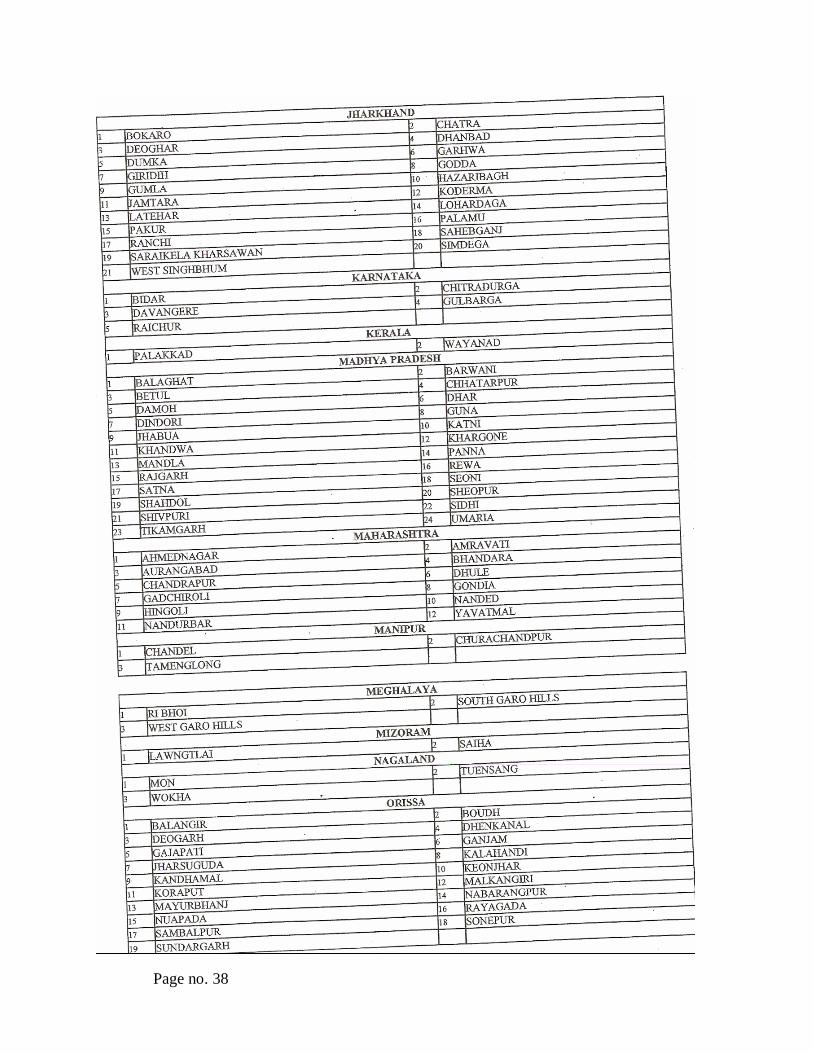
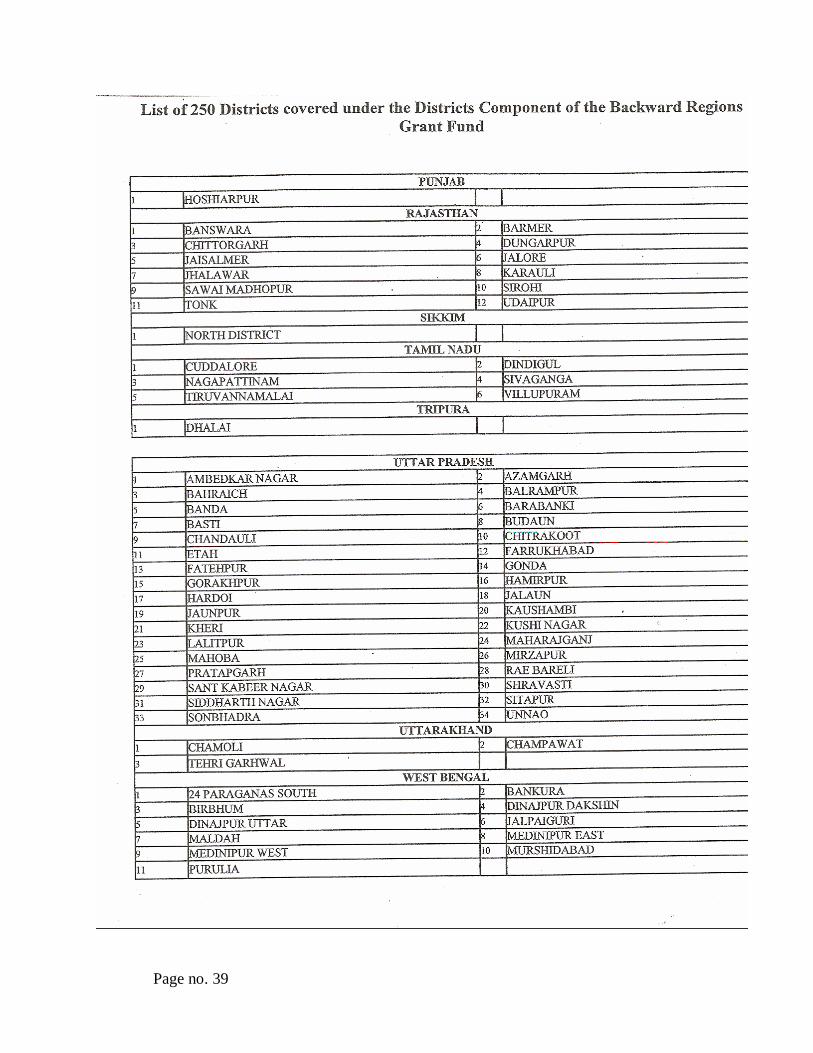
6.5 The creation of Backward Regions Grant Fund (BRGF) in 2005-06 subsumed the ongoing programme of addressing regional imbalances. BRGF covers 250 backward districts. The list of 250 districts includes all the 200 districts covered under the first phase of the National Rural Employment Guarantee Programme (NREGP) and 170 districts identified by
Page no. 21
ITMF. The 200 districts covered under first phase of NREGP include 147 districts covered under Rashtriya Sam Vikas Yojana and 150 districts covered under National Food for Work Programme. These districts were earlier identified on the basis of index of backwardness comprising three parameters with equal weights assigned to them covering value of output per agricultural labour, agricultural wage rate and percentage of SC/ST population of the district1. (List of 250 districts is at Annex 8). While finalizing list of districts for progress under BRGF, Goa, Pondicherry, Delhi and other Union Territories, State capitals, districts within urban agglomeration of the million plus and districts, which have major cities of the States were excluded. The IMTF also did not consider Goa, Pondicherry, Delhi, State capitals, districts within urban agglomeration of the million plus and districts, which have major cities of the States/UTs.
6.6 The BRGF is designed to redress regional imbalances. BRGF will provide financial resources for supplementing and converging existing developmental inflows into the identified districts, so as to:
(a) Bridge critical gaps in local infrastructure and other
development requirements that are not being adequately met through existing inflows,
(b) Strengthen, to this end Panchayat and Municipality level governance with more appropriate capacity building, to facilitate participatory planning, decision making, implementation and monitoring, to reflect local felt needs,
(c) Provide professional support to local bodies for planning, implementation and monitoring their plans,
(d) Improve the performance and delivery of critical functions assigned to Panchayats, and counts possible efficiency and equity losses on account of inadequate local capacity.
1 Since there has been a overlap of districts under various programmes, final tally of districts under BRGF comes to 250 districts.
Page no. 22
6.7 BRGF consist of 2 funding windows, a capacity building fund of Rs 250 crore each year and an untied grant. The untied grant is distributed among districts based on share of population and share of area. The untied grant fund also provides a fixed minimum amount of Rs 10 crore to each district per annum. The BRGF is expected to redress the issue of regional imbalances in a holistic manner as it is based on a “bottoms up” planning approach and considers the local resource endowments, perceived needs and the available opportunities. It is a little early to assess the outcome of this new initiative.
6.8 Balanced regional development views development in a holistic manner, not exclusively confined to industry. Based on a ‘bottoms up” approach, it necessarily builds on local resource base and aspirations of the people. This approach has better chance of success than any sector specific strategy.
6.9 Even in the sphere of industrial dispersal, the support mechanism has undergone a paradigm shift. The introduction of NEIP in 1997 indicated that emphasis should shift to regions/areas which are remote and inaccessible (rather the connectivity) rather than looking at a district in terms of industrial backwardness, it should be viewed over a larger geographical spread. The extension of the scheme in 2007 and introduction of special packages for Himachal Pradesh, Jammu and Kashmir and Uttarakhand in 2002-2003 also considered remoteness and inaccessibility of regions as the main rationale for special package. This was also the ground for not extending the special package to other areas. In other regions, the development of industries adopted a cluster approach where the existing industries were supported in terms of common infrastructure to improve their competitiveness. The IIUS of the DIPP or the cluster development programme of MSME attempted to provide/upgrade the networked infrastructure. Though BRGF, conceived as a mechanism to spur overall growth at sub regional levels, cannot be an alternative to the specific interventions for industrial development, BRGF essentially creates the enabling conditions.
Page no. 23
6.10 In view of this, the holistic development strategy underlined in the balance regional growth fund initiatives appears better suited for correcting regional imbalances. While the manufacturing growth (or industrial growth) is very important, growth of physical and social infrastructure necessarily provides the first order conditions for manufacturing growth. The growth in these sectors, therefore, needs to precede for the industry specific interventions to have even better results. While it is too early to evaluate results of BRGF interventions, particularly whether it has been able to bridge the gaps in physical and social infrastructure and in access and connectivity, it attempts to develop backward regions in a generic way. In inaccessible and remote areas specific interventions for industrial development are coexisting with the BRGF, evaluating outcomes of these may be even more helpful in designing intervention strategies for manufacturing growth.
Page no. 24
Page no. 25
Page no. 26
Page no. 27
Page no. 28
Page no. 29
Page no. 30
Page no. 31
Page no. 32
Annex 5 Ratio of per capita GSDP of the States/Union Territories (as per cent to the Average of All States/UTS)
Income 99-2000 2000-01 2001-02 2002-03 2003-04 2004-05 2005-06 2006-07 2007-08 2008-09 2009-10 ROC*
Bihar 37.1 39.8 36.8 38.5 34.6 33.6 31.6 33.3 33.2 35.7 35.7 -1.2
Uttar Pradesh 64.1 62.7 60.9 61.1 59.1 56.4 55.6 54.0 52.6 52.9 53.9 -2.1
Orissa 69.9 67.3 68.0 67.2 73.3 77.7 75.0 76.8 84.2 82.7 81.6 2.3
Jharkhand 77.1 68.3 69.3 69.4 68.6 81.1 72.4 67.7 73.8 72.1 70.0 -0.1
Chhattisgarh 78.2 71.0 76.2 77.0 81.1 83.5 81.4 86.4 88.9 89.6 91.0 2.2
Assam 78.6 79.4 76.8 80.6 77.7 73.9 72.1 67.1 63.4 63.4 62.5 -2.7
MP 80.3 75.2 76.6 70.7 73.7 67.9 65.3 64.6 61.8 62.2 62.4 -2.7
Manipur 86.1 77.8 78.1 75.0 74.9 80.8 78.7 71.6 67.8 66.4 64.8 -2.3
Arunachal Pradesh 88.6 93.1 102.1 93.6 95.0 118.0 111.7 102.9 100.7 104.0 120.4 2.1
Nagaland 89.1 99.4 104.7 105.4 97.0 85.2 79.2 70.9 63.9 0.0 0.0 -5.1
Rajasthan 89.3 83.9 86.2 76.9 85.4 81.9 79.7 81.5 79.5 80.0 78.2 -1.0
Uttarakhand 89.7 97.9 99.4 107.4 105.0 107.1 113.1 118.9 127.4 128.5 129.7 3.7
Tripura 89.9 97.7 107.1 104.5 104.0 103.4 100.4 95.3 88.7 86.4 83.4 -1.5
Jammu & Kashmir 94.0 94.6 94.5 99.1 95.8 98.0 93.2 87.7 83.2 80.1 76.3 -2.1
Meghalaya 94.1 98.1 102.6 102.0 100.3 104.6 101.5 102.7 99.9 98.8 98.5 0.2
Per Capita Income 100.0 100.0 100.0 100.0 100.0 100.0 100.0 100.0 100.0 100.0 100.0 0.0
Andhra Pradesh 100.4 108.2 110.3 109.0 110.1 109.9 110.3 111.1 116.2 116.2 115.4 1.1
West Bengal 101.0 102.3 104.9 104.0 103.9 96.8 94.1 91.7 90.0 90.1 92.1 -1.6
Sikkim 102.6 108.4 110.9 116.6 115.7 119.5 120.4 111.5 111.6 114.0 117.1 0.8
Mizoram 106.3 112.3 116.4 118.7 111.7 107.2 103.1 96.4 95.0 100.3 103.6 -1.5
Karnataka 115.1 117.3 114.0 113.6 109.2 116.9 121.0 120.6 123.5 121.2 116.5 0.6
Tamil Nadu 128.1 134.2 127.9 126.6 125.0 132.4 137.4 142.5 139.1 140.3 141.0 1.1
Kerala 129.0 130.1 131.3 136.4 135.1 141.1 142.9 137.9 135.8 137.1 136.7 0.6
Gujarat 131.7 125.9 129.7 137.8 144.6 147.0 155.1 153.3 152.8 149.1 150.6 1.9
Himachal Pradesh 138.5 146.5 149.5 152.4 147.5 143.9 141.8 134.6 129.3 128.7 124.4 -1.6
Haryana 148.3 158.1 164.4 168.4 169.5 163.2 162.3 165.5 168.0 173.5 176.8 1.1
Maharashtra 154.4 149.2 150.3 152.8 153.7 156.9 160.6 164.9 165.3 164.4 165.7 1.1
Andaman & Nicobar 158.2 158.8 162.4 167.3 164.7 176.7 171.4 178.2 176.8 176.1 164.6 0.9
Punjab 165.6 174.7 174.2 166.3 160.7 144.6 141.4 140.9 145.3 144.9 142.1 -2.3
Pudducherry 200.5 227.2 233.0 249.1 242.2 0.0 0.0 0.0 0.0 211.6 199.7
Delhi 247.0 250.5 247.6 249.1 242.1 253.6 252.3 249.5 246.3 247.9 249.6 0.0
Goa 282.7 283.3 273.9 286.2 287.2 343.9 338.5 325.4 322.4 319.3 313.1 1.7
Chandigarh 285.9 308.0 321.2 349.9 345.9 322.3 326.5 324.2 308.4 287.3 270.1 -0.8
*Average Annual Rate of Convergence
Page no. 33
Annex 6 Ratio of per capita GSDP from Industries of the States/Union Territories (as per cent to the Average of All States/UTS)
Industrial Income 99-2000 2000-01 2001-02 2002-03 2003-04 2004-05 2005-06 2006-07 2007-08 2008-09 2009-10 ROC*
Bihar 17.9 17.6 16.3 16.2 14.6 16.4 16.0 16.4 18.1 19.1 18.8 0.9
Nagaland 45.5 51.9 58.3 60.5 54.3 42.9 43.3 41.1 37.9 0.0 0.0 -3.9
Tripura 52.8 83.8 88.3 84.9 89.3 87.7 87.0 85.6 75.9 72.6 68.1 0.2
Assam 55.1 58.4 59.9 74.4 73.2 71.1 62.9 55.9 49.8 49.0 47.0 -2.5
Uttar Pradesh 56.0 54.4 52.0 50.5 47.7 46.2 46.6 46.5 45.6 45.7 46.9 -2.0
Mizoram 65.7 68.7 73.0 74.1 71.2 62.2 71.6 63.5 63.8 67.2 71.6 -0.3
Orissa 67.0 66.2 64.0 61.3 69.6 87.9 82.4 88.0 99.7 100.1 95.1 5.3
West Bengal 68.4 74.0 77.6 75.9 78.5 73.0 68.0 66.2 63.3 64.0 61.2 -1.9
Uttarakhand 68.5 84.5 92.2 108.7 103.8 105.9 122.6 135.8 154.4 155.7 160.8 8.4
Arunachal Pradesh 71.6 68.9 118.9 87.5 101.3 131.6 125.0 108.2 113.6 131.9 156.3 6.6
Andaman & Nicobar 71.9 71.1 86.8 95.4 126.4 170.3 187.2 218.0 231.1 226.7 195.5 14.2
Manipur 73.5 65.7 68.3 67.6 73.3 103.7 99.2 87.9 83.1 80.2 76.7 2.2
MP 74.6 75.7 75.9 67.2 66.6 64.4 61.2 62.3 60.6 59.2 58.9 -2.8
Sikkim 75.5 98.7 111.4 116.0 116.9 120.5 120.5 108.5 113.2 126.1 130.8 3.4
Jammu & Kashmir 82.1 86.5 92.7 86.7 83.6 94.0 88.7 84.9 82.3 83.1 82.7 -0.4
Meghalaya 84.0 92.0 102.3 93.9 98.3 96.1 94.7 96.8 105.4 107.2 110.3 1.9
Andhra Pradesh 91.4 96.1 100.9 99.4 97.0 93.3 94.8 101.0 105.5 104.4 103.8 1.0
Rajasthan 96.4 92.3 91.3 86.4 87.3 87.5 85.6 88.7 82.7 82.5 79.8 -1.5
Per Capita Industry 100.0 100.0 100.0 100.0 100.0 100.0 100.0 100.0 100.0 100.0 100.0 0.0
Kerala 104.4 112.3 114.8 111.8 112.6 113.1 113.5 107.6 106.9 111.7 116.6 0.2
Karnataka 105.4 105.3 114.8 114.8 114.2 123.2 123.2 129.7 130.7 123.1 120.0 1.8
Chhattisgarh 107.2 103.2 98.9 117.0 118.8 129.4 118.0 138.8 139.0 151.2 151.2 4.3
Jharkhand 140.8 110.4 105.3 120.4 119.1 147.8 119.6 98.9 120.1 118.3 114.7 -0.7
Punjab 144.3 156.8 159.7 142.2 140.3 125.4 125.7 126.5 134.4 138.2 144.1 -1.2
Tamil Nadu 147.4 160.3 142.5 143.8 143.3 146.3 150.5 152.8 145.0 139.2 138.8 -0.6
Haryana 163.2 173.2 194.5 197.3 198.3 188.8 184.6 174.5 170.5 177.0 181.8 -0.1
Delhi 172.7 188.8 179.5 179.7 166.1 163.5 154.7 147.0 145.1 150.3 152.6 -2.4
Maharashtra 174.8 161.0 160.8 157.9 162.2 163.1 176.1 177.0 177.2 176.7 179.6 1.0
Himachal Pradesh 196.6 206.4 215.9 213.3 203.4 193.1 188.4 182.9 173.6 174.2 174.6 -2.1
Gujarat 210.4 202.1 202.1 219.3 223.3 205.6 216.6 208.2 205.2 206.6 207.8 -0.1
Chandigarh 226.5 236.9 240.4 267.1 268.6 192.4 187.9 217.8 212.4 206.6 193.5 -2.2
Pudducherry 340.3 426.3 484.3 491.8 480.7 0.0 0.0 0.0 0.0 364.5 346.2
Goa 418.0 444.3 460.0 477.6 505.1 569.2 530.2 528.5 537.5 549.5 546.6 2.7
*Average Annual Rate of Convergence
Page no. 34
Annex 7 Ratio of Share of GSDP from Industries of States/Union Territories (as per cent to the Average of All States/UTS)
Share of Industry 99-2000 2000-01 2001-02 2002-03 2003-04 2004-05 2005-06 2006-07 2007-08 2008-09 2009-10 ROC* Andaman &
Nicobar 45.4 44.8 53.5 57.0 76.7 96.4 109.2 122.3 130.7 128.8 118.8 13.2
Bihar 48.3 44.3 44.2 42.0 42.2 48.9 50.7 49.3 54.6 53.6 52.6 2.1 Nagaland 51.1 52.2 55.7 57.4 56.0 50.3 54.6 58.0 59.2 1.2
Tripura 58.8 85.7 82.4 81.2 85.9 84.8 86.6 89.8 85.6 84.0 81.7 1.7 Mizoram 61.8 61.1 62.7 62.4 63.7 58.1 69.5 65.9 67.2 67.0 69.1 1.2
West Bengal 67.8 72.3 74.0 73.0 75.5 75.4 72.3 72.3 70.3 71.1 66.5 -0.3 Delhi 69.9 75.4 72.5 72.1 68.6 64.5 61.3 58.9 58.9 60.7 61.1 -2.4
Assam 70.0 73.5 77.9 92.3 94.1 96.3 87.2 83.3 78.5 77.2 75.1 0.3 Sikkim 73.6 91.0 100.4 99.5 101.1 100.8 100.0 97.3 101.5 110.6 111.8 2.6
Uttarakhand 76.3 86.3 92.7 101.2 98.8 98.9 108.4 114.1 121.2 121.2 124.0 4.6 Chandigarh 79.2 76.9 74.8 76.3 77.6 59.7 57.5 67.2 68.9 71.9 71.6 -1.4
Arunachal Pradesh
80.8 74.0 116.5 93.4 106.6 111.5 112.0 105.1 112.8 126.8 129.7 4.4
Kerala 80.9 86.4 87.4 82.0 83.3 80.2 79.4 78.0 78.7 81.4 85.3 -0.4 Manipur 85.4 84.4 87.4 90.1 97.8 128.3 126.1 122.8 122.6 120.7 118.3 4.6
Punjab 87.2 89.8 91.6 85.5 87.3 86.7 88.9 89.8 92.5 95.4 101.4 1.0 Jammu &
Kashmir 87.3 91.5 98.1 87.4 87.3 95.9 95.1 96.9 99.0 103.7 108.4 1.7
Uttar Pradesh 87.4 86.8 85.5 82.6 80.8 82.0 83.8 86.1 86.7 86.4 87.0 0.1 Meghalaya 89.3 93.7 99.8 92.1 98.0 91.9 93.2 94.3 105.5 108.4 112.0 1.7
Andhra Pradesh 91.0 88.8 91.5 91.1 88.1 84.9 86.0 90.9 90.8 89.8 89.9 -0.1 Karnataka 91.6 89.7 100.7 101.1 104.6 105.4 101.8 107.6 105.8 101.6 103.0 1.2
MP 92.8 100.6 99.1 95.1 90.4 94.9 93.8 96.4 98.0 95.1 94.4 -0.1 Orissa 95.8 98.3 94.3 91.3 95.0 113.1 109.9 114.6 118.5 121.0 116.6 2.9
All States 100.0 100.0 100.0 100.0 100.0 100.0 100.0 100.0 100.0 100.0 100.0 0.0 Rajasthan 107.9 110.0 106.0 112.3 102.2 106.9 107.5 108.9 104.1 103.2 101.9 -0.5
Haryana 110.0 109.5 118.3 117.2 117.0 115.7 113.8 105.4 101.5 102.1 102.8 -1.2 Maharashtra 113.2 108.0 107.0 103.3 105.5 103.9 109.7 107.3 107.2 107.5 108.4 -0.1
Tamil Nadu 115.1 119.4 111.5 113.6 114.6 110.6 109.5 107.3 104.3 99.2 98.5 -1.7 Chhattisgarh 137.1 145.4 129.8 151.9 146.5 155.0 144.9 160.7 156.5 168.8 166.1 2.0
Himachal Pradesh 141.9 140.8 144.5 140.0 137.9 134.2 132.9 135.8 134.3 135.4 140.3 -0.5 Goa 147.8 156.8 167.9 166.9 175.9 165.5 156.6 162.4 166.7 172.1 174.6 0.9
Gujarat 159.8 160.4 155.8 159.2 154.4 139.9 139.7 135.8 134.3 138.5 138.0 -2.0 Pudducherry 169.7 187.6 207.8 197.5 198.4 175.5 197.2 172.3 169.8 172.3 173.3 -1.0
Jharkhand 182.6 161.6 151.9 173.4 173.7 182.3 165.2 146.0 162.6 164.1 163.8 -0.6
Page no. 35
Annex 8 Share of GSDP from Industries of States/Union Territories
Share of Industry 99-2000 2000-01 2001-02 2002-03 2003-04 2004-05 2005-06 2006-07 2007-08 2008-09 2009-10 Andaman &
Nicobar 11.9 11.5 13.3 14.9 20.2 27.6 31.6 36.2 38.9 37.4 33.9
Bihar 12.6 11.4 11.0 11.0 11.1 14.0 14.7 14.6 16.3 15.6 15.0 Nagaland 13.3 13.4 13.8 15.0 14.7 14.4 15.8 17.2 17.6
Tripura 15.3 22.0 20.5 21.2 22.6 24.2 25.1 26.6 25.5 24.4 23.3 Mizoram 16.1 15.7 15.6 16.3 16.8 16.6 20.1 19.5 20.0 19.5 19.7
West Bengal 17.7 18.5 18.4 19.1 19.9 21.6 20.9 21.4 20.9 20.6 19.0 Delhi 18.3 19.3 18.0 18.9 18.1 18.4 17.8 17.4 17.6 17.6 17.4
Assam 18.3 18.8 19.4 24.1 24.8 27.5 25.2 24.7 23.4 22.4 21.4 Sikkim 19.2 23.3 24.9 26.0 26.6 28.8 29.0 28.8 30.2 32.1 31.9
Uttarakhand 19.9 22.1 23.0 26.4 26.0 28.3 31.4 33.8 36.1 35.2 35.4 Chandigarh 20.7 19.7 18.6 20.0 20.5 17.1 16.7 19.9 20.5 20.9 20.4
Arunachal Pradesh
21.1 19.0 28.9 24.4 28.1 31.9 32.4 31.1 33.6 36.8 37.0
Kerala 21.1 22.1 21.7 21.4 22.0 22.9 23.0 23.1 23.4 23.7 24.3 Manipur 22.3 21.6 21.7 23.6 25.8 36.7 36.5 36.3 36.5 35.1 33.8
Punjab 22.8 23.0 22.8 22.4 23.0 24.8 25.7 26.6 27.6 27.7 28.9 Jammu &
Kashmir 22.8 23.4 24.4 22.9 23.0 27.4 27.6 28.7 29.5 30.1 30.9
Uttar Pradesh 22.8 22.2 21.2 21.6 21.3 23.5 24.3 25.5 25.8 25.1 24.8 Meghalaya 23.3 24.0 24.8 24.1 25.8 26.3 27.0 27.9 31.4 31.5 32.0
Andhra Pradesh 23.8 22.8 22.7 23.8 23.2 24.3 24.9 26.9 27.1 26.1 25.7 Karnataka 23.9 23.0 25.0 26.4 27.6 30.1 29.5 31.9 31.5 29.5 29.4
MP 24.2 25.8 24.6 24.8 23.8 27.1 27.2 28.5 29.2 27.6 26.9 Orissa 25.0 25.2 23.4 23.9 25.0 32.3 31.8 33.9 35.3 35.1 33.3
All States 26.1 25.6 24.8 26.1 26.4 28.6 29.0 29.6 29.8 29.0 28.5 Rajasthan 28.2 28.2 26.3 29.4 26.9 30.6 31.1 32.2 31.0 30.0 29.1
Haryana 28.7 28.1 29.4 30.6 30.8 33.1 32.9 31.2 30.2 29.6 29.3 Maharashtra 29.6 27.7 26.6 27.0 27.8 29.7 31.8 31.8 31.9 31.2 30.9
Tamil Nadu 30.0 30.6 27.7 29.7 30.2 31.6 31.7 31.8 31.1 28.8 28.1 Chhattisgarh 35.8 37.2 32.2 39.7 38.6 44.3 42.0 47.6 46.6 49.0 47.4
Himachal Pradesh 37.1 36.1 35.9 36.6 36.3 38.4 38.5 40.2 40.0 39.3 40.0 Goa 38.6 40.2 41.7 43.6 46.4 47.3 45.4 48.1 49.7 50.0 49.8
Gujarat 41.7 41.1 38.7 41.6 40.7 40.0 40.5 40.2 40.0 40.2 39.4 Pudducherry 44.3 48.1 51.6 51.6 52.3 50.2 57.1 51.0 50.6 50.0 49.4
Jharkhand 47.7 41.4 37.7 45.3 45.8 52.1 47.9 43.2 48.5 47.7 46.7
Page no. 36
Page no. 37
Page no. 38
Page no. 39