Incentives and Invention in Universities 1
44
Incentives and Invention in Universities 1 Saul Lach The Hebrew University and NBER and Mark Schankerman London School of Economics and CEPR May 8, 2003 1 We are grateful to Adam Jaffe, Boyan Jovanovic, Jenny Lanjouw, Julia Shvets, Manuel Trajtenberg, Len Waverman, and Arvids Ziedonis for constructive comments on an earlier draft of this paper, and to Don Siegel for generous help with the AUTM data and other issues throughout the project. Alejandro Goren, Haim Mizrahi, and Anna Yosifun provided excellent research assistance. We would also like to thank Arnon Bentur, Director of the Samuel Neaman Institute for Advanced Studies in Science and Technology Policy at the Technion (Israel) for encouragement and financial support in this research project.
Transcript of Incentives and Invention in Universities 1

Incentives and Invention in Universities1
Saul LachThe Hebrew University and NBER
andMark Schankerman
London School of Economics and CEPR
May 8, 2003
1We are grateful to Adam Jaffe, Boyan Jovanovic, Jenny Lanjouw, Julia Shvets, Manuel Trajtenberg,Len Waverman, and Arvids Ziedonis for constructive comments on an earlier draft of this paper, and toDon Siegel for generous help with the AUTM data and other issues throughout the project. AlejandroGoren, Haim Mizrahi, and Anna Yosifun provided excellent research assistance. We would also like tothank Arnon Bentur, Director of the Samuel Neaman Institute for Advanced Studies in Science andTechnology Policy at the Technion (Israel) for encouragement and financial support in this researchproject.

Abstract
We show that economic incentives affect the number and commercial value of inventions gen-erated in universities. Using panel data for 102 U.S. universities during the period 1991-1999,we find that universities which give higher royalty shares to academic scientists generate moreinventions and higher license income, controlling for other factors including university size,quality, research funding and technology licensing inputs. The incentive effects are much largerin private universities than in public ones. For private institutions there is a Laffer curve ef-fect: raising the inventor’s royalty share increases the license income retained by the university.The incentive effect appears to work both through the level of effort and sorting of academicscientists.

1 Introduction
Universities are an important source of technical change. By the end of the 1990’s, they
accounted for about 50 percent of all basic research and almost five percent of all domestic
patent grants in the U.S. (National Science Board, 2000). This academic research has had
real effects on the economy by increasing the productivity of private sector R&D and the
growth in total factor productivity (Jaffe, 1989; Adams, 1990). These benefits work through
knowledge spillovers from academia to the rest of the economy, and through the licensing of
university-owned inventions to private firms.1 This licensing activity facilitates the transfer of
new scientific knowledge and the commercial development of these inventions by the private
sector. Technology licensing activity has grown dramatically in the past two decades.2 The
number of U.S. patents awards to university inventors rose from 500 in 1982 to more than
3,100 in 1998. The number of licenses executed on university inventions grew more than three-
fold during the last decade, from 1,278 to 4,362, and gross licensing revenues increased nearly
seven-fold, from $186 million to nearly $1.3 billion.
Given the importance of university research for long term growth and productivity, it
is critical to understand what drives academic research and technology licensing activity? Is
it a purely intellectual pursuit, as many commentators claim, or do economic incentives play
a role in the way academic scientists structure their research activities? As Lazear points out
in his important study of pay and productivity (2000, p.1346), “a cornerstone of the theory
of personnel economics is that workers respond to incentives.” Are academic faculty exempt
from this basic economic premise? In this paper we take a first step in examining these issues
by presenting econometric evidence on the role of economic incentives in shaping university
1There is substantial evidence of R&D spillovers (e.g., Jaffe, 1989; Zucker, Darby and Brewer, 1998; Adams,1990, 2002). University research spillovers tend to be geographically localized as might be expected if directknowledge transfers are important (Jaffe, Trajtenberg and Henderson, 1993; Audretsch and Stephan, 1996;Mowery and Ziedonis, 2001). There is also a growing empirical and theoretical literature on university patentingand technology transfer (e.g., Henderson, Jaffe and Trajtenberg, 1998; Jensen and Thursby, 2001; Thursby andKemp, 2002; Siegel, Waldman and Link, 2003) and university research productivity (Adams and Griliches, 1996,1998).
2Part of this rapid growth in university innovation and licensing activity is due to the passage of the Bayh-Dole Act of 1980 (Patent and Trademarks Amendments Act, PL 965-17) which gave universities the right topatent and a mandate to license discoveries made with federally sponsored research to the private sector. By theyear 2000, nearly all American research universities had established, or expanded, technology licensing officesand introduced explicit intellectual property policies and royalty sharing arrangements for academic scientists.
1

research and licensing outcomes.
Specifically, we examine how the cash flow rights from university inventions (the share
of license royalties received by academic inventors) affect the number and licensing value of
inventions in universities. In the United States university intellectual property policies typically
grant the university exclusive control rights over inventions. However, in all U.S. research
universities the cash flow rights from licensing inventions are shared between the inventor and
various parts of the university according to specified royalty sharing schedules. We show that
there is substantial variation in the these royalty sharing arrangements across U.S. research
universities, and use this cross-sectional variation to estimate the effect of royalty sharing
arrangements on inventive output. In this paper we focus on two outcomes: license income and
the number of inventions disclosed by faculty scientists to the university technology licensing
offices (TLO’s). The empirical analysis is based on data from the Association of University
Technology Managers, combined with information on the distribution of royalty shares, which
we collected from the university websites.
We develop a simple model in which scientists allocate effort to produce more research
projects, to improve the quality of each project, and to other responsibilities (e.g., teaching).
Scientists attach private value to royalty income, publications and teaching, and face shadow
prices of different types of effort set by the university. The model predicts that a rise in the
inventor’s share of royalties increases both the number of inventions and total license revenues.
This paper makes two main empirical contributions. First, we show that academic re-
search and inventive activity respond to monetary incentives. This finding is important because
it means that the design of intellectual property rights, an other forms of incentives, in academic
institutions can have real effects on economic growth and productivity. Second, we show that
the response to incentives is much larger in private universities than in public ones. Controlling
for a variety of other determinants, including university size, quality and R&D funding, univer-
sities with higher royalty shares generate higher levels of license income. In private universities,
the incentive effect is strong enough to produce a ‘Laffer effect’, where raising the inventor’s
royalty share would increase the license revenue actually retained by the university.
A number of recent studies have found that private universities are more ‘efficient’,
as measured in terms of scientific publications and various outcomes of technology transfer
2

activity.3 Beyond these differences in the level of efficiency, in this paper we show that scientists
at private universities are more responsive to royalty incentives. In this context, we also show
that technology licensing offices are more productive in private universities suggesting that
private institutions have more effective, commercially-oriented technology transfer activity.
These findings imply that private ownership is important in the university sector. Why this
is so remains an open question. Case study and survey evidence indicate that organisational
structure and objectives in TLO’s vary across universities (Feldman, Feller and Burton, 2001;
Thursby and Thursby, 2001). Understanding how those differences — and others such as internal
incentives and institutional culture — are linked to university ownership type and how they affect
performance is an important topic for future research, but beyond the scope of this paper.
The theoretical model serves to organise the empirical work, but it is very stylised. For
example, we do not model the academic labor market and thus the equilibrium allocation of
scientists across universities. As a consequence, the key empirical finding in this paper — that
royalty incentives matter — may be due both to the effect of such incentives on research effort of
individual scientists, which we model explicitly, and to sorting behaviour whereby universities
offer higher royalty share to attract more productive scientists. Going beyond the model, in
the empirical work we provide some evidence that both mechanisms may be at work, i.e., that
the incentive effects work partly by inducing sorting of scientists across universities as well as
by increasing scientists’ effort levels.
The paper is organised as follows. Section 2 provides a detailed description of the data
set. Section 3 presents the analytical framework that underlies the empirical work. In Section
4 we present the econometric results, including extensive robustness checks and a test of the
extent to which the incentive effect of royalty shares reflects effort or sorting. Concluding
remarks summarise the main findings and directions for future research.
3Private universities produce more research output per dollar of R&D and have a larger elasticity of publi-cations and citations to R&D funding than public institutions (Adams and Griliches, 1998). TLO’s at privateuniversities generate more license income than public universities, holding other factors constant (Thursby andKemp, 2002; Siegel, Waldman and Link, 2003)
3

2 Description of the Data
The data set was constructed from three sources. The main source was the Annual Licensing
Surveys for the years 1991-1999, published by the Association of University Technology Man-
agers (AUTM). These surveys provide information on invention disclosures, licensing income,
characteristics of the technology licensing office (TLO), and R&D funding from external sources
for universities (mostly in the U.S.), medical research institutes, and patent management firms.
Invention disclosure data for all or part of the 1991-99 period are available for 209 institutions.
In the empirical analysis we need to control for differences across universities in faculty
size and scholarly quality. Data on the size and quality of university doctoral programs were
obtained from the 1993 National Survey of Graduate Faculty, conducted by the National Re-
search Council (NRC). For each university we used data on doctoral programs in twenty-three
different areas of science.4
We measure university size as the total number of faculty members in the doctoral pro-
grams in these twenty-three fields. We use three measures of university quality: a scholarly
quality rating score between zero (“not sufficient for doctoral education”) and five (“distin-
guished”), the number of publications per faculty, and the number of citations per faculty. The
NRC reports these variables at the program level. We aggregate them to the university level
using faculty size weights. Faculty size and quality measures for 1993 were available for 146
universities.5
Our third source of data was information on the distribution of licensing income between
faculty scientists and the university, i.e., on the arrangements for the sharing of the royalties
generated by the licensed inventions. This information was downloaded from the websites of
individual technology licensing offices during the summer of 2001. We found license income
distribution data for 122 universities (most teaching hospitals and patent management firms
4Most university inventions are generated in these fields (Jensen and Thursby, 2001). For details on theclassification, see Appendices K, L and N in Goldberger et al. (1995).
5 In some instances, a university appears more than once in the NRC file because there is information on twoor more campuses. In these cases we computed an average quality measure weighting each campus by its sharein the total faculty number of all campuses combined.In merging the quality data with the AUTM data we encountered problems related to the identity of the
university. For example, the quality data may refer to a specific campus but the AUTM data correspond to thewhole university system. In general, we matched the campus-specific data to the university-level data.
4

do not post this information on the internet). For most universities the royalty sharing rates
were unchanged during the sample period.6
After merging data sources, we are left with 102 institutions (74 public, 28 private)
with data on invention disclosures and licensing income for at least some years during the
period 1991-1999, and data on royalty shares and size and quality variables.7 Table 1 provides
descriptive statistics. On average, universities generate 67 invention disclosures per year, with
mean value (annual license income per disclosure) of $43,000. The high mean/median ratios
show that the distributions of the number and value of disclosures are very right-skewed: only
a few universities produce large numbers of inventions, and only a few inventions are very
valuable. Much of the variance in disclosures is related to faculty size, but license revenue
remains highly skewed even when normalised by the number of disclosures. Technology licensing
offices at most universities are quite small, with a mean of about three full-time professionals.
The average age of TLO’s in 1999 was 16, reflecting the stimulus to commercialise university
inventions given by the 1980 Bayh-Dole Act.
2.1 Royalty Sharing Rates
The novel aspect of our data is the information on the distribution of license income between
the university and the inventor(s). In Table 1, the average share retained by the inventor is 45
percent, but this figure deserves a more thorough explanation. A percentage of the net income
received by the university from licensing an invention is retained by the inventor and the rest
is allocated to the inventor’s lab, department and college and to the university. The criterion
we use for identifying the inventor share is that the inventor must gain either cash flow rights
or direct control rights over the income. Thus, when the university IP policy states that the
share accruing to the lab was under the control of the inventor, we added it to the inventor’s
6We conducted an e-mail survey of the TLO’s in the sample and found that, of the 53 TLO’s that responded,less than a third — 16 universities — changed their royalty distribution during the sample period 1991-1999. Foreleven of these cases, we received information on the royalty shares prior to the change and this allowed us tocorrect their royalty shares.
7All but two institutions are American universities (the exceptions are the University of Victoria in Canadaand the Albert Einstein Healthwork Network), and we henceforth refer to the observations as universities.In the sample, 54 percent of the universities have licensing income and disclosure data in all 9 years, 26 percent
have between 6 and 8 years of data, and the remaining 20 percent have less than 5 years of income and disclosuredata.
5

share, but otherwise we did not. We call this the inventor’s ‘royalty share’.8
Interestingly, in about half the universities these royalty shares vary with the level of
license income generated by an invention (we call these non-linear royalty schedules). Because
the income intervals differ across universities, we divided the license income into seven intervals
based on the most frequently observed structure (in US$): 0-10,000, 10,000-50,000, 50,000-
100,000, 100,000-300,000, 300,000-0.5 million, 0.5-1.0 million, and over 1 million.9
Table 2 presents the main features of the royalty data in 1996. The mean inventor’s share
is 41 percent among the 58 universities using linear royalty schedules, but there is substantial
cross-sectional variation. About 25 percent of these universities have royalty shares lower than
a third, while the top 25 percent have royalty shares larger than 50 percent. Among the
universities least favorable to inventors—granting them only 25 percent of licensing income —
are Northwestern, Chicago and Caltech; the University of Akron has the highest inventor share
at 65 percent.
The royalty shares in the 44 universities with non-linear schedules display even larger
cross-sectional variability within each license income interval. For these universities we compute
an ‘expected’ royalty share by weighting the share in each income interval by the probability of
observing license income in that interval. These probabilities were estimated non-parametrically
from the distribution of license incomes over all years in the AUTM sample. Let vit denote
license income per disclosure in university i in year t. There are 723 different values for v in
the pooled sample. We first estimated the density f(vit) by kernel methods at these values.
We then computed an average royalty share for each value of v using the royalty schedule for
each university, taking into account the varying marginal royalty rates. Letting_α(v) denote
8Shares are computed out of net income after deducting direct licensing expenses from gross income. We alsomade an adjustment for the TLO’s overhead rate, when it was reported.
9 In the many cases where our selected interval did not correspond to the interval chosen by the university, werecomputed royalty shares with the correct weights. For example, if a university reports a 50 percent share forincome less than 5,000 and 40 percent share for income above 5,000, this would appear as an 45 percent sharein the first interval (0-10,000) and an 40 percent share in all the remaining intervals.
6

the average share, the expected royalty share is Σv_α(v) bf(v).10 When the royalty schedule is
linear, the expected royalty rate is simply the reported (constant) share.
The estimated kernel density function (Figure 1) shows the extreme dispersion and skew-
ness of the distribution of license income per invention disclosure.11 Nearly all of the weight
is on the first two income intervals—50.2 percent in the 0-$10,000 interval and 46.1 in the
$10,000-$50,000 bracket. This feature shows that taking a simple average of all sharing rates
in a nonlinear schedule would be inappropriate. In fact, for practical purposes a good ap-
proximation is simply to average the first two sharing rates. Using the kernel estimates, the
‘expected royalty share’ averages to 51 percent across universities, which is higher than the
average royalty share in the universities having linear schedules.
Another striking feature is that inventor royalty shares are either constant or decline
in the level of license income per invention— royalty retention is regressive (equivalently, the
university ‘tax’ on inventors is progressive). On average, they start at 54 percent in the lowest
interval and decline to 30 percent for inventions generating over $1 million. This feature holds
in every quartile of the cross-sectional distribution and, in fact, it holds for every university in
our sample.
It is interesting to note that royalty shares are not related to observed university charac-
teristics such as faculty size, university quality and the number of TLO professionals per faculty
(Table 3). This is confirmed by the low F -statistics for testing the hypothesis that the mean
royalty rate is the same across the four quartiles of the distribution of these variables.12 In
10For example, with three marginal rates we have
α(v) =α1v
vI(0 ≤ v ≤ v1) +
α1v1 + α2(v − v1)
vI(v1 < v ≤ v2) +
α1v1 + α2v2 + α3(v − v2)I(v > v2)
v
where I(·) is an indicator function.Two other points should be noted. First, we also used yearly license income divided by the cumulative number
of active licenses as a measure of v and obtained essentially the same estimates of Σv
_α(v) bf(v). The two estimates
differ by at most 1.7 percentage points, and the average difference is 0.7 percentage points. Second, in principle,one might want to estimate separate density functions for sub-categories of the pooled data—e.g., for differenttechnology fields—but we do not have enough data to do this successfully.
11Such skewness is typical of distributions of the returns to innovation (Schankerman, 1998; Harhoff, Narin,Scherer and Vopel, 1999).
12These tests require that the four underlying populations are normal and have the same variances. Bartlett’stest for the hypothesis of equal variances has p-values 0.93, 0.08 and 0.09 for the faculty size, quality, and TLOprofessionals per faculty variables.This conclusion also holds when we test universities with linear and non-linearschedules separately.
7

addition, a regression of royalty shares against the technology mix of the university (measured
by the shares of faculty in six technology fields) was insignificant (p-value =0.30) suggesting
that royalty shares are also not related to the occupational mix of faculty.
To summarise, the two salient features of observed royalty shares are variability across
universities and regressiveness in the level of license income. In this paper we take the royalty
shares as given, and exploit the cross-sectional variation in them to identify the effect of these
incentives on inventive activity. Unraveling the factors that determine the variability (and
regressiveness) of inventor royalty rates across universities is a challenging task. But it is beyond
the scope of this paper, as it would require a more complete model of university behavior and
policy instruments.13
3 Analytical Framework
Production
Academic scientists use a fixed amount of effort (work time) T to perform several tasks
such as starting new research projects, improving their quality, and teaching/administrative
activities.
Specifically, the number of inventions generated by a researcher depends on the scientist’s
effort z devoted to starting new projects given by n = n(z). This invention function satisfies
the usual production function properties: n0 ≥ 0, n00 ≤ 0, and n(0) > 0. Each invention has thesame initial quality v0. By investing research effort q into a (single) project, the researcher can
A regression of expected royalty shares on the three variables in Table 3 was also jointly insignificant. Usingthe underlying data (not their assigned quartiles), the F-test had a p-value of 0.36. The p-values for the linearand non-linear schedules were 0.45 and 0.29, respectively.
13Regressive royalty schedules give inventors an incentive to discover many small-valued inventions rather thana single valuable one, which seems odd if universities prefer quality to quantity of inventions. However, it maybe possible to rationalise such schedules by appealing to optimal taxation theory. That literature can generateprogressive tax schedules when there is uncertainty to effort. The intuition is that, when high income ex postis largely due to a favorable resolution of uncertainty, the incentive cost of higher marginal taxation is lower(Tuomala, 1990). This argument may also apply to research effort, if the quality of the project is unknown exante to the scientist. However, if the inventor can distinguish between low and high quality projects in makingeffort decisions, then optimal incentives should involve a progressive inventor royalty to compensate for thehigher marginal cost of producing high-valued inventions. Of course, ‘fairness’ considerations may also play arole in how universities share royalties.
8

transform it into an invention potentially worth
v(q) = v0ψ(q)ε
where ψ(q) > 1 is increasing and concave and ε is a multiplicative shock, independent of q,
with mean value normalized to one and distribution function G. The shock ε is observed after
the two types of effort are invested. As there are no ex-ante differences among the n inventions,
the inventor invests the same level of effort q in each of them.14
We assume that the effort constraint is binding, T − z − n(z)q = 0. The remaining
effort, T −z−n(z)q, is spent in teaching and administrative activities. The research activities—investing in n and in v−generate inventions with commercial potential as well as academicpublications.
Licensing
We assume that all inventions are disclosed to the TLO and that the TLO then chooses
whether or not to license the invention depending on the observed value of the idea. The
TLO licenses an invention if expected license income covers the fixed cost of licensing, which
includes finding suitable licensees, negotiating terms, and enforcing contracts (for survey ev-
idence, Thursby and Thursby, 2001). We model the selection rule as follows: license the
invention if v > v. This implies that, given effort q, an invention is licensed if ε > vv0ψ(q)
, so a
proportion 1−G³
vv0ψ(q)
´of all inventions is licensed.
The TL0 is in charge of compiling a list of all inventions made by faculty and licensing
them to private firms. If the TLO licenses the invention, it earns revenue βv, where 0 < β ≤ 1reflects the effectiveness of the TLO in licensing activities. The amount v is the maximal
potential income derived from licensing the invention. This value should capture the most
favorable license fee and royalties schedule among all the potential licensees. The actual license
income depends on how good the TL0 is at identifying the best match and negotiating the best
14An equivalent formulation would be to allow the initial value of the idea to be random and unknown tothe researcher when the decision on effort q is made. We need to have some form of uncertainty in the modelbecause otherwise the scientist would either set q to zero or set q to ensure that any developed idea would passthe TLO selection rule (see below in the text). But this is not consistent with the data: the ratio of licensesexecuted to invention disclosures in a given year is about 30 percent, on average.
9

agreement.15 If the invention is not licensed, it earns zero revenue.
Expected revenues from licensing an invention are
r(z, q) = βn(z)v0ψ(q)
Z ∞
vv0ψ(q)
εdG(ε) (1)
Costs
The inventor faces two types of costs. The first one is the total effort cost of doing
research
c(z, q) = ewzz + ewqn(z)q (2)
where ewz (resp. ewq) represents the opportunity cost of a unit of effort invested in starting more
projects to the inventor (resp. investment in quality per project). The parameters ewz and ewq
reflect the university’s valuation of teaching time as well as its relative marginal valuation of
research quantity and quality. The university can control these shadow prices to the faculty by
setting promotion criteria and other rewards. This specification should be viewed as a reduced
form of a more complete model of the academic labour market.
The second cost to the inventor is the direct ‘tax’ imposed by the university at rate
1− α : the university retains a portion (1− α) of the licensing revenue from each invention.16
Objectives and Optimisation
The academic scientist derives utility from research and from teaching/administrative
activities. The utility from research is composed of the monetary benefit accruing to the
scientist’s inventions, αr(z, q), the utility from her publications, denoted by Up(z, q), and the
utility from teaching, denoted by UT (T − z − n(z)q). The scientist’s utility is
U(z, q) = µrαr(z, q) + µpUp(z, q) + µtU
T (T − z − n(z)q)
where µj ∈ [0, 1] for j = r, p, t and µr + µp + µt = 1. The µ0s are the weights attached by
the scientist to the private monetary gains from licensing her inventions, the private value of
publications, and the private value of teaching and administrative activities.
15For a discussion of optimal contract design for university technology transfer, see Jensen and Thursby (2001).
16As shown in the previous section, the university’s share can vary with license revenue but for simplicity weassume it is constant in the model.
10

To simplify, we assume that the scientist’s utility from publications is proportional to
the potential commercial value of inventions: UP = φr(z, q). The parameter φ summarises the
‘alignment’ between the two objectives, publications and inventions: they can be positively
aligned (φ > 0), in conflict with each other (φ < 0) or unrelated (φ = 0).17 Finally, we assume
that the utility from teaching is linear, UT = ρ(T − z − n(z)q), ρ > 0.
Under these assumptions, the academic scientist’s utility, net of effort costs, is:
U(z, q)− c(z, q) = µrαr(z, q) + µpφr(z, q) + µtρ(T − z − n(z)q)− ewzz − ewqn(z)q
(3)
= U0 + λβn(z)v0ψ(q)
Z ∞
vv0ψ(q)
εdG(ε)− wzz −wqn(z)q
where
U0 = µtρT
λ = µrα+ µpφ
wz = ewz + µtρ
wq = ewq + µtρ
The scientist’s decision problem is to maximize (3).18 The first order conditions at an
interior optimum are
n0(z)
"λβv0ψ(q)
Z ∞
vv0ψ(q)
εdG(ε)− wqq
#= wz
λβv0ψ0(q)
(Z ∞
vv0ψ(q)
εdG(ε) +
µv
v0ψ(q)
¶2g
µv
v0ψ(q)
¶)= wq
where g is the density function of ε.
17Two points are worth noting. First, we could specify the utility value of publications as some increasing,concave function of z and q, with suitable restrictions to ensure an interior solution. In the absence of inventor-level data, this generality does not buy us anything.Second, the scientist’s utility depends on her effort levels of z and q — either through money income, publications
or (residual) time teaching. The shadow prices imposed by the university, ewz and ewq, presumably reflect themarginal products of these inputs in terms of the university’s objectives. These may differ from the utitilty valueattached by the scientist if their objectives are not well aligned. Conflict of interest and other provisions, whichare commonly found in university intellectual property policies, suggest that there are problems of alignment.
18While we do not restrict the sign of φ, we assume λ > 0 since otherwise optimal research effort is zero.
11

As the second equation indicates, doing more quality effort has two effects: it raises the
value of the idea and it makes it more likely that the TLO will choose to license the invention.
Assuming second order conditions hold, we obtain the following proposition:
Proposition 1 Suppose a scientist chooses research effort on project quantity (z) and quality
(q) to maximise the net payoff given by (3). An increase in the TLO effectiveness β or in the
utility weight on private gains λ raises optimal research effort levels z and q. Thus, both the
number of invention disclosures n(z) and observed total license revenue r(z, q) increase with β
and λ.
The important point to note here is that the inventor’s royalty share α affects research
effort decisions to the extent that µr > 0. Provided the scientist cares about the monetary
returns to his or her inventions (i.e., µr > 0), a higher royalty share results in more research
effort. Thus, monetary incentives can have real effects. Clearly, the magnitude of these effects
depend on the magnitude of µr.
Note also that the positive effect of increases in β and λ is stronger on total license
revenues r(z, q) than on the number of disclosures n(z) because v(q) also increases. In partic-
ular, the incentive effect of royalty shares on total license revenues should be larger than on
disclosures.19
3.1 Linking to an Empirical Model
In the data, we observe the number of invention disclosures, total license income, the inventor
royalty share, and a vector x of variables determining β such that β = β(x) with ∂β∂xj≥ 0. We
also control for other variables affecting the production functions n(z) and v(q), and collect
them into a vector ω. Since the focus of our empirical work is to estimate the response of
license income to the royalty share α and to the TLO characteristics, we partition the list of
regressors accordingly. Thus, expressing the research efforts levels as functions of the three sets
of variables (α, x, ω) we get the reduced-from equation for the number of disclosures and for
19The same comparative statics hold if there are positive spillovers between research projects—i.e., if we letv(q, z) = v0ψ(q, n(z))ε where ∂ψ
∂n> 0.
It is straightforward to show that quantity effort z increases in v0 and decreases in v. The impact of v0 andv on quality q depends on the functional form of the distribution function G. In any case, we cannot test thesepredictions because we do not observe v0 or v.
12
total license income. First,
n = n(α, x, ω)
and, assuming that all faculty are identical ex-ante, the total number of invention disclosures
at the university is
N = Sn (α, x, ω) (4)
where S is faculty size. Invention disclosures should depend on faculty size with an elasticity
of about one, and positively on α and x (through β).
Expected revenue per disclosure is
r = β(x)v0ψ(α, x, ω)
·1−G
µv
v0ψ(α, x, ω)
¶¸so that expected total revenues are
R = rN = β(x)v0ψ(α, x, ω)Sn (α, x, ω)
·1−G
µv
v0ψ(α, x, ω)
¶¸(5)
Note that the marginal effects of α and x on license income are positive, and that revenues
should be proportional to faculty size.
Taking a log-linear approximation of (5) and (4) we obtain
logR = δRα+ x0γR + ω0θR + uR
(6)
logN = δNα+ x0γN + ω0θN + uN
where α is the expected inventor royalty share, x includes the size and age of the TLO, and
ω includes measures of academic quality, the amount of R&D funds at the university and the
mix of technological areas in which the faculty is working.
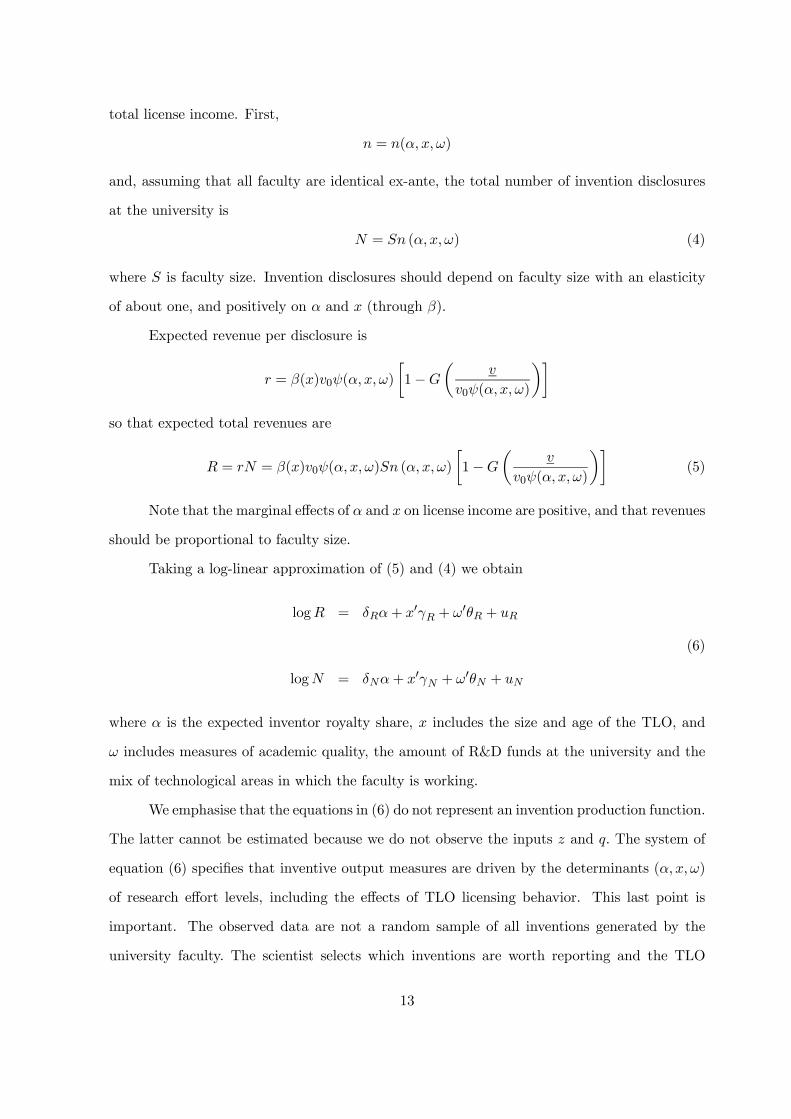
We emphasise that the equations in (6) do not represent an invention production function.
The latter cannot be estimated because we do not observe the inputs z and q. The system of
equation (6) specifies that inventive output measures are driven by the determinants (α, x, ω)
of research effort levels, including the effects of TLO licensing behavior. This last point is
important. The observed data are not a random sample of all inventions generated by the
university faculty. The scientist selects which inventions are worth reporting and the TLO
13

selects which inventions are worth marketing. We have taken only the TLO selection into
account in the modelling framework. As equation (5) makes clear, the estimated incentives
effects include these selection effects.
We estimate both equations by OLS using a consistent estimator of the covariance ma-
trix that allows for arbitrary heteroskedasticity and serial correlation—a Newey-West estimator
applied to panel data. There is no efficiency gain in estimating both equations jointly because
the regressors are identical. Panel data estimation methods—fixed effects or first differences—do
not identify the incentive effect of royalties because the relevant variation is primarily cross-
sectional.
We turn next to a detailed explanation of the variables used in the empirical work.
Dependent Variables:
log R The main dependent variable is the log of annual license income, R. License income
includes all royalties and any liquidated value of equity held by the university in lieu of
royalty income from licensees. Data on R are taken from the AUTM surveys.
log N The second dependent variable is the log of the number of invention disclosures,
N. Since there is no uniform standard for what constitutes an invention disclosure, this
variable is likely to contain more measurement error. This could be a problem if that
error is correlated with the regressors, e.g., the size or age of the TLO, the technology
field, etc. Data on N are taken from the AUTM surveys.
Independent Variables:
Inventor Royalty Share α This is the expected royalty share described in Section 2.1.
For nonlinear schedules, we work under the maintained hypothesis that the kernel density
weights used to construct the expected royalty share capture the expectation of being in
different license income intervals.20 In some specifications we also allow the response to
20There is one estimation issue that arises from the computation of the expected royalty share for universitieswith nonlinear royalty schedules. The kernel density estimates used to compute the expected royalty share arebased on the observed unconditional distribution of license income per disclosure. The model, however, says thatthe distribution of license income per disclosure depends on the control variables α, x and ω. In order to accountfor this, we used an iterative procedure whereby the residuals from an initial license income per discolor (i.e., v)
14

incentives to vary with certain control variables (e.g., quality of the university). The
coefficients δR and δN capture the impact of the royalty share on R and N , and the
model implies δR ≥ δN ≥ 0.
Control Variables in ω :
University quality This is measured by various indexes from the 1993 National Survey of
Graduate Faculty described in Section 2 (scholarly quality, the number of publications
per faculty, and the number of citations per faculty). Quality should be positively related
to both R and N since faculty scientists are presumed to have higher average productivity
in higher quality institutions. This effect is reinforced if higher ability scientists also have
higher marginal productivity and thus choose greater effort levels.
Faculty size The total number of faculty in the departments reported in the 1993 National
Survey of Graduate Faculty. Size should be positively related to R and N, with an
elasticity of about unity. If there are positive spillovers across researchers, the elasticities
can be greater than one.
Technology fields The 1993 National Survey of Graduate Faculty data include twenty-
three academic departments. We aggregate them into six technology fields — biomed-
ical and genetics, other biological sciences, computer science, chemical science (including
chemical engineering), engineering, and physical sciences - and use the shares of faculty
employed in each field to proxy for the research orientation of the university.21
External R&D funding We have data on total, industry-financed and publicly-financed
regression are used to recompute the kernel density estimates and the expected royalty shares. We found thatafter one iteration the average difference in the computed royalty shares for the nonlinear schedules was only 1.3percentage points, or about 2.8 percent of the mean royalty share. Moreover, using the royalty shares computedafter one iteration gave estimated coefficients very close to those obtained using the expected royalty sharesbased on the unconditional distribution of v. The parameter estimates we report are based on the unconditionaldistribution.
21The groups we use are: 1.Biomedical and Genetics - biochemical/molecular biology, cell and developmentbiology, biomedical engineering and molecular and general genetics; 2. Other Biological Sciences - neurosciences,pharmacology, physiology and ecology/evolution and behavior; 3.Computer Science includes only the departmentof computer sciences; 4. Chemical Science - chemistry and chemical engineering; 5. Engineering - aerospace,civil engineering, electrical engineering, industrial engineering, material science, and mechanical engineering;and 6. Physical Sciences - astrophysics/astronomy, geosciences, mathematics, oceanography, physics, and sta-tistics/biomedical statistics.
15

R&D (government plus non-governmental agencies) from the AUTM surveys. Greater
R&D funding is expected to increase productivity of research effort and thus N. This
applies both to industry and federally-financed R&D. However, industry-financed R&D
may reduce the average license income received by the university because the firms are
likely to get more favorable licensing arrangements. Thus we expect government-funded
R&D to raise both N and R, and industry-financed (and total) R&D to raise N but not
necessarily R. For ease of interpretation, we use log R&D per faculty in all the regressions.
Year Dummies Year dummies are included in all regressions to pick up aggregate demand
and technology shocks.
Control Variables in x
Log TLO size We measure the size of the TLO by the number of full-time professionals
employed by the TLO. Because this information is not available for 1991, we used the
data for 1992 to measure size in 1991. The change in the point estimates is minimal but
their precision increases due to the larger number of observations. The larger the size of
the TLO, the better the identification and commercialisation of inventions (a higher β
in the model). Therefore TLO size should have a positive effect on R and N. For ease of
interpretation, we use log TLO size per faculty in all the regressions.
TLO age Age of the TLO is measured using the year when then TLO was established as
reported by the AUTM surveys. When the foundation year was on 1991 or later we
recoded the foundation year to be the first year when the TLO size was larger than
0.5—one half full-time professional employed. Age is a proxy variable for experience in
identifying commercially useful inventions and negotiating license agreements effectively
with private firms (again, a higher β in the model). This should increase both R and N.
4 Empirical Results
4.1 Basic Specifications
Our focus is on the effect of royalty incentives on total license revenue. We also present
regression results for invention disclosures because they allow us to back out the effect of
16

royalty incentives on licensing revenue per disclosure, which reflects how incentives affect effort
on research quality, q.
Table 4 presents our first regressions of the two equations in (6). We begin by controlling
only for faculty size. The royalty share coefficient is positive and marginally significant for
license income (p-value = 0.08). Surprisingly, the point estimate of the incentive coefficient
is negative for invention disclosures, but it is very imprecisely estimated. In specification (2),
we add the other control variables in ω to account for differences in the production functions
n(z) and v(q) — university quality, technology areas, and R&D. The important point is that
the estimated coefficient of the royalty share is robust to these controls, and becomes highly
significant.
Turning to the coefficients on the control variables, as expected, the quality of the uni-
versity has a positive effect on license revenues and invention disclosures. The R&D variable
includes funding from industry, government and non-profit sources. R&D funding is associated
both with higher license revenue and more invention disclosures, with elasticities of 0.75 and
0.53 respectively. These estimates imply that increasing R&D funding also raises the average
value per invention disclosure.22
As controls for differences across technology fields, we use the fraction of the faculty in
each of six technology fields (physical sciences is the reference group). The null hypothesis that
there are no technology field differences is strongly rejected in the generation of total license
revenues and of invention disclosures (the p-values are essentially zero in both regressions).
Most of the field differences can be attributed to engineering. It is interesting to note that the
point estimates imply that technology fields which generate more disclosures also exhibit lower
average license income per disclosure.
In specification (3), we add the control variables in x to account for differences in the
effectiveness of the TLO, β(x). In the model, any factor that increases β(x) should increase
license revenue and invention disclosures. We find that total license revenue and inventions
disclosures are positively related both to the size and age of the TLO. Increasing the size of
22Diminishing returns to R&D set in because we are increasing R&D per faculty in this experiment. Increasingboth R&D and faculty size proportionally yields strong increasing returns for total license revenue (elasticity of1.85) and mild increasing returns for invention disclosures (elasticity of 1.22).
17

the TLO by 10 percent (recall that the average TLO size is 3.1 full-time professionals) would
raise license income by 3.0 percent and disclosures by 2.5 percent. The coefficient on TLO
size, however, may be biased upward if universities respond to large numbers of disclosures
or revenues by enlarging the TLO. We also find returns to experience in TLO activity. An
additional year of experience translates into a 2.3 percent increase in license income and a 0.5
percent increase in disclosures. Again, the estimated incentive effect of royalty shares is robust
to these controls.
The regression results point to strong and significant effects of incentives on license
revenues. Increasing the inventor’s royalty share by 10 percentage points results in a 14 percent
increases in revenues. However, we find a small negative, but not significant, incentive effect
on the number of invention disclosures. Before we discuss the implications of these findings,
and how they fit the theoretical model, we present separate results for public and private
universities.
Public vs Private Universities
A number of previous studies have shown that private universities have higher levels of
‘productivity’, measured in terms of scientific publications (Adams and Griliches, 1996 and
1998) and various outcomes of technology transfer activity (Thursby and Kemp, 2002; Siegel,
Waldman and Link, 2003). We now examine how the response to monetary incentives differs
between public and private universities.
Table 5 presents separate baseline regressions—specification (3) in Table 4—for public
and private universities. The most important finding is that royalty shares have a positive, and
significant, incentive effect on license revenue both for public and private universities (significant
at the 0.10 level for public). However, the incentive effect is more than four times as large for
private institutions. Surprisingly, in the regression for the number of invention disclosures,
the point estimate on the royalty share coefficient is negative for public universities. But it is
positive for private universities, as expected. The point estimate implies that a ten percentage
point increase in royalty share would increase the number of disclosures by about 13 percent
and the license income by 57 percent in private institutions.
Another finding of interest concerns the effectiveness of the TLO. While the elasticity of
18

invention disclosures with respect to TLO size is similar for both types of institutions (0.26 and
0.27), the impact of the TLO on license income is much greater in private universities. This
finding suggests that private institutions have more effective, commercially-oriented technology
transfer activity so that their TLOs are better able to identify and capture innovation rents by
licensing to industry.
These results show, for the first time, that university ownership type is a critical deter-
minant of how responsive inventors are to royalty incentives. Note that we have controlled for
a number of relevant university characteristics, so the importance of university ownership type
is not driven by these differences. In fact, it is interesting to note that the only observable
dimension in which public and private universities in the sample are significantly different is
quality level, in favor of private universities.23 We do not have a definitive explanation for why
faculty are more responsive to monetary incentives in private universities. Part of the observed
differences may be due to ‘sorting’ of heterogeneous scientists across universities in response
to royalty incentives (see Section 4.3). However, institutional differences may also play an im-
portant role. There is case study and survey evidence indicate that organisational structure
and objectives in TLO’s vary across universities (Bercovitz, Feldman, Feller and Burton, 2001;
Thursby, Jensen and Thursby, 2001). Understanding how those differences — and others such
as internal incentives and institutional culture — are linked to university ownership type and
how they affect performance is important, but beyond the scope of this paper.
Potential Sources of Bias
There are two potential sources of bias in these regressions. The first is endogeneity bias
in royalty rates. If universities set higher inventor royalty shares in response to receiving low
numbers of disclosures or low levels of license income, we get a downward bias in the estimated
incentive effect in both the disclosures and license income regressions. This may partly account
for the relatively small negative effect of royalty shares on invention disclosures for public
23The mean inventor royalty share for public and private universities are 45.7 and 43.6 percent, respectively(the p-value of the test for equality of means is 0.48). This conclusion also applies to the faculty size, TLO sizeand age, R&D funding, and the technological mix of the faculty.The difference in quality applies when we use the NRC quality score as well as the number of citations or
publications per faculty. The mean values for public universities are 13.6 and 6.9, respectively, compared to 31.2and 8.5 for private universities. The differences are statistically significant.The same conclusions are reached if we compare different quartiles or the whole distribution, as confirmed by
univariate Kolmogorov-Smirnov tests.
19

universities. But we expect any endogeneity bias to be relatively small because most royalty
distribution schemes for universities in our sample were set before 1991.24
The second source of bias is a possible inventor reporting bias. A researcher has a
choice between reporting the disclosure and sharing the license revenues with the university (as
required by the employment contract), or not reporting it and commercialising it outside (e.g.,
by forming a private start-up company). If this misreporting error is uncorrelated with the
royalty share, there is no bias in the estimated incentive effect. However, if the reporting error
is negatively correlated with the royalty share, as we might expect, there will be a downward
bias in the estimated coefficient on royalty shares in the disclosures regression.
These two sources of bias might account for the estimated negative effect of α on invention
disclosures in public universities. In particular, the bias may be larger for public universities
if misreporting is a more serious problem in them. One good reason for this to be the case
is our finding that TLOs at public universities are less successful in generating and capturing
innovation rents than their counterparts at private universities.25
The bias in the license income regression due to misreporting disclosures is less clear.
If high valued inventions are more likely to go unreported to the TLO, and if the rate of
misreporting is negatively correlated with the royalty share, then our estimates would overstate
the incentive effect of royalty sharing on license income. When α rises, part of the observed
rise in license revenue would reflect inventors now reporting high-value inventions. With the
available data we cannot identify the magnitude of this reporting effect but, because university
faculty have a contractual obligation to report invention disclosures to the TLO, it is unlikely
that this bias is large enough to undo the estimated positive effect of direct monetary incentives
on license income. Of course, from the financial perspective of the university, both the incentive
effect and the reporting effect of royalty shares are relevant, since they jointly determine how
much license income the university actually earns.
24 In addition, the fact that royalty shares are not correlated with observable university characteristics (Table3) lends additional support to this view.
25 In an earlier version of this paper, we also developed an alternative, theoretical, explanation based on theidea that working on more projects lowers the marginal product of quality effort q on each project. If this‘research congestion’ effect is strong enough, it is possible for a higher α to induce higher quality effort q butlower quantity effort z. Total revenues increase with α, but the number of inventions will decline with α.
20

4.2 Robustness
In this section we discuss a variety of extensions to the baseline specification in Table 5, es-
timated separately for public and private universities. We focus on the robustness of the
estimated incentive effect of inventor royalty shares, but there is also independent interest in
some of the specifications we examine.
First, as we pointed out in Section 2, the distribution of license income per faculty is
highly skewed across universities. This raises a concern that our empirical results may be
driven by a few outliers in the sample (in terms of the dependent variables, license income
and invention disclosures). To address this, we re-estimate the model using median regression
(Table 6). This procedure minimises the sum of absolute deviations and thus gives less weight
to outliers. The estimated coefficients on the royalty share are similar to the least squares
estimates in Table 5—within a standard deviation of each other. One notable difference is that
license revenue is positively related to TLO size for public universities, as well as for private
ones.
Second, we re-estimate the model using alternative measures of quality—the number of
scientific citations per faculty as well as the number of publications per faculty and of citations
per publications (Table 7). The point estimates of the incentive effect are slightly larger than the
baseline estimates for the license revenue regressions for both public and private universities,
and for invention disclosures at private universities, but the differences are not statistically
significant. The number of citations per faculty, which captures both the quantity and quality
of publications, is positively associated with both license revenue and invention disclosures.
An additional citation per faculty would increase license revenue by 1.2 percent for public
universities and 1.5 percent for private universities. Evaluating at the median licensing income
($0.64 and $1.04 million, respectively), this implies that the annual license income value of an
extra scientific citation per faculty is about $7,700 and $15,600 in public and private universities,
respectively. Doing the regressions with separate measures of publications per faculty and
citations per publications, we find that the impact on license revenue (and generally on invention
disclosures) comes from the citations, not from publication counts.
Third, we allow for industry and publicly-funded R&D to have different effects on li-
21

censing income and on the number of invention disclosures (Table 8). Publicly-funded R&D
has a significant, positive effect on both license revenue and invention disclosures. The point
estimates of the elasticities imply that raising public R&D by 10 percent would increase license
revenue by about 4-5 percent. The elasticity on license income is larger than on invention
disclosures, implying that public R&D also raises average licensing income per disclosure. By
contrast, we find that industry-financed R&D has no significant effect on total license income,
which is what one would expect if the bulk of such funding is contract R&D with free licens-
ing provisions (i.e., ex ante R&D funds are given in place of ex post licensing income). The
estimated coefficients on the royalty shares are nearly identical to the baseline case.
Fourth, we allow for the possibility that the incentive effect varies with university quality.
It is commonly argued that faculty at more prestigious institutions are likely to be motivated
mainly by scientific recognition rather than by monetary rewards. In the model, this takes
the form of a lower parameter µr in higher quality universities. To test this, we include
interactions terms between the inventor royalty share and dummy variables for the lowest and
highest quartile of the quality distribution (within each type of university). Table 9 summarises
the results. We do not find any evidence that the incentive effect of royalty shares depends on
university quality in the licence revenue and invention disclosures regressions.
The model implies, and Table 5 confirmed, that having a larger or more experienced
TLO means higher β and thus a higher marginal return to the inventor’s effort. We would
expect this effect to be larger when the inventor retains a greater share of the returns, implying
an interaction between TLO size or age and the royalty share. However, we do not find any
significant interactions either in the regression for invention disclosures or license revenues (not
reported). The estimated incentive effect of royalty shares is robust to this experiment.
Finally, we add a variable to control for differences in the potential demand for licenses
by private firms. If demand for licensing is localised, because of information or other factors,
universities located in more dense high-tech areas should license more inventions from a given
pool of invention disclosures and obtain more revenue. To control for the demand side at the
local level, we use the 1995 Milken index of high-tech activity for the area where the university
is located (Friedman and Silberman, 2003). The index varies from zero to a maximum of
23.7 (for Stanford University). In doing so, we lose about 10 percent of the universities in
22

the sample because they are located in areas where the index is not available. As Table 10
shows, the estimated incentive effects are robust to the demand control. As expected, location
in an area with more high tech activity increases total license revenue for both public and
private universities, and with similar elasticities.26 The estimated effect is large—e.g., relocating
Carnegie Mellon University from Pittsburgh (score = 0.48) to Chicago (score = 3.75) would
raise license revenue by 29 percent. This finding emphasises the importance of structuring
technology transfer institutions so that they can exploit demand in non-local areas. For this,
specialisation of TLO’s by university (the current arrangement) may be inferior to TLO’s that
specialise by technology area and serve multiple universities.
4.3 Implications
Royalty Incentives: Is there a Laffer curve?
The parameter estimates from Table 5 imply that raising the inventor’s royalty share
would increase total license income, but that the incentive effects are much larger in private
universities. The point estimate of the semi-elasticity of license revenue with respect to royalty
share, δR, implies that raising the inventor royalty share by ten percentage points, say from
the sample mean of about 45 to 55 percent, would increase license income by 12.3 and 56.7
percent in public and private institutions, respectively.
Raising the royalty share may even increase license income accruing directly to the uni-
versity, (1− α)R. The semi-elasticity for university’s income is d log(1−α)Rdα = δR − 1
1−α . When
δR > 1 there can be a ‘Laffer effect’ for universities with sufficiently low royalty rates: i.e., rais-
ing the inventor’s royalty share would increase the university’s license income when α < 1−δ−1R .We find such a Laffer effect for all private universities in the sample (the ‘critical’ royalty share
in α = 0.82), but not for any public universities (the ‘critical’ royalty share is α = 0.19).
Of course, even without a Laffer effect, it may be desirable for a university to raise
the royalty share if it attaches weight to the license income for its faculty inventors (e.g., the
university could reduce salaries in return for higher royalty shares). To illustrate, suppose the
26Royalty shares are negatively correlated with the Milken index of high-tech activity (r = −0.26), suggestingthat royalty shares are not set in response to the value of outside options available locally to university scientists.Omitting this index from the regression should bias the coefficient of α downward, if these demand factors havea positive impact on license revenues. This is precisely what we find in Table 10.
23

university’s objective function W is a linear function of license income plus other variables
y : W = (1 − α)R(α) + γαR(α) + y, where γ < 1 is the weight the university attaches to
the faculty’s license income. Then ∂W∂α > 0 if γ > 1 − δR
1+αδR. Using δR = 1.23 and the mean
of α = .46 for public universities, we conclude that raising the royalty share would increase
university welfare if γ > 0.21. A rigorous analysis of this issue would require a model of
university objectives, policy instruments and the academic labour market.
Incentive Effects: Effort or Sorting?
Does the incentive effect of royalty shares work through its impact on the effort levels of
individual researchers or through the sorting of scientists across universities, or both? Despite
our controls for university quality, there is likely to be unobserved heterogeneity in research
productivity (or commercial orientation) of faculty. Universities will attempt to attract more
productive faculty by offering higher royalty shares, even if compensated by salary reductions
to keep the total compensation across faculty constant. If more productive researchers have
higher effort elasticities, they will be more responsive to incentives at the margin.27 Thus,
universities with higher royalty shares have more productive faculty who are more responsive
to monetary incentives, which is consistent with the results reported in Tables 4 and 5.
Without productivity data for individual inventors, it is difficult to distinguish effort
effects from sorting effects.28 Here we develop an indirect test based on the license revenue
equation. Under pure sorting, the type of faculty a university attracts should depend on how
high its royalty share is relative to the set of comparator universities that compete for the
faculty in question. Let αi denote the royalty share of university i and αic be the mean share
for the set of universities competing with university i. Pure sorting implies that innovation and
licensing output should be homogeneous of degree zero in αi and αic because if university i and
its competitors were all to increase their inventor’s royalty shares by the same amount then the
allocation of scientists across universities will not change. License revenues should not change
because α does not affect research efforts by hypothesis. Moreover, direct competition implies
27For example, a simple parametrization of the model using n = zδ, v = v0qθε and a Pareto distribution for ε
results in a license revenue equation where the effect of α on r increases with the quality effort elasticity θ.
28For a recent study of the effort incentive and sorting effects of performance pay on productivity that usesdetailed data on workers, see Lazear (2000).
24

that the effect of αic should be negative. To test this proposition we modify the license income
regression as:
logRi = δ1Rαi + δ2Rαic + x0γR + ω0θR + uR
Under pure sorting, we expect that δ1R > 0, δ2R < 0 and δ1R+ δ2R = 0. Under the pure
moral hazard—the effort—hypothesis, we should find δ1R > δ2R = 0.When there are both sorting
and moral hazard effects, raising the royalty shares for all universities in a reference group should
lead to an increase in innovation and licensing due to the increased effort incentives. Thus, the
mixed sorting-moral hazard hypothesis implies δ1R > 0, δ2R < 0 and δ1R + δ2R > 0.
We assume that a scientist chooses from among ‘comparably quality ranked’ universities.
We rank the universities according to an index of quality, and define the set of competing
universities as those ‘close’ to university i in the quality ranking. Closeness is determined by
the size of the (one-sided) window k around the ranking of university i.We experimented with
three different window sizes, k = 2, 3, 4. This means that we averaged the royalty shares of
the universities ranked up to (and including) k positions lower and higher than university i,
2k universities altogether.29 For this test, we base the ranking of universities on the average
number of citations per faculty, which is the closest measure we have of the quality of faculty
(as distinct from the university more generally).30
Table 11 summarises the results. For each of the different window sizes, we find that
the coefficient on the royalty share for the competitor’s group, δ2R, is negative in all cases
and statistically significant in private universities. Therefore, there is significant evidence of
sorting behavior across private universities. The same holds for public universities, although
the finding is somewhat less significant.31 In fact, we cannot reject the hypothesis of pure
sorting, i.e., that all of the estimated incentive effect of royalty sharing is due to the sorting
of academic scientists across universities that it induces, as indicated by the point estimates
29For the universities at the top or bottom ends of the ranking, we trimmed either the right window or leftwindow, as necessary.
30To filter out technology area effects on citations per faculty, we also tried a ranking based on the residualsof a regression of cites per faculty on the shares of faculty in each technology field. The R2 from that regressionwas low (about 0.05), and the results using the ranking based on these residuals were similar to those reportedin Table 11.
31This finding is consistent with Coupe (2001), who shows that university patenting activity is positivelyassociated with the average salary.
25

of the sum δ1R + δ2R and its associated confidence interval. But while formally correct, this
conclusion is too strong. We also would not be able to reject the hypothesis that the incentive
effect of royalty shares is due to some mixture of effort inducement and sorting behavior.
We find evidence of sorting behavior, but can this explain why we find greater responsive-
ness to royalties (higher δR) in private universities? In order for sorting to account for this, it
must be the case that private universities recruit scientists from the top end of the (unobserved)
research productivity distribution. Given that there are no differences in the distribution of
royalty shares across university types, this would requires that private universities offer higher
salaries or other perks. Faculty salary levels are typically higher in private universites, for given
grade levels (AAUP, 2002). But while sorting may be part of the explanation for the higher
δR, we need more detailed research using data on individual faculty to pin the various sources
of the differences between public and private universities.
Technology Licensing: Is Expansion Profitable?
We use the estimated elasticity of license revenue with respect to TLO size to derive the
marginal revenue product, and then compare it to observed salaries in TLO’s. As we showed,
there are large differences in TLO effectiveness between public and private universities. The
estimated elasticity is essentially zero for public universities and 1.0 for private ones (Table
5). This difference is moderated somewhat when we use median regression (Table 6), but even
there the elasticities are 0.20 and 1.02, respectively. Using the median regression estimates and
evaluating at the relevant sample medians, we get $67,400 for public universities and $530,000
for private ones. We can compare these estimates of the marginal product to the median salaries
for two senior occupations in TLO’s (CUPA, 2002): the Chief Technology Officer and Senior
Technology Licensing Officer. For private universities, the marginal product is much higher
than these two median salaries ($122,000 and $72,400), indicating unexploited opportunities
for profitable expansion. But this is not true for public universities, where the marginal product
is actually lower than the median salaries ($105,600 and $78,700).
26

5 Concluding Remarks
In this paper we exploit cross-university variation in the share of licensing royalties received
by academic scientists in order to estimate the effect of monetary incentives on the level and
quality of inventive output, as measured by the number of inventions and the license income
generated by the inventions.
We report two main results. First, we show that academic research and inventive activ-
ity in universities respond to variations in inventors’ royalty shares. Controlling for a variety
of other determinants, including university size, quality and R&D funding, we find that uni-
versities with higher royalty shares generate higher levels of license income. This finding is
important because it implies that the design of intellectual property rights, and other forms of
incentives, in academic institutions can have real effects. We also explore whether the incen-
tive effects of royalty sharing work by inducing greater effort by scientists or through sorting
of scientists across universities. We find evidence of sorting effects, but we cannot pin down
the relative contribution of effort and sorting with the available data.
Second, we show that the response to incentives, and the effectiveness of technology
licensing offices, are much larger in private universities than in public ones. In private uni-
versities, the incentive effect is strong enough to produce a ‘Laffer effect’, where raising the
inventor’s royalty share would increase the license revenue actually retained by the university.
There are three main directions for further research. The first is to combine the data in
this paper with information on the objectives, internal incentives and organisational structure
of technology licensing offices, in order to understand why private universities perform so much
better than public ones in technology transfer. The second avenue is to examine university-
level data (and other public research organisations) for other OECD countries in which there
is variation both in cash flow and control rights. The third, and most ambitious, avenue is to
model university behavior and the academic labour market, incorporating pecuniary incentives
(salaries and royalties), multi-tasking and career concerns. To do this will require a suitable
specification of the objectives and decision-making rules of the university. Such a model could
be used as the basis for more detailed studies of incentives and university research using micro-
data on academic scientists.
27

license income per disclosure0 5000 25000 50000 95000
0
.001
.002
.003
Figure 1. Estimated Density of License Income per Disclosure
28

Table 1. Descriptive Statistics
Variable Mean Std. Dev. 25% 50% 75%
Average number of invention disclosures 66.9 81.0 19.5 44.7 81.1Average number of invention disclosures per faculty 0.22 0.19 0.11 0.17 0.26Average licensing income per disclosure(’000s) 43.0 113.3 9.2 16.3 34.4Faculty Size 359.6 368.7 136.0 288.0 494.0Scholarly quality (0-5) 3.0 0.8 2.5 3.1 3.6Publications per faculty 7.4 3.0 5.2 7.1 9.7Citations per faculty 18.5 22.7 5.1 11.7 21.2Average size of TLO (Number of full time professionals) 3.1 5.1 1.0 1.9 3.3Age of TLO in 1999 (years) 16.0 12.6 8.0 13.0 17.0Average inventor royalty share (%) 45.2 13.4 35.0 47.5 50.0
Notes: The mean, standard deviation and quartiles refer to the cross-sectional variation across the102 universities. For time-varying variables, we use the variation in time-means computed fromnon-missing data during the 1991-99 period.
29

Table 2. Distribution of Inventor Royalty Shares in 1996 (percent)
Income Interval Mean 25% 50% 75% Min Max
Linear: All intervals (No. obs=58) 41 33 40 50 25 65
0-10,000 54 45 50 50 20 10010,000-50,000 46 40 50 50 20 9350,000-100,000 42 33 50 50 20 85100,000-300,000 35 29 33 40 20 85300,000-500,000 33 25 30 40 20 85500,000-1 million 32 25 30 35 20 85Over 1 million 30 25 30 34 13 85
Nonlinear: Expected Share (No. obs=44) 51 41 49 49 20 97
30

Table 3. Inventor Royalty Shares (percent)by University Characteristics
Quartile Faculty Size University Quality TLO Size per Faculty1 50 47 442 43 46 483 44 44 464 43 44 43
F-test 1.72 0.28 0.55(p-value) (0.17) (0.84) (0.65)
Notes: Based on 102 universities in 1996.
31

Table 4. Parameter Estimates for Basic Specifications, All UniversitiesRevenues Invention Disclosures(1) (2) (3) (1) (2) (3)
Royalty share 1.07 1.06∗ 1.43∗ -0.42 -0.30 -0.29(.62) (.49) (.54) (.34) (.20) (.20)
Log faculty size 1.26∗ 1.10∗ 1.16∗ 0.75∗ 0.69∗ 0.77∗
(.073) (.113) (.110) (.038) (.045) (.042)Quality — 0.46∗ 0.40∗ — 0.34∗ 0.29∗
(.133) (.130) (.053) (.054)Log (R&D/faculty) — 0.75∗ 0.48∗ — 0.53∗ 0.40∗
(.129) (.148) (.047) (.045)Log (TLO/faculty) — — 0.30∗ — — 0.25∗
(.099) (.031)Age TLO — — 0.023∗ — — 0.005∗
(.005) (.002)Biomedical — 0.25 0.51 — 0.78∗ 0.76∗
(.54) (.64) (.24) (.22)Other Biological — -1.17 -0.23 — 0.09 0.40
(.64) (.69) (.26) (.25)Computer Science — 0.32 1.80 — 0.39 0.86
(1.50) (1.66) (.56) (.67)Chemical Science — -1.11 -0.07 — 0.10 0.45
(.62) (.77) (.28) (.31)Engineering — 1.25 1.23 — 1.77∗ 1.56∗
(.65) (.738) (.24) (.22)R2 0.42 0.55 0.58 0.52 0.76 0.76No. obs. 731 730 717 744 743 730
Notes: 1-lag Newey-West standard errors in parentheses. An asteriskdenotes significance at the 0.05 level. Year dummies included in all regressions.
32

Table 5. Parameter Estimates for Basic Specifications, by University TypePublic Universities Private UniversitiesRevenues Disclosures Revenues Disclosures
Royalty share 1.23 -0.61∗ 5.67∗ 1.30∗
(.72) (.21) (1.42) (.44)Log faculty size 1.25∗ 0.73∗ 1.55∗ 0.84∗
(.13) (.055) (.33) (.089)Quality 0.23 0.36∗ 0.72∗ 0.42∗
(.18) (.098) (.29) (.075)Log (R&D/faculty) 0.45∗ 0.30∗ 0.42 0.50∗
(.15) (.054) (.26) (.062)Log (TLO/faculty) 0.01 0.26∗ 1.00∗ 0.29∗
(.11) (.037) (.19) (.068)Age TLO 0.025∗ 0.006∗ 0.001 -0.004
(.005) (.002) (.011) (.004)Chemicals 0.15 0.64 6.49 2.60
(.83) (.33) (4.3) (1.68)Computer Science 2.02 1.25 -3.84 -3.03∗
(1.59) (.69) (5.1) (1.53)Biomedical 1.00 1.01∗ 1.58 0.40
(.74) (.25) (1.5) (.53)Other Biological -1.31 0.62∗ 2.89 0.14
(.80) (.28) (1.7) (.52)Engineering 0.77 1.66∗ 4.81∗ 1.94∗
(.83) (.23) (1.6) (.60)R2 0.60 0.79 0.70 0.85No. obs 507 515 210 215
Notes: 1-lag Newey-West standard errors in parentheses.An asterisk denotes significance at the 0.05 level.Year dummies included in all regressions.
33

Table 6. Median Regressions, by University TypePublic Universities Private UniversitiesRevenues Disclosures Revenues Disclosures
Royalty share 0.56 -0.62∗ 4.64∗ 1.83∗
(.43) (.21) (1.42) (.51)Log faculty size 1.18∗ 0.82∗ 1.05∗ 0.90∗
(.10) (.046) (.33) (.11)Quality 0.42∗ 0.14∗ 0.96∗ 0.40∗
(.13) (.063) (.28) (.10)Log (R&D/faculty) 0.36∗ 0.34∗ 0.14 0.51∗
(.12) (.056) (.22) (.071)Log (TLO/faculty) 0.20∗ 0.30∗ 1.02∗ 0.32∗
(.081) (.037) (.18) (.067)Age TLO 0.021∗ 0.005∗ 0.001 -0.003
(.004) (.002) (.014) (.005)Pseudo-R2 0.39 0.59 0.50 0.66No. obs 507 515 210 215
Notes: An asterisk denotes significance at the 0.05 level.Year dummies included in all regressions. All regressions include the technological fieldshares but their parameter estimates are not reported.
34

Table 7. Alternative Quality MeasuresPublic Universities Private Universities
Revenues Disclosures Revenues DisclosuresRoyalty share 1.42∗ 1.31 -0.45∗ -0.54∗ 7.36∗ 7.15∗ 1.78∗ 1.39∗
(.72) (.72) (.17) (.19) (1.34) (1.37) (.56) (.51)Cites/faculty 0.012∗ — 0.014∗ — 0.015∗ — 0.001 —
(.003) (.002) (.004) (.002)Publications/faculty — -0.021 — -0.030 — 0.050 — 0.083∗
(.044) (.017) (.081) (.027)Cites/publication — 0.16∗ — 0.21∗ — 0.15 — -0.085∗
(.061) (.025) (.09) (.033)R2 0.61 0.61 0.82 0.83 0.72 0.71 0.83 0.84No. obs 507 507 515 515 210 210 215 215
Notes: 1-lag Newey-West standard errors in parentheses.An asterisk denotes significance at the 0.05 level.Estimated parameters of the other control variables are not reported.
35

Table 8. R&D by Source: Industry and GovernmentPublic Universities Private UniversitiesRevenues Disclosures Revenues Disclosures
Royalty share 1.26 -0.57∗ 5.77∗ 1.29∗
(.71) (.21) (1.42) (.44)Log (industry R&D/faculty) -0.02 0.15∗ -0.16 0.06
(.10) (.03) (.14) (.06)Log (public R&D/faculty) 0.43∗ 0.20∗ 0.53 0.42∗
(.16) (.06) (.29) (.06)
F-test: equal R&D effects 4.09 0.55 3.05 14.3(p-value) (.04) (.46) (.08) (.000)R2 0.60 0.79 0.71 0.85No. obs 497 502 210 215
Notes: 1-lag Newey-West standard errors in parentheses.An asterisk denotes significance at the 0.05 level.Estimated parameters for other control variables are not reported.
36

Table 9. Quality-Incentive Effect InteractionsPublic Universities Private UniversitiesRevenues Disclosures Revenues Disclosures
Royalty share 1.48∗ -0.54∗ 5.43∗ 1.35∗
(.76) (.21) (1.58) (.44)Quality 0.32 0.44∗ 0.68 0.53∗
(.26) (.14) (.41) (.17)Royalty share -0.60 0.09 -0.68 0.09× bottom quality quartile (.69) (.27) (1.35) (.55)
Royalty share -0.69 -0.34 -0.46 -0.49× top quality quartile (.53) (.21) (1.14) (.38)
F-test: equal incentive effects 1.96 1.44 0.46 1.01(p-values) (.14) (.24) (.63) (.37)R2 0.61 0.79 0.71 0.85No. obs 507 515 210 215
Notes: 1-lag Newey-West standard errors in parentheses.An asterisk denotes significance at the 0.05 level.Estimated parameters for other control variables are not reported.
37

Table 10. Demand Control: High-Tech ActivityPublic Universities Private Universities
Revenues Disclosures Revenues Disclosures
Royalty share 1.24 -0.44 7.59∗ 1.33∗
(.89) (.23) (1.45) (.50)High-tech index 0.096 0.15∗ 0.088∗ 0.004
(.056) (.033) (.022) (.009)R2 0.64 0.82 0.75 0.81No. obs 450 455 200 202
Notes: 1-lag Newey-West standard errors in parentheses.An asterisk denotes significance at the 0.05 level.Estimated parameters for the other control variables are not reported.
38

Table 11. Tests of Effort and Sorting: Total License RevenuesPublic Universities Private Universities
k = 2 k = 3 k = 4 k = 2 k = 3 k = 4
Royalty share (δ1R) 1.19 0.97 1.10 6.22∗ 5.97∗ 6.31∗
(.74) (.74) (.77) (1.44) (1.43) (1.39)Competitors’ royalty share (δ2R) -1.66 -3.34∗ -2.95 -4.87∗ -3.94∗ -8.77∗
(1.24) (1.64) (2.23) (2.00) (1.87) (2.39)δ1R + δ2R -0.47 -2.37 -1.85 1.35 2.03 -2.45
(1.51) (1.91) (2.6) (1.87) (2.10) (2.30)R2 0.61 0.61 0.61 0.72 0.72 0.72No. obs 507 507 507 210 210 210
Notes: 1-lag Newey-West standard errors in parentheses.An asterisk denotes significance at the 0.05 level.Estimated parameters for other control variables are not reported.
39

References
[1] Adams, James (1990), “Fundamental Stocks of Knowledge and Productivity Growth,”
Journal of Political Economy, 98(4), 673-702.
[2] Adams, James (2002), “Comparative Localization of Academic and Industrial Spillovers”,
Journal of Economic Geography, vol. 2, 253-278.
[3] Adams, James and Zvi Griliches (1996), “Measuring Science: An Exploration,” Proceedings
of the National Academy of Sciences, 93: 12664-12670.
[4] Adams, James and Zvi Griliches (1998), “Research Productivity in a System of Universi-
ties,” Annales D’Economie et de Statistique, No. 49/50.
[5] American Association of University Professors (2001), “The Annual Report on the Eco-
nomic Status of the Profession: 1999-2000.” From http://www.aaup.org/surveys.
[6] Association of University Technology Managers (2000), AUTM Licensing Survey
[7] Audretsch, David and Paula Stephan (1996), “Company-Scientist Locational Links: The
Case of Biotechnology,” American Economic Review, 86(3), 641-652.
[8] Bercovitz, Janet, Maryann Feldman, Irwin Feller and Richard Burton (2001), “Organi-
zational Structure as a Determinant of Academic Patent and Licensing Behavior: An
Exploratory Study of Duke, Johns Hopkins and Pennsylvania State Universities,” Journal
of Technology Transfer, 26(1/2), 21-35.
[9] College and University Personel Association (CUPA), Administrative Compensation Sur-
vey, 2002-2003.
[10] Friedman, Joseph and Jonathan Silberman (2003), “University Technology Transfer: Do
Incentives, Management and Location Matter?” Journal of Technology Transfer, 28 (1),
17-30.
[11] Coupe, Tom (2003), “Science is Golden: Academic R&D and University Patents,” Journal
of Technology Transfer, 28 (1), 31-46.
40

[12] Goldberger, Marvin, Brendan A. Maher, and Pamela Ebert Flattau, eds., Research-
Doctorate Programs in the United States: Continuity and Change, National Academy
Press, Washington DC, 1995.
[13] Harhoff, Dietmar, Francis Narin, F.M. Scherer and Katrin Vopel (1999), “Citation Fre-
quency and the Value of Patented Inventions,” Review of Economics and Statistics, 81(3),
511-515.
[14] Henderson, Rachel, Adam Jaffe and Manuel Trajtenberg (1998), “Universities as a Source
of Commercial Technology: A Detailed Analysis of University Patenting, 1965-1988,” Re-
view of Economics and Statistics, 119-127.
[15] Jaffe, Adam (1989), “Real Effects of Academic Research,” American Economic Review,
79(5), 957-970
[16] Jaffe, Adam, Manuel Trajtenberg and Rebecca Henderson (1993), “Geographic Localiza-
tion of Knowledge Spillovers as Evidenced by Patent Citations,” Quarterly Journal of
Economics, 108(3), 577-598.
[17] Jensen, Richard and Marie Thursby (2001), “Proofs and Prototypes for Sale: The Licens-
ing of University Inventions,” American Economic Review, 91(1), 240-259.
[18] Lazear, Edward (2000), “Performance Pay and Productivity,” American Economic Review,
90(5), 1346-1361
[19] Mowery, David and Arvids Ziedonis (2001), “The Geographic Reach of Market and Non-
Market Channels of Technology Transfer: Comparing Citations and Licenses of University
Patents,” National Bureau of Economic Research Working Paper No. 8568 (October).
[20] National Science Board (2000), Science and Engineering Indicators (Washington D.C.:
National Science Foundation).
[21] Schankerman, Mark (1998), “How Valuable is Patent Protection? Estimates by Technology
Field,” RAND Journal of Economics, 29(1), 77-107.
41

[22] Siegel, Donald, David Waldman and Albert Link (2003), “Assessing the Impact of Organi-
zational Practices on the Relative Productivity of University Technology Transfer Offices:
An Exploratory Study”, Research Policy, 32(1), 27-48.
[23] Thursby, Jerry, Richard Jensen and Marie Thursby (2001), “Objectives, Characteristics
and Outcomes of University Licensing: A Survey of Major U.S. Universities,” Journal of
Technology Transfer, 26(1-2), 59-72.
[24] Thursby, Jerry and S. Kemp (2002), “Growth and Productive Efficiency of University
Intellectual Property Licensing,” Research Policy, 31(1), 109-124.
[25] Tuomala, Matti (1990), Optimal Income Tax and Redistribution (Clarendon Press: Ox-
ford).
[26] Zucker, Linda , Michael Darby and Marilynn B. Brewer (1998), “Intellectual Human Cap-
ital and the Birth of U.S. Biotechnology Enterprises,”American Economic Review, 88(1),
290-306.
42


![BACKGROUND OF INVENTION · BACKGROUND OF INVENTION Field of the invention [0001] This invention relates to the problem of constructing a reliable pitch spelling algorithm—that is,](https://static.fdocuments.in/doc/165x107/600c16f1523e156bbe2bb12c/background-of-background-of-invention-field-of-the-invention-0001-this-invention.jpg)