
Incentives and Group Identity - Columbia University
45
Incentives and Group Identity * Paolo Masella † Stephan Meier ‡ Philipp Zahn § July 2012 Abstract This paper investigates in a principal-agent environment whether and how group membership influences the effectiveness of incentives and when incentives can have “hidden costs”, i.e., a detrimental effect. We show experimentally that in all in- teractions control mechanisms can have hidden costs for reasons specific to group membership. In within-group interactions control has detrimental effects because the agent does not expect to be controlled and reacts negatively when being con- trolled. In between-group interactions, agents perceive control more hostile once we condition on their beliefs about principal’s behavior. Our finding contributes to the micro-foundation of psychological effects of incentives. Keywords: social identity, social preferences, incentives, motivation, crowding out, trust, experiment JEL: C91, D03, Z13 * We thank Steffen Altman, Yan Chen, Dirk Engelmann, Jana Friedrichsen, Hans-Peter Gr¨ uner, Astrid Hopfensitz, Sherry Li, Marie-Claire Villeval and seminar participants at Mannheim University, Toulouse School of Economics, and the ESA 2012 Conference in New York for helpful comments. We are grateful to Yan Chen, Sherry Li, Matteo Ploner, James Tremewan, and Anthony Ziegelmeyer who provided us with software source code and original instructions. Financial support by the University of Mannheim is gratefully acknowledged. † University of Mannheim, Department of Economics, L7 3-5, 68131 Mannheim; [email protected] ‡ Columbia University, Graduate School of Business, 3022 Broadway, New York, NY 10027; [email protected] § University of Mannheim, Department of Economics, L7 3-5, 68131 Mannheim; [email protected] 1
Transcript of Incentives and Group Identity - Columbia University

Incentives and Group Identity∗
Paolo Masella† Stephan Meier‡ Philipp Zahn§
July 2012
Abstract
This paper investigates in a principal-agent environment whether and how group
membership influences the effectiveness of incentives and when incentives can have
“hidden costs”, i.e., a detrimental effect. We show experimentally that in all in-
teractions control mechanisms can have hidden costs for reasons specific to group
membership. In within-group interactions control has detrimental effects because
the agent does not expect to be controlled and reacts negatively when being con-
trolled. In between-group interactions, agents perceive control more hostile once we
condition on their beliefs about principal’s behavior. Our finding contributes to the
micro-foundation of psychological effects of incentives.
Keywords: social identity, social preferences, incentives, motivation, crowding
out, trust, experiment
JEL: C91, D03, Z13
∗We thank Steffen Altman, Yan Chen, Dirk Engelmann, Jana Friedrichsen, Hans-Peter Gruner, Astrid Hopfensitz,
Sherry Li, Marie-Claire Villeval and seminar participants at Mannheim University, Toulouse School of Economics, and
the ESA 2012 Conference in New York for helpful comments. We are grateful to Yan Chen, Sherry Li, Matteo Ploner,
James Tremewan, and Anthony Ziegelmeyer who provided us with software source code and original instructions. Financial
support by the University of Mannheim is gratefully acknowledged.†University of Mannheim, Department of Economics, L7 3-5, 68131 Mannheim; [email protected]‡Columbia University, Graduate School of Business, 3022 Broadway, New York, NY 10027; [email protected]§University of Mannheim, Department of Economics, L7 3-5, 68131 Mannheim; [email protected]
1

1 Introduction
An important premise in agency theory is the power of incentives: without proper in-
centives, agents would not put in enough effort and would shirk substantially. As a con-
sequence, principals need to use incentives and control systems in order to make agents
perform. While incentives do increase effort in certain settings (e.g., Lazear, 2000), they
can also have detrimental effects, i.e., individuals put in less effort in the presence of
monetary incentives than without (for reviews of the literature, see Frey and Jegen, 2001;
Fehr and Falk, 2002; Gneezy et al., 2011). Control as one particular form of incentive
can be particularly problematic as results by Falk and Kosfeld (2006) indicate. The im-
plementation of a control mechanism that forces agents to put in at least some effort can
have substantial “hidden costs” leading to lower effort than if agents are not controlled
by the principal.1 While there is growing evidence that incentives can be detrimental
in principal-agent situations, the conditions when incentives turn detrimental are less
understood.
This paper investigates whether “hidden costs of incentives and control” are partic-
ularly relevant when the principal and the agents have a close relationship (as argued in
Frey, 1993; Dickinson and Villeval, 2008). Detrimental effects of incentives and control
mechanisms might be restricted to interactions among friends, family members or in-group
members as they are more likely to be perceived by the agent as distrust and a violation
of a psychological contract (e.g. Fehr and Falk, 2002; Sliwka, 2007; Ellingsen and Johan-
nesson, 2008; Von Siemens, 2011). Many examples of hidden cost of incentives refer, in
fact, to interactions within-groups, e.g. negative effect of incentivizing one’s child to help
in the house (Frey and Jegen, 2001), helping a friend move for free or for pay (Heyman
1Similar detrimental effects of control and incentives are observed in a number of other experimentalstudies (e.g. Fehr and Rockenbach, 2003; Fehr and List, 2004; Fehr et al., 2007; Gachter et al., 2010).And hidden benefits of delegation (i.e., the flipside of control) are also observed (Charness et al., 2011).
2

and Ariely, 2004). However, in many situations incentives are used not within-groups
but in between-groups interactions. For example, many principal-agent relationships are
between firms, i.e., buyers and suppliers. Even within firms, the principal often belongs
to and identifies with a different and very salient team or group: the management (white
collar) controls the workers (blue collars) or provides incentives to the salesforce. It is well
known that in such between-group interactions, trust is lower to begin with (e.g. Fersht-
man and Gneezy, 2001; Chen and Li, 2009; Falk and Zehnder, 2007) and incentives might
be less detrimental as agents do notexpect their out-group principals to be trusting. If
the incentive effect is less detrimental in between-group interactions, then the effect might
be less relevant in a situation in which agents do notidentify with the same group as the
principals.
We test the impact of group identity on the effectiveness of incentives in an experiment
a la Falk and Kosfeld (2006) in which all participants belong to one of two different groups
(the group manipulation is implemented similar to Chen and Li, 2009). Principals have
to decide whether or not they want to control their agent by setting a minimum transfer
level. Agents then decide on tranfers. Our experiment is able to replicate both that
a) control can be detrimental and reduce transfers and that b) group membership leads
to substantial in-group bias, i.e., agents provide higher transfers for in-group principals.
More importantly, our setting allows analyzing whether the “hidden cost of control” are
group-specific, i.e., whether control is perceived differently in within-group and between-
group matchings.
The results show that hidden costs of control are as strong in between-group match-
ings as in within-group matchings. But while the overall effectiveness of incentives seems
not to depend on the social distance between principal and agents through joint group
identity, the mechanisms for how incentives are perceived are group-specific. In within-
group interactions “hidden costs of control” occur because agents expect the principal
3

not to control. When principals control nevertheless, agents reduce their transfers signifi-
cantly as a reaction. If the agent and the principal do notshare the same group, however,
the mechanism is different: Keeping agents’ beliefs about the principal’s behavior con-
stant, agents perceive control more hostile in a between-group matching. This “hostility
effect” is consistent with previous findings (Chen and Li 2009 and Gotte et al. 2012a), who
show that when minimal groups are artificially generated, punishment for misbehavior is
stronger in between-group than in within-group interactions.2
Our results make two important contributions to the literature: First, our paper
contributes to the discussion of the impact of group identity in organizations. Akerlof
and Kranton (2005) stressed the importance of group identity for organizational design
and incentive schemes – introducing a long research tradition in social psychology to eco-
nomics.3 While there is a growing literature in economics on the effects of group identity
on individual behavior (e.g. Fershtman and Gneezy, 2001; Gotte et al., 2006; Bernhard
et al., 2006; Charness et al., 2007; Chen and Li, 2009; Sutter, 2009; Chen and Chen,
2011; Gotte et al., 2012b,a), there are few papers that investigate how social interactions
(within or across firms) affect the efficacy of incentives and control schemes. Bandiera
et al. (2009, 2010) show how social connections among agents affect the effectiveness of
different incentive schemes. Our paper focuses on the effectiveness of principal’s control
without lifting anonymity as in Dickinson and Villeval (2008), who study the impact of
monitoring.4 Our results show that incentive schemes can have detrimental effects not
only in principal-agents relationship with close social ties. Incentives and control schemes
2When real groups are considered, however, as in Gotte et al. (2006) and Bernhard et al. (2006),individuals punish violators of social norms harsher in between-group interactions only if the victim ofthe violation belongs to their own group.
3In the management literature, identification with a firm is also been argued to be an important aspectof firm’s performance through improving coordination and cooperation (e.g Kogut and Zander, 1996).
4They generate interpersonal relationships between principal and agents by removing subjectanonymity, introducing subjects to one-another and allowing them to engage in five-minutes of face-to-face interactions. They find that monitoring incentives are no more efficient when anonymity is liftedand social exchange between principal and agent is allowed.
4

are perceived very differently in between vs. within-group matchings indicating that group
membership in principal-agent relationships is important.
Secondly, we contribute to the literature in economics on psychological effects of
incentives. While a number of previous papers show that incentives can have “hidden
costs” (for a review, see Gneezy et al., 2011), relatively little is known about the conditions
under which incentives or control mechanisms are more likely to have detrimental effects.
Our paper shows that ‘situational’ factors critically affect how incentives are perceived,
and as a result, when they are more likely to work as predicted by traditional agency
theory and when not. In the end, in both between- and in within-group matchings the
implementation of a control mechanism has “hidden costs”, but for different reasons.
These different, group-specific reasons contribute to a micro-foundation of psychological
effects of incentives.
The paper proceeds as follows: in section 2 we present the experimental design.
Section 3 discusses our behavioral hypotheses based on a simple model that illustrates
the different effects group identity can have on incentives. Section 4 presents the results
and section 5 concludes.
2 Experimental Design
To analyze how group identity affects the “hidden cost of incentives”, participants are,
first, assigned to different groups and, second, interact in a stylized principal-agent rela-
tionship in which the principal can incentivize the agent by imposing a control mechanism.
The choice of the principal-agent interaction and the group treatment were guided by the
desire to create a setup in which incentives can be detrimental and in which group identity
is quickly established while still being created randomly.
5

2.1 Group Manipulation
We randomly manipulate group identity in the lab using three steps similar to Chen and
Li (2009):5 First, each individual was presented a pair of five pictures by two artists
(Klee and Kandinsky). For each pair, subjects had to choose one painting. Subjects
were then ranked according to their choices and assigned to either the “Kandinsky” or
the “Klee” group. To guarantee equally large groups, there was a random draw that
assigned subjects such that groups were balanced in the case of an initally unbalanced
assignment.6 A subject knew that her own and the choices of the other subjects would
be used to assign two equally large groups. Subjects were not informed about the details.
After each subject had made a decision, participants learned to which group they had
been assigned.
Secondly, each subject participated in a quiz.7 Within their own group, subjects
could communicate via a chat program to discuss the questions. While subjects could
discuss with group members which answers were correct, each subject had to answer
individually and in private, i.e., decisions were not observed by other subjects.
Thirdly, to further strengthen group identity we introduced an incentivized group
competition using the outcome in the quiz as scores: the group with the highest average
of correct answers received a prize of 8 EUR per group member. Results by Eckel and
Grossman (2005), Charness et al. (2007), and Gotte et al. (2012b) indicate that compe-
tition among groups induced by financial rewards have a strong effect on group identity.
5We thank Yan Chen and Sherry Li for providing us with the original z-tree code and the originalinstructions of Chen and Li (2009). Moreover, we thank James Tremewan for providing us with the z-treecode for the chat treatment that was used in Tremewan (2010).
6Subjects from the initially larger group were reassigned to the smaller group by using the ranking ofchoices. Among those subjects who had the same ranking and were closest in their choices to the smallergroup, a random variable was drawn which then determined which subject was reassigned.
7The quiz comprised five questions covering two more painting pairs and three political-economic issuesregarding Germany (the rate of inflation, the budget of the Department of Defense, and the number ofsecretaries in the federal government).
6

The prize was announced before the quiz started. The outcome of the group competition,
however, was only revealed at the end of the experiment when subjects had already made
all their decisions.
The groups are almost ‘minimal groups’ according to the standards in psychology (e.g.
Tajfel and Turner, 1979) and are not real groups as in, e.g., Fershtman and Gneezy (2001);
Bernhard et al. (2006). The advantage of using this approach is that the groups are neither
endogenously formed nor do they differ in any observable characteristics like ethnicity
which would make inference about the effect of group identity per se very difficult.8
Another approach would have been to use randomly assigned real groups (e.g., Gotte
et al., 2006). Our approach allows us to see whether a minimal identity already has an
effect.9
2.2 Principal-Agent Interaction
After we manipulated group identity, subjects played a principal-agent game based on the
design by Falk and Kosfeld (2006).10 The agent decides on whether to make a transfer.
The transfer is tripled by the experimenter and represents the payoff of the principal.
Before the agent decides, the principal can restrict the agent’s choice set to an exogenously
given lower bound (the minimum transfer the agent has to make) or leave the agent’s set
unrestricted.
8Methodologically, we vary the social distance between principal and agents without lifting theanonymity as other studies had to do. Previous approaches make it difficult to isolate anonymity ef-fects from effects of the closeness of the principal-agent relationship (e.g., Dufwenberg and Muren, 2006;Bohnet and Frey, 1999; Dickinson and Villeval, 2008).
9In half of the sessions we also added a dictator game stage to see whether it can further increase groupidentity. The dictator game stage took place after the group manipulation and before the simplified giftexchange game stage described in this section. As it does not change the results qualitatively, we analyzeall the sessions together in the main text and relegate the results separated for the condition with andwithout a dictator game to the Appendix (see tables B2 and B3).
10We thank Matteo Ploner and Anthony Ziegelmeyer (Ziegelmeyer et al., 2012) for providing us withthe original instructions and the original z-tree code of Falk and Kosfeld (2006).
7

An agent’s payoff is yA = 24− t. He can choose t from t ∈ {0, ..., 24} points if he is
not controlled by the principal and from t ∈ {1, ..., 24} points if he is controlled by the
principal. We explicitly choose parameters that are most likely to generate “hidden costs
of control” (Falk and Kosfeld, 2006; Gneezy and Rustichini, 2000) as we are interested in
studying when these costs are most prevalent.
The principal’s payoff is yP = t · 3. Hence, the principal can secure himself a payoff
of at least 3 points if he controls the agent.
Subjects were randomly assigned to be either an agent or a principal for the whole
experiment. Subjects played two rounds of this principal-agent interaction. In the first
round, one half of principals and agents was randomly matched with a counterpart from
the same group, the other half was randomly matched with a counterpart from the other
group. In the second round, each subject was matched in the opposite constellation.
When we check whether there are any order effects by controlling for the round, the
results do not change.11
All interactions were anonymous. Subjects only knew the group membership of the
subject they interacted with, i.e., whether the counterpart belonged to the same or to the
other group. Subjects also knew that they would be matched with a different participant
in the second round.12
Subjects learned the outcome of the interaction only after the second round was
completed. Subjects were then paid one randomly drawn round.
As in Falk and Kosfeld (2006) we used the strategy method to elicit a response
by agents for the two possible cases, being controlled and not being controlled in each
round. While it is possible that the strategy method influences results, two points have
11Results are not reported here. They are available upon request.12Subjects did not know in advance that they would be matched with an in-group member in one round
and an out-group member in the other round.
8

to be noted: First, the empiricial evidence that the strategy method leads to a different
behavior than the direct-response method is mixed. In a recent survey, Brandts and
Charness (2011) report on 29 studies investigating the differences between the strategy
and the direct-response method. Out of these twenty-nine studies, four find differences,
nine find mixed evidence, and sixteen find no differences. Secondly and more importantly,
Falk and Kosfeld (2006) conduct a control treatment (SR10) where they do not find any
significant differences between the two methods. As we are using the same design, we are
confident that our results are robust to the direct-response method also.13
In addition, we elicited beliefs from agents as well as from principals. After they had
made a decision in each round, we asked them what they believed the principal (agent)
would do.14
2.3 Procedures
The experiment was conducted in the experimental lab at Mannheim University in
September 2011. The experiment was computerized using z-tree (Fischbacher, 2007).
Subjects were students from the University of Mannheim from different fields. They were
recruited using the online system ORSEE (Greiner, 2004).
In total 128 subjects participated in 16 sessions. A session lasted between 35 and
45 minutes. One point in the experiment represents 0.5 EUR and average earnings were
16.80 EUR (about $23).
13Falk and Kosfeld (2006) is also among the surveyed articles in Brandts and Charness (2011) whichdo not find differences.
14The exact question for the agent was:“What do you think, will participant A constrain you to transferat least 1 point?”. For the principal it was:“What do you think, how many points will participant Atransfer if you allow him to decide freely?” and “What do you think, how many points will participant Atransfer if you constrain him to transfer at least 1 point?”. As in Falk and Kosfeld (2006) belief elicitationwas not incentivized. Subjects were informed that their responses had no influence on their payoffs.
9

3 Behavioral Predictions
We are interested in what influences the effect of control and how it depends on group
identity of the principal and the agent. We set π(m, τ) for the effect of control, that is, the
transfer when an agent is not controlled minus the transfer when an agent is controlled.
π(m, τ) depends on two factors: m, the matching between an agent and a principal, and
τ , the beliefs of an agent about the action a principal will decide to undertake. The
matching is m = w if the agent and the principal belong to the same group (within-group
matching) and m = b otherwise (between-group matching); τ can take on only two values,
τ = n if the agent expects to be trusted by the principal and therefore not to be controlled
by him, and τ = c, if he expects to be controlled.
Group identity of the principal and the agent can influence the effectiveness of in-
centives in several ways. Below we outline three channels through which group identity
can impact how agents react to control. While the first channel is concerned with the
level of prosocial behavior in the absence of control, the other two deal with how control
is perceived by an agent.
1. “Prosocial effect”: In general, hidden costs of control can only be observed if agents
make positive transfers without control (prosocial behavior). As such, control is
effective if agents do nottransfer without control, i.e., if their transfer is zero when
not being controlled.
It is typically observed that shared group identity substantially increases prosocial
behavior within-group (for a review of research on in-group bias, see Hewstone et
al. (2002)). As a result, control is going to be more effective in a between-group
matching because of two effects. First, more agents will be pushed from a zero
transfer to the minimum transfer of 1 in a between-group matching. Secondly, in a
10

between-group matching, there are fewer agents behaving prosocially and thus fewer
agents whose transfer can be crowded out by the incentive. If sm(0) is the fraction
of agents that chooses a transfer of zero in a matching m and sm(> 1) the fraction
of agents that chooses a transfer larger than 1 in a matching m, we then expect
both sw(0) < sb(0) and sw(> 1) > sb(> 1).
While control mechanically has a positive effect for those individuals who are selfish,
for individuals behaving prosocial and whose transfers thereby can be crowded out, we
discuss two channels through which control can have a negative effect.
2. “Trust effect”: Control as an incentive scheme can have ‘hidden costs’ as it sig-
nals distrust of the principal towards the agent (e.g. Fehr and List, 2004; Falk
and Kosfeld, 2006). Agents punish principals more harshly if they do not expect
to be distrusted by the principal. In the above framework, we therefore expect
π(m,n) − π(m, c) ≡ γ > 0, for all m and conditional on a transfer larger than 1.
Therefore, independent of the matching m, the crowding out will be stronger when
an agent does not expect to be controlled (τ = n).
Denote with bm the share of agents who believe to be controlled in a matching m
(conditional on transfers larger than 1). We expect that group membership will
affect this share of agents, that is, in a between-group matching more agents will
expect to be controlled (bb > bw). As a result, the share of individuals that will be
disappointed by a principal’s decision to control will be higher in a within-group
matching.
3.) “Hostility effect”: A violation of expected trust might be just one reason why con-
trol can have hidden costs. Given an agent’s expectation about principals’ actions,
an agent might perceive control as more or less ‘offensive’ as he or she will interpret
11

what control signals about a principal’s view on the agent or attribute the action by
the principal to his or her attitudes or traits. Group identity can change this per-
ception of actions from in- or out-group members substantially. The famous ‘group
attribution error’ (Allison and Messick, 1985) as one way of group specific ‘social
inference’ (Tajfel, 1982; Hastie, 1983) shows that the same actions are perceived
differently if taken by an in- or out-group member. Holding expectations constant,
control by an out-group principal is expected to be perceived more negatively than
control by an in-group member. That is, we expect π(b, τ)−π(w, τ) ≡ δ > 0, for all
τ and transfers larger than 1. So, for given expectations about being controlled or
not, control will increase crowding out more strongly in a between-group matching
than in a within-group matching.
As a last step we derive the formula for the difference between the average effect of
control in a within-group matching and the average effect of control in a between-group
matching. To simplify notation, we set π(w, c) ≡ κ. Then, putting the three effects from
above together, we get as the difference-in-difference, Πw − Πb:15
Πw − Πb = (sb(0)− sw(0)) + [(sw(> 1)− sb(> 1)]κ︸ ︷︷ ︸Prosocial Effect
(1)
+ [sw(> 1)(1− bw)− sb(> 1)(1− bb)] γ︸ ︷︷ ︸Trust Effect
− sb(> 1)δ︸ ︷︷ ︸Hostility Effect
The three different effects of group membership on the effect of incentives are coun-
tervailing. While the ‘prosocial effect’ and the ‘trust effect’ predict more hidden costs
15For the details of the derivation see section Appendix B.1
12

of control in within-group interactions, the ‘hostility effect’ predicts more hidden costs
in between-group matchings. The net effect in within-group compared to between-group
interactions is therefore unclear. We will show in the next section the net effect first and
then disentangle the different channels by using information collected during the experi-
mental stage on both the transfers provided by the agents and whether they expect to be
controlled by the principal.
4 Results
We present the results in two steps: first and most importantly, we discuss the behavior
of agents. This part presents the net effect of control on agents in within- and between-
group interactions and then shows whether some of the channels of crowding out are
matching-specific. Secondly, we discuss principals’ decision to control.
4.1 Agents’ Behavior
Our first result replicates the findings in Falk and Kosfeld (2006):
Result 1: We observe “hidden costs of control”: Control reduces average transfers
by agents.
Figure 1 depicts agents’ average transfers depending on matching (between-group or
within-group) and choice of the principal (to control or not to control). Across the two
treatments transfers are 4.8 points when agents are not being controlled and decline to 3.7
points when agents are being controlled. The average transfer in a between-group (within-
group) matching when not being controlled is 3.4 (6.1) points. When being controlled,
the transfer decreases to 2.5 points, or 73% of the transfer under no control, in a between-
group matching (4.9 points, respectively 80%, in a within-group matching). In Table 1
13

Notes: The figure depicts average individual transfers by agents asa function of control and matching.
Figure 1: Agents’ Average Transfer
14

Table 1: Agents’ Transfers Conditional on Control and Group Matching
Dependent Variable: Transfers (1) (2)Control (=1) -1.094*** -0.953***
(0.242) (0.291)
Within-group matching (=1) 2.531*** 2.672***(0.663) (0.699)
Control x Within-group -0.281(0.314)
Constant 3.539*** 3.469***(0.444) (0.474)
N 256 256
Notes: Standard errors are in parentheses. All columns reportresults of OLS regressions. Dependent variable is the individualtransfer. Standard errors are clustered at the individual level.Level of significance: * p<0.10, ** p<0.05, *** p<0.01
we report results from an OLS regression of agents’ transfer choices in control and group
matching. Column (1) shows that control has a significantly negative effect on agents’
transfer choices. When comparing our results to Falk and Kosfeld (2006), two points are
evident. First, the average transfer by agents who are not controlled is 5.02 points and
therefore in the range between our within-group and between-group results.16 Secondly,
however, the average crowding out is stronger than in our case (average transfer when
being controlled is 2.44 points, respectively 48%).17
Result 2: Group identity affects agents’ transfers. Independent of control decisions,
agents transfer more in a within-group matching than in a between-group matching.
In line with previous research we observe a clear effect of group identity. Agents
16Taken from Table 1 (p. 1619) treatment C5. We transformed the numbers into our 24-point-scale tomake them comparable. Also note that in Falk and Kosfeld (2006) every transfer by the agent is doubledand not tripled as in our design.
17Note that other experiments also report a smaller crowding out effect of control (Ziegelmeyer et al.,2012; Kessler and Leider, 2012).
15

transfer more points when they are matched with a participant of their own group in-
dependently of whether they are controlled or not. In a between-group matching agents
transfer 55% of the average transfer in a within-group matching. Table 1 shows that
the effect is statistically highly significant. Our results are similar to Chen and Li (2009,
p.442). They find that distributional preferences are affected by group identity. In particu-
lar, charity towards in-group members increases by 47% compared to out-group members.
Result 3: We observe no group identity effect on the average effect of control.
While group identity affects the transfers, it has no impact on how agents react when
being controlled. The average difference between the ‘effect of control’ between within-
and between-group matching (i.e., the diff-in-diff) is small (0.28) and not statistically
significant as shown in Table 1, column (2).
While the net effect does not differ, in the following, we decompose the diff-in-diff as
described in section 3 into three effects: prosocial, trust, and hostility. We first provide
evidence for the existence of these three effects and show that they depend on group
matching. Then, we identify the parameters described in section 3 and disentangle the
effects within the diff-in-diff.
Result 4: Group identity affects the distribution of transfers under no control.
More agents transfer zero and fewer agents transfer more than 1 in a between-group
matching.
Panel A (Panel B) in Figure 2 shows the distribution of transfers when the agent is not
controlled (is controlled) by the principal. Panel A illustrates that group identity affects
this distribution. The difference between the two distributions is statistically significant
(Mann-Whitney test, p<0.01). For the overall effect of control two points are important:
First, the share of agents who transfer zero is larger in a between-group matching (sb(0) =
16

0.28) than in a within-group matching (sw(0) = 0.12) and this difference is statistically
significant (Fisher’s exact test, p<0.05). Therefore, for a larger share of agents control is
binding in between-group interactions. Secondly, the share of agents who expend more
than 1 under no control - whose transfers thereby can be crowded out - is smaller in a
between-group matching (sb(> 1) = 0.66) than in a within-group matching (sw(> 1) =
0.86). This difference is also statistically significant (Fisher’s exact test, p<0.05).
In the following, we discuss the two other channels outlined in Section 3, trust and
hostility. Since they are only relevant to individuals who transfer more than one point
when not being controlled, in the empirical analysis further on we only focus on these
subjects. In appendix B.4, we provide results including all individuals and not only
subjects who exhibit a transfer greater than zero.
Result 5: Agents who expected to be trusted by principals, that is, agents who do
not expect to be controlled, reduce transfers more strongly.
The crowding out is mostly driven by agents who initially expected to be trusted
by the principal, that is by agents who did not expect to be controlled by them. They
show the strongest negative reaction to control: On average, the crowding out, i.e., the
reduction of transfers when being controlled, is around 1 point for agents who expect
the principal to control. It more than doubles to 2.2 points when they expect not to be
controlled. The difference of distributions is statistically significant (Mann-Whitney test,
p<0.001). In our model, this “trust effect” corresponds to γ.
Result 6: Group identity affects agents’ beliefs about the principal’s behavior. A
larger fraction of agents expects the principal to control in a between-group matching.
Figure 3 displays agents’ beliefs about the principal’s decision to control by matching
when we restrict the sample to agents that transfer more than 1 when not being controlled,
that is, we include only agents whose transfers can potentially be crowded out. The
17
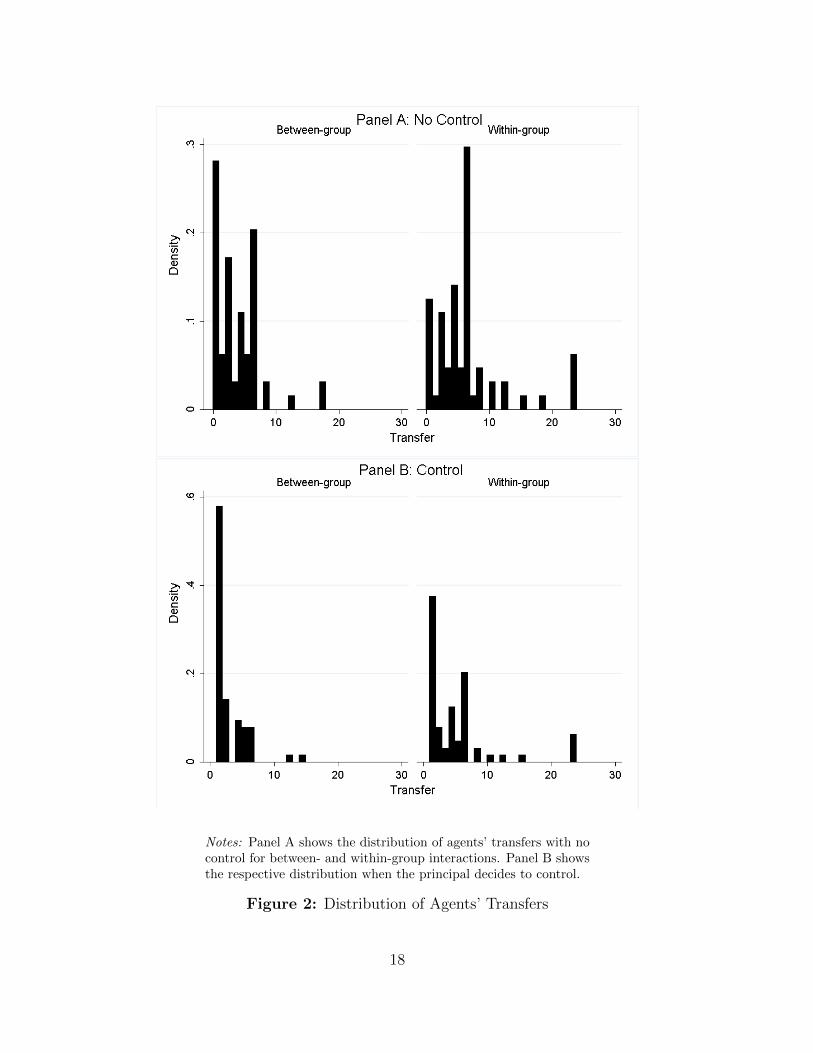
Notes: Panel A shows the distribution of agents’ transfers with nocontrol for between- and within-group interactions. Panel B showsthe respective distribution when the principal decides to control.
Figure 2: Distribution of Agents’ Transfers
18

Notes: The figure depicts average individual beliefs about beingcontrolled as a function of matching. We restrict the sample toagents that transfer more than 1 when not being controlled.
Figure 3: Average Beliefs about Principal’s Decision to Control
share of agents who expects to be controlled in a between-group matching, bb = 0.57,
is significantly larger than in a within-group matching, bw = 0.21 (Fisher’s exact test,
p<0.001).
Result 5 shows that agents’ transfers are crowded out more strongly if they expect
principals not to control them. As group identity influences the beliefs of the agents (Re-
sult 6), combining these two findings leads crowding out to be stronger in situations in
which principals and agents identify with the same group. However, there is a counter-
vailing effect:
Result 7: Agents exhibit a “hostility effect”. Keeping beliefs constant, agents reduce
transfers more strongly in between-group than in within-group matchings.
19

Once we control for their beliefs we find that agents react more negatively to being
controlled in a between-group matching. Figure 4 shows the average crowding out, i.e., the
transfer when not being controlled minus the transfer when being controlled, for different
matchings and different beliefs of agents (being controlled or not being controlled). The
figure again focuses on agents who transfer more than 1 when not being controlled. When
expecting that the principal controls, agents’ transfer is crowded out by 1.3 points on
average in a between-group matching, while it is only crowded out by 0.43 points in a
within-group matching (30% of crowding out in a between-group matching). Similarly,
when agents believe that principals will not control, crowding out amounts to 2.6 points
in a between-group matching, but 1.9 points in a within-group matching (73% of crowding
out in the between-group matching).
Table 2 shows the hostility effect in an OLS regression in which the dependent vari-
able is the extent of crowding out. To capture the “hostility effect” we add as independent
variables, first, a dummy for whether the principal-agent interaction is within-group and,
second, we add agents’ beliefs about principal’s behavior. The specification of main in-
terest is Column (1) on which the estimation of our simple model is based. Additionally,
we include transfer when not being controlled (Column (2)) and transfer when not being
controlled squared (Column (3)) as controls to demonstrate the robustness of our results.
Lastly, in columns (4) to (6) we use an alternative measure of crowding out as a depen-
dent variable, the difference between transfers when not being controlled and when being
controlled divided by the transfer when not being controlled, to show that results are
also robust to alternative measurements of crowding out. The results indicate that for all
specifications the hostility effect (which is captured in our model by δ) is significant, i.e.,
control has more “hidden costs” in between-group interactions if beliefs about principals’
behavior are kept constant.
Using the three effects of group identity on the efficacy of incentives, (1) prosocial
20

Notes: The figure depicts average crowding out, i.e., transfers underno control - transfers under control, as a function of agents’s beliefsand matching. We restrict the sample to agents that transfer morethan 1 when not being controlled.
Figure 4: Average Crowding Out Depending on Agents’ Beliefs and Matching
21

Table 2: Agents’ Crowding Out
Dependent Variable: Diff Diff Diff Fraction Fraction Fraction(1) (2) (3) (4) (5) (6)
Within-group matching (=1) -0.806* -1.002* -1.008** -0.166*** -0.145** -0.145**(0.460) (0.505) (0.489) (0.0530) (0.0581) (0.0585)
Agent’s Belief (Control=1) -1.419*** -1.414*** -1.228*** -0.186** -0.186** -0.186**(0.500) (0.485) (0.445) (0.0723) (0.0718) (0.0717)
Transfer (Control=0) no yes yes no yes yes
[Transfer (Control=0)]2 no no yes no no yes
N 97 97 97 97 97 97
Notes: Standard errors are in parentheses. All columns report results of OLS regressions. We restrictthe sample to agents that transfer more than 1 when not being controlled. Columns (1) - (3): dependentvariable is the individual difference between transfers under no control and under control. Columns (4) -(6): dependent variable is the individual difference between transfers under no control and under controldivided by transfers under no control. Standard errors are clustered at the individual level.Level of significance: * p<0.10, ** p<0.05, *** p<0.01
effect, (2) trust effect, (3) and hostility effect, we can now decompose the diff-in-diff and
illustrate the relative importance of each of the three effects.18
Using these parameters, we get for the decomposition of the diff-in-diff:
Πw − Πb = (sb(0)− sw(0)) + [sw(> 1)− sb(> 1)]κ︸ ︷︷ ︸Prosocial Effect: 0.26
(2)
+ [sw(> 1)(1− bw)− sb(> 1)(1− bb)] γ︸ ︷︷ ︸Trust Effect: 0.59
− sb(> 1)δ︸ ︷︷ ︸Hostility Effect: -0.52
= 0.33
These calculations show that the effects are countervailing: while the “prosocial” and
18See section B.2 in the Appendix for the details of the calculations.
22

the “trust” effect make control more detrimental in a within-group setting, the “hostility”
that agents exhibit in a between-group matching has an influence in the opposite direction.
In total, the difference between the average effect of control in a within-group matching
and the average effect of control in a between-group matching is close to zero.19
4.2 Principals’ Behavior
We now turn to principals’ decision to control:
Result 8: The majority of principals does not control.
On average, 28% of principals control the agent. So, similar to Falk and Kosfeld
(2006) we find that a substantial share of principals controls the agents even though the
majority of principals does not control.20
Result 9: Group identity affects principals’ decisions: More principals control in a
between-group matching.
Principals’ decision to control is influenced by group identity. The share of princi-
pals who control is 37% in a between-group and 18% in within-group interactions. The
difference is statistically significant (Fisher’s exact test, p<0.03).
From an income maximization perspective principals do not behave optimally as not
controlling is the best choice (on average). Note, however, that half of these subjects
who control (wrongly) believe that agents will transfer 1 or less. Their behavior there-
fore is consistent with income maximization given their (incorrect) beliefs about agents’
behavior. Also note that group identity affects the distribution of principals who expect
19Also note that the estimated diff-in-diff of 0.33 seem to match the actual diff-in-diff of 0.28 quite welldespite the set of simplifying assumptions used in Section 3.
20In treatment C5 (table 3, p. 1621) they observe that a fraction of 0.26 of principals controls theagent.
23

low transfers. Around 18% (5%) of principals expect a transfer not larger than 1 in a
between-group (within-group) matching.
5 Conclusions
While we know that incentive systems and particular control mechanisms designed for
selfish individuals may not be effective but can backfire, little is known about when the
“hidden costs of control” are particularly severe. In this paper we test whether the social
relationship between the principal and agent, i.e., whether they share the same group
identity, affects the impact of control on the performance provided by the agents.
The results confirm that agents react negatively to control. While the overall effect
of control is the same when agent and principal belong to the same group and when they
belong to different groups, the mechanisms which trigger the hidden costs of control are
distinct and do depend on group identity. In general, agents react more negatively when
they expect principals not to control. When agent and principal share the same group
identity, agents are more likely to expect not to be controlled leading to crowding out.
When agent and principal belong to different groups, the hidden costs of control are due
to a different mechanism. Holding agent’s belief constant, agents interpret controlling
from an out-group principal more ‘hostile’ and as a consequence reduce their transfers
to the principals. In the end, control has ‘hidden costs of control’ in both in-group and
out-group matching – but for different reasons.
The results have important implications. First, many principal-agent interactions are
between individuals from different ethnic, racial or religious groups, or between different
firms or, within the same firm, between workers belonging to different departments or with
different responsibilities and wages. Our findings suggest that delegation schemes and
24

mechanisms based on trust could be efficient also in such interactions and not necessarily
only when principals and agents have close social ties.
Secondly, we isolate two different mechanisms through which control devices have
detrimental effects on individual performance. We believe this may help further our
understanding of the general conditions under which incentives have the potential to
be detrimental and of the factors that are likely to determine the size of the “hidden
costs” of incentives. Moreover, the group-specific mechanisms for how control is perceived
indicate that it is important to take group structures into account when designing optimal
incentive schemes. As suggested by Akerlof and Kranton (2005), group identity does affect
principal-agent relationships and the way incentives work. Whether the principal and the
agent share the same identity, i.e., are in-group members, changes in important ways how
incentive and control mechanisms are perceived.
Future work should extend this line of research to investigate the impact of group
identity on other aspects of principal-agent relations, for example hold-up problems. Ad-
ditionally, while control can be understood as a special form of an incentive scheme, future
research should test the effect of group identity for many different incentive systems, like
bonuses or penalties.
References
Akerlof, George and Rachel Kranton, “Identity and the Economics of Organiza-tions,” Journal of Economic Perspectives, 2005, 19, 9 – 32.
Allison, Scott T. and David M. Messick, “The Group Attribution Error,” Journalof Experimental Social Psychology, 1985, 21 (6), 563–579.
Bandiera, Oriana, Iwan Barankay, and Imran Rasul, “Social Connections andIncentives in the Workplace: Evidence from Personnel Data,” Econometrica, 2009, 77(4), 1047–1094.
, , and , “Social Incentives in the Workplace,” Review of Economic Studies, 042010, 77 (2), 417–458.
25

Bernhard, Helen, Ernst Fehr, and Urs Fischbacher, “Group Affiliation and Altru-istic Norm Enforcement,” The American Economic Review, 2006, 96 (2), 217–221.
Bohnet, Iris and Bruno S. Frey, “Social Distance and Other-Regarding Behavior inDictator Games: Comment,” The American Economic Review, 1999, 89 (1), 335–339.
Brandts, Jordi and Gary Charness, “The Strategy versus the Direct-ResponseMethod: A First Survey of Experimental Comparisons,” Experimental Economics, Jan-uary 2011, 14 (3), 375–398.
Charness, Gary, Luca Rigotti, and Aldo Rustichini, “Individual Behavior andGroup Membership,” The American Economic Review, 2007, 97 (4), 1340–52.
, Ramon Cobo-Reyes, Natalia Jimenez, Juan Lacomba, and Francisco La-gos, “The Hidden Advantages of Delegation: Pareto-Improvements in a Gift-ExchangeGame,” The American Economic Review, May 2011, 102 (5), 2358–79.
Chen, Roy and Yan Chen, “The Potential of Social identity for Equilibrium Selection,”The American Economic Review, 2011, 101 (6), 2562–2589.
Chen, Yan and Sherry Xin Li, “Group Identity and Social Preferences,” The AmericanEconomic Review, 2009, 99 (1), 431–457.
Dickinson, David and Marie-Claire Villeval, “Does Monitoring Decrease Work Ef-fort? The Complementarity Between Agency and Crowding-Out Theories,” Games andEconomic Behavior, 2008, 63 (1), 56–76.
Dufwenberg, Martin and Astrid Muren, “Generosity, Anonymity, Gender,” Journalof Economic Behavior and Organization, 2006, 61 (1), 42–49.
Eckel, Catherine C. and Philip J. Grossman, “Managing Diversity by CreatingTeam Identity,” Journal of Economic Behavior & Organization, 2005, 58 (3), 371–392.
Ellingsen, Tore and Magnus Johannesson, “Pride and Prejudice: The Human Sideof Incentive Theory,” The American Economic Review, 2008, 98 (3), 990–1008.
Falk, Armin and Christian Zehnder, “Discrimination and In-Group Favoritism in aCitywide Trust Experiment,” Mimeo, 2007.
and Michael Kosfeld, “The Hidden Cost of Control,” The American EconomicReview, 2006, 96 (5), 1611–30.
Fehr, Ernst, Alexander Klein, and Klaus Schmidt, “Fairness and Contract Design,”Econometrica, 2007, 75 (1), 121–154.
and Armin Falk, “Psychological Foundations of Incentives,” European EconomicReview, 2002, 46, 287–324.
26

and Bettina Rockenbach, “Detrimental Effects of Sanctions on Human Altruism,”Nature, 2003, 422 (6928), 137–140.
and John A. List, “The Hidden Costs and Returns of Incentives - Trust and Trust-worthiness among CEOs,” Journal of the European Economic Association, 2004, 2 (5),743–71.
Fershtman, Chaim and Uri Gneezy, “Discrimination in a Segmented Society: AnExperimental Approach,” Quarterly Journal of Economics, 2001, 116 (1), 351–377.
Fischbacher, Urs, “z-Tree: Zurich Toolbox for Ready-Made Economic Experiments,”Experimental Economics, 2007, 10 (2), 171–178.
Frey, Bruno S., “Does Monitoring Increase Work Effort? The Rivalry with Ttrust andLoyalty,” Economic Inquiry, 1993, 31 (4), 663–670.
and Reto Jegen, “Motivation Crowding Theory: A Survey of Empirical Evidence,”Journal of Economic Surveys, 2001, 5 (5), 589–611.
Gachter, Simon, Esther Kessler, and Manfred Konigstein, “Do Incentives DestroyVoluntary Cooperation?,” Working Paper, 2010.
Gneezy, Uri and Aldo Rustichini, “Pay Enough or Don’t Pay at All,” QuarterlyJournal of Economics, 2000, pp. 791 – 810.
, Stephan Meier, and Pedro Rey-Biel, “When and Why Incentives (Don’t) Workto Modify Behavior,” Journal of Economic Perspectives, 2011, 25 (4).
Gotte, Lorenz, David Huffman, and Stephan Meier, “The Impact of Group Mem-bership on Cooperation and Norm Enforcement: Evidence using Random Assignmentto Real Social Groups,” The American Economic Review, 2006, 96 (2), 212 – 216.
, , and , “The Impact of Social Ties on Group Interactions: Evidence from MinimalGroups and Randomly Assigned Real Groups,” American Economic Journal: Microe-conomics, 2012, 4 (1), 101–15.
, , , and Matthias Sutter, “Competition Between Organizational Groups: ItsImpact on Altruistic and Anti-Social Motivations,” Management Science, 2012, 58 (5),948–960.
Greiner, Ben, “The Online Recruitment System ORSEE 2.0 - A Guide for the Organiza-tion of Experiments in Economics,” Working Paper Series in Economics 10, Universityof Cologne, Department of Economics June 2004.
Hastie, Reid, “Social Inference,” Annual Review of Psychology, 1983, 34 (1), 511–542.
Hewstone, Miles, Mark Rubin, and Hazel Willis, “Intergroup Bias,” Annual Reviewof Psychology, 2002, 53, 575 – 604.
27
Heyman, James and Dan Ariely, “Effort for Payment: A Tale of Two Markets,”Psychological Science, 2004, 15 (11), 787–93.
Kessler, Judd and Stephen Leider, “Finding the Hidden Cost of Control,” WorkingPaper, 2012.
Kogut, Bruce and Udo Zander, “What Firms Do? Coordination, Identity, and Learn-ing,” Organization Science, 1996, 7 (5), 502–518.
Lazear, Edward P., “Performance Pay and Productivity,” The American EconomicReview, December 2000, 90 (5), 1346–1361.
Siemens, Ferdinand Von, “Intention-Based Reciprocity and the Hidden Costs of Con-trol,” Working Paper, 2011.
Sliwka, Dirk, “Trust as a Signal of a Social Norm and the Hidden Costs of IncentiveSchemes,” The American Economic Review, 2007, 97 (3), 999–1012.
Sutter, Matthias, “Individual Behavior and Group Membership: Comment,” TheAmerican Economic Review, 2009, 99 (5), 2247–57.
Tajfel, Henri, “Social Psychology of Intergroup Relations,” Annual Review of Psychol-ogy, 1982, 33 (1), 1–39.
and J. C. Turner, “An Integrative Theory of Intergroup Conflict,” in W. G. Austinand S. Worchel, eds., The Social Psychology of Intergroup Relations, Brooks/Cole, 1979,pp. 34–47.
Tremewan, James, “Group Identity and Coalition Formation: Experiments in One-shotand Repeated Games,” Working Paper, 2010.
Ziegelmeyer, Anthony, Katrin Schmelz, and Matteo Ploner, “Hidden Costs ofControl: Four Repetitions and an Extension,” Experimental Economics, June 2012, 15(2), 323–340.
28

Appendix
A Descriptive Statistics
Table A1: Agents’ Behavior by Matching
In-Group Matching
mean sd median min max NTransfer if Control=0 6.140625 5.811503 6 0 24 64Transfer if Control=1 4.90625 5.764475 4 1 24 64Agent’s Belief (Control=1) .265625 .4451569 0 0 1 64
Out-Group Matching
mean sd median min maxTransfer if Control=0 3.46875 3.771105 2 0 18 64Transfer if Control=1 2.515625 2.63669 1 1 15 64Agent’s Belief (Control=1) .671875 .4732424 1 0 1 64
Table A2: Principals’ Behavior by Matching
In-Group Matching
mean sd median min max NDecision (Control=1) .1875 .3933979 0 0 1 64
Out-Group Matching
mean sd median min max NDecision (Control=1) .375 .48795 0 0 1 64
29

B For Online Publication
B.1 Derivation of Equation 1
The crowding out effect for matching m is:
Πm = −sm(0) + sm(> 1) [bmπ(m, c) + (1− bm)π(m,n)] (3)
Using π(w, c) = κ and π(w, n) = κ+ γ, we get in a within group matching:
Πw = −sw(0) + sw(> 1) [bwπ(w, c) + (1− bw)π(w, n)]
= −sw(0) + sw(> 1) [bwκ+ (1− bw)(κ+ γ)]
= −sw(0) + sw(> 1) [κ+ (1− bw)γ] (4)
Using π(b, c) = κ+ δ and π(b, n) = κ+ γ + δ, we can derive the crowding out effectin a between group matching:
Πb = −sb(0) + sb(> 1) [bbπ(b, c) + (1− bb)π(b, n)]
= −sb(0) + sb(> 1) [bb(κ+ δ) + (1− bb)(κ+ δ + γ)]
= −sb(0) + sb(> 1) [κ+ δ + (1− bb)γ] (5)
Lastly, substracting 5 from 4 yields
Πw − Πb = (sb(0)− sw(0)) + [sw(> 1)− sb(> 1)]κ︸ ︷︷ ︸Prosocial Effect
(6)
+ [sw(> 1)(1− bw)− sb(> 1)(1− bb)] γ︸ ︷︷ ︸Trust Effect
− sb(> 1)δ︸ ︷︷ ︸Hostility Effect
B.2 Calibration of the Model
We now turn to the decomposition of the diff-in-diff as described in section 3. In TableB1, we regressed the individual crowding out on agent’s beliefs and matching for agentswho transfer more than 1 under no control. This allows us to identify κ, γ, and δ. Theregression (see Table B1) delivers the following parameter values:
30

• π(w, c) = κ=2.71-1.41-0.8=0.5
• π(w, n) = κ+ γ =2.71-0.8=1.91
• π(b, c) = κ+ δ =2.71-1.41=1.3
• π(b, n) = κ+ δ + γ =2.71
Hence, γ = 1.41 and δ = 0.8. From above we already have sb(0) = 0.28, sb(> 1) =0.66, sw(0) = 0.12, sw(> 1) = 0.86, bb = 0.57 bw = 0.18. Using these parameters, we getfor the decomposition of the diff-in-diff:
Πw − Πb = (sb(0)− sw(0)) + [sw(> 1)− sb(> 1)]κ +[sw(> 1)(1− bw)− sb(> 1)(1− bb)] γ − sb(> 1)δ
= 0.16 + (0.86− 0.66) ∗ 0.5 + (0.86 ∗ 0.82− 0.66 ∗ 0.43) ∗ 1.4− 0.66 ∗ 0.8
=0.26 (Prosocial Effect) + 0.59 (Trust Effect) - 0.52 (Hostility Effect)
= 0.33
Table B1: Crowding out of Agents’ Transfers
Dependent Variable: Transfer (1)Within-group matching (=1) -0.806*
(0.460)
Agent’s Belief (Control=1) -1.419***(0.500)
Constant 2.716***(0.558)
N 97
Notes: Standard errors are in parentheses. Table re-port results of OLS regression. Dependent variableis the individual difference between transfers undercontrol and under no control. We restrict the sampleto agents that transfer more than 1 when not beingcontrolled. Standard errors are clustered at the in-dividual level.Level of significance: * p<0.10, ** p<0.05, ***p<0.01
31

B.3 Robustness Dictator Game
32

Table
B2:
Age
nts
’T
ransf
er-
No-
Dic
tato
ran
dD
icta
tor
Tre
atm
ent
Dep
enden
tV
aria
ble
:T
ransf
er(1
)(2
)(3
)(4
)(5
)(6
)C
ontr
ol(=
1)-1
.094
***
-0.9
53**
*-0
.813
***
-0.8
44**
-1.3
75**
*-1
.063
**(0
.242
)(0
.291
)(0
.270
)(0
.315
)(0
.402
)(0
.498
)
Wit
hin
-gro
up
mat
chin
g(=
1)2.
531*
**2.
672*
**1.
469*
1.43
8*3.
594*
**3.
906*
**(0
.663
)(0
.699
)(0
.747
)(0
.775
)(1
.081
)(1
.144
)
Con
trol
xW
ithin
-gro
up
-0.2
810.
0625
-0.6
25(0
.314
)(0
.276
)(0
.567
)
Con
stan
t3.
539*
**3.
469*
**3.
422*
**3.
438*
**3.
656*
**3.
500*
**(0
.444
)(0
.474
)(0
.618
)(0
.634
)(0
.651
)(0
.723
)N
256
256
128
128
128
128
Note
s:S
tan
dar
der
rors
are
inp
are
nth
eses
.A
llco
lum
ns
rep
ort
resu
lts
of
OL
Sre
gre
ssio
ns.
We
rest
rict
the
sam
ple
toagen
tsth
at
tran
sfer
more
than
1w
hen
not
bei
ng
contr
olled
.L
evel
of
sign
ifica
nce
:*
p<
0.1
0,
**
p<
0.0
5,
***
p<
0.0
1
33

Table B3: Agents’ Crowding Out - No-Dictator and Dictator Treatment
Dependent Variable: Diff (1) (2) (3)Within-group matching (=1) -0.806* -0.893 -0.807*
(0.460) (0.842) (0.409)
Agent’s Belief (Control=1) -1.419*** -2.040** -0.907*(0.500) (0.840) (0.478)
Constant 2.716*** 3.474*** 2.086***(0.558) (1.007) (0.455)
N 97 48 49
Notes: Standard errors are in parentheses. All columns report results ofOLS regressions.Level of significance: * p<0.10, ** p<0.05, *** p<0.01
B.4 Robustness Full Sample
In this section, we reproduce our estimation of Table 2 including the full sample. Thatis, also subjects who exhibit a transfer of zero or one when not being controlled are nowincluded in the estimation. Clearly, from our discussion of the behavioral model in section3 this inclusion is not adequate in the light of our proposed explanation of crowding out.By definition, we can only observe crowding out when subjects transfer more than 1.21
Moreover, trust as well as hostility can only play a role for subjects for whom we observecrowding out. Nevertheless, we present these results here to show the robustness of ourestimations and graphs presented in the main text.
Comparing Table B4 to Table 2, it becomes evident that results are very similar.The only difference appears in specification (1): When the full sample is included, thecoefficient of the matching dummy (Within-group matching (=1)) changes to -0.4 and isnot significant anymore. Once we control for the transfer, the size as well as significanceof this coefficient is restored. The difference is to be expected as in a between-groupmatching a disproportional share of subjects transfers zero or one thereby exhibitingno or even negative crowding out. This obviously upwards biases the estimator of thematching dummy.
21For subjects who transfer zero when not being controlled crowding out can actually be negative asthose subjects are pushed to a transfer of at least one. That is also why, when we control for agents whobelieve to be controlled in a within-group matching, we observe aggregate crowding out of zero (FigureB2).
34

Notes: The figure depicts average individual beliefs about beingcontrolled as a function of matching.
Figure B1: Average Beliefs about Principal’s Decision to Control
35

Notes: The figure depicts average crowding out, i.e., transfers underno control - transfers under control, as a function of agents’s beliefsand matching.
Figure B2: Average Crowding Out Depending on Agents’ Beliefs and Matching
36

Table B4: Agents’ Crowding-Out - all subjects
Dependent Variable: Diff Diff Diff Fraction Fraction Fraction(1) (2) (3) (4) (5) (6)
Within-group matching (=1) -0.421 -0.773* -0.801** -0.153*** -0.145** -0.148**(0.396) (0.395) (0.393) (0.0530) (0.0596) (0.0594)
Agent’s Belief (Control=1) -1.729*** -1.467*** -0.965*** -0.214** -0.215*** -0.195**(0.454) (0.397) (0.352) (0.0804) (0.0804) (0.0796)
Transfer (Control=0) 0.172** 0.633*** -0.00374 0.0355(0.0697) (0.102) (0.00652) (0.0319)
[Transfer (Control=0)]2 -0.0223*** -0.00168(0.00398) (0.00116)
N 128 128 128 102 102 102
Notes: Standard errors are in parentheses. All columns report results ofOLS regressions. Dependent variable is the individual difference betweentransfers under control and under no control.Level of significance: * p<0.10, ** p<0.05, *** p<0.01
37

B.5 Instructions
38

p 1
This is the English translation of the instructions (original in German). Instructions of part I were
displayed directly on screen; instructions of part II were handed out. Beginning at the 11th
screen,
the participant had a banner displaying the group she belonged to at the top of every screen, which
is not displayed here. The instructions of part I are based on the instructions of Chen and Li (2009).
The instructions of part II are based on the instructions of Falk and Kosfeld (2006).
Part I
[1st screen]
You are now participating in an economic experiment. The income you can earn in the course
of this experiment depends on your decisions and the other participants‘ decisions. The
experiment consists of two parts and <no of participants> persons take part.
During the experiment, your income will be denoted in points. Your final income consists of
the income you earn in the two parts of the experiment. At the end of the experiment, you will
be paid out in cash. Please note that:
2 points = 1 € .
All decisions will be made anonymously. At the end of the experiment, each participant will
be paid out in private.
If you have any questions, please ask for assistance. Your question will be answered at your
workplace. Please do not talk to any of the other participants during the experiment.
[2nd
screen]
In Part 1 everyone will be shown 5 pairs of paintings by two artists. The paintings were
created by two distinct painters. Each pair of paintings consists of one painting being made by
each artist. For each pair, please choose the painting you prefer. According to the paintings
you and the other participants choose, you (and the other participants) will be classified into
two equally large groups.
The participants you are grouped with will be the same for the rest of the experiment.
After Part 1 has finished, you will be given further instructions.
[3rd
screen]
Now, please choose which painting you prefer by clicking on one of the buttons.
After everyone has submitted answers, you will be privately informed of which group you are
in.
[4th
to 9th
screen]
Pair #: Please select which painting you prefer
<Picture 1> <Picture 2>
I prefer this painting I prefer this painting
[10th
screen]

p 2
You are assigned to the < "Kandinsky" - "Klee" > group.
The number of people in your own group is <Number of Group Members> .
[11th
screen]
You will now receive two more paintings (painting #6 and #7) and 3 skill questions. Please
select the artist who you think created the paintings and answer the skill questions as best as
you can, respectively. The correct answers of a group will be summed up and divided by the
number of group members. The group which achieves the highest average will receive a prize
of 16 points per group member. That is, each member of this group will receive an additional
payment of 16 points at the end of the experiment. The other group obtains no payment.
In the case of a tie, the computer will randomly determine one group which receives the prize.
You will be informed of which group received the prize at the end of the experiment.
Meanwhile, you can use a group chat program to get help from or offer help to other members
in your own group. Except for the following restrictions, you can type whatever you want in
the lower box of the chat program. Messages will be shared among all the members from your
own group. You will not be able to see the messages exchanged among the other group.
People in the other group will not see the messages from your own group either.
Restrictions on messages
1. Please do not identify yourself or send any information that could be used to identify you
(e.g. age, subject, sex, etc.).
2. Please refrain from using obscene or offensive language.
[12th
screen]
<Picture 6> This painting is by <“Klee“> is by <“Kandinsky“>
<Picture 7> This painting is by <“Klee“> is by <“Kandinsky“>
Type your comments below then press Enter
<Chat Box>
[13th
screen]
Question 1: What was the inflation rate in Germany in 2010 (in %)?
Question 2: What was the budget of the German Department of Defense in 2007 (in Million
EUR)?
Question 3: How many members does the current federal cabinet of Germany (as of June
2011) have?
Answer 1: The inflation in Germany in 2010 was a) 1.1 % b) 1.8 % c) 2.1 %
Answer 2: The federal budget was a) 24 519 b) 27 578 c) 31 560
Answer 3: The current cabinet comprises (June 2011) the following number of members
a) 13 b) 16 c) 17

p 3
Type your comments below then press Enter
<Chat Box>
[14th
screen]
You have finished part I of the experiment. As soon as all participants have completed part I,
the experiment continues.

p 1
Part II
This part of the experiment comprises two rounds. You can earn points in both rounds. As
before it holds that:
2 points = 1 Euro
Your final income in part II will be determined by one of these rounds. The round
determining your income will be randomly drawn by the computer at the end of the
experiment. It is the same round for each participant.
At the beginning of part II, the computer will randomly draw each participant either as
participant A or as participant B. This assignment will be kept the same during part II.
That is, a participant is either participant A or participant B during the two rounds.
In both rounds, two participants A and B are randomly associated.
In the second round, each participant A will be associated with another participant B than in
the first round.
Hence, the association is such that the same participants A and B will never be associated
twice.
No participant knows with whom he is associated meaning that all decisions are made
anonymously. Yet, each participant knows the group membership of the participant he is
associated with.
At the beginning of each round, participant A receives an amount of 24 points. Participant B
receives no points.
Participant A's decision:
Participant A can decide how many points he wants to transfer to participant B. The
experimenter triples each point which A transfers to B. Thus, each point which A transfers to
B reduces A's income by one point and increases B's income by three points.
The formula for calculating income is as follows:
Participant A's income: 24 - transfer
Participant B's income: 0 + 3*transfer

p 2
The following examples will clarify the income formulas:
Example 1: A transfers 0 points to B. The incomes are then 24 for A and 0 for B.
Example 2: A transfers 4 points to B. The incomes are then 20 for A and 12 for B.
Example 3: A transfers 16 points to B. The incomes are then 8 for A and 48 for B.
Participant B's decision:
Before A decides how many points he wishes to transfer to B, B can determine a minimum
transfer. In particular, B can constrain his associated participant A to transfer him at least 1
point. However, he can also decide not to limit participant A and thus leave his transfer
decision completely free.
Therefore, there are two cases:
Case 1: Participant B constrains participant A to transfer at least 1 point to him. In this case,
participant A can transfer any (integer) amount between 1 and 24 to B.
Case 2: Participant B allows participant A to decide on his transfer freely and does not
constrain him to transfer at least 1 point to him. In this case, participant A can transfer any
(integer) amount between 0 and 24 to B.
Therefore, the experiment consists of two stages:
Stage 1:
In stage 1, B decides if he will constrain A to transfer at least 1 point to him, or if he will
allow A to decide freely.
Stage 2:
In stage 2, A decides which amount he will transfer to B. This amount lies
between 1 and 24, if B constrains A to transfer at least 1 point;
or
between 0 and 24, if B does not constrain A to transfer at least 1 point.
The round is completed as soon as A has decided how many points he will transfer to B.
A and B will make their entries with the help of a computer monitor.

p 3
Please note: Participant A must decide which amount he will transfer to B before he knows
whether or not B will constrain him to transfer at least 1 point. This means that A has to
make two decisions. A can make his entries with the help of this monitor:
Therefore, A indicates how many points he transfers to B when B constrains him to transfer at
least 1 point (case 1) and how many points he will transfer when he is free to decide (case 2).
Which of the decisions is relevant for A depends on what B decides. If he constrains A to
transfer at least 1 point, the decision A gives under case 1 applies. If he leaves A free in his
decision, the point amount which A indicates under case 2 applies.
A final income monitor will inform you of the randomly drawn round and the resulting
incomes.
At the end of the experiment, your point income of the randomly drawn round will be
converted to EUR. This amount will be paid out to you in cash. If you belong to the group
which won the prize in the first part of the experiment, you will be paid out this prize in
addition.
Do you have any questions?
Please solve the following control questions. They have no consequence on your income and
only serve to check if all participants in the experiment have understood the rules.

p 4
Question 1: Assume that participant B allows A to decide freely. A transfers 4 points. What
are the incomes?
Income for A:
Income for B:
Question 2: Assume that participant B constrains A to transfer at least 1 point. A transfers 1
point. What are the incomes?
Income for A:
Income for B:
Question 3: Assume that participant B allows A to decide freely. A transfers 0 points. What
are the incomes?
Income for A:
Income for B:
Please raise your hand when you have solved the control questions.


![Robert Ainsworth - Columbia Economics · designing job assignment schemes or creating incentives to improve efficiency. “Perinatal Health among 1 Million Chinese-Americans” [submitted]](https://static.fdocuments.in/doc/165x107/5e785230b5432f58df587971/robert-ainsworth-columbia-economics-designing-job-assignment-schemes-or-creating.jpg)