Incas igarss final
8
Orbita Roswintiarti, Kustiyo, Arum Tjahyaningsih, Suzanne Furby, Jeremy Wallace Indonesia’s National Carbon Accounting Remote Sensing Program A National System for Monitoring Forest Changes
-
Upload
communications-iafcp -
Category
Documents
-
view
212 -
download
0
description
Indonesia's National Carbon Accounting System (INCAS) has been designed to meet national and international policy requirements. it is building a system for comprehensive monitoring of land use changes, and estimation of land based greenhouse gas emissions. Indonesia's forests are of global significance, and tropical forests are a major focus of initiatives such as REDD+. The INCAS remote sensing program is producing spatially-detailed annual wall-to-wall monitoring of forest cover changes from time series Landsat imagery for Indonesia
Transcript of Incas igarss final
Orbita Roswintiarti, Kustiyo, Arum Tjahyaningsih, Suzanne Furby, Jeremy Wallace
Indonesia’s National Carbon Accounting Remote Sensing Program A National System for Monitoring Forest Changes
Indonesia’s National Carbon Accounting Remote Sensing Program – A National System For Monitoring Forest Changes Page | 1
Copyright Information
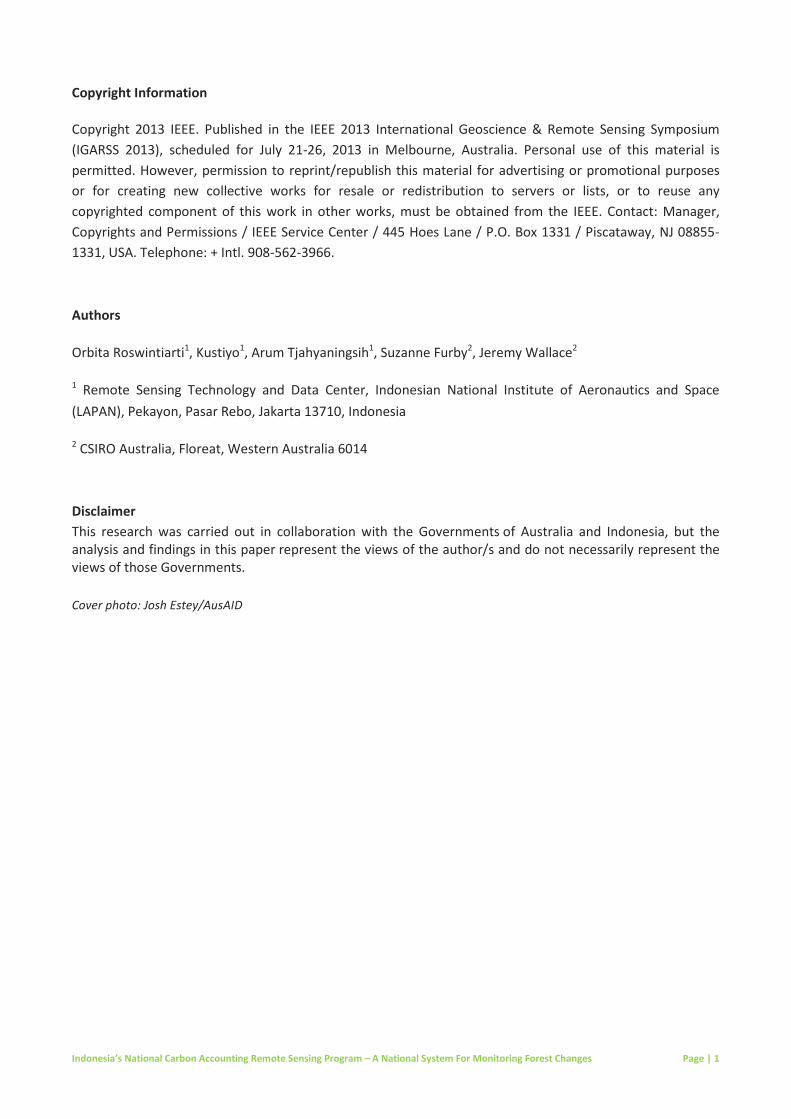
Copyright 2013 IEEE. Published in the IEEE 2013 International Geoscience & Remote Sensing Symposium (IGARSS 2013), scheduled for July 21-26, 2013 in Melbourne, Australia. Personal use of this material is permitted. However, permission to reprint/republish this material for advertising or promotional purposes or for creating new collective works for resale or redistribution to servers or lists, or to reuse any copyrighted component of this work in other works, must be obtained from the IEEE. Contact: Manager, Copyrights and Permissions / IEEE Service Center / 445 Hoes Lane / P.O. Box 1331 / Piscataway, NJ 08855-1331, USA. Telephone: + Intl. 908-562-3966. Authors
Orbita Roswintiarti1, Kustiyo1, Arum Tjahyaningsih1, Suzanne Furby2, Jeremy Wallace2
1 Remote Sensing Technology and Data Center, Indonesian National Institute of Aeronautics and Space (LAPAN), Pekayon, Pasar Rebo, Jakarta 13710, Indonesia
2 CSIRO Australia, Floreat, Western Australia 6014 Disclaimer This research was carried out in collaboration with the Governments of Australia and Indonesia, but the analysis and findings in this paper represent the views of the author/s and do not necessarily represent the views of those Governments. Cover photo: Josh Estey/AusAID
Indonesia’s National Carbon Accounting Remote Sensing Program – A National System For Monitoring Forest Changes Page | 2
ABSTRACT
Indonesia’s National Carbon Accounting System (INCAS) has been designed to meet national and international policy requirements. It is building a system for comprehensive monitoring of land use changes, and estimation of land-based greenhouse gas emissions. Indonesia’s forests are of global significance, and tropical forests are a major focus of initiatives such as REDD+. The INCAS remote sensing program is producing spatially-detailed annual wall-to-wall monitoring of forest cover changes from time series Landsat imagery for Indonesia. Index Terms—Forest Monitoring, Carbon Accounting, Multi-temporal Processing, Indonesia INTRODUCTION
Land use and forest change, in particular deforestation, have contributed the largest proportion of Indonesia’s estimated greenhouse gas emissions in recent years. Indonesia’s remaining forests store globally significant carbon stocks, as well as biodiversity values. As such Indonesia’s forests have been the subject of international attention including remote sensing projects to identify ‘hot-spots’ of deforestation activity, to estimate national rates of deforestation, and to map and estimate areas of change ([1] and [2]). For Indonesia, international programs such as REDD+ (Reducing Emissions from Deforestation and Forest Degradation Plus [3]) represent opportunities for economic incentives related to forest management for carbon sequestration. In 2010, the Government of Indonesia (GoI) commited to reducing its greenhous gas emissions by 26% and by 41% with international support. In 2010, after the signing of a Letter of Intent with Norway, the GoI entered into a REDD+ partnership. Among other activities the GoI imposed a two-year moratorium on all new forest concession licenses. A spatially detailed monitoring and reporting system for forest change which is national and operating in Indonesia is required for participation in such programs. It is also required for national policy reasons including Monitoring, Reporting, and Verification (MRV), carbon accounting, and land-use and policy information. Work on the Indonesian National Carbon Accounting System (INCAS) commenced in 2009, under the Indonesia-Australia Forest Carbon Partnership (IAFCP). A principal objective was to build an operational system in Indonesia through transfer of knowledge and experience, from Australia’s National Carbon Accounting System [4], and adaptation of this experience to Indonesia’s requirements and conditions. Broadly, INCAS consists of remote sensing and biomass components. The remote sensing component includes at this stage the annual land cover change analysis of change in forested area. The biomass component covers biomass classification, forest disturbance mapping, and carbon stock estimation. This paper will present technical elements and results of the INCAS remote sensing program which is designed to produce annual maps of national forest extent and change from Landsat imagery time series for the years of 2000-2012. The system has been built based on regional analyses, i.e. Kalimantan, Sumatra, Papua, Sulawesi, Java, Nusa Tenggara, and Maluku Islands, using nationally consistent methodology.
Indonesia’s National Carbon Accounting Remote Sensing Program – A National System For Monitoring Forest Changes Page | 3
DATA AND METHODS
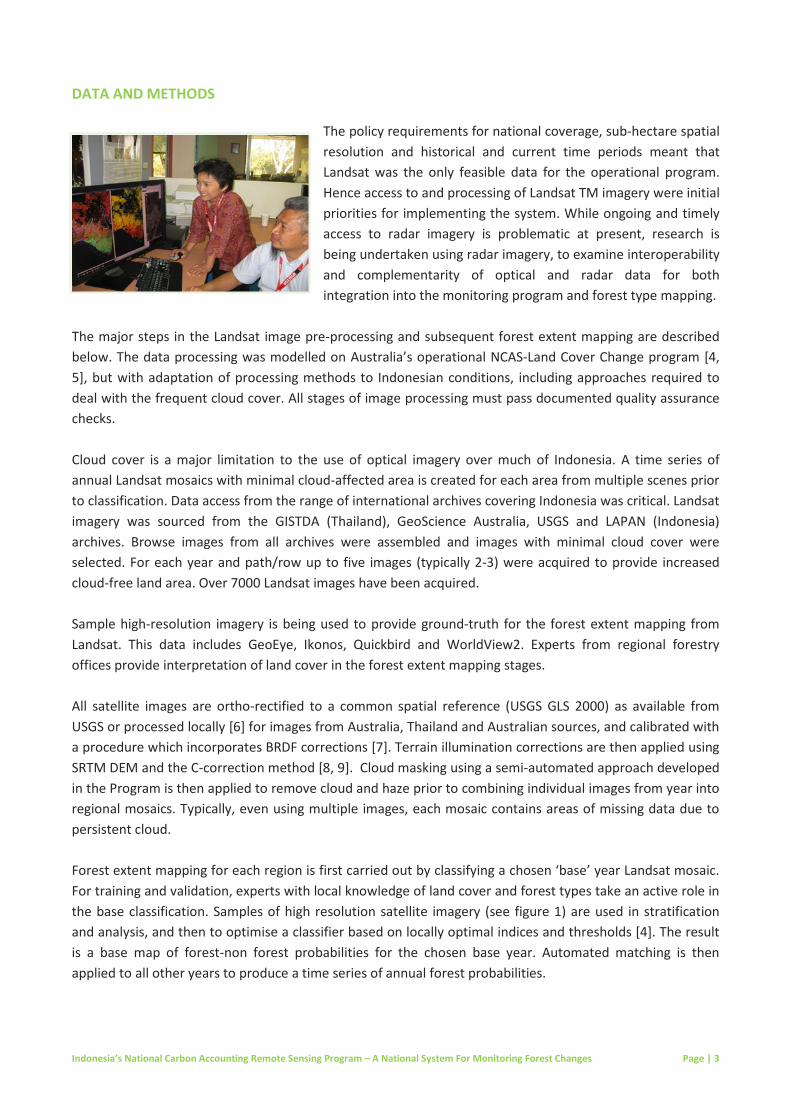
The policy requirements for national coverage, sub-hectare spatial resolution and historical and current time periods meant that Landsat was the only feasible data for the operational program. Hence access to and processing of Landsat TM imagery were initial priorities for implementing the system. While ongoing and timely access to radar imagery is problematic at present, research is being undertaken using radar imagery, to examine interoperability and complementarity of optical and radar data for both integration into the monitoring program and forest type mapping.
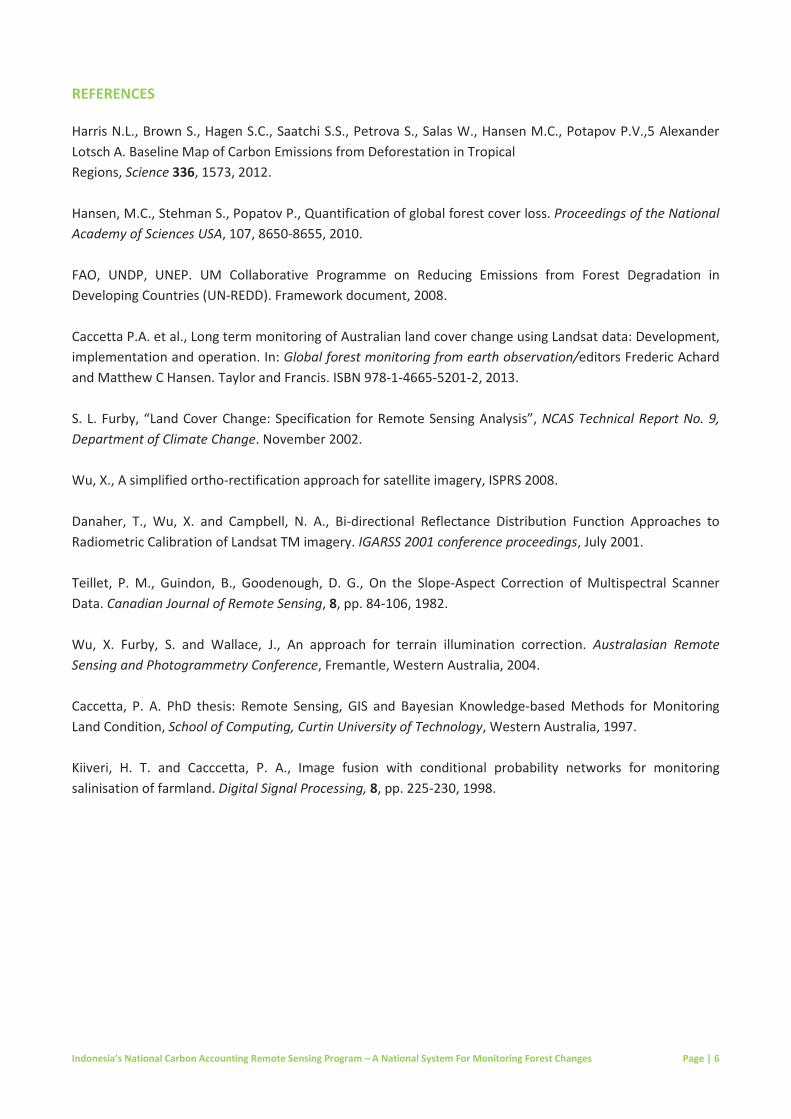
The major steps in the Landsat image pre-processing and subsequent forest extent mapping are described below. The data processing was modelled on Australia’s operational NCAS-Land Cover Change program [4, 5], but with adaptation of processing methods to Indonesian conditions, including approaches required to deal with the frequent cloud cover. All stages of image processing must pass documented quality assurance checks. Cloud cover is a major limitation to the use of optical imagery over much of Indonesia. A time series of annual Landsat mosaics with minimal cloud-affected area is created for each area from multiple scenes prior to classification. Data access from the range of international archives covering Indonesia was critical. Landsat imagery was sourced from the GISTDA (Thailand), GeoScience Australia, USGS and LAPAN (Indonesia) archives. Browse images from all archives were assembled and images with minimal cloud cover were selected. For each year and path/row up to five images (typically 2-3) were acquired to provide increased cloud-free land area. Over 7000 Landsat images have been acquired. Sample high-resolution imagery is being used to provide ground-truth for the forest extent mapping from Landsat. This data includes GeoEye, Ikonos, Quickbird and WorldView2. Experts from regional forestry offices provide interpretation of land cover in the forest extent mapping stages. All satellite images are ortho-rectified to a common spatial reference (USGS GLS 2000) as available from USGS or processed locally [6] for images from Australia, Thailand and Australian sources, and calibrated with a procedure which incorporates BRDF corrections [7]. Terrain illumination corrections are then applied using SRTM DEM and the C-correction method [8, 9]. Cloud masking using a semi-automated approach developed in the Program is then applied to remove cloud and haze prior to combining individual images from year into regional mosaics. Typically, even using multiple images, each mosaic contains areas of missing data due to persistent cloud. Forest extent mapping for each region is first carried out by classifying a chosen ‘base’ year Landsat mosaic. For training and validation, experts with local knowledge of land cover and forest types take an active role in the base classification. Samples of high resolution satellite imagery (see figure 1) are used in stratification and analysis, and then to optimise a classifier based on locally optimal indices and thresholds [4]. The result is a base map of forest-non forest probabilities for the chosen base year. Automated matching is then applied to all other years to produce a time series of annual forest probabilities.
Indonesia’s National Carbon Accounting Remote Sensing Program – A National System For Monitoring Forest Changes Page | 4
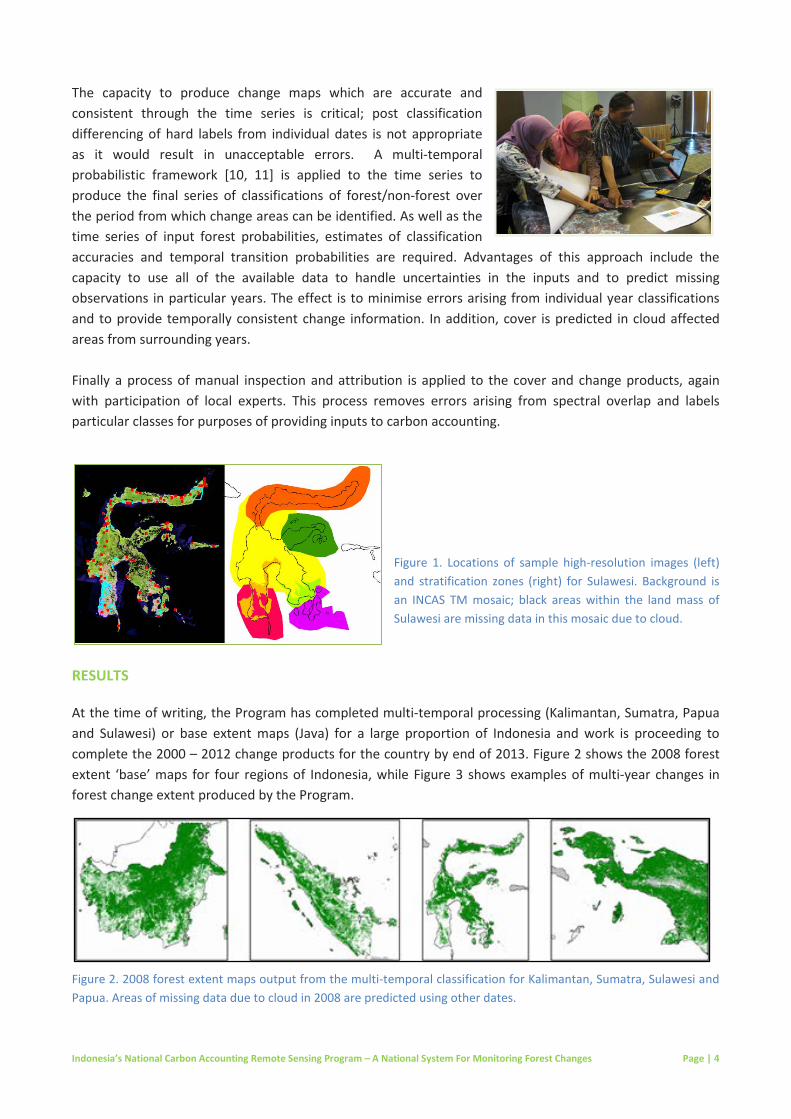
The capacity to produce change maps which are accurate and consistent through the time series is critical; post classification differencing of hard labels from individual dates is not appropriate as it would result in unacceptable errors. A multi-temporal probabilistic framework [10, 11] is applied to the time series to produce the final series of classifications of forest/non-forest over the period from which change areas can be identified. As well as the time series of input forest probabilities, estimates of classification accuracies and temporal transition probabilities are required. Advantages of this approach include the capacity to use all of the available data to handle uncertainties in the inputs and to predict missing observations in particular years. The effect is to minimise errors arising from individual year classifications and to provide temporally consistent change information. In addition, cover is predicted in cloud affected areas from surrounding years. Finally a process of manual inspection and attribution is applied to the cover and change products, again with participation of local experts. This process removes errors arising from spectral overlap and labels particular classes for purposes of providing inputs to carbon accounting.
Figure 1. Locations of sample high-resolution images (left) and stratification zones (right) for Sulawesi. Background is an INCAS TM mosaic; black areas within the land mass of Sulawesi are missing data in this mosaic due to cloud.
RESULTS
At the time of writing, the Program has completed multi-temporal processing (Kalimantan, Sumatra, Papua and Sulawesi) or base extent maps (Java) for a large proportion of Indonesia and work is proceeding to complete the 2000 – 2012 change products for the country by end of 2013. Figure 2 shows the 2008 forest extent ‘base’ maps for four regions of Indonesia, while Figure 3 shows examples of multi-year changes in forest change extent produced by the Program. Figure 2. 2008 forest extent maps output from the multi-temporal classification for Kalimantan, Sumatra, Sulawesi and Papua. Areas of missing data due to cloud in 2008 are predicted using other dates.

Indonesia’s National Carbon Accounting Remote Sensing Program – A National System For Monitoring Forest Changes Page | 5
The timing, location and area of forest clearing and reforestation are primary outputs and required inputs for greenhouse gas (GHG) modeling. The forest extent change maps (Figure 3) are used together with biomass and growth information in carbon modeling for GHG emissions estimates. The maps can also be used to inform discussion on land use, policy impact and environmental issues. The region of central and southern Kalimantan shown in Figure 3(b) is one of the ‘transmigration’ regions where extensive areas of wetland forest have been cleared and drained since 1996 for resettlement and agricultural activities. The products show where and when clearing has occurred since 2000, and also identify areas and timing of reforestation events. The Riau Province of Sumatra (Figure 3(a)) is a region of major forest loss and land use change. It was also a transmigration destination. More recently, extensive areas of natural forest have been cleared for oil palm plantations. As well as the forest carbon implications, this forest loss has biodiversity and habitat impacts. The processed Landsat imagery and mosaics, high resolution imagery, forest extent and change products are distributed to multiple agencies in Indonesia.
Figure 3. Forest extent and change for 2000-2009 for two regions. (a) Riau Province in Sumatra [approximate area shown is 420km by 290km]; and (b) Central and south Kalimantan [100km by 140km]; dark grey areas indicate constant forest cover; non-grey colours indicate clearing (hot colours) and reforestation (cool colours) at different dates within the decade; bright blue indicates clearing following by reforestation.
DISCUSSION
In this paper we have described the systematic processing of Landsat data which is being conducted to produce annual forest extent and change maps for Indonesia for the period 2000-2012. While the main purpose of this activity is the ability to develop a reliable and operational forest monitoring system in Indonesia for its national carbon accounting system, it has wider benefits in supporting Indonesia’s greenhouse gas inventories, MRV institution, and national communications. At local and regional levels, reliable and consistent information on historic forest changes at is required for REDD+ baselines, and for assessing policy impacts into the future. The INCAS cloud-screened mosaic images are also being used for land use planning, forest management. Satellite reception and archiving capacities in Indonesia have increased during the period of INCAS development; it is anticipated that the program will continue with the use of Landsat 8 and possibly other optical data streams. It is also planned to extend the historic monitoring to include the period 1990 to 1999 using Landsat imagery and the current processing methods. The 1990’s were years of major policy-driven land use change in some provinces and consistent information on historic changes from this period is of wide interest.
Figure 3(a) Figure 3(b)
Indonesia’s National Carbon Accounting Remote Sensing Program – A National System For Monitoring Forest Changes Page | 6
REFERENCES
Harris N.L., Brown S., Hagen S.C., Saatchi S.S., Petrova S., Salas W., Hansen M.C., Potapov P.V.,5 Alexander Lotsch A. Baseline Map of Carbon Emissions from Deforestation in Tropical Regions, Science 336, 1573, 2012. Hansen, M.C., Stehman S., Popatov P., Quantification of global forest cover loss. Proceedings of the National Academy of Sciences USA, 107, 8650-8655, 2010. FAO, UNDP, UNEP. UM Collaborative Programme on Reducing Emissions from Forest Degradation in Developing Countries (UN-REDD). Framework document, 2008. Caccetta P.A. et al., Long term monitoring of Australian land cover change using Landsat data: Development, implementation and operation. In: Global forest monitoring from earth observation/editors Frederic Achard and Matthew C Hansen. Taylor and Francis. ISBN 978-1-4665-5201-2, 2013. S. L. Furby, “Land Cover Change: Specification for Remote Sensing Analysis”, NCAS Technical Report No. 9, Department of Climate Change. November 2002. Wu, X., A simplified ortho-rectification approach for satellite imagery, ISPRS 2008. Danaher, T., Wu, X. and Campbell, N. A., Bi-directional Reflectance Distribution Function Approaches to Radiometric Calibration of Landsat TM imagery. IGARSS 2001 conference proceedings, July 2001. Teillet, P. M., Guindon, B., Goodenough, D. G., On the Slope-Aspect Correction of Multispectral Scanner Data. Canadian Journal of Remote Sensing, 8, pp. 84-106, 1982. Wu, X. Furby, S. and Wallace, J., An approach for terrain illumination correction. Australasian Remote Sensing and Photogrammetry Conference, Fremantle, Western Australia, 2004. Caccetta, P. A. PhD thesis: Remote Sensing, GIS and Bayesian Knowledge-based Methods for Monitoring Land Condition, School of Computing, Curtin University of Technology, Western Australia, 1997. Kiiveri, H. T. and Cacccetta, P. A., Image fusion with conditional probability networks for monitoring salinisation of farmland. Digital Signal Processing, 8, pp. 225-230, 1998.