Inc. - NASA · · 2017-07-01Schwarzkopf Microanalytical Lab. , Inc. ... not suitable for the Na...
50
DZTERMINATION OF THE DENSITY AND CHEMICAL PROFILES OF GOVERNMENT-FURNISHED CHARRED ELASTOMERIC ABLATOR MODELS Contract No. NASI-8212 Schwarzkopf Microanalytical Lab. , Inc. Woodside, New York Distri’Sution of this report is provided in the interest of information exchange. Responsibility for the contents resides in the author or organization that prepared it. https://ntrs.nasa.gov/search.jsp?R=19690026696 2018-05-30T02:05:41+00:00Z
Transcript of Inc. - NASA · · 2017-07-01Schwarzkopf Microanalytical Lab. , Inc. ... not suitable for the Na...

DZTERMINATION OF THE DENSITY A N D CHEMICAL
PROFILES OF GOVERNMENT-FURNISHED
CHARRED ELASTOMERIC ABLATOR MODELS
Contract N o . NASI-8212
Schwarzkopf Microanalytical Lab. , Inc.
Woodside, New York
Distri’Sution of t h i s report i s provided i n the in t e re s t of information exchange. Responsibility f o r t he contents resides i n t h e author or organization t h a t prepared it.
https://ntrs.nasa.gov/search.jsp?R=19690026696 2018-05-30T02:05:41+00:00Z

PART I
Contract No. L64-9042 as specified in the work statement requests the analysis of various cuts of several ablationmodels . Specifically, it requests the determination of:
1) Total Carbon 2) Hydrogen 3) 4) Residue 5) "Freeaa oxygen 6) "Free" carbon 7) Density
Total silicon and silicon carbide
In part I of this report, we wil l describe the chemical analyses performed 1 to 6 and some additional investigations not covered by this contract, but that we deemed essential to the understanding of theproblem.
We wi l l now describe the analytical methods employed:
Total carbon was obtained by combustion at llOO°C, using lead oxide a s an additive. This included all carbide-carbon.
Total hydrogen was also obtained in this analysis.
Total non-carbide silicon was obtainedby oxygen flask combustion with concentrated sulfuric acid a s an absorbent and dehydrating agent. Si l icon dioxide formed w a s filtered and weighed and 4hen volatilized by treatment with hydrofluoric acid. This left a residue.
Residue . The resulting residue consisted of a) silicon carbide and b) metal oxides, especially Oxides of i ron, alWinum, and 3f sodium. acidification , dissolved both components. Silicon from S i c was determined colorimetrically by the molybdene blue method. I t is shown in our Tables as Sisic. Iron and aluminum were determined colorimetrically and by atomic absorption. spectrophotometry.
A carbonate fusion, followed by
The main component of the residue w a s Na. We checked for the presence of Li and K but only Na was present in sufficiently large amounts. We restricted the tests to Na. Since Na2C03 was used in the fusion, this method was not suitable for the Na determination. Instead the residues from the determinations of free carbon, where no additive was used, and of free oxygen were analyzed for Na by atomic absorption spectrophotometry (AA) . "Free Oxygen" was determined by known techniques , that is by pyrolysis a t 1000°C in a stream of N2/H2 followed by convers n into CO; then exidation into C02. Total oxygen was determined by difference bec be reduced under present conditions.
e oxygen bound to silicon could not

"Fre.e" carbon (non-carbide carbon)was more difficirlt to determine than i t was stated in the work statement. Combustion a t 900cC without any additive, produced only incomplete recoveries. The combustion residue contained substantial amounts of free carbon.
Instead carbide-carbon was calculated from the amount of carbide- silicon. Free carbon h a s the difference between total carbon and carbide carbon.
To obtain a direct measure of free carbon and also resolve some interesting other problems which cropped up in the course of our work, we conducted two series of tests, called Series I and Series I1 - and we also extended the oxygen tes t series - called Series 0, to include measurements of volatile fractions, carbon and silicon.
This part of our work - Series I , I1 and the extended series 0, have not been requested in the work statement, but we felt strongly that without this additional investigation our results may not have significance. We a lso thought that a l l possible information should be extracted from elementary analyses. We showed in these tes t s some of the properties of the tes t material when exposed to chemical treatments such a s combustion, heating in nitrogen, readtion with HF . We especially examined the volatility and the s ta te of oxidation of silicon. Some of the problems which still remain may deserve further and more detailed investigation.
The preparation of layers of material (cuts) to be examined and the measurement of Density were carried out by the AVCO corporaition, Lwell , M a s s . a s a sub- contractor. report as Part 111.
The results have already been submitted by u s and will appear in this
Analytical Results
Part I Chemical Analysis
The analyses requested in this contract are given for
Model I1 in Tables: I and VII, VI11 Model I V Ix and xv , XVI Model VI XVII and XXIV,xxv Model VI1 XXVI and XXVIII
The following comments canbe made:
TABLE I - Carbon - free and total , reach a minimum in cut 11-3 then carbon increases to cut 5 and decreases again to cut 1.
Hydrogen is present only in cuts 15-10, In the cuts 9 - 1, a trace may be present but the amount found is near or equal the precision of the method.
Free oxygen is found only in cut 15 (virgin material) none was found in cut 14 in several t e s t s , a s m a l l amour?t of oxygen w a s found in cu t 13, 12. A l l other cu ts did not have free oxygen.
- 2 -

Included in this Table is the column, Volatility, which is derived from Series 0. We see that cuts 14-10 contain volatile fractions in decreasing amounts. This shows that in these cuts pyrolysis was incomplete during the charring heat treatment to which they had been exposed. Fractions 8 - 1 have been completely charred and do not contain either hydrogen, oxygen or voLitile material.
The non-carbide silicon content is the highest in cuts 6 - 1. However, this table does not show us what form of silicon is present. s m a l l part is present as S i 0 while considerable amounts I sometimes the main part is present in a lower s ta te 0% oxidation, e.g. as S i 0 or SiOSi.
We w i l l see that only a
It is remarkable that we find considerable differences in the amount of residue present. The highest amounts are found in cuts 12 - 9 and again in 3 - 1.
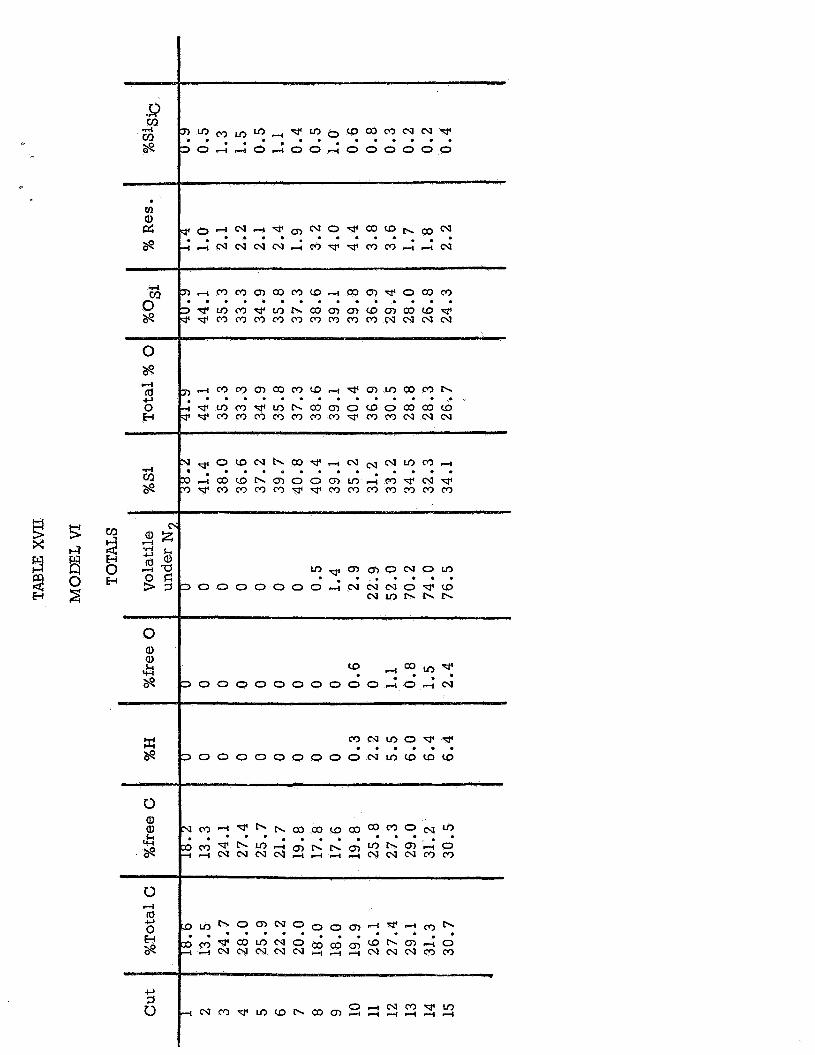
From Table VI1 and also in the last column of Table I we can see that S i c was found in significant amounts only in cuts 1 - 5. Some may be present in cuts 11 - 12.
The main metallic component of the residue is sodium. This may have i ts origin in the catalyst General Electric SRC - 04. The Na content is highest in cuts 12 - 9 and then falls off in both directions. As the material supposedly was of uniform composition before the charring heat treatment we have to assume that sodium dispersed by melting or evaporation and concentrated in fractions 13 - 9.
Table IX shows similar patterns to Table I. The carbon content is at its lowest in cuts 9 and 10 I reaches a higher point in c u t 4 and falls off to cut 1. Hydrogen is found in cuts 15 - 10 but the pyrolysis may have been less complete because we find a considerable amount of hydrogen in cut 12 (5.4%) while in Table I cut 12 has only 1.7% H.
Free oxygen is also spread out. It is definitely present in s m a l l amounts up to cut 11.
The volatility is also much greater in this model. Cut 12 amtains 58.4% volatile as compared to 15 in Table I.
Non carbide silicon follows the pattern already discussed. More will be said in the later pages of this report.
The residue is the highest in 12 - 8. We do not see any concentration in cuts 1 - 3 .
Silicon carbide is quite low.
A substantial component of the residue is sodium. Again the highest concentration is in the cuts 11 - 8.
Table XVII shows a similar pattern
Carbon is the lowest in cuts 9 - 8 and has a second peak in cut 4. Cut 2 is particularly low in carbon. 4 analyses agree with this low value.
- 3 -

Hydrogen is present in cuts 15 to 10. A s m a l l amount, within l i m i t s of the experiment, could be present in 10.
Free oxygen is present in 15 to 12. In 11 no free oxygen was found; in 10 a s m a l l amount.
Volatile fractions are found until cut 10. In 9 and 8 only very s m a l l fractions are still volatile.
Non carbide silicon increases irregularly with a high in cuts 9 to 6 and in cut 2 while the other cuts are low.
The residue is the highest in cuts 11 to 9.
Sodium is the highest in cuts 10 to 8 and S i c in 11 to 9 , 6 , 4, 3 and 1.
Very little can be deducted from analyses of model VI1 which broke repeatedly during cutting. Cut 5 is the virgin material.
- 4 -

volatile% non volatile ~ free oX:lgen Non volatile
%C %H
%Weight loss (HF) Residue weight loss calc. as Si weight loss calc. as 0
%C %H %Si %Free 0
%OSi
~=0.97 =1.049 Si 0.925
1. 049 corresponds to
Model n/lS Model IV/IS M ,del VI/IS
76.8 76.3 76.S 23.2 23 . 7 23.5 3.0 2 . 5 2.4
5.2 4.4 4.6
16.6 17.0 16.7 1.3 2 .2 1.2 7.8 7. 9 7.8 8.9 9 .1 8.9
Table XXVIII
volatile fraction (average) total non volatil e volatile 30.5 4 .7 25.8 6.3
33.8 2.6
24.6
7. 9
9.1
6.3 25.9
2 . 6 15.5
38 . 7% SiO + 2 . 7% Si02
20 .9% Si OSi + 20 .7% Si02
Model VII/S Averag e
76.5 76.5 23.5 23.5 2.2 2.5
4.6 4.7
17.6 17.0 1.3 1.5 8.2 7.9 9.4 9.1
atom %
0.925
0.97
Calculation I seems more realistic than calculation II. It would require the presence in the volatile fraction of 2 . 7% volatile SiO . This could be an experimental error or it could be a radical Si ...........-0£\ present in the ~irgin material which would be volatile. '-- OR
This could correspond to the dimethoxy component of the preparation.
We noted the carbon content of the non volatile fraction. We feel that the carbon has its origin in the phenolic portion of the mixture. This component seems to pyrolyze more easily than the siloxanes . On heating under nitrogen the siloxanes are volatil ized without decomposition while the phenolics are pyrolyzed loosing hydrogen and oxygen (found as free oxygen) and leav ing the carbon behind.
No conclusions can be drawn from the results of the analyses of cuts 15 of the series I and series II. We have already mentioned that recoveries of carbon and silicon are incomplete in these tests.
From our mode of analyses and the behaviour of the virgin material, the following picture of charring is suggested : At first, siloxanes are volatilized and phenolics pyrolyzed. The siloxanes penetrate the upper layer up to cut 11 w he re they are J complete ly pyrolyzed. During this process, gases are for med that make the material porous and e ven may c ause more or less deep cracks. Cut llhas the lowest density b ecause of the evolution of gas . In this cut pra ctically all
silicon has been converted t o SiO~ _aruLn~~J..dation D~ occurs during combustion.

,
PART II
Additional work (not included in work statement)
We mentioned that in the course of our investigation, we found out that the charred ablation models gave incomplete and inconclusive results when the analyses were performed in strict compliance with the work statement.
We carried out the requested analyses and the results are given in Part I of this report. We also determined" free carbon" as requested in the work statement {by combustion at 900
0 C) and these results figure as Combustion I (%Cl) in Tables
VI I XIV, XII of the Serie II and also in Tables VIll" XVI, XXV.
The following problems were encountered:
1. Free carbon: By comb usting at 9000C, only a portion of free carbon (non carbide-carbon) is
burned. A sizable amount of carbon, depending on the model and the cuL is obtained in a second combustion after an intermediary treatment with HF. We must mention again that neither combustion at 900
0C nor HF treatment will attack SiC. The additional
free carbon is given in the tables as C . 2
2. Volatility
Cuts 9 to 15 yielded variable amounts of volatile fractions when heated under nitrogen to 10000C. Obviously, the volatility increased greatly with the cut number. The amount of volatiles is given in Table L IX, XVII of Part I.
The volatility did not affect the results of "Total carbon" or "Total non carbidesilicon". Combustion with pbO as additive was complete. The "total silicon" analysis by oxygen flask combustion and gravimetric determination of Si0
2 was not affected.
However the combustion analysis without additive even as performed in Serie II (as will be shown later) in two steps gave incomplete recoveries of carbon becau :3e in the intermediary step of HF treatment carbon was lost (this will also be discussed later) .
To illustrate the incomplete recovery of carbon in cuts 12 to 15 the following table compares "total carbon" with Cl and C 2 of Serie II.
TABLE XXVI
Model Cut %Cl %C 2 %Cl + C 2 % total carbon
II 15 29.0 ° 29.0 30.4 14 28.8 0.7 29.5 31. 6 13 25.3 0 25.3 27.7 12 20.8 0.6 21. 4 24.1
IV 15 29.2 0 29.2 32.0 14 29.6 0 29.6 33.4 13 28.6 0 28.6 30.9 12 27.6 0 27.6 30.2
VI 15 29.6 ° 29.6 30.7 14 29.1 0.5 29.6 31. 3 13 28.4 0.5 28.9 29.1 12 2.1.8 _ 0.7 28.2 _ 27.4 ---
i .

The difference between totel" and CI+C2 cannot be attributed to silicon Garbide because very little Si (silicon in the Na2CO3 fusate) is found and therefore FiC little S i c is present in these ractions.
Similarly complete recovery of silica as combustion residues is not always possible. Not affected was the analysis for lltotal non carbide silicon1* and "carbide sil icon1t, because both derived from the same analysis by oxygen flask combustion Here the sample is burned in a closed flask filled with oxygen and concentrated H SO4 as absorbent. All the vapors pass through the hot f lame. S i 0 becomes aAydrous with the concentrated H2S04 but silicon carbide remains uhurned . After
elimination of S i 0 by treatment with HF the remaining residue is fused with Na2C03 is determined in the fusate by the molybdenum blue colorimetric procedure.
and This sisi? ana ys i s is not effected by the volatility of the sample and has been used by us for the analysis of volatile si langes, etc.
2
3 . Oxygen uptake and oxidation state of silicon
After combustion of cuts 1 to 11 (samples without volatile material) we find that the combustion residue weighs more than the loss of carbon indicates. If we deduct the weight of the carbon found from the starting weight, there is a gain. This is caused by oxidation of the combustion residue and we call it oxygen uptake. (D ) . The only component which is present in the residue in substantial amounts is Qilicon and we consider the oxygen uptake to be a measure of the oxidation s ta te of silicon. It is of significant value that should lead to an interpretation of the state of oxidation of the silicon present, e.g. Si02 S i 0 or SiOSi,etc. We felt that this information should be extracted from our experiments e
4. Composition of the volatile fraction
Cuts 12 to 15 contain increasing amounts of volatile fractions that volatilize a t 1000°C under a stream of N analysis of the remaining wolatile fractionsis performed in Series 0 and gives u s , by difference with l l totalsl t the composition of the volatile fractions
the conditions required for oxygen analysis. The elementary NOY 2 '
5. Another interesting and unsettled aspect of the problem is to distinguish between various forms of (non carbide) carbon. The starting virgin material contains carbon as a component of si loxane, methoxy silanes and also phenolic carbon.
We have had no occasion to analyze the various components separately and to study their behavior under conditions of pyrolysis or oxidation as they occur during the charring test and also in our analytical procedures. Such experiments would have been helpful in the interpretation of our results especially to explain the carbon found in the non-volatile residues of cuts 12 to 15. We have some evidence that there is a difference in stability of siloxanes and phenolics and that it is phenolic carbon that is present in the non volatile fraction of cut 15. The siloxanes on the other hand s e e m to volatilize without pyrolysis. A more detailed study of this phenomenon should be of value.
These were the main problems we encountered in our investigation. TO try to solve them at least partly, we performed Series I, 11 and 0 which we will now discuss. Each series is a whole sequence of analyses, all carried out with the same weighed starting material.
- 2 -

*Series I comprised the following steps:
1. treatment with hydrofluoric acid, determination of the weight loss 2. combustion$ , determination of carbon, hydrogen and combustion residue 3 . determination of D 4 . treatment with hydrofluoric acid, ,determination of weight loss 5. determination of the lffinal" residue 6 dissolving the residue in HCl for the analysis of N a , F e , Al
0
/
The treatment with HF (step I) affects by
/OR e.g. di methoxy silanes a. volatilization - all silica (Si02) b. hydrolysis - ether type linkages such as Si
'OR or siloxanes
Si02 and RH are both volatilized, causing losses both of S i 0 and C. 2 Losses of C occur in cuts with volatile fractions only, where charring did not cause complete pyrolysis. In cuts 1 to 9 and practically in 10 and 11, the loss of weight after HF treatment is strictly S i 0 2'
In step 2 "free carbon" is burned. We obtain practically a l l the "free carbon". Carbon left in the combustion residue is small. In this combustion we observe an oxygen uptake ( D d : the residue weights more than the difference between starting material and "free carbon". because S i 0 is formed. It is volatilized in Step 4 . Deducting D l)? (e.g. O/Si = l.l/l) . The excess of oxygen may indicate the presence of some S i 0 or may be characteristic of the end-group of the siloxane polymer. We attempted to calculate the S i 0 of this fraction by assuming an oxygen-silicon ratio of l/l , (Si-0) and 1/2 (Si-@Si? for the second component. (Tables 11, X, XVIII). The results of Series I are found in tables I11 for model I1
XI I V XM VI
2 shows that before oxidation the oxygen/silicon ratio of this fraction is roughly
2
II
I1
We compared the results with those of tables 11, X AND XVIII.
Series I1 comprised the following steps.
1. combustion I - determination of carbon (C1) , hydrogen and combustion residue 2. calculation of oxygen uptake" D 3. treatment with hydrofluoric acid, determination of the weight loss (HF)1 4. combustion I1 determination of carbon (C) 5. calculation of oxygen uptake D02 6 treatment with hydrofluoric acid, determination of the weight loss (HF) 7. determination of the final residue 8.dissolving the residue in HC1 for the analysis of N a , F e , A1
01
and combustion residue 2
This series differs from series 1 by the first step, combustion I , afterwards it follows the sequence of series I. Combustion I represents the determination of "free C" in accordance with the work statement. The results are given separately
- 3 -

in Table VI11 for model 11, Table XVL: for model I
By starting with a c agreement with the “Totals‘*. W e can also compare the we with the weight loss of Step 1, in Series I.
In Series u[ a comb HF causing a n increase in between Do and (HF)l. The r
Model 11 in table VI Model I V X V Model VI XXII
11
I1
Series 0 comprises the following steps:
1. determination of free oxygen by pyrolysis in a stream of nitrogen.
2. determination of the %eight loss, this is the volatile fraction 3 . a) treatment with HFl, weight loss
Determination of CO as a measure of free oxygen
b) combustion, carbon, hydrogen, residue c) determination of D d) treatment with HF ,weight loss
e) final residue f) dissolution of residue and analysis of Na
0
An alternate step 3 followed the sequence of Series I1 starting with combustion and continuing with a to f as above. Sometimes a third combustion and a third treatment with HF was necessary to clear the residue of all free carbon.
We compared the weight loss of 3 a with the weight loss of Series I, Step 1 and found good agreement in the cuts 1 to 9 where no volatile fractions are involved. In the cuts 10 to 15 there is a l so a correlation, i f we take into account the volatile portion eliminated before the HF treatment, in other words i f we add % volatile to the weight loss of 3 a.
Next w e calculated the composition of the volatile fractions in cuts 11 to 15. We found that the volatile fractions have roughly 1/1 Si/O ratioo
The results of Series 0 are found for
Mod in table I V and V Mod XI1 and XI11 Model VI XX and XXT.
II
11
ode1 W,cut 15, I V , cut 15 , VI cut
given to us and
- 4 -

Table X X W I gives the totals1'
Model Cut %C %H %Si free total 0 %Residue
I1 15 30.4 6.4 33.5 3.1 27.9 24.8 1.8 30.6 6.2 33.7 2.9 27.5 24.6 2.0
IV 15 30.9 6.2 34.2 2.5 26.5 24.0 2.2
%O
Si.
VI 15 30.7 6.4 34.1 2.4 26.5 24.0 2.2
VI1 5 31.1 6.1 33.6 2.2 27.7 25.2 1.5
Average 30.5 6.3 33.8 2.6 27.2 24.6 2.0
Composition of residue: Na 0.55 0.50 0.56 Fe 0.03 Al 0.05 Si 0.30 0.43 S i c
0 Calculation of D
Si: 33.8 1.21 atom %
Osi: 24.6 1.54 atom %
Do = 2 x 1.21 - 1.54 = 0.88 expressed as %O = 14.08
Calculation I - a mixture of Si02 and S i 0
%SiO= Do" 44 = 0.88 x 44 = 38.7
%si02 =(= - D ) x 60 -= (1.21 - 0.88) x 60 = 19.8 28 0
Calculation 2
%SiOSi = Do x 72 = 0.29 x 72 = 20.9% SiOSi - 3
%Si02 =(%Si - 2 Do) x 60 = 37.8% 28 3
TABLE XXVIII
Composition of the non volatile and volatile fractions
The following table gives the composition of the n m volatile fractions (Series 0)
- 5 -

Model II/15 Model IV/15 M.;del w 1 5 Model VII/5 Average
Volatile% non volatile
76.8 76.3 76.5 76.5 76.5 23.2 23.7 23.5 23.5 23.5
%C 5.2 4.4 4.6 4.6 4.7 %H
%Weight loss (HF) 16.6 17.0 16.7 17.6 17.0 Residue 1.3 2.2 1.2 1.3 1.5 weight loss calc.as Si 7.8 7.9 7.8 8.2 7.9 weight loss calc.as 0 8.9 9.1 8.9 9.4 9.1
- - - - -
Table XXVIII
%C %H %Si %Free 0
Si %O
Volatile fraction (average) total non volatile volatile 30.5 4.7 25.8 6.3 - 6.3
33.8 7.9 25.9 2.6 - 2.6
24.6 9.1 15.5
a t o m %
0.925
0.97
0 = 0.97 Si 0.925 - - = 1.049
38.7% S i0 + 2.7% Si02
20.9% SiOSi + 20.7% Si02 1.049 corresponds to
Calculation I seems more realistic than calculation 11. It would require the presence in the volatile fraction of 2.7% volatile S i 0 . This could be an experimental error or it could be a radical SidR volatile. ‘OR
This could correspond to the
present in the qirgin material which would be
dimethoxy component of the preparation.
W e noted the carbon content of the non volatile fraction. We feel that the carbon has its origin in the phenolic portion of the mixture. This component seems to pyrolyze more easily than the siloxanes. On heating under nitrogen the siloxanes are volatil ized without decomposition while the phenolics are pyrolyzed loosing hydrogen and oxygen (found as free oxygen) and leaving the carbon behind.
No conclusions can be drawn from the results of the analyses of cuts 15 of the series I and series 11. W e have already mentioned that recoveries of carbon and silicon are incomplete in these tests.
From our mode of analyses and the behaviour of the virgin material, the following picture of charring is suggested: At first, siloxanes are volatilfzed and phenolics Pyrolyzed. The siloxanes penetrate the upper layer up to c u t 11 where they are completely pyrolyzed. During this process, gases are formed that make the mzlterial porous and even may cause more or less deep cracks. Cut l lhas the lowest density because of the evolution of gas. In this cut practically all silicon has been converted to Sin, and nn widat inn tn-1 occurs durina combustion.

Above cut 11 oxidation is prevented by the evolution of large gas , e.g. H , CO or CH mdicals. Therefore, we find Si as S i 0 or Si 0 Si or other lower 8i oxides. Due to the higher temperature and the presence of oxyge in the environment, oxidation occurs at the surface and Si is mostly oxidized.
W e have already discussed the pattern of dis of sodium. Silicon carbide seems to-be found in the surface. Sodium also is concentrated in the middle layers. I combination of carbon and silica formed in the layers 11 produces and oxidation and tends to contribute to the stability of the material?
Other Cuts
Interesting deductions can be made from the analyses of the other cuts containing volatile fractions but at present we refer to the tables showing the composition of non-volatile and volatile fractions. The first result is that the ratio of silicon to oxygen in the volatile fractions is nearly 1 : 1 and the fact that volatile fractions do occur in cuts 14, 13 and 12 and s m a l l amounts even in 11. Free oxygen has vanished nearly immediately while hydrogen is still present. All this points out that the phenolics are already pyrolized in cut 14 and siloxanes are pyrolized gradually. Hydrogen and volatility are indicative of incompletely pyrolized siloxanes.
The completely pyrolized cuts 1 to 10 have been quantitatively analyzed in Series I and 11 and again interesting evaluations can be made. W e refer tothe tables where Series I and I1 are compiled. We cannot a t present decide whether calculation I or I1 comes nearest to the reality. Further experimentation would be necessary. I n s m e of the samples the material which was available to us was extremely s m a l l , e g. in model 11, cut 1 we had a total of 1 mg. sample, Not all of the sample which was cut off was recovered. Fortunately we were able to run this analysis on our ultra micro apparatus and reasonably good results were obtained. We could, however, not perform more than Series I1 which was used to calculate total silicon, carbon, etc.
Wherever the sample was insufficient we have noted it in the tables.
. --

PART I11
In this part we report the preparation of layers of material to be analyzed. This work was performed in sub-contract by AVCO Corp. , Lowell, Massachusetts , and we have already reported, on Sept. 24, 1968 (letter to LRC-William E. Rew) .
Models 11, IV, VI were successfully layered. Model VI1 was found to have a fractured char cup. A s a result , attempts to layer the specimen in accordance with instructions in the work statement were unsuccessful. Only 5 layers were obtained. These attempts are described in greater detail below * Photographs made and included with out letter of Se2t. 24 are part of this report. The photographs were made to show the result of one attempt to set the char cup in epoxy resin in the hope of being able to partition it successfully and to illustrate the type of damage observed by us prior to the initial layering attempt. These photographs show also that the char was not yniform horizontally , dark portion on the outside and lighter portion on the inside This condition was present in all four models 2 , 4 , 6 and 7.
The results for models 2 , 4 , 6 and 7 are presented in Tables I through I V respectively. Each specimen was basically cylindrical. Therefore most layer volume calculations were straight forward. However, equations for the volumes of spherical segments {one base and two bases) had to be applied to the first few layers of Models 2 , 4 and 7 because these speciments were rounded on the end. Also, a prism shaped chip had to be removed from Model 2 beginning with layer 5 , before layering could continue. Consequently, an adjusting calculation was necessary for subsequent layers. The equations used with the exception of cylindrical volume are given as footnotes at the bottom of each table. The following describes briefly the difficulties encountered with Models 6 and 7.
.
When the outer diameter of these speciments was turned down to 1.50 inches (Models 2 and 4 were treated similarly) to expose the char region of interest, the char region of Model 6 was observed to be cleaved by a fissure extending across the surfsce of the char and down through the char layer. Model 7 was fractured more severly. Two large cracks penetrated the char fromthe surface down through the char but, more significantly, the char cap was almost totally separated from a zone just above the virgin region because of a break extending horizontally through the specimen. .
To try to make it possible to layer successfully models 6 and 7, a collar was designed, fabricated and used to enclose the specimen uniformly. This technique was successfully applied with Model 6. However, during the third layer cut on Model 7 , the entire cap separated from the specimen and broke into three large pieces and one smaller piece. photographs 1 and 2 illustrate respectively the appearance of the pieces ,broken from the char cap and the appearance of the specimen after separation of the cap during machining.

After this occurrence, we called y a , and with your permission reassembled the char piecesand set them in an epoxy resin in such a way that layering could be continued without being contaminated by resin. Photograph 3 best illustrates the result.
Unfortunately, the attempt to layer the bonded char cap m e t with failure because the char itself did not have sufficient strength to ha>ld together under shear forces of layering. A s a result, the upper surfaces of each piece separated from its bonded epoxied portion.
We hoped that we could yet obtain four or five layers for density information and therefxe bonded each of the segments to a n aluminum block. The bonding held, but again, each segment broke away from itself. At this point, t ime considerations did not permit. us to try again. We had three layers fromthe c h x surface .We obtained two more from the residual portion of Model 7 - one just below where the char cap broke away and the other in the virgin region.

u d " d
8
-rl
0" 8
0 s 7
.rl cn 8
a,. a, & 0 s
c, 5 u
0 m m * ~ ~ m 0 m T r 4 m m m h F I m m . . . . . . . . . . 4;;d;oooooooooo
c o m c o N m Q ) m m c o c a 0 0 3 0 4 0 T r u 3 m m m N N N m w m m N N N . . . . . . . . . . . . . . .
. . v 1 m
. . c o c b 0 < . . v 1 v 1
. ~ ; o o o o o o o o o o o o ~
.A 44 m a,

c u t
1 2 3 4 5 6 7 8 9 10 11 12 13 14 15
- %Si
39.5 40.6 40.4 40.3 40.1 40.0 37.6 38.0 37.5 36.7 35.0 33.4 33.9 33.5 33.5
TABLE 11
MODEL I1
Attempt of Interpretation of Silicon & Oxygen (Osi)
35.7 33.4 32.0 34.6 32.8 34.7 38.4 39.2 39.6 39.2 39.7 35.8 31.0 28.3 25.2
DO
0.59 0.81 0.90 0.72 0.81 0.71 0.28 0.27 0.20 0.17 0 0.14 0.48 0.63 0.83
Calculation I %Si0 %SiOz
26.0 35.6 39.6 31.7 35.6 31.7 12.3 11.9 8.8 7.5
6.2 21.1 27.7 36.5
49.2 38.4 32.4 43.2 37.2 42.6 63.6 65.4 68.4 68.4 75.0 63.0 43.8 34.2 22.2
Calculation 11 %SiOSi %Si02
14.2 19.8 21.6 17.3 19.4 17.3 6.5 6.5 4.8 4.1 - 3.6 11.5 15.1 20.2
60.6 54.0 50.4 57.6 53.4 57.0 69.6 70.8 72.6 72.0 75.0 65.4 53.4 46.8 38.4

4 m R
0 R
H a,
la El z
H
4 a,
0 % SI3
u s
a,
a 4 4 c,
4
c, 5 u
k w a,
a 4 O C V 4 4 C O h O C , C O r n h C O h N C V N 4 .-.I
0 0 0 0 0 0 0 0 0 0 0 >
a,
.-.I 4 c,
. . . . . . . . .
a c: rb
4 hCOcDOmCOmCOO1 C O C O U ) V ) T r N C V O O
0000000000 . . . . . . . . .
-rl
92 N * * . . 0 0 0 0 0 0 0 ; N N * E-i

TABLE IV
% Free Oxygen
MODEL I1
HF loss
.Analysis of Series 0
0 0 0
0 0 0 0 0 0 0 0 0.8 0.6 0 3.0
* N.D. N.D.* 60.0 56.5 56.1 60.5 59.3 57.5 55.4
59.3 65 .O **
HF loss Series I
56.2
60.1 61.1 60.9 61.3 60.2 57.4 57.9 59.9 63.5 **
* Sample insufficient ** The Table is cut here as the volatile fraction obscures the picture.

TABLE V
MODEL 11
Analysis of Series 0 (continued)
Calculation of the volatile fraction in cut 12, 13 I 14 I 15
c u t 12 Totals % Non volatile Volatile % Atom %
%C 22.5 13.2 %H 1.7 % Free 0 0.8 % Si 33.4 30.8
%Osi 35.8 35.2 Res . 5.8 5.8
- -
Total Found volatile
9.3 1.7 0.8 2.6 0.09 0.6 0.04 -
c
15.0 15.1
Cut 13 - Totals %Non volatile Volatile % Atom %
%C 27.6 8.6 %H 4.9 % Free 0 0.6 - %Si 33.9 16.1
% osi 31.0 18.3 Res. 2.0 2.0
-
Total Found Volatile
19.0 4.9 0.6 17.8 0.64 12.7 0.80
55.0 55.8
, ,’ c u t 14 Totals %Non Volatile Volatile % Atom %
% C % H % Free 0 % Si % osi Res.
30.0 7.9 6.1 0 -
33.5 12.0 28.3 13.9 2.1 1.8
- 22.1 6.1 0
21.5 0.77 14.4 0.90
Total Found Volatile
64.1 64.2

TABLE V (continued)
Cut 15 __I_
Totals %Non volatile Volatile % Atom %
%C 30.1 5.2 % H 6.4 % Free 0 3 .O % Si 33.5 7.. 8 % O 25.2 8.9 R e s .si 3.5 1.3
- -
Total Found Volatile
24.9 6.4 3.0
25.7 16.3
76.3 76.8
0.92 1.02

H H
rn a, k a, v3
I rn a, cn h 5
-4
4
. . . . . . . . . . ~ 0 0 0 0 0 0 0 0 0 0
&+&
-- A-
c v ) Q ) m o 4 PI
> o o o o o o o o o o 2 2 L 3 u 3 b h C Q 2 O d . . . . . . . . . .
O h N c o a O N m h m a T F m M C . ; i O
0 0 0 0 0 0 0 0 0 0 0 . . . . . . . .
h I - i c l b O c n b A N C Q N I - ~ N O ~ G ~
0 0 0 0 0 0 0 0 0 0 0 . . . . . . . . . .
co 2 2 h d
c o d 4 m v co u3 m uJ co h
4 s v m co co q m cI.l c-9 co
* . . * N N 4 0 0 . . . . .
00 0 0 0 0 I 0 0 W r - i A
. . . . . . . . .

v1 a,
t: c c
.k d
c o I n ~ b ~ a w m h I n ~ b v) & o 0 A 0 4 0 0 0 0 0 0 0'0 . . . . . . . . . . . . . z o o o o o o o o o o o o o d
x m m m 2 o l m * a m * * ? l m
~ m 0 0 0 O 0 . 0 0 0 0 0 0 0 0
s o o o o o o o o o o o o o 0 . . . . . . . . . . . . . .

TABU VIIS
MODEL I1 0
"Free Carbon" by combustion at 900 C (incompleterecovery)
% C
14.6 11.1 14.1 15.3 16.4 16.6 14.6 13.5 12.6 13.8 18.7 20.8 25.3 28.8 29.0

a, -5 2 2 m
8
.Pi
0" 8 -
a, 2 0 8
+I
w 5 u
c o d ~ m N m v ) m v ) b * m d * m m
I Q 0 0 0 0 0 0 0 0 0 0 0 0 0 . . . . . . . . . . . . . .
0 0 0 4 : m cy a o * N a w . . . . ? . . . .
h

- c u t
1
2
3
4
5 6 7
8
9
10
11
12
13
14
15 -
%Si
35.7
36.0
37.1
37.4
38.5 40.3
41.2
41.1
39 09
38.3
33.0
33.5
31.7
34.2
34.2
-
~
TABLE X
MODEL IV
Interpretation of Silicon and Oxygen (0 ) Si
Calculation I %Osi
37.1
34.4
33.5
34.3
34.1 35.3
34.8
35 .O 36.3
36.7
37.9
26.0 26.7
22.8
24.0 _---
DO 0.23
0.34
0.55
0.54
0.60 0.67
0.76
0.75
0.59
0.44
0
0.76
0.59
1.01
0.94
%Si0
7.0
15.0
24.2
23.8
26.4 29.5
33.4
33.0
26.0
19.4
- 34.3
26.0
44.4
41.4
%Si02
64.8
57.6
4 6 . 8 .
48.0
46.8 46.2
42.6
43.2
50.4
55.8
70.9
25.2
32.4
12.6
16.8
Calculation I1 %SiOSi
3.6
7.9
13.0
13.0
14.2 15.8
18.0
18.0
14.4
10.8
- 18.7 14.4
25.2
22 .3
%SiOZ
68.4
64.8
58.2
58.6
58.8 60.0
58.2
58.2
61.8
64.2
70.9
40.8
43.8
31.2
36.0 ___

-d
nm
u R
H H
5 4 Q E-1
N n LLl
s
x W
c, 3 u
* m T r h W M * m - * . . . . . N 4 0 4 4 4 4
-PI I I I + I I I I I
U 0 c
-PI 0 0 0 0 0 0 0 0 0
Ll a, .-c E-1
rn G 0 . q l N o m o m W m 'PI r J 2 b * W * C Q T l + N 4 U u -A d 0 0 0 0 0 0 0 0
. . . . . . . E u-c
4 a,
. . .!!

TABLE XI1
c u t
1 -2 3 4 5 6 7 8 9 10 11
12
13 14
15
* %Vola tile
- - - - - I
1 . 3 1.8 8.0
58.4
70.5
73.0 76.3
1
%Free Oxygen
- - - - - - - 1.6 1.8
1.7
1.9
2.6 2.5
MODEL I V
slysis of Oxygen
HF Wt. loss
61.0 57.2 55.6 55.6 49.3 47.1 48.7 54.9 62.0
H.F. W.L. Table XI
60.9 59.3 58.7 60.0 51.4 48.7 52.1 58.7 66.5

TABLE XI11
MODEL IV
Calculation of volatile fractions in cuts 11 - 15.
"Cut 11 Totals Non-volatile Volatile Atom %
%C 20.9 18.1 2.8 1.1 %H 1.1
%Free 0 1.8 - 1.8 %Si 33.0 31.4 1.6
Res. 5.3 6.7
I_
%Osi 37.9 35.8 *0 .9 - - Total . 92.0 Found-volatile
c u t 12 Totals Non-vola tile %C 30.2 7.8 %H 5.4 - %Free 0 1.7 - %Si 33.5 14.5 %OSi 26.0 16.3 R e s . 3.2 3.0
Cut 13 Totals Non-voh tile
%C 31.0 9.1 %H 6.2 - %Free 0 1.9 - %Si 31.7 9.2 %Os j, 26.7 10.6 R e s . 2.5 1.4 Total Found volatile
Cut 14 Totals - Non-volatile %C 31.4 5.0 %H 6.6 - %Free 0 2.6 - %Si 34.2 9.8 %OSi 22.8 11.2 Res. 2.4 1 Total
8.2 8.0
0.058 0.058
Volatile Atom % 22.4 5.4 1.7
19.0 0.68 9 .7 0.6
58.2
Volatile Atom %
21.9 6.2 1.9
22.5 0.8 16.1 1.0
68.6 70.5
-
Vola tile Atom % 26.4 6.6 2.6 24.4 0.87 11.6 0.73 - 71.6
Found Volatile 73.0

TABLE XIII (continued)
Model I V
Cut 15 Totals Non- vola tile
%C 30.9 4.4 %H 6.2 - %Free 0 2.5 - %Si 34.2 7.9 %Osi 24.0 9.1 Res . 2.2 2.2 Total Found volatile
Volatile Atom %
26.5 6.2 2.5 26.3 0.94 14.9 0.93
76.4 76.3
-

a, A
4 a 4
m d - 5
' N 4 m + G
a, I-I
111
2 8
0 -- u s v
_Ip_ 3 u
m W h W O R m m m W N m m m C D C D R h m W
0 0 0 0 0 0 0 0 0 0 0 . . . . . . . . . .
W ~ C O N 4 C n O O m T r N 4 W m m m m W R c 9
0 0 0 0 0 0 0 0 0 0 0 . . . . . . . . . .
C O W . . . . . . 9 . q . e m C D C D b m N i 0 C O C O 0
R 4 m N W N C O
N N N N N N N N 4 4 N
Jl
m C o C O C O C O m 4 m C D a o
m ~ m C O C O o o W C D W O N N N N N m m m m m m . . . . . . . . . . .
C O O * * - 0 0 0 0 0 0 0 0 0 0 0
Z 2 2 2 h l m T r m . . . . . . . .
. . . . . . . . =
rrJ c c,
a a, 3 c c 0 u 111
.A .id
G
3 v1 Id
Q)
'Q Id
a, s I3
4
c,

a, E4
8
m
c, d d a, 8
5 a m E m d
a c m
. . . . . . . . . . . . . . . 000000000000000
m a 3 L o N a ~ N N m N d o N N N O 0 0 0 0 0 0 0 0 0 0 d 0 0
000000000000000 . . . . . . . . . . . . . . .
Lo m m b a N m a T r m m m a d m T r T r 0 0 0 0 0 0 0 0 0 0 0 0 0 0 0 . . . . . . . . . . . . . . .
a L 3 L o N m L o m L o h T r m d T r m m
0 0.0 0 0 0 0 0 0 0 0 0 0 0 0 . . . . . . . . . . . . . . .

TABU XVI
MODEL IV
"Free Carbon" by combustion at 900°C (incomplete recovery)
Cut
1 2 3 4 5 6 7 8 9 10 11 12 13 14 15
%C
21.2 20.0 19.8 21.1 18.5 16.3 15.0 15.7 16.3 18.2 20.9 27.6 28.6 29.6 29.2
c
.Y cn 4 cn 8
d
0" s
4 cn s
s R 0 E
Gi w
0
& s a, a,
a> a, k W s
_. u d
c, a 0 I3 8
c, 3 u
'9 4 y m y >oooooooooo;o;N
m N m o * * > 0 0 0 0 0 0 0 0 0 N v ) a ~ a
. . . . . .

0 n rCI 0 G 0
KJ 7 u KJ
-PI w 4
4
u
0" .A
m 8
d
0" 8
d m 8
c, 7 u
Tr .;r N o . w N w N w O N N 0 c o o . . . . . . . . . . . h O ; h 0 ; 0 h C n m T r C n m 0 w h c o w m w w w w w h w T r T r T r m
0 4 T r ~ O C n ~ w L n T r 4 T r N
0 0 0 0 0 0 0 0 0 0 0 0 0 0 0
= f C 3 m m T r w m T r m O m h a m . . . . . . . . . . . . . .

R" 4 m o m d a m 4 a w
+ I + + I I I i + I
. . . . d,;;ooNo;;d
O F i ~ a 3 0 c n ~ W
0 0 0 0 0 0 0 0 0 0
= t N m m T r w m w m . . . . . . . . .
~ m m o 4 m o N ~ 4 0 T r w w m T r v 4 0 0 0 0 0 0 0 0 0 0 . . . . . . . . .
m p l m m . . 0 0 0 0 0 0 0 d ; N N N

- - Cut
1 2
3
4
5
6
7
8
9
a 10
11
12
13
14 15
% volatile
0
0
0
0
0
0
0
0.5
1.4
2.9
22.9
52.0
70.2
74.0 76.5
TABLE XX
MODEL VI
Analysis of Oxygen
% free oxygen
0
0
0
0
0
0
0
0
0
0.6
0
1.1
0.8
1.5 2.4
* %H€ W.L.
0 0
62.2
60.8 57.7
51.0
46.1
40.1
46.7
57.7
51.8
33.0
20.0
17.4 15.9
HF W.L. Table ME
73.9 73.2
65.3
58.8 59.4
58.6
51.5
42.7
48.9
60.9
73.3
78.2
85.2
85.2 32.7
* - W.L. = weight loss

TABLE XXI
MODEL VI
Analysis of Series 0
Calculation of the volatile fraction in Cut 10,l l I 12 I 13,14,15
c u t 10 Total % non volatile % volatile atom %
%C %H % free 0 %Si %O ,
R e s%lue Total
found
19.7 17.2 2.5 0.3 0.0 0.3 0.6 0.0 0.6
35.2 34.2 1.0 0.04 39.8 37.5 2.3 0.08 4.4 4.4 0.0
6.7 2.9
c u t 11 Total % non volatile % volatile atom %
%C %H %free 0 %Si
R e s idu e Total
%Osi
found
c u t 12
%C %H % f ree 0 % Si
R e s idue Total
%Osi
found
25.9 2.2 0.0
31.2 36.9 3.8
Total
27.2 5.5 1.1
33.2 29.4 3.6
14.6 0.0 0.0
27.8 31.7 3.8
% non volatile
9.3 0.0 0 .0
17.6 29.2 3 . 6
11.3 2.2 0.0 3 . 4 0.12 5.2 0.32 0.0
22.1 22.9
% volatile
17.9 5.5 1.1
15.6 9.2 0.0
49.3 52.0
atom %
,'
0.56 0.58

TABLE XXI (continued)
Cut 13
%G %H %free 0 %Si %O Res'?hue Total
found
Cut 14
%C %H % free 0 %Si %O Re & h e Total
found
Cut 15
%C %H %free 0 %Si %Osi Residue Total
found
Total %non- vola t ile
29.0 5.9 6.0 0.0 0.8 0.0
34.5 10.0 28.0 11.5 1.7 1.7
Total % non- volatile
31.2 5.3 6.4 0.0 1.5 0.0
32.3 8.1 26.8 9.3 1.8 1.8
Total %non- vola t ile
30.6 4.6 6.4 0.0 2.4 0.0
34.1 8.1 24.3 9.3 2.2 2.2
%volatile
23.1 6.0 0.8
24.5 16.5 0.0
70.9 70.2
% volatile
25.9 6.4 1.5
24.2 17.5 0.0
75.5 74.0
% volatile
26.0 6.4 2.4
26.0 15.0 0.0
75.8
atom %
0.9 1.0
atom %
0.9 1.1
atom %
0.9 0.9
76.4

TABLE X X I I
Comparison of carbon content of
a .) Non volatile fraction, Series 0 b.) Series I

cut
10
11
12’
13 14
15
18.8
14.8
17.2
14.6
9.7 9 . 3
6.4
S * 9
5.0
5.9
5.3
4.6

0 4 w C O o m h C O
0 0 0 0 0 0 0 0 0 0
= f N m m . s C O m T r m . . . . . . . . . h ~ C O o m o m 4 h , N 4 T r m T r * T r T r T r 4
0 0 0 0 0 0 0 0 0 0 . . . . . . . . . .
rn
. . . . . . . . 0 0 0 0 0 0 0 0 0 0
* ? m N C O h h b m m u , ; O
4 m C O m C O N N m . . . . . . . .
C \ 1 T r T r C O R ~ O h h c c ) 4 . o o o o l - i N m T r 4 0 0 0 0 0 0 0 0 0 0 . . . . . . . . . .
o m m o m 4 m C O C O o . . . . . . . . . m
0 0 0 0 0 0 0 0 0 0
m C O T r m C O C O m m m N
T r o h c n h m m m C O m . . . . . . . . . .
4 4 4 4 4 4 4 4 4 4
a 0 u F:
E

2 8
Q, F4 8
W m h N m C o h N a m m m 4 6 ) 3 0 0 0 0 0 o c l o o o o o o 000000000000000 . . . . . . . . . . . . . .
N N m a O a m m a v m m c - a N m 0 0 0 0 0 0 0 0 0 0 0 0 0 0 0
0 0 0 0 0 0 0 0 0 0 0 0 0 0 0 . . . . . . . . . . . . . . .
v) c 1 4 c l c - a N N N i o 4 q i v a € u w - r o o o o c D o o o A ; o o o o o . . . . . . . . . . . . .

TABLE XXV
MODEL VI 0
IlFree Carbon" by combustion at 900 C (incomplete recovery)
c u t c u t
1 2 3 4 5 6 7 8 9 10 11 12 13 14 15
1 2 3 4 5 6 7 8 9 10 11 12 13 14 15
% C
14.9 10.8 17.4 19.9 17.8 15.8 13.2 13 .3 16.9 19.2 22.8 27.8 28.4 29.1 29.6

u d M d M 8
* I n r J I n l - l m m . . . . - L o o 0 0 -
a, I
v1 2 2 H
H
d
0" 8
Q
2 Q)
y-l s
2 0 c U
111
y-c 0
T r o m m v m m c o
00000 . * . . X s
Td 2= rrl u
a,
F 4 E 8
0 4 y-c 0" o s
c, 5 u
c, 5 u

lm b. 0
I 0 m
FL( x
Fcl x
,
. . n r n y". ; L O O N

c u t
1
2
4
5 --
Residue
6.9
3.0
1.0
2.4
1.5
TABLE XXVIII
MODEL VI1
Analysis of Residues
%Si Calc. a s sic i.s.* i.s.
0.5 0.7
0.15 0.2
0.3 0.4
0.3 0.4
sic %Na
i.s.
0.7
0.2
0.35
0.35
%Fe
0.05
0.08
0.3
0.03
0.03
%A1
0.1
0.06
0.25
0*05 I 1 0.06
* = insufficient sample

PART 1x1
.)
Char Depth in.
0.36
TABLE I
Char Density as a Function of Depth for Model 2
Layer No.
1 2 3 4 5 6 7 8 9 10 11 12 13 14 15
Xstance From Thickness of 'op Surface in. Layer in.
1.017 0.017 .043 .026 ,074 .031 * 099 .025 .128 .029 .155 .027 .186 .031 .216 .030 .243 .027 .275 .032 .302 .027 .327 .025 .356 .029 .3 74 .018 ,824 .025
Volume cc
0. 028ta . 1668b .4145 .7256' ,8162'
.8724
.8443'
.9005 . 7598c
.7019'
.7703'
.3327d ,7239
.7599;
,7599:
a 2 V = & \ 6 (3r, + hr2)
2 bV = x h 2 6 (3rf2+ 3r2 +h2
Neigh5 g
I . 0170 .0969 .2079 ,2417 .2774 .2840 .2774 .2720 .2534 ,2635 .1343 .1476 .1887 .1014 .4 312
3.608 .58f
.245
.305 ,596
Cv =D 2 H - (approx. .02cc)
2 d V = D H - (.O~CC)

PART I11
Char Depth in.
.28
TABLE I1
Char Density as a Function of Depth for Model 4
Layer No.
1 2 3 4 5 6 7 8 9 10 11 12 13 14 15
Distance From cop Surface, in.
3.021 043
.064
.085
.lo9
.132
.152
.174
.198
.219
.243
.267
.291
.315 ,803
a 2 2 V = a h l (3rl + hl
6
-T----- Yeight , g Density I g/cc
1.0390 0.557 1343 .603
.1935 .318
.2 715 .44 t
.3310 ,476
.1904 .286
.2541 .439
.2254 354 ,1877 .270 .1865 .307
2 2 bV = a h 2 (3r1 + 3r22 +h2 ) 6

PART I11
TABLE I11
Char Density as a Function of Depth for Model 6
Char Depth inches
.36
Char Depth inches
.48
1 2 3 4 5 6 7 8 9 10 11 12 13 14 15
Distance From Top Surface, in.
0.020 .043 .064 ,084 .lo6 .128 .149 .173 .196 .237 ,260 .283 .302 .322 .832
Ihickness of ,ayer , in.
1.020 .023 .021 .020 .u22 .022 .021 ,024 .023 .041 .023 .023 .019 .020 .037
Volume, cc
0.2896 .3330 .6081 .5792 .6370 .6371 .6081 6950 . 666OC .9 776 .4995 .4440 .4814 ,5792
1.071
Ueight, g
0.1220 .1753 .2096 .2350 .2586 .2196 .2281 .2019 .1855 .2636 .lo80 ,1059 .1783 .2094 .6411
lensity g/cc
1.421 .526 .345 .406 ,406 345
.375
.291
.278
.270 216 238
.370
.362
.598
C 2 V = D h - (.14cc)
TABLE IV
Char Der
Layer No.
0.027 .067 .080 .398
virgin
0.027 .040 .013 .044 .042
0.0188f . 1305 . 1903b 1.274 .l:*215
a 2 2 V = a h l (3rl + hl )
6
2 2 2 bV=IIh2 (3r1 +3r2 + h2 ) 6
0 0089 .0378 .lo95 .3563 .7173
0.472 .290 .575 .280 .590