In vivo NAD assay reveals the intracellular NAD contents and … · In vivo NAD assay reveals the...
6
In vivo NAD assay reveals the intracellular NAD contents and redox state in healthy human brain and their age dependences Xiao-Hong Zhu 1 , Ming Lu, Byeong-Yeul Lee, Kamil Ugurbil, and Wei Chen 1 Center for Magnetic Resonance Research, Department of Radiology, University of Minnesota Medical School, Minneapolis, MN 55455 Edited by Marcus E. Raichle, Washington University in St. Louis, St. Louis, MO, and approved January 27, 2015 (received for review September 16, 2014) NAD is an essential metabolite that exists in NAD + or NADH form in all living cells. Despite its critical roles in regulating mitochon- drial energy production through the NAD + /NADH redox state and modulating cellular signaling processes through the activity of the NAD + -dependent enzymes, the method for quantifying intracellu- lar NAD contents and redox state is limited to a few in vitro or ex vivo assays, which are not suitable for studying a living brain or organ. Here, we present a magnetic resonance (MR) -based in vivo NAD assay that uses the high-field MR scanner and is capable of noninvasively assessing NAD + and NADH contents and the NAD + /NADH redox state in intact human brain. The results of this study provide the first insight, to our knowledge, into the cellular NAD concentrations and redox state in the brains of healthy vol- unteers. Furthermore, an age-dependent increase of intracellular NADH and age-dependent reductions in NAD + , total NAD contents, and NAD + /NADH redox potential of the healthy human brain were revealed in this study. The overall findings not only provide direct evidence of declined mitochondrial functions and altered NAD ho- meostasis that accompany the normal aging process but also, eluci- date the merits and potentials of this new NAD assay for non- invasively studying the intracellular NAD metabolism and redox state in normal and diseased human brain or other organs in situ. redox state | NAD | in vivo 31 P MR spectroscopy | human brain | aging N AD, a multifunctional metabolite found in all living cells, has been the interest of many scientific investigations since its discovery in the early 20th century (1). NAD is known to convert between its oxidized NAD + and reduced NADH forms during the breakdown of nutrients; hence, the intracellular NAD + /NADH redox state reflects the metabolic balance of the cell in generating ATP energy through oxidative phosphorylation in mitochondria and/or glycolysis in cytosol (2). More recently, after several protein families associated with cell survival were found to use NAD + as their main substrate with activities also regulated by the availability of the NAD + , the full extent of the NAD’s function as a metabolic regulator began to unfold (3–5). A growing number of studies have indicated that NAD + can modulate metabolic signaling pathways and mediate important cellular processes, including calcium homeostasis, gene expres- sion, aging, degeneration, and cell death; therefore, the cellular NAD could serve as a therapeutic target for treating various met- abolic or age-related diseases and promoting longevity (6–12). Despite the critical relevance of the intracellular NAD me- tabolism to human health and diseases, assessment of NAD contents and NAD + /NADH redox state is extremely challenging. Only a few invasive techniques based on biochemical assays or autofluorescence methods have been used to analyze tissue samples or cell extracts (13, 14). However, during the prepara- tion of such ex vivo sample, the NAD + and NADH contents are likely altered, because they are highly sensitive to pH, temper- ature, light, and chemical agent or buffer solution. Thus, accu- rate quantification and extrapolation to in vivo conditions are difficult, even with the well-established biochemical assays (15). In addition, NAD + does not fluoresce and thus, cannot be detected by fluorometry (16). Clearly, a nondestructive detection and quan- tification method is highly desired to investigate the NAD contents and redox state in the human body or intact animal models. Recently, we have developed a novel magnetic resonance (MR) -based quantification approach that uses a high-field MR scanner to obtain the endogenous 31 P MR signals of the NAD molecules in intact animal brains (17). Distinct from earlier 31 P MR spectros- copy (MRS) studies that reported total NAD contents (18–20), our approach is able to resolve the MR signal of NADH from that of NAD + by taking advantage of their specific spectroscopic charac- teristics at a given magnetic field strength that can be precisely predicted based on a theoretical model (17). Thus, both NAD + and NADH can be quantified simultaneously by matching the in vivo NAD spectra with the model-simulated spectra. It has been shown that this approach works well in animal brains at ultrahigh fields of 9.4 and 16.4 T (17). In this study, we further exploit the feasibility and potential of this novel approach for noninvasive assessment of intracellular NAD + and NADH contents and NAD + /NADH redox state in healthy human brains using a 7-T human MR scanner and ultimately, studying their roles in human aging. Results In Vivo 31 P MRS of Human Brain at 7 T. Fig. 1 displays the in vivo 31 P MR spectra acquired from the occipital lobes in two repre- sentative healthy subjects with different ages. In addition to the commonly observed phosphorus metabolites, such as phospho- creatine (PCr), ATP (γ-, α-, and β-ATP), P i , phosphomonoester, Significance Decline in NAD + availability and abnormal NAD + /NADH redox state are tightly linked to age-related metabolic diseases and neurodegenerative disorders. To better understand the roles of NAD metabolism and redox state in health and disease, it is important to assess the intracellular NAD and redox state in situ. We report herein the first in vivo NAD assay, to our knowledge, that is capable of noninvasively and simultaneously measuring intracellular NAD + and NADH concentrations and NAD + /NADH ratio in the human brain and detecting the age- dependent changes in NAD contents and redox state associated with the normal aging. This method can potentially be applied to study various metabolic and neurodegenerative disorders by monitoring the NAD and redox state changes associated with disease progression or treatment in human patients. Author contributions: X.-H.Z. and W.C. designed research; X.-H.Z. and B.-Y.L. performed research; M.L. and W.C. contributed new reagents/analytic tools; X.-H.Z. and M.L. analyzed data; X.-H.Z., K.U., and W.C. wrote the paper. The authors declare no conflict of interest. This article is a PNAS Direct Submission. 1 To whom correspondence may be addressed. Email: [email protected] or wei@cmrr. umn.edu. This article contains supporting information online at www.pnas.org/lookup/suppl/doi:10. 1073/pnas.1417921112/-/DCSupplemental. 2876–2881 | PNAS | March 3, 2015 | vol. 112 | no. 9 www.pnas.org/cgi/doi/10.1073/pnas.1417921112 Downloaded by guest on February 26, 2020
Transcript of In vivo NAD assay reveals the intracellular NAD contents and … · In vivo NAD assay reveals the...

In vivo NAD assay reveals the intracellular NADcontents and redox state in healthy human brain andtheir age dependencesXiao-Hong Zhu1, Ming Lu, Byeong-Yeul Lee, Kamil Ugurbil, and Wei Chen1
Center for Magnetic Resonance Research, Department of Radiology, University of Minnesota Medical School, Minneapolis, MN 55455
Edited by Marcus E. Raichle, Washington University in St. Louis, St. Louis, MO, and approved January 27, 2015 (received for review September 16, 2014)
NAD is an essential metabolite that exists in NAD+ or NADH formin all living cells. Despite its critical roles in regulating mitochon-drial energy production through the NAD+/NADH redox state andmodulating cellular signaling processes through the activity of theNAD+-dependent enzymes, the method for quantifying intracellu-lar NAD contents and redox state is limited to a few in vitro or exvivo assays, which are not suitable for studying a living brain ororgan. Here, we present a magnetic resonance (MR) -based in vivoNAD assay that uses the high-field MR scanner and is capableof noninvasively assessing NAD+ and NADH contents and theNAD+/NADH redox state in intact human brain. The results of thisstudy provide the first insight, to our knowledge, into the cellularNAD concentrations and redox state in the brains of healthy vol-unteers. Furthermore, an age-dependent increase of intracellularNADH and age-dependent reductions in NAD+, total NAD contents,and NAD+/NADH redox potential of the healthy human brain wererevealed in this study. The overall findings not only provide directevidence of declined mitochondrial functions and altered NAD ho-meostasis that accompany the normal aging process but also, eluci-date the merits and potentials of this new NAD assay for non-invasively studying the intracellular NAD metabolism and redoxstate in normal and diseased human brain or other organs in situ.
redox state | NAD | in vivo 31P MR spectroscopy | human brain | aging
NAD, a multifunctional metabolite found in all living cells,has been the interest of many scientific investigations since
its discovery in the early 20th century (1). NAD is known toconvert between its oxidized NAD+ and reduced NADH formsduring the breakdown of nutrients; hence, the intracellularNAD+/NADH redox state reflects the metabolic balance of thecell in generating ATP energy through oxidative phosphorylationin mitochondria and/or glycolysis in cytosol (2). More recently,after several protein families associated with cell survival werefound to use NAD+ as their main substrate with activities alsoregulated by the availability of the NAD+, the full extent of theNAD’s function as a metabolic regulator began to unfold (3–5).A growing number of studies have indicated that NAD+ canmodulate metabolic signaling pathways and mediate importantcellular processes, including calcium homeostasis, gene expres-sion, aging, degeneration, and cell death; therefore, the cellularNAD could serve as a therapeutic target for treating various met-abolic or age-related diseases and promoting longevity (6–12).Despite the critical relevance of the intracellular NAD me-
tabolism to human health and diseases, assessment of NADcontents and NAD+/NADH redox state is extremely challenging.Only a few invasive techniques based on biochemical assays orautofluorescence methods have been used to analyze tissuesamples or cell extracts (13, 14). However, during the prepara-tion of such ex vivo sample, the NAD+ and NADH contents arelikely altered, because they are highly sensitive to pH, temper-ature, light, and chemical agent or buffer solution. Thus, accu-rate quantification and extrapolation to in vivo conditions aredifficult, even with the well-established biochemical assays (15).
In addition, NAD+ does not fluoresce and thus, cannot be detectedby fluorometry (16). Clearly, a nondestructive detection and quan-tification method is highly desired to investigate the NAD contentsand redox state in the human body or intact animal models.Recently, we have developed a novel magnetic resonance (MR)
-based quantification approach that uses a high-field MR scannerto obtain the endogenous 31P MR signals of the NAD molecules inintact animal brains (17). Distinct from earlier 31P MR spectros-copy (MRS) studies that reported total NAD contents (18–20), ourapproach is able to resolve the MR signal of NADH from that ofNAD+ by taking advantage of their specific spectroscopic charac-teristics at a given magnetic field strength that can be preciselypredicted based on a theoretical model (17). Thus, both NAD+ andNADH can be quantified simultaneously by matching the in vivoNAD spectra with the model-simulated spectra. It has been shownthat this approach works well in animal brains at ultrahigh fields of9.4 and 16.4 T (17). In this study, we further exploit the feasibilityand potential of this novel approach for noninvasive assessment ofintracellular NAD+ and NADH contents and NAD+/NADH redoxstate in healthy human brains using a 7-T human MR scanner andultimately, studying their roles in human aging.
ResultsIn Vivo 31P MRS of Human Brain at 7 T. Fig. 1 displays the in vivo31P MR spectra acquired from the occipital lobes in two repre-sentative healthy subjects with different ages. In addition to thecommonly observed phosphorus metabolites, such as phospho-creatine (PCr), ATP (γ-, α-, and β-ATP), Pi, phosphomonoester,
Significance
Decline in NAD+ availability and abnormal NAD+/NADH redoxstate are tightly linked to age-related metabolic diseases andneurodegenerative disorders. To better understand the rolesof NAD metabolism and redox state in health and disease, itis important to assess the intracellular NAD and redox statein situ. We report herein the first in vivo NAD assay, to ourknowledge, that is capable of noninvasively and simultaneouslymeasuring intracellular NAD+ and NADH concentrations andNAD+/NADH ratio in the human brain and detecting the age-dependent changes in NAD contents and redox state associatedwith the normal aging. This method can potentially be appliedto study various metabolic and neurodegenerative disorders bymonitoring the NAD and redox state changes associated withdisease progression or treatment in human patients.
Author contributions: X.-H.Z. and W.C. designed research; X.-H.Z. and B.-Y.L. performedresearch; M.L. and W.C. contributed new reagents/analytic tools; X.-H.Z. and M.L. analyzeddata; X.-H.Z., K.U., and W.C. wrote the paper.
The authors declare no conflict of interest.
This article is a PNAS Direct Submission.1To whom correspondence may be addressed. Email: [email protected] or [email protected].
This article contains supporting information online at www.pnas.org/lookup/suppl/doi:10.1073/pnas.1417921112/-/DCSupplemental.
2876–2881 | PNAS | March 3, 2015 | vol. 112 | no. 9 www.pnas.org/cgi/doi/10.1073/pnas.1417921112
Dow
nloa
ded
by g
uest
on
Feb
ruar
y 26
, 202
0

and phosphodiester, the resonances on the right-side shoulder ofthe α-ATP were identified as NAD+ and NADH. These spectrarepresent the high-quality in vivo 31P MRS data obtainable fromthe human brain at 7 T with a relatively short acquisition time of16 min. In particular, the excellent signal-to-noise ratio (SNR) ofthe 31P spectra (SNRPCr = 216 ± 24 and SNRα-ATP = 91 ± 7; n =11) ensured reliable spectral fitting and NAD quantification.Although it is difficult to determine the actual SNRs of NADand NADH because of their complex spectral patterns and signaloverlapping, we were able to measure the SNR of 17 ± 2 (n = 11)for the right-side apparent NAD doublet, which is mainly at-tributed to the NAD+ signal, and the SNR of 23 ± 2 (n = 11) forthe left-side apparent NAD doublet, which are the superimposedNAD+ and NADH signals, respectively.
NAD Quantification in Human Brain at 7 T. Fig. 1 A, Inset and B, Insetdisplays the experimentally measured (Fig. 1, gray traces) andmodel-fitted (Fig. 1, red traces) spectra within the chemical shiftrange that contain the NAD+, NADH, and α-ATP resonances.The NAD quantification was done by the least-square fitting ofthe in vivo NAD spectra to the NAD model simulation atthe field strength of 7 T. The individual spectrum of NAD+
(a quartet with different chemical shifts and peak ratios that arefield-dependent) and NADH (a singlet with a field-independentchemical shift) as well as their combined resonance signals at 7 Twith different resonance linewidths (LWs; e.g., LW = 8, 16, and24 Hz) and a typical NAD+/NADH ratio of four were exempli-fied in Fig. S1. Fig. S1 illustrates how the NAD spectra evolvewith increasing resonance LWs, which mimics the sample con-ditions from an ex vivo solution toward in vivo tissue. Therefore,in an intact brain, the five sharp peaks that characterize the spec-trum of NAD+ and NADHmixture merge into an apparent doubletshown in Fig. 2, which also includes the α-ATP resonance in the
combined spectra. Fig. 2A displays the simulated individual spectraof NAD+ and NADH or combined spectra of NADH plus NAD+
and α-ATP plus NADs. The corresponding spectra are shown inFig. 2B, which displays the in vivo spectrum of a human brain (Fig.2B, row 1) and the decomposition to its individual components.Strikingly, the real and simulated spectra are almost identical, ex-cept for the noise contained in the in vivo data. This result is con-sistent with the small fitting residues seen in Fig. 1 A, Inset and B,Inset and suggests that the NAD quantification method is capa-ble of differentiating the NAD+ and NADH signals detected by invivo 31P MRS in the human brain.By using the α-ATP resonance signal as an internal standard and
assuming [ATP] = 2.8 mM in the normal brain tissue (17, 21, 22),we were able to noninvasively obtain quantitative data for thehuman brain on 17 healthy subjects spanning the ages of 21–68 yold. The results yielded the following intracellular concentrations:[NAD+] = 0.30 ± 0.02 mM or 0.27 ± 0.02 μmol/g (after a unitconversion using a brain tissue density of 1.1 g wet brain tissue per1 mL), [NADH] = 0.06 ± 0.01 mM or 0.06 ± 0.01 μmol/g, and totalNAD ([NAD]total = [NAD+] + [NADH]) = 0.37 ± 0.02 mM or0.34 ± 0.02 μmol/g. Consequently, the intracellular NAD+/NADHredox ratio (RX; RX = [NAD+]/[NADH]) and redox potential(RP) were calculated to be 4.8 ± 0.9 and −299.3 ± 2.5 mV,respectively.
Reproducibility and Reliability of the in Vivo NAD Assay. To evaluatethe reproducibility of the MR-based in vivo NAD assay, we per-formed repeated measurements in the same subject either withinthe same scan session or on two different days. The results aresummarized in Fig. S2. The fact that all of the data points are at ornear the identity line between the first and second measurementsindicates high reproducibility of the assay. This finding is alsoconsistent with the small test–retest coefficient of variance (CV)
β-ATP
α-ATPγ-ATP
PCr
PDEPMEPi
NADH & NAD+
β-ATP
α-ATPγ-ATP
PCr
PDEPME
Pi
NADH & NAD+
Original
Fitting
Residual
-9.5 -10.5 (ppm)
Original
Fitting
Residual
-9.5 -10.5 (ppm)
Chemical Shift (ppm)6 2 -2 -6 -14-10 -18
2018161412108646
Chemical Shift (ppm)6 2 -2 -6 -14-10 -18
A
B
Fig. 1. In vivo 31P MR spectra of two representative subjects at ages (A) 36and (B) 52 y old. They were obtained within 16 min from human occipitallobe, where the 31P coil (5 cm in diameter) sensitivity profile was verified byin vivo 31P chemical shift imaging in a previous study (19). Insets display theexpanded spectra in the chemical shift range from −9.0 to −11.5 ppm withthe original in vivo 31P signals (gray) and the total signals (red) of α-ATP andNAD determined by the model fitting. The individual fitting components ofα-ATP (blue), NAD+ (black), and NADH (green) and the residual signal of thefitting are also shown. The quantification results of NAD+/NADH ratio (RX)of (A) 4.8 and (B) 3.4 indicate a lower redox state for the older subject. PDE,phosphodiester; PME, phosphomonoester.
−11.5−11−10.5−10−9.5−9
−11.5−11−10.5−10−9.5−9
0
20
40
60
80
100
0
5
10
15
−11.5−11−10.5−10−9.5−9
0
5
10
15
0
2
4
6
8
10
α-ATP
NADH & NAD+
NADH & NAD+
NADH
NAD+
-9 -10 -11Chemical Shift (ppm)
-9 -10 -11Chemical Shift (ppm)
α-ATP
NADH & NAD+
NADH & NAD+
NADH
NAD+
A B
Fig. 2. Simulated and in vivo 31P MR spectra of the human brain at 7 T.(A) Model-simulated spectra of NAD+ quartet, NADH singlet, total NAD,and combined α-ATP and NAD signals with an HLW of 18 Hz and an NAD+/NADHRX of 3.35. (B) Experimentally measured in vivo 31P MR spectra of humanoccipital lobe processed with 10-Hz line broadening that have the sameHLW and RX values as the simulated spectra in A. The individual andcombined in vivo spectra of NAD+, NADH, and total NAD were obtainedby subtracting corresponding fitting components from the original brainspectra.
Zhu et al. PNAS | March 3, 2015 | vol. 112 | no. 9 | 2877
NEU
ROSC
IENCE
Dow
nloa
ded
by g
uest
on
Feb
ruar
y 26
, 202
0
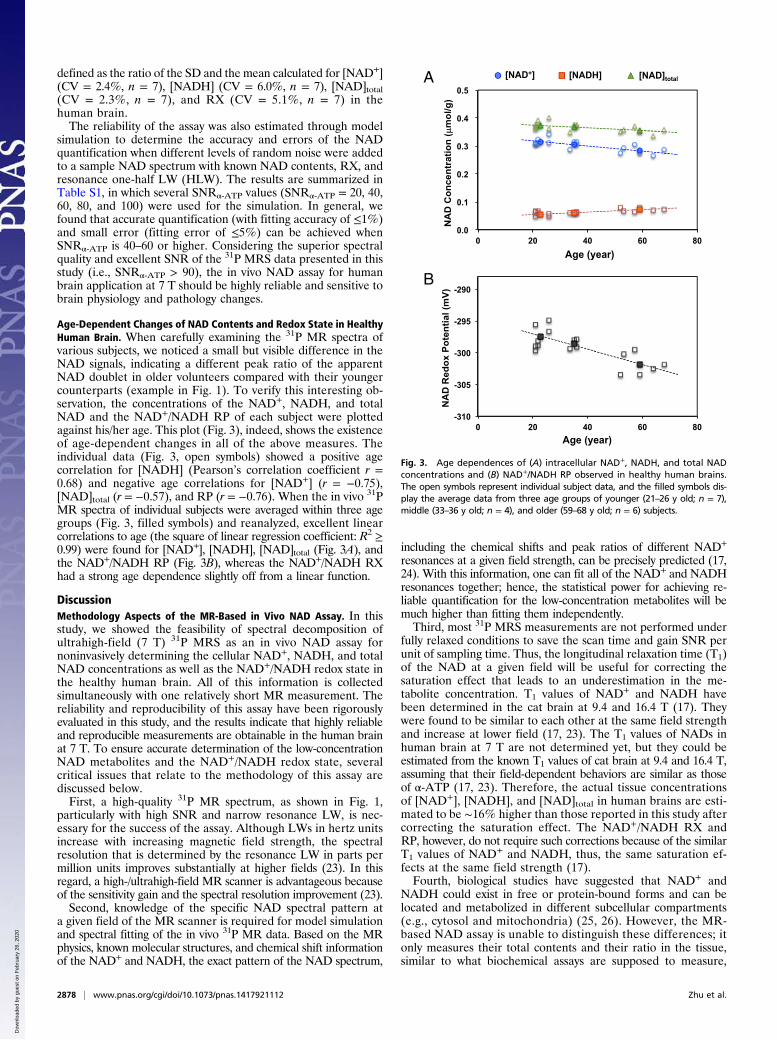
defined as the ratio of the SD and the mean calculated for [NAD+](CV = 2.4%, n = 7), [NADH] (CV = 6.0%, n = 7), [NAD]total(CV = 2.3%, n = 7), and RX (CV = 5.1%, n = 7) in thehuman brain.The reliability of the assay was also estimated through model
simulation to determine the accuracy and errors of the NADquantification when different levels of random noise were addedto a sample NAD spectrum with known NAD contents, RX, andresonance one-half LW (HLW). The results are summarized inTable S1, in which several SNRα-ATP values (SNRα-ATP = 20, 40,60, 80, and 100) were used for the simulation. In general, wefound that accurate quantification (with fitting accuracy of ≤1%)and small error (fitting error of ≤5%) can be achieved whenSNRα-ATP is 40–60 or higher. Considering the superior spectralquality and excellent SNR of the 31P MRS data presented in thisstudy (i.e., SNRα-ATP > 90), the in vivo NAD assay for humanbrain application at 7 T should be highly reliable and sensitive tobrain physiology and pathology changes.
Age-Dependent Changes of NAD Contents and Redox State in HealthyHuman Brain. When carefully examining the 31P MR spectra ofvarious subjects, we noticed a small but visible difference in theNAD signals, indicating a different peak ratio of the apparentNAD doublet in older volunteers compared with their youngercounterparts (example in Fig. 1). To verify this interesting ob-servation, the concentrations of the NAD+, NADH, and totalNAD and the NAD+/NADH RP of each subject were plottedagainst his/her age. This plot (Fig. 3), indeed, shows the existenceof age-dependent changes in all of the above measures. Theindividual data (Fig. 3, open symbols) showed a positive agecorrelation for [NADH] (Pearson’s correlation coefficient r =0.68) and negative age correlations for [NAD+] (r = −0.75),[NAD]total (r = −0.57), and RP (r = −0.76). When the in vivo 31PMR spectra of individual subjects were averaged within three agegroups (Fig. 3, filled symbols) and reanalyzed, excellent linearcorrelations to age (the square of linear regression coefficient: R2 ≥0.99) were found for [NAD+], [NADH], [NAD]total (Fig. 3A), andthe NAD+/NADH RP (Fig. 3B), whereas the NAD+/NADH RXhad a strong age dependence slightly off from a linear function.
DiscussionMethodology Aspects of the MR-Based in Vivo NAD Assay. In thisstudy, we showed the feasibility of spectral decomposition ofultrahigh-field (7 T) 31P MRS as an in vivo NAD assay fornoninvasively determining the cellular NAD+, NADH, and totalNAD concentrations as well as the NAD+/NADH redox state inthe healthy human brain. All of this information is collectedsimultaneously with one relatively short MR measurement. Thereliability and reproducibility of this assay have been rigorouslyevaluated in this study, and the results indicate that highly reliableand reproducible measurements are obtainable in the human brainat 7 T. To ensure accurate determination of the low-concentrationNAD metabolites and the NAD+/NADH redox state, severalcritical issues that relate to the methodology of this assay arediscussed below.First, a high-quality 31P MR spectrum, as shown in Fig. 1,
particularly with high SNR and narrow resonance LW, is nec-essary for the success of the assay. Although LWs in hertz unitsincrease with increasing magnetic field strength, the spectralresolution that is determined by the resonance LW in parts permillion units improves substantially at higher fields (23). In thisregard, a high-/ultrahigh-field MR scanner is advantageous becauseof the sensitivity gain and the spectral resolution improvement (23).Second, knowledge of the specific NAD spectral pattern at
a given field of the MR scanner is required for model simulationand spectral fitting of the in vivo 31P MR data. Based on the MRphysics, known molecular structures, and chemical shift informationof the NAD+ and NADH, the exact pattern of the NAD spectrum,
including the chemical shifts and peak ratios of different NAD+
resonances at a given field strength, can be precisely predicted (17,24). With this information, one can fit all of the NAD+ and NADHresonances together; hence, the statistical power for achieving re-liable quantification for the low-concentration metabolites will bemuch higher than fitting them independently.Third, most 31P MRS measurements are not performed under
fully relaxed conditions to save the scan time and gain SNR perunit of sampling time. Thus, the longitudinal relaxation time (T1)of the NAD at a given field will be useful for correcting thesaturation effect that leads to an underestimation in the me-tabolite concentration. T1 values of NAD+ and NADH havebeen determined in the cat brain at 9.4 and 16.4 T (17). Theywere found to be similar to each other at the same field strengthand increase at lower field (17, 23). The T1 values of NADs inhuman brain at 7 T are not determined yet, but they could beestimated from the known T1 values of cat brain at 9.4 and 16.4 T,assuming that their field-dependent behaviors are similar as thoseof α-ATP (17, 23). Therefore, the actual tissue concentrationsof [NAD+], [NADH], and [NAD]total in human brains are esti-mated to be ∼16% higher than those reported in this study aftercorrecting the saturation effect. The NAD+/NADH RX andRP, however, do not require such corrections because of the similarT1 values of NAD+ and NADH, thus, the same saturation ef-fects at the same field strength (17).Fourth, biological studies have suggested that NAD+ and
NADH could exist in free or protein-bound forms and can belocated and metabolized in different subcellular compartments(e.g., cytosol and mitochondria) (25, 26). However, the MR-based NAD assay is unable to distinguish these differences; itonly measures their total contents and their ratio in the tissue,similar to what biochemical assays are supposed to measure,
-310
-305
-300
-295
-290
0 20 40 60 80 Age (year)
NA
D R
edox
Pot
entia
l (m
V)
[NAD+] [NADH] [NAD]total
NA
D C
once
ntra
tion
(µm
ol/g
)
0.0
0.1
0.2
0.3
0.4
0.5
0 20 40 60 80 Age (year)
A
B
Fig. 3. Age dependences of (A) intracellular NAD+, NADH, and total NADconcentrations and (B) NAD+/NADH RP observed in healthy human brains.The open symbols represent individual subject data, and the filled symbols dis-play the average data from three age groups of younger (21–26 y old; n = 7),middle (33–36 y old; n = 4), and older (59–68 y old; n = 6) subjects.
2878 | www.pnas.org/cgi/doi/10.1073/pnas.1417921112 Zhu et al.
Dow
nloa
ded
by g
uest
on
Feb
ruar
y 26
, 202
0

albeit in ex vivo samples (17). Earlier studies using the metab-olite indicator method with the equilibrium assumption of en-zymatic reactions had calculated redox state of free NADs incytoplasm and shown that it can be over 100 times higher thanthat of mitochondria (27). However, experimental measurementsin isolated rat hypatocytes (28) reveal that, although the in-dividual concentrations of NAD+ and NADH were significantlydifferent in cytosol and mitochondria, the total (free plus bound)NAD+/NADH ratios in the two compartments were, in fact, inthe same magnitude (i.e., ∼2.4 in cytosol vs. 9.4 in mitochon-drion). Therefore, after considering the variation of the mito-chondrial contents and the corresponding compartmentaldistribution of NADs in different cell types (25, 26), we believethat the in vivo NAD assay measures the mean contributionsfrom both mitochondrial and cytosolic pools. The experimentalevidences obtained in animal and human brains as shown in thisand previous (table 4 in ref. 17) studies support this notion.
Physiological Implication of the in Vivo NAD Assay Findings. By ap-plying this new MR measurement of NAD, we were able todetermine the intracellular NAD+ and NADH concentrationsand the NAD+/NADH redox state in the brains of healthy vol-unteers while they were resting inside an MR scanner. To ourknowledge, these values in the human brain have never beenreported before owing to the lack of appropriate detectionmethods; they are within the range of the literature valuesobtained in rodent brains with in vitro or ex vivo methods (ref.17, references therein and table 4). Therefore, we anticipate thatthe NAD contents and redox states of human brain as reportedherein could provide a valuable reference for future studiesaiming to understand the roles of the NAD and NAD+/NADH redox state and their alterations in healthy and diseasedhuman brains. Consequently, the values of NAD contents andratios obtained with the in vivo NAD assay could become a newgold standard as long as the concentration of ATP or other quan-tifiable resonances in the 31P spectrum have been accurately de-termined and sufficient SNR and appropriate correction for sat-uration effects are attained.NAD plays two distinct roles in regulating cellular metabolism
and signaling as schematically summarized in Fig. 4. NAD couldfunction as a coenzyme and participate in many important oxi-dative–reductive reactions of the cellular respiration processes,where the NAD+/NADH ratio regulates the energy production.In the brain, most NADH molecules are produced (from NAD+)during the breakdown of glucose through glycolysis (two NADH)in cytosol, pyruvate decarboxylation (two NADH), and the tri-carboxylic acid (TCA) cycle (six NADH) in mitochondria. TheNADH molecules as the electron donor are converted back toNAD+ in the mitochondrial electron transport chain, whereasthe oxygen (O2) molecules receive the electron; the energy har-vested in this process is used to drive the ATP synthesis (Fig. 4).Therefore, the NADH production is tightly linked to the braincarbohydrate metabolism and reflects the cerebral metabolicrate of glucose (CMRglc). In contrast, the NAD+ production islinked to the electron transport chain reactions and reflects thecerebral metabolic rate of oxygen (CMRO2). These processesare regulated by the intracellular NAD+/NADH redox state,which determines the metabolic balance between the cellularcarbohydrate and oxygen metabolisms in supporting the brainATP energy under normal or diseased condition (2, 29, 30).We hypothesize that the intracellular NAD+/NADH RX couldprovide a single valuable measure directly linking to the met-abolic oxygen-to-glucose index defined by the CMRO2/CMRglcratio, which is an essential biomarker of the neuroenergetics forvarious brain states (31).In this study, we found a gradual but significant decline in the
human brain NAD+/NADH RX (or RP) associated with a de-creasing NAD+ level and an increasing NADH level in the process
of healthy aging. Various biological factors could contribute to theslow declines in mitochondrial metabolism efficiency and func-tionality during aging (32). Among them, the cellular NAD con-tents and NAD+/NADH redox state are expected to play crucialroles (33). The strong age dependences of intracellular [NAD+],[NADH], RX, and RP observed in this study provide the first invivo evidence, to our knowledge, that connects human aging to thechanges in cerebral NAD contents and redox state. This finding isin agreement with ex vivo studies showing the same trends of NADchanges found in rodent brains of different age groups (34, 35).The decline in brain NAD+/NADH RX suggests a significant
shift of the glucose–oxygen metabolic balance toward sloweroxygen metabolism and oxidative phosphorylation in the mito-chondria, resulting in a lower ATP production rate in aging brains.Significant CMRO2 reduction and relatively constant CMRglc(i.e., a reduced oxygen-to-glucose index) in older people havebeen reported (36, 37). Moreover, the notion that age-induceddecrease in NAD+/NADH RX reflects deficiency in mitochondrialcapacity for oxidative phosphorylation is also supported by sig-nificant decreases (e.g., 15–34%) in respiratory enzyme (com-plexes I–V) activities observed in aged mice brains (38), which is inline with another human brain study showing an ∼30% reductionin both neuronal oxidative glucose metabolism and neurotrans-mission cycling rates in elderly people (39). A similar reduction(∼40%) of mitochondrial oxidative and phosphorylation activitieswas also observed in the human skeletal muscle during healthyaging, suggesting that the decline in mitochondrial functionalityshould be a global phenomenon in the aging process (40).In addition to governing energy homeostasis through regulat-
ing the NAD+/NADH redox state, the biosynthesis and catabo-lism of NAD+ can influence the activity of various enzymes thatmediates metabolic processes in the cell. As shown in Fig. 4, Right,NAD+ could also function as a cosubstrate for several classes
Abnormalities
NAD as co-Enzyme
Energy Production
Redox state [NAD+][NADH]
NAD+
Reduction of NAD+
NADH
TCA
Oxidation of NADH
glycolysis &
Mitochondria Complex I
cycle
O 2
H2OADP
ATP
NAD Redox & Metabolic Balance
Cellular Signaling
[NAD+] Content
poly(ADP-ribose) polymerases (PARPs)
cADP-ribose synthases (CD38)
Sirtuins(SIRT1-7)
NAD+-consuming Enzyme Activity
NAD as co-Substrate
Mitochondrial dysfunction Neurodegeneration
Fig. 4. A simplified scheme summaries the major functions of intracellularNAD: NAD as a coenzyme in regulating the glucose–oxygen metabolic bal-ance that controls the cerebral ATP energy production through the NAD+/NADH redox state (Left), and NAD+ as a cosubstrate in modulating theactivities of the NAD+-consuming enzymes that mediate the cellular sig-naling processes through the availability of cellular NAD+ (Right). The ab-normality in either one or both of these functions could lead to mitochondrialdysfunction, neurodegeneration, or age-related metabolic disorders.
Zhu et al. PNAS | March 3, 2015 | vol. 112 | no. 9 | 2879
NEU
ROSC
IENCE
Dow
nloa
ded
by g
uest
on
Feb
ruar
y 26
, 202
0

of NAD+-consuming enzymes, including poly(ADP ribose) poly-merases (PARPs), cADP ribose synthases (CD38), and sirtuins(SIRTs; SIRT1–7). These enzymes were found to play importantroles in cellular signaling related to cell death, Ca2+ homeostasis,and lifespan extension, and their activities are highly dependenton the level of NAD+ available in the cell (4, 5, 8, 9, 33, 41, 42).In this study, other than the decreases in the intracellular
NAD+ level and RX (or RP), we also observed a slower declineof the total intracellular NAD content in the human brain duringhealthy aging, which collectively reflects reduced NAD+ avail-ability in the aged brain. One additional note is that the actualreduction of the intracellular NAD pool could be even morethan what has been shown here if the brain ATP level is notconstant, which is presumed in this study, but rather, decreasedas people aged. However, this uncertainty should not change themajor findings and conclusions of this work, particularly thefindings of the significant declines in [NAD+], [NAD]total, andRX or RP during the aging process, because the consideration ofpotential ATP decline, if existed, could further accelerate thedecline trends reported in this work. The trend of [NADH] in-crease, however, could be slightly slowed down after taking intoaccount declining ATP level. Additional studies are needed toaddress this question.Another note is related to the criterion for identifying the
normal subjects in this study, which was based on the compre-hensive information provided on the consent form to ensure noobvious history of neurological or psychiatric diseases and nodrug or prescription medication for any brain disorder. Never-theless, a thorough medical examination would be helpful, be-cause many chronic and systematic medical conditions couldhave impact on the brain before clinical symptoms appear.However, we would anticipate better age dependence if suchinformation was available and if subjects with potential medicalproblems were excluded.Declined NAD+ levels were found to accompany higher
PARP and CD38 activity and lower ATP level and SIRT1 ac-tivity in older mice and significantly reduced lifespan in worms(8). It has been shown that, by supplying NAD+ precursors orintermediates and/or introducing PARPs or CD38 inhibitor, onecould enhance the NAD+ biosynthesis and/or inhibit its con-sumption, thus boosting the intracellular NAD+ level (6, 10, 11,43). Such interventions are suggested to promote therapeuticeffects of lifespan extension and neuroprotection and could po-tentially be used with other physiological managements, such ascalorie restriction, fasting, or exercise, to compensate for thenatural decline of brain NAD+ in normal aging and prevent ortreat age-related metabolic disorders (3, 4, 33, 44, 45).
Potential Uses of in Vivo NAD Assay. The potential applications ofthis NAD assay as a valuable tool for biomedical and clinicalresearch can be expected in several ways. (i) Although this studyfocused on the human occipital lobe, the same approach couldbe readily extended to image the spatial distribution of in-tracellular NAD concentrations and NAD+/NADH redox stateacross the entire human brain and monitor their longitudinalchanges in the brain and beyond (e.g., heart and muscle) withoutforeseeable obstacles. (ii) It allows evaluation of the intracellularNAD contents and redox state in diseased brain or brain regionsto compare them with the corresponding normal brain tissues;thus, it will open new frontiers for studying the central roles ofcellular NAD metabolism and redox state in human health andneurodegenerative diseases. (iii) This in vivo assay would providea new means to evaluate the efficacy of the disease-modifyingtreatment or therapeutic intervention through monitoring thechanges of the intracellular NAD content and redox state inaddition to other phosphorous metabolite information in dis-eased human brain or other organs.
In summary, this study presents a sensitive MR-based in vivoNAD assay that is capable of noninvasively assessing the in-tracellular NAD+, NADH, and total NAD contents and NAD+/NADH RX and RP in human brains. This technical advance-ment made it possible to obtain these important parameters inhealthy human brains and study their age-dependent changes insitu. The overall findings provide new insights regarding thecellular NAD+ availability in the brain, the link between theNAD+/NADH redox state and the cerebral metabolic balance,and their alterations associated with healthy aging. It is expectedthat this novel NAD assay should be highly valuable in biomedicaland/or clinical research fields aiming to study the intracellularNAD availability, the NAD+/NADH redox state, and their rela-tionships with mitochondrial dysfunction, neurodegeneration, ag-ing, and longevity.
MethodsIn Vivo 31P MRS Measurements of Human Brains. Seventeen human volunteers(age: 21–68 y; 10 males and 7 females) participated in this study, withwritten informed consent approved by the Institutional Review Board of theUniversity of Minnesota. All of them were healthy and had no history ofneurological or psychiatric diseases. Seven of these subjects (four males andthree females) were scanned two times either in the same session or on twodifferent days with the same study protocol.
1H MRI and 31P MRS measurements were conducted at 7 T with a 90-cmbore actively shielded human magnet paired with Siemens electronics andgradients using a radiofrequency (RF) probe placed underneath the humanoccipital lobe for data acquisition. This RF probe consisted of a butterfly-shaped 1H coil for anatomic imaging and B0 shimming and a single-loop 31Pcoil (diameter of 5 cm) for collecting in vivo 31P MRS data. The 31P spectrawere obtained from the human occipital lobes using the single-pulse acquiresequence with a 300-μs hard excitation pulse, a 3-s repetition time, and atotal scan number of 320 for signal averaging. The RF coil position and RFpulse flip angle were optimized to ensure that the detected in vivo 31P MRSsignals were mainly attributed from the human occipital lobe (19). The rawfree induced decays of the 31P MR data were zero-filled, and a line broad-ening of 5 or 10 Hz was applied before fast Fourier transformation for en-hancing the SNR. The SNR of the 31P MR spectra (line broadening = 5 Hz) wasevaluated using the PCr and α-ATP signals and calculated by dividing theresonance height by the peak-to-peak spectral noise and then multiplying itby 2.5 (23). The in vivo 31P MR spectrum of each subject (or for each mea-surement) was generated, and various phosphorous metabolites were assignedbased on their chemical shifts (δ) with that of PCr resonance set at −2.5 ppm asthe reference. The spectrum within the chemical shift range of −9 to −11.5 ppmthat contains α-ATP, NAD+, and NADH resonances was phased and baseline-drift corrected to ensure a symmetric α-ATP peak and flat spectral baselinebefore the NAD quantification was performed.
NAD Quantification and Spectral Model Simulation. The 31P MR spectra of NADat 7 T can be characterized as follows: NADH is a single resonance (withδNADH = −10.63 ppm), and α-ATP is a doublet (centered at δα-ATP = −10.07 ppmwith a J-coupling constant of 15.5 Hz), whereas the NAD+ has four res-onances (i.e., quartet). The chemical shifts and relative peak intensityratios among these NAD+ peaks at 7 T were determined based on the sec-ond-order coupling effect and calculated from their known values obtainedat 11.7 T (details in figure 1 in ref. 17). This information was applied to theNAD quantification model incorporated with a Matlab-based program forsimulating and/or fitting the spectra of α-ATP, NAD+, and NADH resonancesthrough linear summation and regression of the multiple resonances con-voluted with Lorentzian line shape function in the frequency domain (17). Itwas also assumed in the model that the HLWs of the NADH and NAD+ res-onances were the same, but that of α-ATP was slightly (∼1.5 Hz) larger,resulting in the best-fitting data.
The outcomes from the regression between the in vivo 31P spectrum andthe NAD quantification model prediction gave the signal integrals of NAD+
and NADH resonances, respectively. The integrals were compared with thoseof α-ATP, in which its brain concentration was set to 2.8 mM (17, 21); thus,the concentrations of intracellular NADH and NAD+ in each brain were de-termined, and the NAD+/NADH RX and total intracellular NAD concentration([NAD]total = [NAD+] + [NADH]) were calculated. The NAD+/NADH RP canbe calculated using the Nernst Equation (46, 47):
2880 | www.pnas.org/cgi/doi/10.1073/pnas.1417921112 Zhu et al.
Dow
nloa
ded
by g
uest
on
Feb
ruar
y 26
, 202
0

RP=RP0 +RTzF
ln� ½NAD+�½NADH�
�=RP0 +
RTzF
lnðRXÞ, [1]
where RP0 (−0.32 V) is the midpoint potential of the NAD+/NADH redox pair,R is the universal gas constant, T is the absolute temperature, F is the Fara-day constant, and z is the number of moles of electrons transferred in theredox reaction (2 for the NAD+/NADH redox reaction). Hence, at the braintemperature of 37 °C,
RP=−0:32+ 0:0308 log10ðRXÞðvoltÞ: [2]
To evaluate the reliability of the NAD quantification method and its de-pendence on the SNRα-ATP in a 31P MR spectrum, five different levels ofrandomly generated white Gaussian noise were added to the simulated 7-T31P spectra with predetermined HLW and NAD+/NADH ratio values. MonteCarlo simulations with 100 trials for each noise level were performed. Thevalues of the parameters used in the spectral simulation were similar to
those of human brains measured in this study: RX = 3.45, [NAD+] = 0.312μmol/g brain tissue, [NADH] = 0.090 μmol/g brain tissue, and HLW = 17.5 Hz.By fitting the 31P spectra with different noise (i.e., SNRα-ATP = 20, 40, 60, 80,and 100), the model-determined values were compared with their truevalues to estimate the fitting accuracy and error (thus, the reliability of theNAD quantification). The accuracy of the model quantification was defined asaccuracy (%) = 100 × abs(mean-real)/real, where real is the predeterminedparameter value without added noise. The fitting error was defined as error(%) = 100 × SD/mean for the evaluated parameters.
All results are presented as means ± SDs in the study. The statistical analysesof linear regression reported the regression coefficient (R) and Pearson’s cor-relation coefficient (r).
ACKNOWLEDGMENTS. This work was supported by NIH Grants RO1 NS041262,NS057560, and NS070839, R24MH106049, S10 RR026783, P41 EB015894, and P30NS076408 and the Keck Foundation.
1. Harden A, Young WJ (1906) The alcoholic ferment of yeast-juice. Proc R Soc Lond B
Biol Sci 77(519):405–420.2. Chance B, Ito T (1962) Control of endogenous adenosine triphosphatase activity by
energy-linked pyridine nucleotide reduction in mitochondria. Nature 195:150–153.3. Belenky P, Bogan KL, Brenner C (2007) NAD+ metabolism in health and disease.
Trends Biochem Sci 32(1):12–19.4. Houtkooper RH, Cantó C, Wanders RJ, Auwerx J (2010) The secret life of NAD+: An old
metabolite controlling new metabolic signaling pathways. Endocr Rev 31(2):194–223.5. Lin SJ, Guarente L (2003) Nicotinamide adenine dinucleotide, a metabolic regulator of
transcription, longevity and disease. Curr Opin Cell Biol 15(2):241–246.6. Cantó C, et al. (2012) The NAD+ precursor nicotinamide riboside enhances oxidative
metabolism and protects against high-fat diet-induced obesity. Cell Metab 15(6):838–847.
7. Houtkooper RH, Auwerx J (2012) Exploring the therapeutic space around NAD+. J CellBiol 199(2):205–209.
8. Mouchiroud L, et al. (2013) The NAD+/sirtuin pathway modulates longevity through
activation of mitochondrial UPR and FOXO signaling. Cell 154(2):430–441.9. Oka S, Hsu CP, Sadoshima J (2012) Regulation of cell survival and death by pyridine
nucleotides. Circ Res 111(5):611–627.10. Pittelli M, et al. (2011) Pharmacological effects of exogenous NAD on mitochondrial
bioenergetics, DNA repair, and apoptosis. Mol Pharmacol 80(6):1136–1146.11. Wang S, et al. (2008) Cellular NAD replenishment confers marked neuroprotection
against ischemic cell death: Role of enhanced DNA repair. Stroke 39(9):2587–2595.12. Wiley C, Campisi J (2014) NAD+ controls neural stem cell fate in the aging brain.
EMBO J 33(12):1289–1291.13. Chance B, Cohen P, Jobsis F, Schoener B (1962) Localized fluorometry of oxidation-
reduction states of intracellular pyridine nucleotide in brain and kidney cortex of theanesthetized rat. Science 136(3513):325.
14. Lowry OH, Passonneau JV, Schulz DW, Rock MK (1961) The measurement of pyridine
nucleotides by enzymatic cycling. J Biol Chem 236:2746–2755.15. Lowry OH, Passonneau JV, Rock MK (1961) The stability of pyridine nucleotides. J Biol
Chem 236:2756–2759.16. Avi-Dor Y, Olson JM, Doherty MD, Kaplan NO (1962) Fluorescence of pyridine nu-
cleotides in mitochondria. J Biol Chem 237(7):2377–2383.17. Lu M, Zhu XH, Zhang Y, ChenW (2014) Intracellular redox state revealed by in vivo 31P
MRS measurement of NAD+ and NADH contents in brains. Magn Reson Med 71(6):
1959–1972.18. Evans FE, Kaplan NO (1977) 31P nuclear magnetic resonance studies of HeLa cells. Proc
Natl Acad Sci USA 74(11):4909–4913.19. Lei H, Zhu XH, Zhang XL, Ugurbil K, Chen W (2003) In vivo 31P magnetic resonance
spectroscopy of human brain at 7 T: An initial experience. Magn Reson Med 49(2):
199–205.20. Navon G, Ogawa S, Shulman RG, Yamane T (1977) High-resolution 31P nuclear mag-
netic resonance studies of metabolism in aerobic Escherichia coli cells. Proc Natl Acad
Sci USA 74(3):888–891.21. Du F, et al. (2008) Tightly coupled brain activity and cerebral ATP metabolic rate. Proc
Natl Acad Sci USA 105(17):6409–6414.22. Siesjo BK (1978) Brain Energy Metabolism (John Wiley & Sons, New York).23. Lu M, Chen W, Zhu XH (2014) Field dependence study of in vivo brain 31P MRS up to
16.4 T. NMR Biomed 27(9):1135–1141.24. Akitt JW (1983) NMR and Chemistry: An Introduction to the Fourier Transform—
Multinuclear Ear (Chapman and Hall Ltd, London), 2nd Ed, pp 45–49.
25. Alano CC, et al. (2007) Differences among cell types in NAD+ compartmentalization: Acomparison of neurons, astrocytes, and cardiac myocytes. J Neurosci Res 85(15):3378–3385.
26. McKenna MC, Waagepetersen HS, Schousboe A, Sonnewald U (2006) Neuronal andastrocytic shuttle mechanisms for cytosolic-mitochondrial transfer of reducing equiv-alents: Current evidence and pharmacological tools. Biochem Pharmacol 71(4):399–407.
27. Williamson DH, Lund P, Krebs HA (1967) The redox state of free nicotinamide-adeninedinucleotide in the cytoplasm and mitochondria of rat liver. Biochem J 103(2):514–527.
28. Tischler ME, Friedrichs D, Coll K, Williamson JR (1977) Pyridine nucleotide distributionsand enzyme mass action ratios in hepatocytes from fed and starved rats. Arch Bio-chem Biophys 184(1):222–236.
29. Balaban RS (1990) Regulation of oxidative phosphorylation in the mammalian cell.Am J Physiol 258(3 Pt 1):C377–C389.
30. Chance B (1976) Pyridine nucleotide as an indicator of the oxygen requirements forenergy-linked functions of mitochondria. Circ Res 38(5 Suppl 1):I31–I38.
31. Vaishnavi SN, et al. (2010) Regional aerobic glycolysis in the human brain. Proc NatlAcad Sci USA 107(41):17757–17762.
32. Balaban RS, Nemoto S, Finkel T (2005) Mitochondria, oxidants, and aging. Cell 120(4):483–495.
33. Stein LR, Imai S (2012) The dynamic regulation of NAD metabolism in mitochondria.Trends Endocrinol Metab 23(9):420–428.
34. Braidy N, et al. (2014) Mapping NAD+ metabolism in the brain of ageing Wistar rats:Potential targets for influencing brain senescence. Biogerontology 15(2):177–198.
35. Gomes AP, et al. (2013) Declining NAD+ induces a pseudohypoxic state disruptingnuclear-mitochondrial communication during aging. Cell 155(7):1624–1638.
36. Leenders KL, et al. (1990) Cerebral blood flow, blood volume and oxygen utilization.Normal values and effect of age. Brain 113(Pt 1):27–47.
37. Yamaguchi T, et al. (1986) Reduction in regional cerebral metabolic rate of oxygenduring human aging. Stroke 17(6):1220–1228.
38. Navarro A, Boveris A (2007) The mitochondrial energy transduction system and theaging process. Am J Physiol Cell Physiol 292(2):C670–C686.
39. Boumezbeur F, et al. (2010) Altered brain mitochondrial metabolism in healthy agingas assessed by in vivo magnetic resonance spectroscopy. J Cereb Blood Flow Metab30(1):211–221.
40. Petersen KF, et al. (2003) Mitochondrial dysfunction in the elderly: Possible role ininsulin resistance. Science 300(5622):1140–1142.
41. Schreiber V, Dantzer F, Ame JC, de Murcia G (2006) Poly(ADP-ribose): Novel functionsfor an old molecule. Nat Rev Mol Cell Biol 7(7):517–528.
42. Wang J, et al. (2010) The role of Sirt1: At the crossroad between promotion of lon-gevity and protection against Alzheimer’s disease neuropathology. Biochim BiophysActa 1804(8):1690–1694.
43. Yoshino J, Mills KF, Yoon MJ, Imai S (2011) Nicotinamide mononucleotide, a key NAD+
intermediate, treats the pathophysiology of diet- and age-induced diabetes in mice. CellMetab 14(4):528–536.
44. Mouchiroud L, Houtkooper RH, Auwerx J (2013) NAD⁺ metabolism: A therapeutictarget for age-related metabolic disease. Crit Rev Biochem Mol Biol 48(4):397–408.
45. Prolla TA, Denu JM (2014) NAD+ deficiency in age-related mitochondrial dysfunction.Cell Metab 19(2):178–180.
46. Klingenberg M, Buecher T (1960) Biological oxidations. Annu Rev Biochem 29:669–708.
47. Unden G, Bongaerts J (1997) Alternative respiratory pathways of Escherichia coli:Energetics and transcriptional regulation in response to electron acceptors. BiochimBiophys Acta 1320(3):217–234.
Zhu et al. PNAS | March 3, 2015 | vol. 112 | no. 9 | 2881
NEU
ROSC
IENCE
Dow
nloa
ded
by g
uest
on
Feb
ruar
y 26
, 202
0