In vivo Imaging. Cranial windows for long-term … vivo Imaging. Cranial windows for long-term...
29
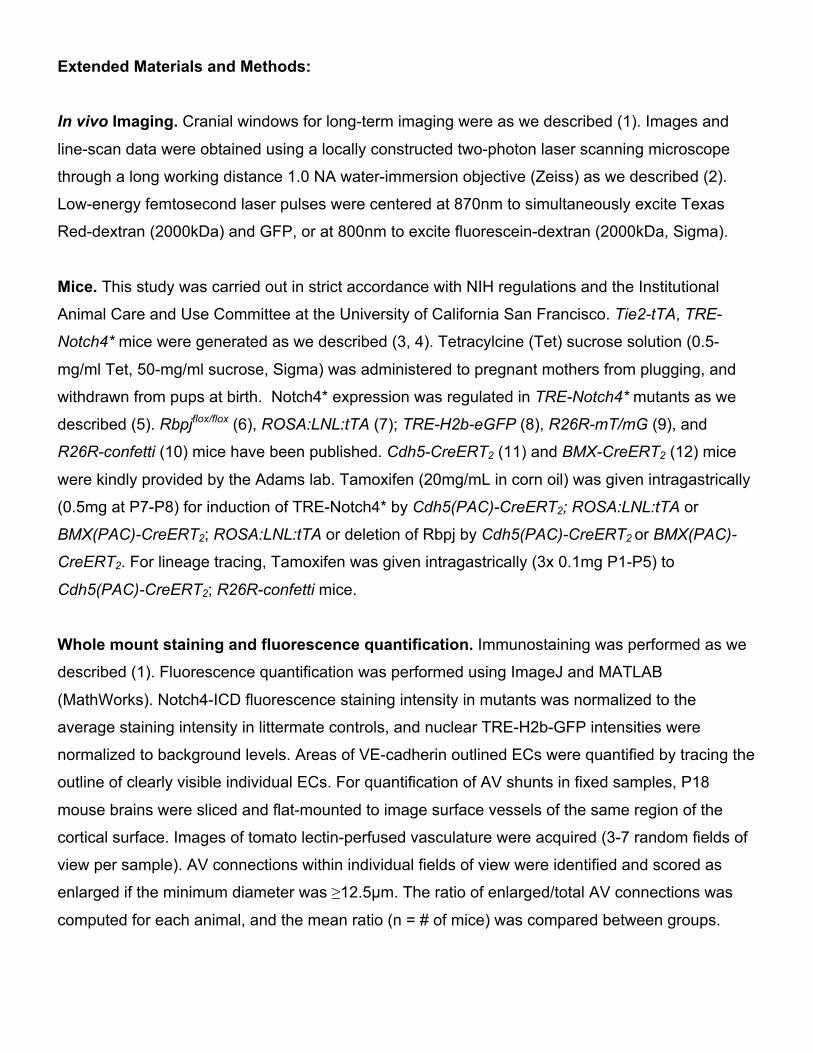
Extended Materials and Methods: In vivo Imaging. Cranial windows for long-term imaging were as we described (1). Images and line-scan data were obtained using a locally constructed two-photon laser scanning microscope through a long working distance 1.0 NA water-immersion objective (Zeiss) as we described (2). Low-energy femtosecond laser pulses were centered at 870nm to simultaneously excite Texas Red-dextran (2000kDa) and GFP, or at 800nm to excite fluorescein-dextran (2000kDa, Sigma). Mice. This study was carried out in strict accordance with NIH regulations and the Institutional Animal Care and Use Committee at the University of California San Francisco. Tie2-tTA, TRE- Notch4* mice were generated as we described (3, 4). Tetracylcine (Tet) sucrose solution (0.5- mg/ml Tet, 50-mg/ml sucrose, Sigma) was administered to pregnant mothers from plugging, and withdrawn from pups at birth. Notch4* expression was regulated in TRE-Notch4* mutants as we described (5). Rbpj flox/flox (6), ROSA:LNL:tTA (7); TRE-H2b-eGFP (8), R26R-mT/mG (9), and R26R-confetti (10) mice have been published. Cdh5-CreERT 2 (11) and BMX-CreERT 2 (12) mice were kindly provided by the Adams lab. Tamoxifen (20mg/mL in corn oil) was given intragastrically (0.5mg at P7-P8) for induction of TRE-Notch4* by Cdh5(PAC)-CreERT 2 ; ROSA:LNL:tTA or BMX(PAC)-CreERT 2 ; ROSA:LNL:tTA or deletion of Rbpj by Cdh5(PAC)-CreERT 2 or BMX(PAC)- CreERT 2 . For lineage tracing, Tamoxifen was given intragastrically (3x 0.1mg P1-P5) to Cdh5(PAC)-CreERT 2 ; R26R-confetti mice. Whole mount staining and fluorescence quantification. Immunostaining was performed as we described (1). Fluorescence quantification was performed using ImageJ and MATLAB (MathWorks). Notch4-ICD fluorescence staining intensity in mutants was normalized to the average staining intensity in littermate controls, and nuclear TRE-H2b-GFP intensities were normalized to background levels. Areas of VE-cadherin outlined ECs were quantified by tracing the outline of clearly visible individual ECs. For quantification of AV shunts in fixed samples, P18 mouse brains were sliced and flat-mounted to image surface vessels of the same region of the cortical surface. Images of tomato lectin-perfused vasculature were acquired (3-7 random fields of view per sample). AV connections within individual fields of view were identified and scored as enlarged if the minimum diameter was ≥12.5μm. The ratio of enlarged/total AV connections was computed for each animal, and the mean ratio (n = # of mice) was compared between groups.
Transcript of In vivo Imaging. Cranial windows for long-term … vivo Imaging. Cranial windows for long-term...
Extended Materials and Methods:
In vivo Imaging. Cranial windows for long-term imaging were as we described (1). Images and
line-scan data were obtained using a locally constructed two-photon laser scanning microscope
through a long working distance 1.0 NA water-immersion objective (Zeiss) as we described (2).
Low-energy femtosecond laser pulses were centered at 870nm to simultaneously excite Texas
Red-dextran (2000kDa) and GFP, or at 800nm to excite fluorescein-dextran (2000kDa, Sigma).
Mice. This study was carried out in strict accordance with NIH regulations and the Institutional
Animal Care and Use Committee at the University of California San Francisco. Tie2-tTA, TRE-
Notch4* mice were generated as we described (3, 4). Tetracylcine (Tet) sucrose solution (0.5-
mg/ml Tet, 50-mg/ml sucrose, Sigma) was administered to pregnant mothers from plugging, and
withdrawn from pups at birth. Notch4* expression was regulated in TRE-Notch4* mutants as we
described (5). Rbpjflox/flox (6), ROSA:LNL:tTA (7); TRE-H2b-eGFP (8), R26R-mT/mG (9), and
R26R-confetti (10) mice have been published. Cdh5-CreERT2 (11) and BMX-CreERT2 (12) mice
were kindly provided by the Adams lab. Tamoxifen (20mg/mL in corn oil) was given intragastrically
(0.5mg at P7-P8) for induction of TRE-Notch4* by Cdh5(PAC)-CreERT2; ROSA:LNL:tTA or
BMX(PAC)-CreERT2; ROSA:LNL:tTA or deletion of Rbpj by Cdh5(PAC)-CreERT2 or BMX(PAC)-
CreERT2. For lineage tracing, Tamoxifen was given intragastrically (3x 0.1mg P1-P5) to
Cdh5(PAC)-CreERT2; R26R-confetti mice.
Whole mount staining and fluorescence quantification. Immunostaining was performed as we
described (1). Fluorescence quantification was performed using ImageJ and MATLAB
(MathWorks). Notch4-ICD fluorescence staining intensity in mutants was normalized to the
average staining intensity in littermate controls, and nuclear TRE-H2b-GFP intensities were
normalized to background levels. Areas of VE-cadherin outlined ECs were quantified by tracing the
outline of clearly visible individual ECs. For quantification of AV shunts in fixed samples, P18
mouse brains were sliced and flat-mounted to image surface vessels of the same region of the
cortical surface. Images of tomato lectin-perfused vasculature were acquired (3-7 random fields of
view per sample). AV connections within individual fields of view were identified and scored as
enlarged if the minimum diameter was ≥12.5µm. The ratio of enlarged/total AV connections was
computed for each animal, and the mean ratio (n = # of mice) was compared between groups.
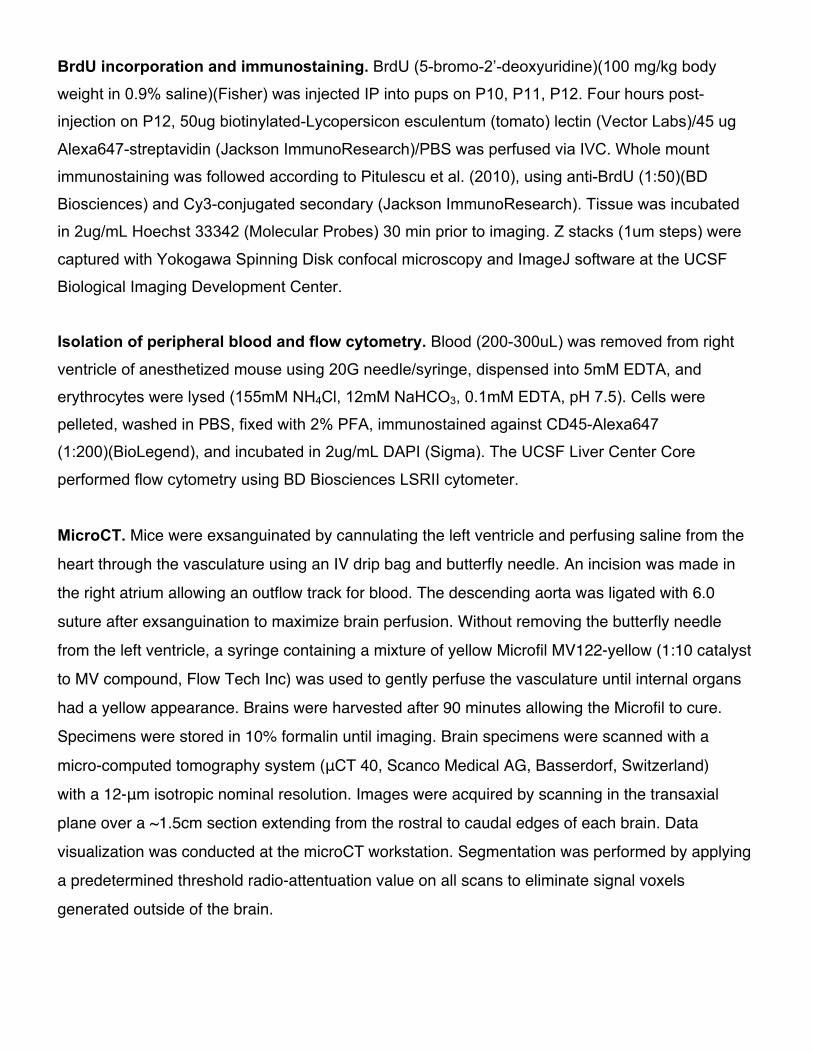
BrdU incorporation and immunostaining. BrdU (5-bromo-2’-deoxyuridine)(100 mg/kg body
weight in 0.9% saline)(Fisher) was injected IP into pups on P10, P11, P12. Four hours post-
injection on P12, 50ug biotinylated-Lycopersicon esculentum (tomato) lectin (Vector Labs)/45 ug
Alexa647-streptavidin (Jackson ImmunoResearch)/PBS was perfused via IVC. Whole mount
immunostaining was followed according to Pitulescu et al. (2010), using anti-BrdU (1:50)(BD
Biosciences) and Cy3-conjugated secondary (Jackson ImmunoResearch). Tissue was incubated
in 2ug/mL Hoechst 33342 (Molecular Probes) 30 min prior to imaging. Z stacks (1um steps) were
captured with Yokogawa Spinning Disk confocal microscopy and ImageJ software at the UCSF
Biological Imaging Development Center.
Isolation of peripheral blood and flow cytometry. Blood (200-300uL) was removed from right
ventricle of anesthetized mouse using 20G needle/syringe, dispensed into 5mM EDTA, and
erythrocytes were lysed (155mM NH4Cl, 12mM NaHCO3, 0.1mM EDTA, pH 7.5). Cells were
pelleted, washed in PBS, fixed with 2% PFA, immunostained against CD45-Alexa647
(1:200)(BioLegend), and incubated in 2ug/mL DAPI (Sigma). The UCSF Liver Center Core
performed flow cytometry using BD Biosciences LSRII cytometer.
MicroCT. Mice were exsanguinated by cannulating the left ventricle and perfusing saline from the
heart through the vasculature using an IV drip bag and butterfly needle. An incision was made in
the right atrium allowing an outflow track for blood. The descending aorta was ligated with 6.0
suture after exsanguination to maximize brain perfusion. Without removing the butterfly needle
from the left ventricle, a syringe containing a mixture of yellow Microfil MV122-yellow (1:10 catalyst
to MV compound, Flow Tech Inc) was used to gently perfuse the vasculature until internal organs
had a yellow appearance. Brains were harvested after 90 minutes allowing the Microfil to cure.
Specimens were stored in 10% formalin until imaging. Brain specimens were scanned with a
micro-computed tomography system (μCT 40, Scanco Medical AG, Basserdorf, Switzerland)
with a 12-μm isotropic nominal resolution. Images were acquired by scanning in the transaxial
plane over a ~1.5cm section extending from the rostral to caudal edges of each brain. Data
visualization was conducted at the microCT workstation. Segmentation was performed by applying
a predetermined threshold radio-attentuation value on all scans to eliminate signal voxels
generated outside of the brain.

Statistics. Comparisons were made using a two-tailed Student’s T-Test. Comparison of multiple
groups was made using ANOVA with post-hoc Tukey’s HSD analysis.
!References:)1.! Murphy!PA,"et"al.!(2012)!Notch4!normalization!reduces!blood!vessel!size!in!arteriovenous!
malformations.!Science"translational"medicine!4(117):117ra118.!2.! Kim!TN,"et"al.!(2012)!LineGscanning!particle!image!velocimetry:!an!optical!approach!for!
quantifying!a!wide!range!of!blood!flow!speeds!in!live!animals.!PLoS"One!7(6):e38590.!3.! Carlson!TR,"et"al.!(2005)!Endothelial!expression!of!constitutively!active!Notch4!elicits!
reversible!arteriovenous!malformations!in!adult!mice.!Proceedings"of"the"National"Academy"of"Sciences"of"the"United"States"of"America!102(28):9884G9889.!
4.! Kim!YH,"et"al.!(2008)!Artery!and!vein!size!is!balanced!by!Notch!and!ephrin!B2/EphB4!during!angiogenesis.!Development!135(22):3755G3764.!
5.! Murphy!PA,"et"al.!(2008)!Endothelial!Notch4!signaling!induces!hallmarks!of!brain!arteriovenous!malformations!in!mice.!Proceedings"of"the"National"Academy"of"Sciences"of"the"United"States"of"America!105(31):10901G10906.!
6.! Tanigaki!K,"et"al.!(2002)!NotchGRBPGJ!signaling!is!involved!in!cell!fate!determination!of!marginal!zone!B!cells.!Nat"Immunol!3(5):443G450.!
7.! Wang!L,"et"al.!(2008)!Restricted!expression!of!mutant!SOD1!in!spinal!motor!neurons!and!interneurons!induces!motor!neuron!pathology.!Neurobiology"of"disease!29(3):400G408.!
8.! Tumbar!T,"et"al.!(2004)!Defining!the!epithelial!stem!cell!niche!in!skin.!Science!303(5656):359G363.!
9.! Muzumdar!MD,!Tasic!B,!Miyamichi!K,!Li!L,!&!Luo!L!(2007)!A!global!doubleGfluorescent!Cre!reporter!mouse.!Genesis!45(9):593G605.!
10.! Snippert!HJ,"et"al.!(2010)!Intestinal!crypt!homeostasis!results!from!neutral!competition!between!symmetrically!dividing!Lgr5!stem!cells.!Cell!143(1):134G144.!
11.! Pitulescu!ME,!Schmidt!I,!Benedito!R,!&!Adams!RH!(2010)!Inducible!gene!targeting!in!the!neonatal!vasculature!and!analysis!of!retinal!angiogenesis!in!mice.!Nat"Protoc!5(9):1518G1534.!
12.! Ehling!M,!Adams!S,!Benedito!R,!&!Adams!RH!(2013)!Notch!controls!retinal!blood!vessel!maturation!and!quiescence.!Development!140(14):3051G3061.!
!
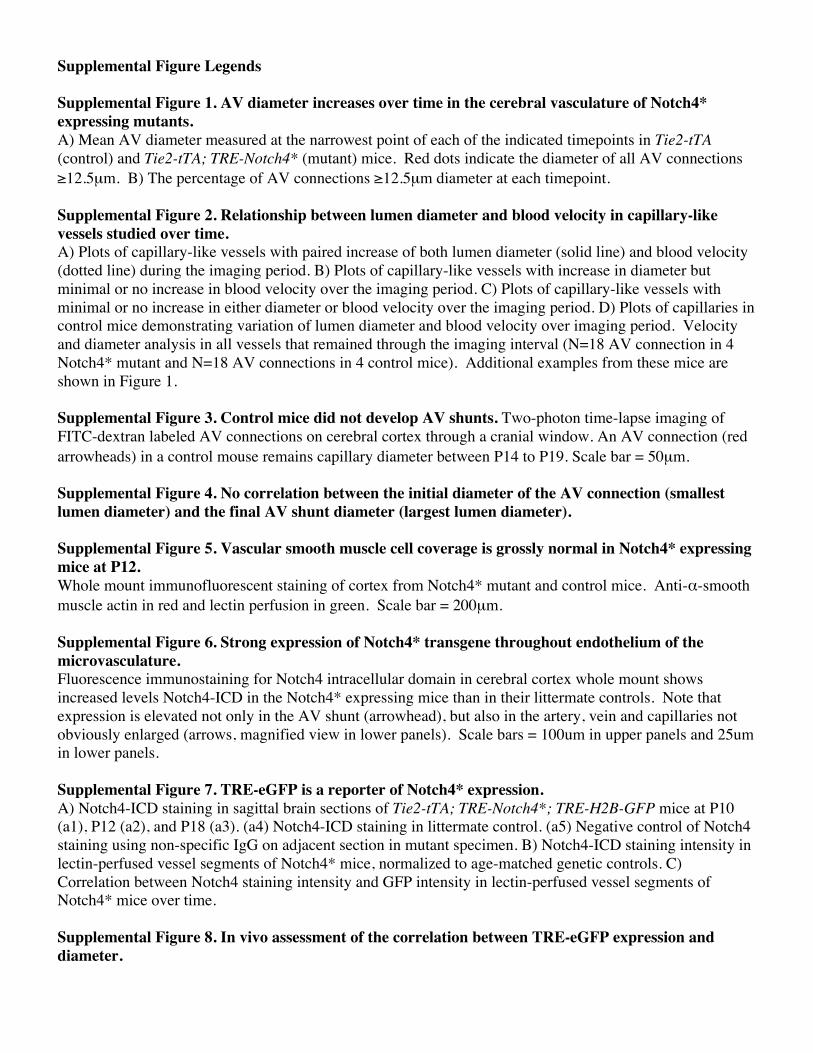
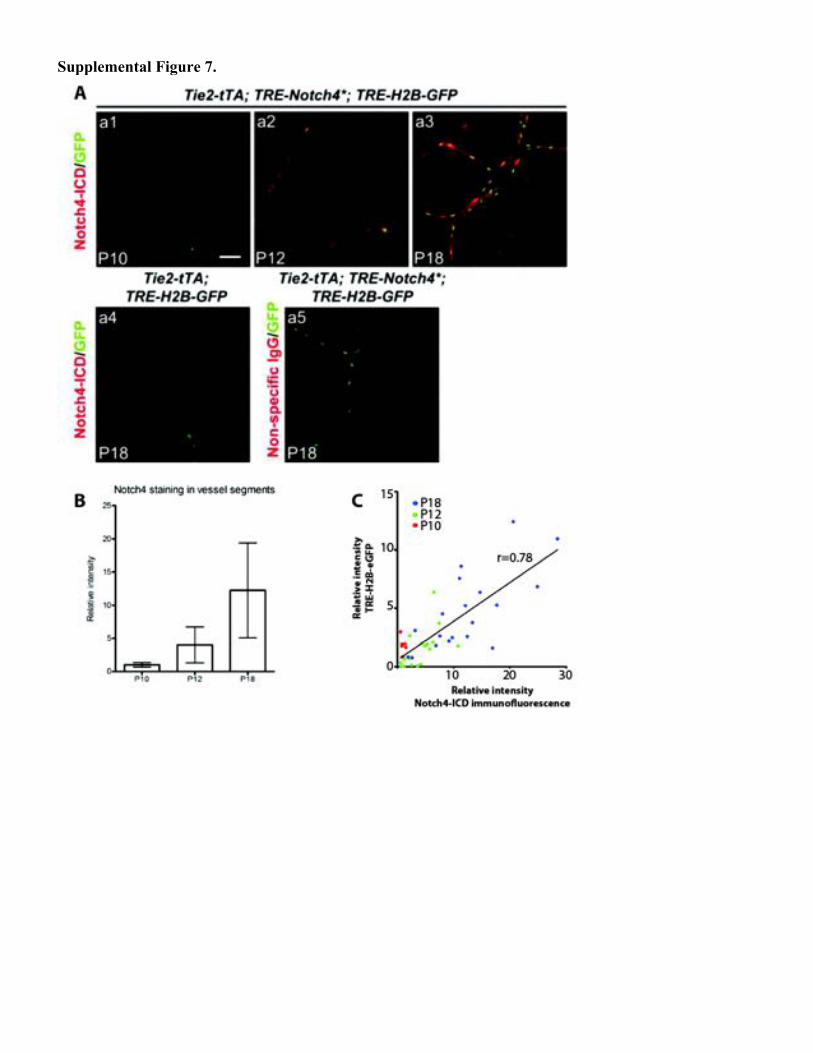
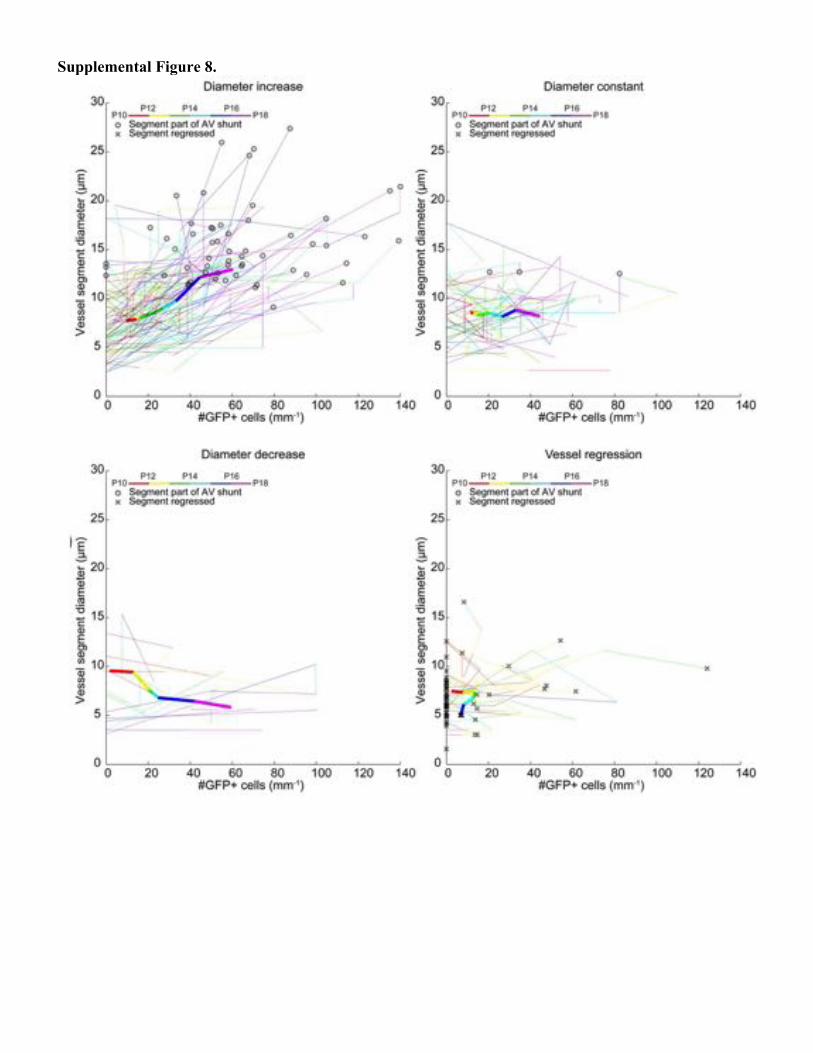
Supplemental Figure Legends Supplemental Figure 1. AV diameter increases over time in the cerebral vasculature of Notch4* expressing mutants. A) Mean AV diameter measured at the narrowest point of each of the indicated timepoints in Tie2-tTA (control) and Tie2-tTA; TRE-Notch4* (mutant) mice. Red dots indicate the diameter of all AV connections ≥12.5µm. B) The percentage of AV connections ≥12.5µm diameter at each timepoint. Supplemental Figure 2. Relationship between lumen diameter and blood velocity in capillary-like vessels studied over time. A) Plots of capillary-like vessels with paired increase of both lumen diameter (solid line) and blood velocity (dotted line) during the imaging period. B) Plots of capillary-like vessels with increase in diameter but minimal or no increase in blood velocity over the imaging period. C) Plots of capillary-like vessels with minimal or no increase in either diameter or blood velocity over the imaging period. D) Plots of capillaries in control mice demonstrating variation of lumen diameter and blood velocity over imaging period. Velocity and diameter analysis in all vessels that remained through the imaging interval (N=18 AV connection in 4 Notch4* mutant and N=18 AV connections in 4 control mice). Additional examples from these mice are shown in Figure 1. Supplemental Figure 3. Control mice did not develop AV shunts. Two-photon time-lapse imaging of FITC-dextran labeled AV connections on cerebral cortex through a cranial window. An AV connection (red arrowheads) in a control mouse remains capillary diameter between P14 to P19. Scale bar = 50µm. Supplemental Figure 4. No correlation between the initial diameter of the AV connection (smallest lumen diameter) and the final AV shunt diameter (largest lumen diameter). Supplemental Figure 5. Vascular smooth muscle cell coverage is grossly normal in Notch4* expressing mice at P12. Whole mount immunofluorescent staining of cortex from Notch4* mutant and control mice. Anti-α-smooth muscle actin in red and lectin perfusion in green. Scale bar = 200µm. Supplemental Figure 6. Strong expression of Notch4* transgene throughout endothelium of the microvasculature. Fluorescence immunostaining for Notch4 intracellular domain in cerebral cortex whole mount shows increased levels Notch4-ICD in the Notch4* expressing mice than in their littermate controls. Note that expression is elevated not only in the AV shunt (arrowhead), but also in the artery, vein and capillaries not obviously enlarged (arrows, magnified view in lower panels). Scale bars = 100um in upper panels and 25um in lower panels. Supplemental Figure 7. TRE-eGFP is a reporter of Notch4* expression. A) Notch4-ICD staining in sagittal brain sections of Tie2-tTA; TRE-Notch4*; TRE-H2B-GFP mice at P10 (a1), P12 (a2), and P18 (a3). (a4) Notch4-ICD staining in littermate control. (a5) Negative control of Notch4 staining using non-specific IgG on adjacent section in mutant specimen. B) Notch4-ICD staining intensity in lectin-perfused vessel segments of Notch4* mice, normalized to age-matched genetic controls. C) Correlation between Notch4 staining intensity and GFP intensity in lectin-perfused vessel segments of Notch4* mice over time. Supplemental Figure 8. In vivo assessment of the correlation between TRE-eGFP expression and diameter.
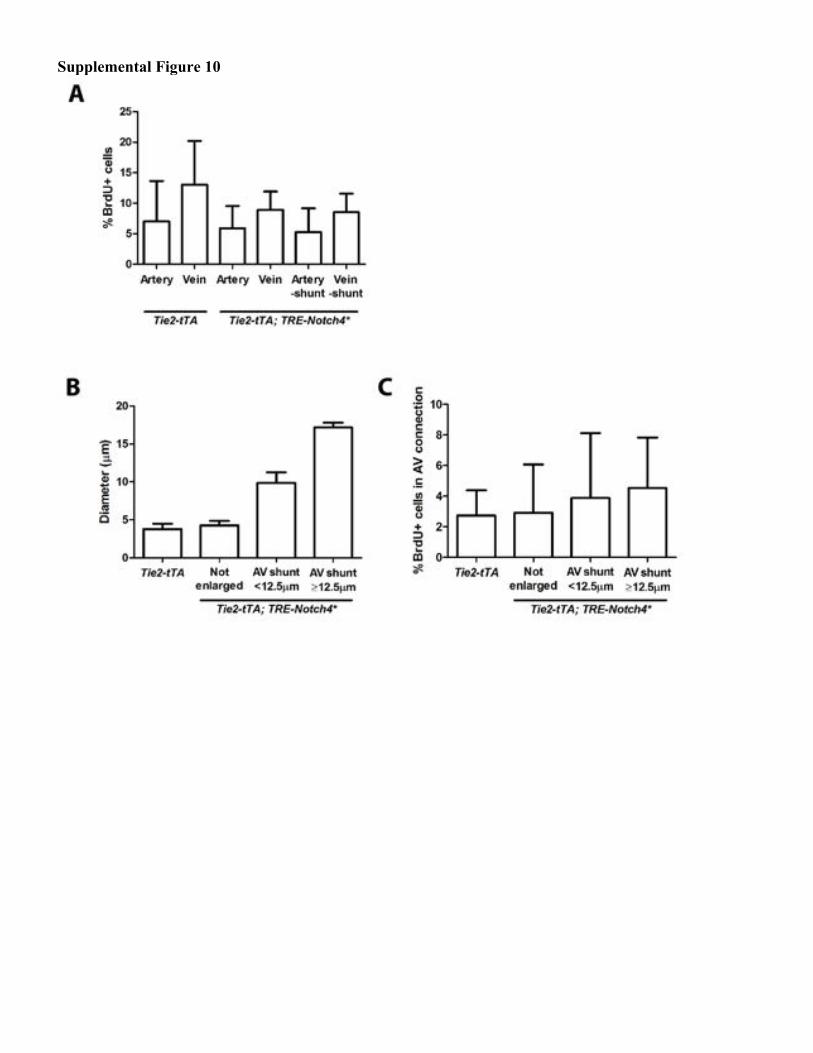
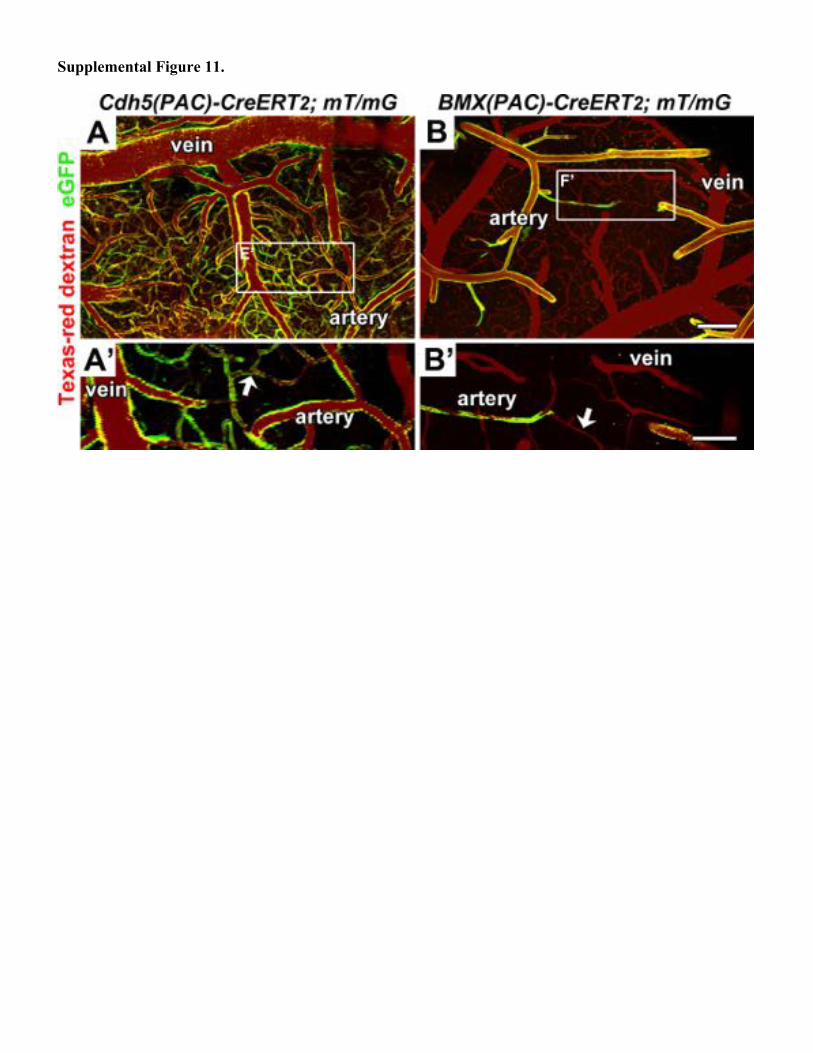
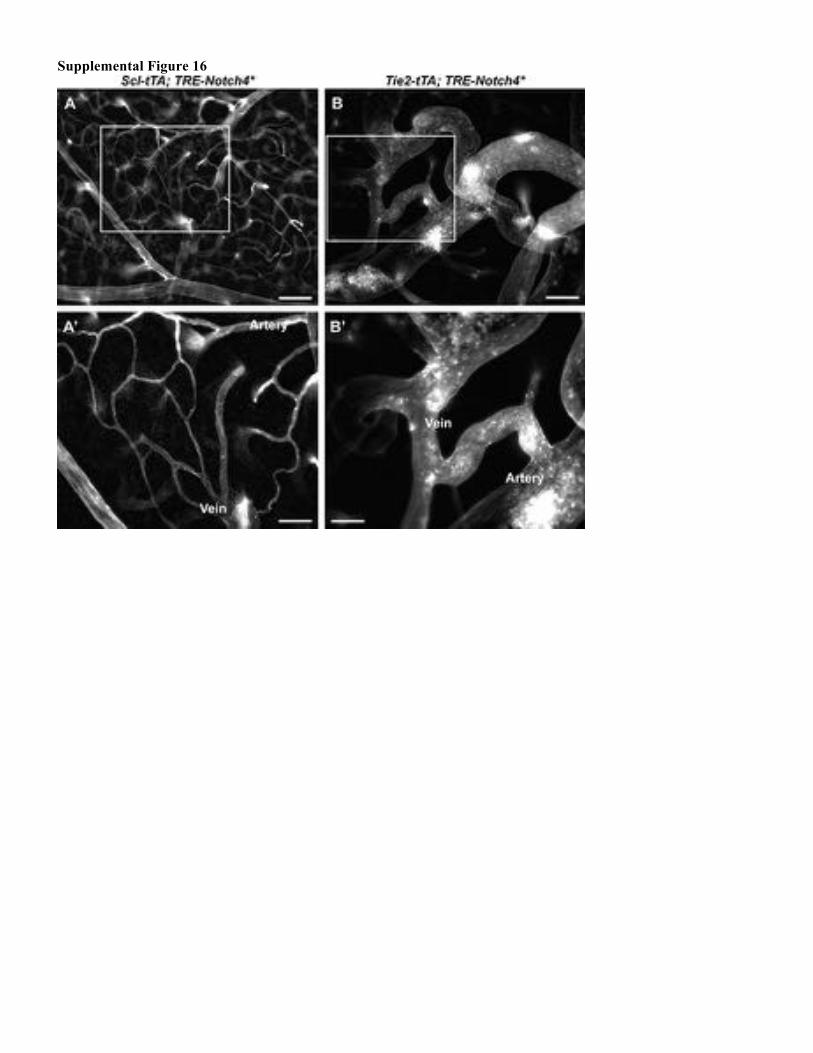
Time history of number of GFP+ cells and vessel segment diameter of Notch4* mice. Change in vessel segment diameter was scored as increase, constant, decrease, or regress. Each line trajectory corresponds to an individual vessel segment. Color transitions of line trajectory indicate time progression. Circle indicates vessel segment was part of an AV shunt. Cross indicates vessel segment regressed. Number of GFP+ cells was normalized to the initial vessel segment diameter and expressed as per unit length. Bold line trajectory corresponds to mean number of GFP+ cells and mean vessel segment diameter. Supplemental Figure 9. No significant difference in the number of Confetti labeled ECs in AV connections as they grow into AV shunts. Correlation plot showing the relationship between the change in diameter and the change in cell number over the 48hr interval. Triangle indicates mean change in diameter and cell number. Marker size represents number of observations. Supplemental Figure 10. No significant difference in BrdU labeled endothelium in Notch4* mutant mice. A) Quantification of BrdU labeled cells as a percentage of all DAPI+ lectin+ ECs in the indicated vessels (-Shunt indicates that the artery or vein is not directly connected to an AV shunt) and B) in the AV connections or AV shunts of the indicated mice. C) Quantification of minimal AV diameter in the measured connections. Error bars reflect standard deviation among individual animals (N=4 for AV shunt group and N=5 for all other groups). Supplemental Figure 11. Cdh5(PAC)-CreERT2 and BMX(PAC)-CreERT2 mediate endothelial- and arterial endothelial-specific gene excision, respectively. (A) Cdh5(PAC)-CreERT2 and (B) BMX(PAC)-CreERT2 activity was visualized in vivo using a membrane-targeted eGFP Cre-reporter. Plasma in perfused vessels is labeled by Texas-red dextran. Higher magnification image shows differential labeling of the artery, capillary and vein (A’ & B’). Arrow indicates capillaries. Scale bars = (B) 150μm and (B’) 50μm. Supplemental Figure 12. Cdh5(PAC)-CreERT2 is active in vascular endothelium and AV shunts but not blood cells. (A) FACs showing the level of Cre-activated mGFP in Cdh5(PAC)-CreERT2 mice (with and without ROSA:LNL:tTA; TRE-Notch4*) and positive and negative controls. (B&C) Whole mount imaging showing strong mGFP expression throughout the vasculature of Notch4* expressing mice (B) and the control (C). Supplemental Figure 13. Cdh5(PAC)-CreERT2; ROSA:LNL:tTA is a strong driver of TRE-Notch4* expression. Quantification of Notch4 immunofluorescence staining intensity in 10 fields per brain, normalized against littermate controls. (N=4 Cdh5(PAC)-CreERT2; ROSA:LNL:tTA; TRE-Notch4* mice and N=6 Tie2-tTA; TRE-Notch4* mice.) Supplemental Figure 14. Variable BMX(PAC)-CreERT2-mediated excision in the distal ends of the arterioles. Two-photon imaging of the cerebellum of BMX(PAC)-CreERT2; mT/mG; ephrinB2-H2b-eGFP mice with counter stain by tomato lectin perfusion. Note extension of the nuclear ephrinB2-H2b-eGFP signal beyond the end of BMX(PAC)-CreERT2; mT/mG+ (cytoplasmic) arteries. Scale bar = 50μm. Supplemental Figure 15. Growth of an AV shunt and regression of a lower resistance distal vessel. 3D rendering of in vivo time-lapse data of an AV shunt and distal artery (arrowhead). Supplemental Figure 16. Scl-tTA; TRE-Notch4* does not result in AVM.
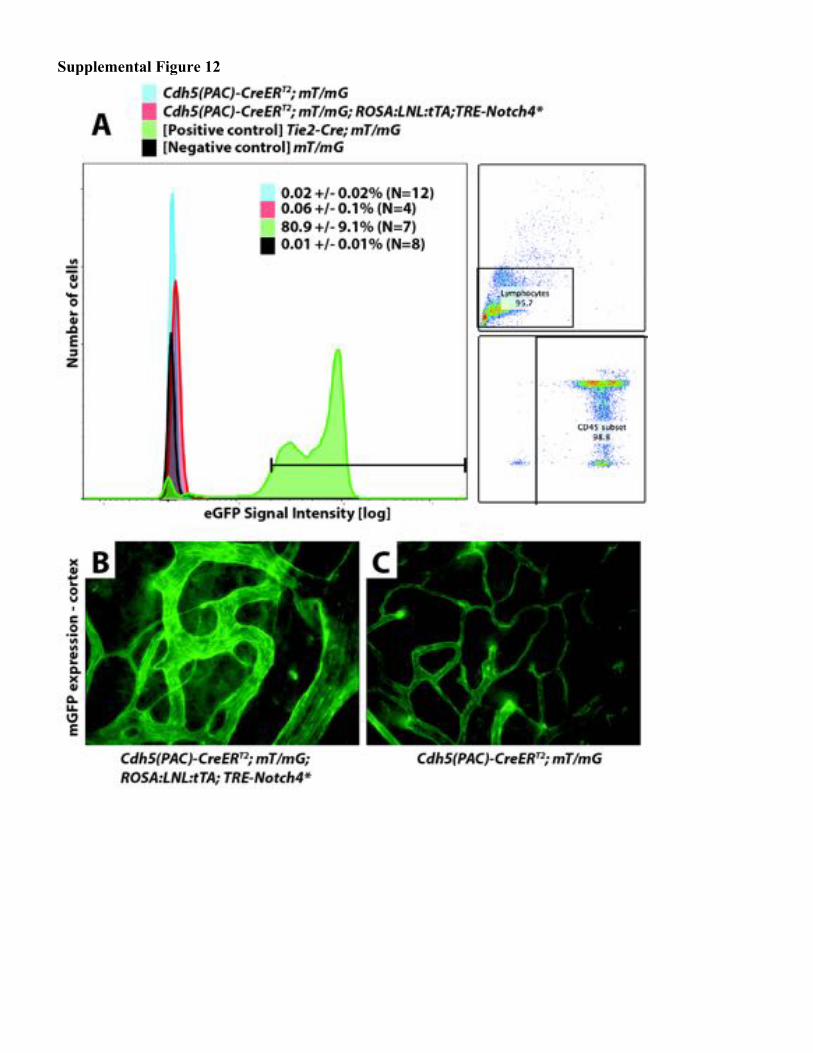
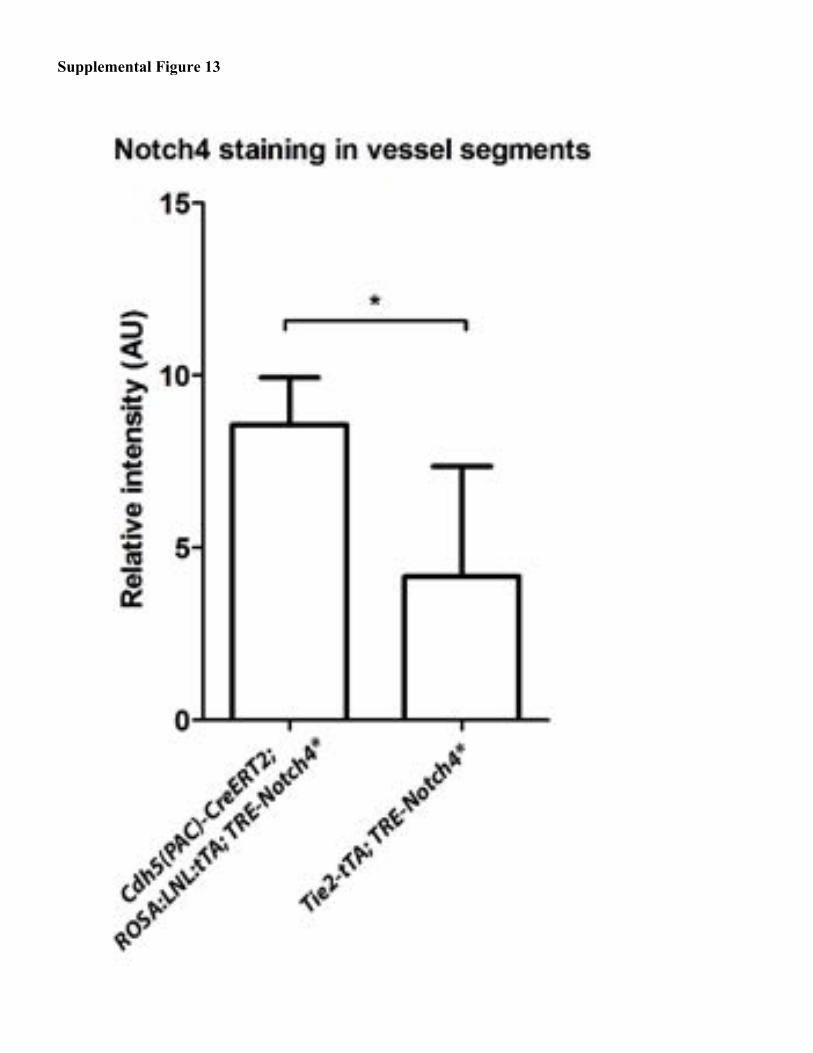
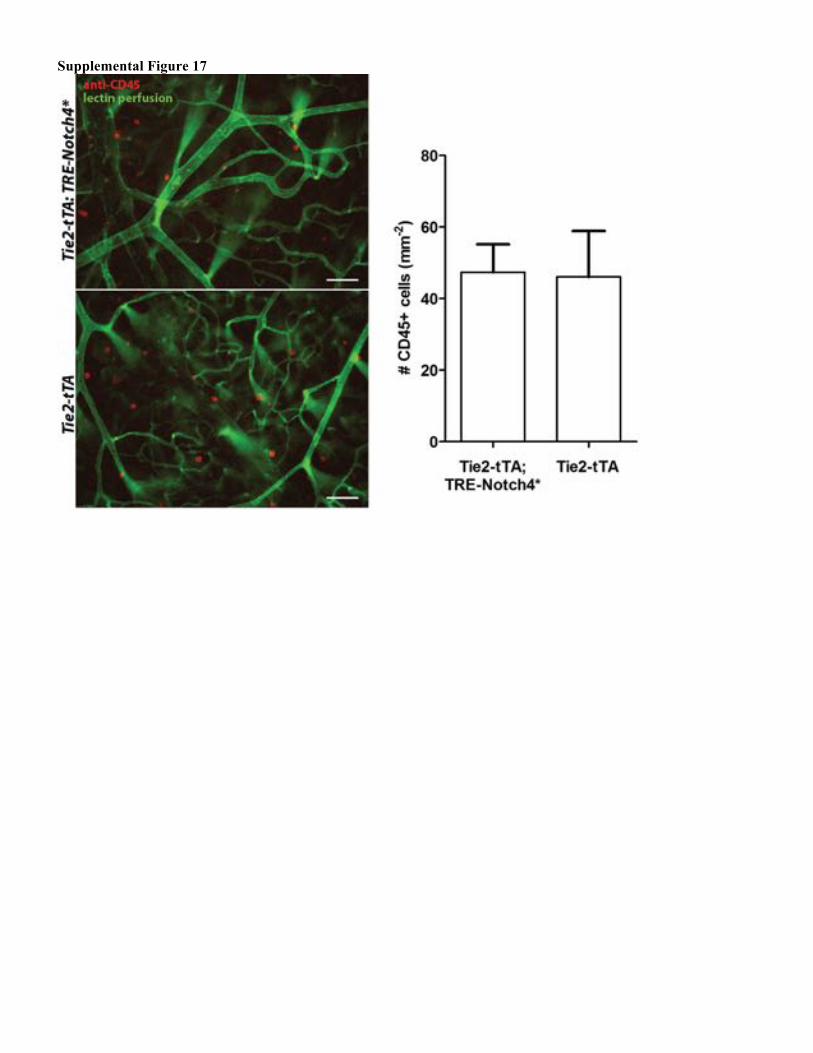
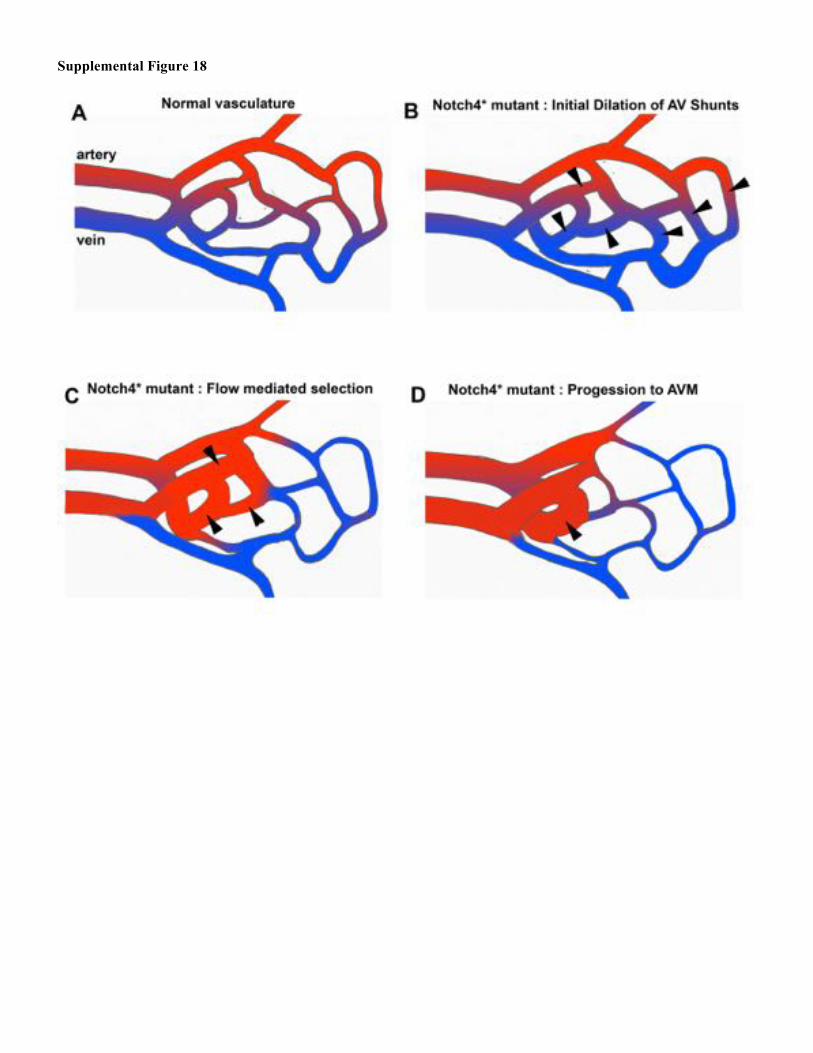
Vasculature of (A) Scl-tTA; TRE-Notch4* and (B) littermate Tie2-tTA; TRE-Notch4* mutants, revealed by fluorescent tomato lectin perfusion at P28 after tetracycline removal at birth. (A’, B’) Magnified view of boxed regions in (A, B). Scale bar = 100μm (A, B) and 50μm (A’, B’). Supplemental Figure 17. No increase in CD45+ hematopoetic cells in the AV shunts of Notch4* expressing mice. Fluorescence immunostaining for CD45 in cerebral cortex whole mount shows no detectable increase in hematopoetic cells in the AV shunts of Notch4* expressing mouse, and very few hematopoetic cells in general. Scale bars = 100µm. Supplemental Figure 18. Model for the flow-mediated selection of AV shunts Schematic depicting a normal cortical brain vascular network (A) and the remodeling of the vasculature induced by Notch4* expression (B-D). In the earliest stage, AV shunts throughout the brain are enlarged (arrowheads in B). Following initial enlargement, a few AV shunts in which flow is highest continue to enlarge (arrowheads in C). After sequential flow-mediated selections steps, AVM-like lesions develop, composed of dilated and tortuous arterial and venous vessels which shunt large amounts of blood from distal capillaries (arrowhead in D). Supplemental Table 1. Quantification of enlarged AV connections in mice with endothelial- or arterial endothelial-specific Notch4* expression. Cdh5(PAC)-CreERT2 and BMX(PAC)-CreERT2 were used to turn on Notch4* in all vessels and in arteries, respectively. Lectin-perfused AV connections on the surface of the cerebral cortex of Notch4* mice (see Fig. 4) were scored as enlarged if the minimum diameter was ≥12.5μm. The ratio of enlarged/total AV connections was computed for each animal (see Supplemental Table 1 raw data), and the mean ratio (n = # of mice) was compared between groups. See Supplemental Methods for detailed methodology. (Data are mean±SD) Supplemental Table 2. Quantification of Notch4*-mediated enlarged AV connections after endothelial- or arterial endothelial-specific deletion of Rbpj. Cdh5(PAC)-CreERT2 and BMX(PAC)-CreERT2 were used to delete floxed-Rbpj in all vessels and in arteries, respectively. Either both or a single Rbpj allele was excised. Lectin-perfused AV connections on the surface of the cerebral cortex of Notch4* and control mice (see Fig. 4) were scored as enlarged if the minimum diameter was ≥12.5μm. The ratio of enlarged/total AV connections was computed for each animal (see Supplemental Table 2 raw data), and the mean ratio (n = # of mice) was compared between groups. See Supplemental Methods for detailed methodology. (Data are mean±SD).
Supplemental Figure 1.

Supplemental Figure 2A-C.

Supplemental Figure 2D.

Supplemental Figure 3.
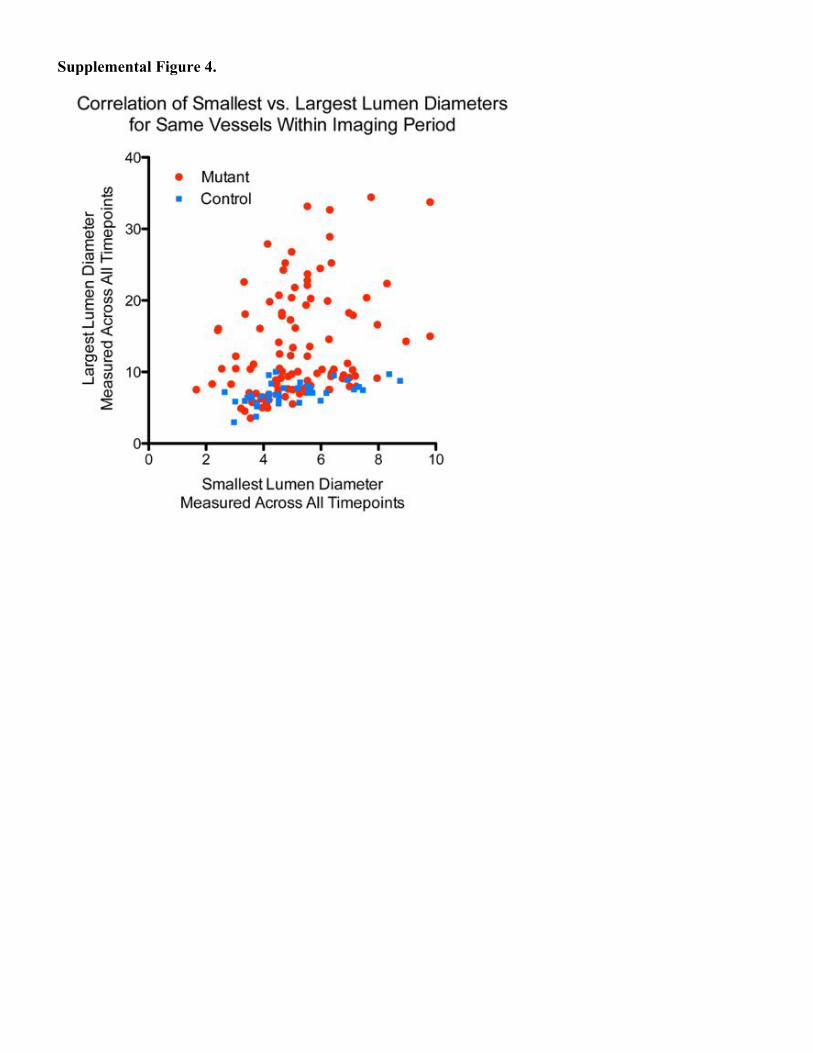
Supplemental Figure 4.
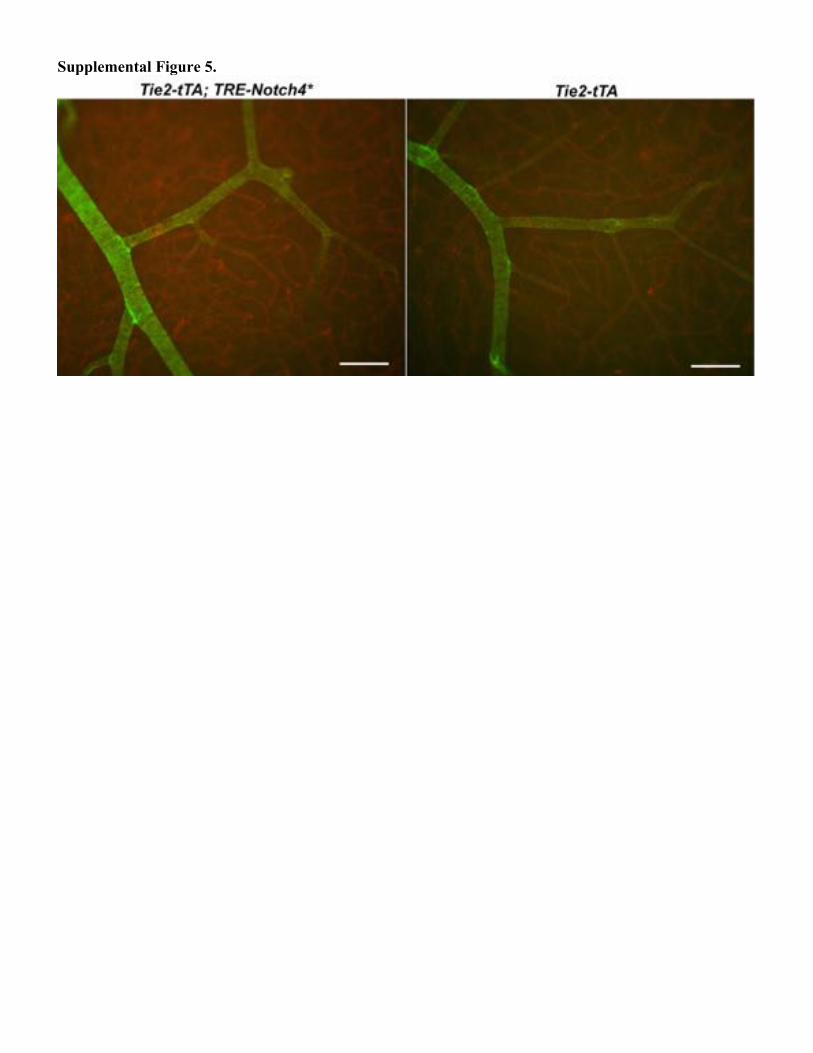
Supplemental Figure 5.

Supplemental Figure 6.
Supplemental Figure 7.
Supplemental Figure 8.

Supplemental Figure 9
Supplemental Figure 10
Supplemental Figure 11.
Supplemental Figure 12
Supplemental Figure 13
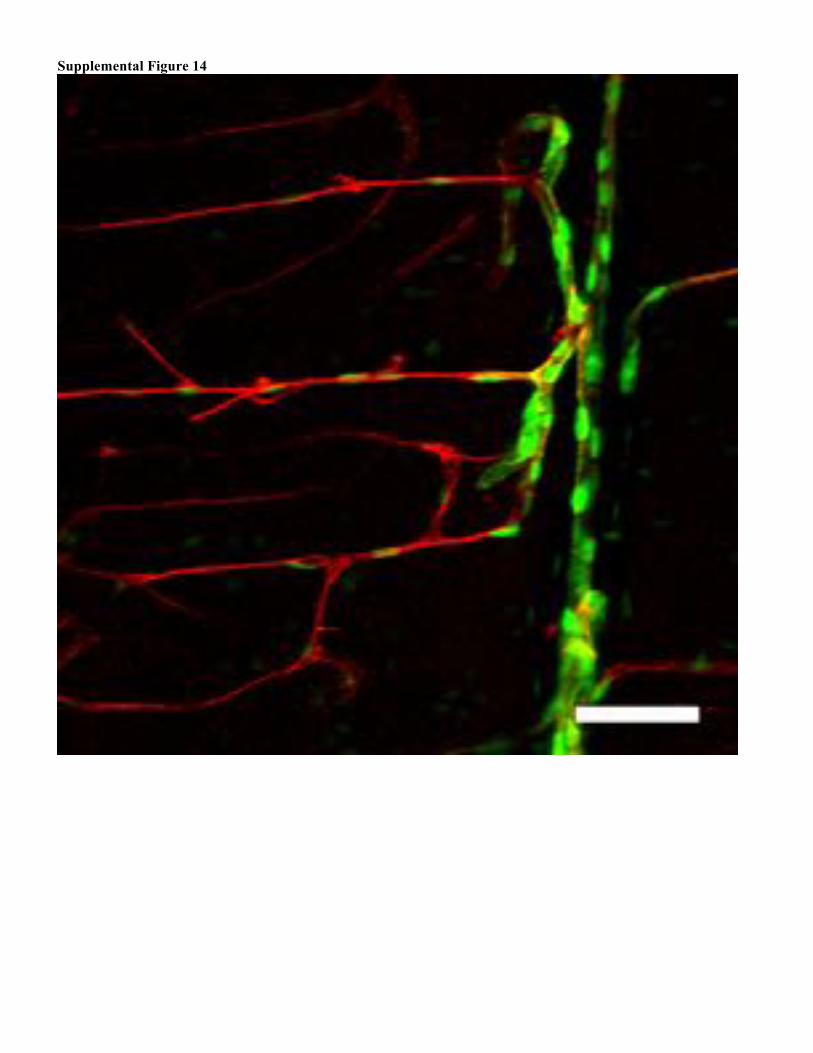
Supplemental Figure 14

Supplemental Figure 15.
Supplemental Figure 16
Supplemental Figure 17
Supplemental Figure 18

Supplemental Table 1.
Genotype n (Mice) Enlarged/Total
(%)
Mean SD Cdh5(PAC)-CreERT2;
ROSA:LNL:tTA; TRE-Notch4* 3 82.8 21.8 *
ROSA:LNL:tTA; TRE-Notch4* 3 2.2 3.7 (*, difference between groups, p = 0.02, t- test)
Genotype n (Mice) Enlarged/Total
(%) Mean SD
BMX(PAC)-CreERT2; ROSA:LNL:tTA; TRE-Notch4* 3 2.1 3.6
ROSA:LNL:tTA; TRE-Notch4* 2 0 0 (Not significant, p = 0.42, t- test)

Supplemental Table 1 raw data Cdh5(PAC)-CreERT2; ROSA:LNL:tTA; TRE-Notch4*
Mouse 1 2 3 Sum Total connections 48 15 20 83
Enlarged connections 28 15 18 61
Enlarged/Total (%) 58.3 100 90.0
ROSA:LNL:tTA; TRE-Notch4* Mouse 1 2 3 Sum
Total connections 31 46 26 103 Enlarged
connections 2 0 0 2 Enlarged/Total (%) 6.5 0 0
BMX(PAC)-CreERT2; ROSA:LNL:tTA; TRE-Notch4
Mouse 1 2 3 Sum Total connections 19 16 8 43
Enlarged connections 0 1 0 1
Enlarged/Total (%) 0 6.3 0
ROSA:LNL:tTA; TRE-Notch4 Mouse 1 2 Sum
Total connections 33 18 51 Enlarged
connections 0 0 0 Enlarged/Total (%) 0 0
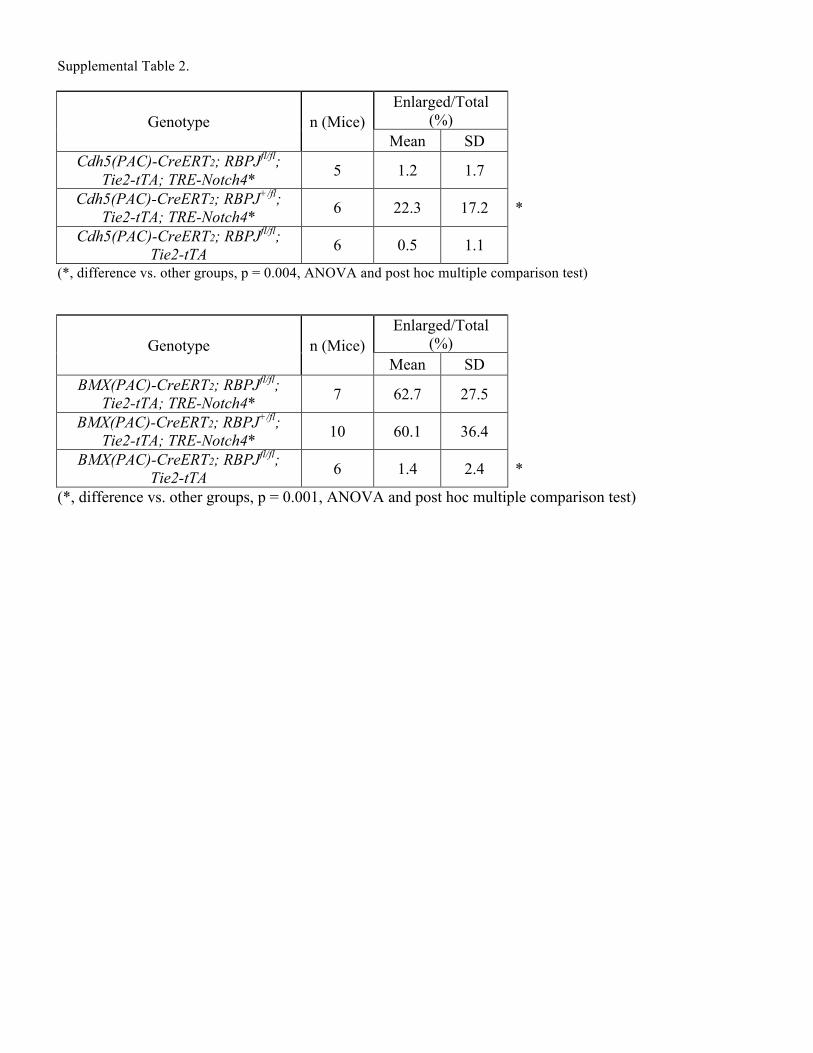
Supplemental Table 2.
Genotype n (Mice) Enlarged/Total
(%)
Mean SD Cdh5(PAC)-CreERT2; RBPJfl/fl;
Tie2-tTA; TRE-Notch4* 5 1.2 1.7
Cdh5(PAC)-CreERT2; RBPJ+/fl; Tie2-tTA; TRE-Notch4* 6 22.3 17.2 *
Cdh5(PAC)-CreERT2; RBPJfl/fl; Tie2-tTA 6 0.5 1.1
(*, difference vs. other groups, p = 0.004, ANOVA and post hoc multiple comparison test)
Genotype n (Mice) Enlarged/Total
(%)
Mean SD BMX(PAC)-CreERT2; RBPJfl/fl;
Tie2-tTA; TRE-Notch4* 7 62.7 27.5
BMX(PAC)-CreERT2; RBPJ+/fl; Tie2-tTA; TRE-Notch4* 10 60.1 36.4
BMX(PAC)-CreERT2; RBPJfl/fl; Tie2-tTA 6 1.4 2.4 *
(*, difference vs. other groups, p = 0.001, ANOVA and post hoc multiple comparison test)
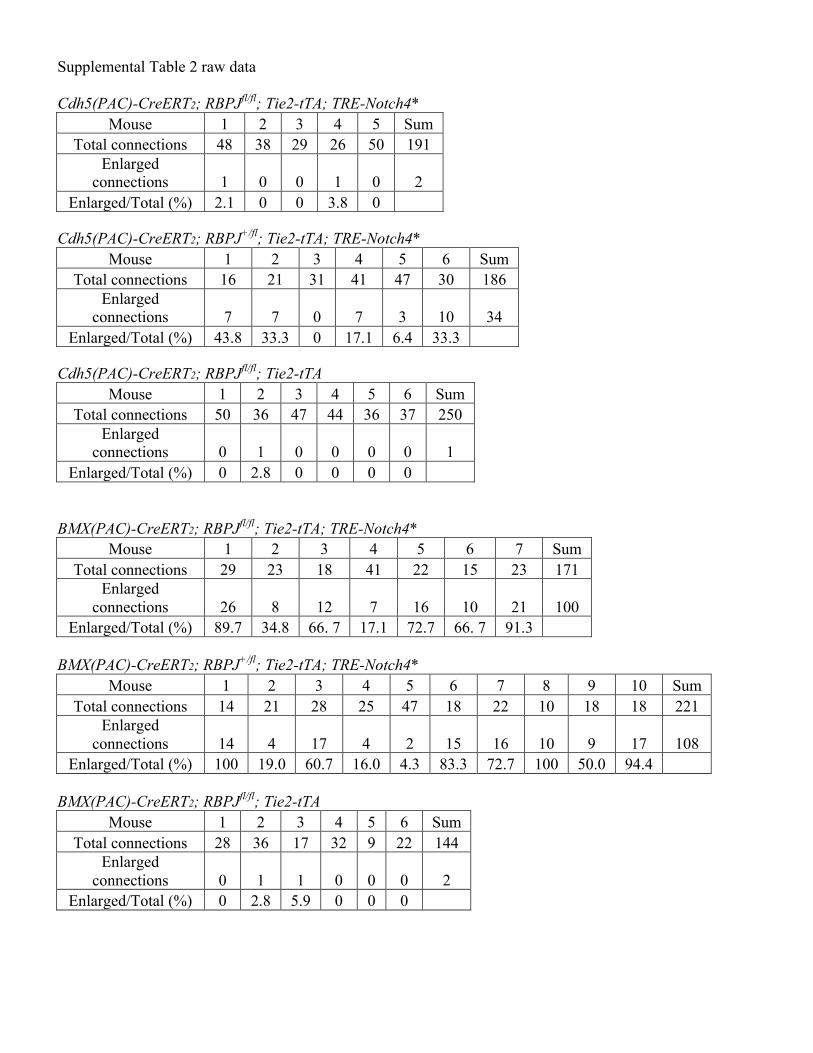
Supplemental Table 2 raw data Cdh5(PAC)-CreERT2; RBPJfl/fl; Tie2-tTA; TRE-Notch4*
Mouse 1 2 3 4 5 Sum Total connections 48 38 29 26 50 191
Enlarged connections 1 0 0 1 0 2
Enlarged/Total (%) 2.1 0 0 3.8 0
Cdh5(PAC)-CreERT2; RBPJ+/fl; Tie2-tTA; TRE-Notch4* Mouse 1 2 3 4 5 6 Sum
Total connections 16 21 31 41 47 30 186 Enlarged
connections 7 7 0 7 3 10 34 Enlarged/Total (%) 43.8 33.3 0 17.1 6.4 33.3
Cdh5(PAC)-CreERT2; RBPJfl/fl; Tie2-tTA
Mouse 1 2 3 4 5 6 Sum Total connections 50 36 47 44 36 37 250
Enlarged connections 0 1 0 0 0 0 1
Enlarged/Total (%) 0 2.8 0 0 0 0
BMX(PAC)-CreERT2; RBPJfl/fl; Tie2-tTA; TRE-Notch4*
Mouse 1 2 3 4 5 6 7 Sum Total connections 29 23 18 41 22 15 23 171
Enlarged connections 26 8 12 7 16 10 21 100
Enlarged/Total (%) 89.7 34.8 66. 7 17.1 72.7 66. 7 91.3
BMX(PAC)-CreERT2; RBPJ+/fl; Tie2-tTA; TRE-Notch4* Mouse 1 2 3 4 5 6 7 8 9 10 Sum
Total connections 14 21 28 25 47 18 22 10 18 18 221 Enlarged
connections 14 4 17 4 2 15 16 10 9 17 108 Enlarged/Total (%) 100 19.0 60.7 16.0 4.3 83.3 72.7 100 50.0 94.4
BMX(PAC)-CreERT2; RBPJfl/fl; Tie2-tTA
Mouse 1 2 3 4 5 6 Sum Total connections 28 36 17 32 9 22 144
Enlarged connections 0 1 1 0 0 0 2
Enlarged/Total (%) 0 2.8 5.9 0 0 0