
In vivo characterization of respiratory forces on the ... · In vivo characterization of...
79
In vivo characterization of respiratory forces on the sternal midline following median sternotomy A Thesis Report Submitted to the Faculty of the WORCESTER POLYTECHNIC INSTITUTE In partial fulfillment of the requirements for the Degree of Master of Science by ______________________________ Shruti Pai August 30, 2005 Approved: __________________________________ Kristen L. Billiar, PhD, Thesis Advisor __________________________________ George Pins, PhD, Committee Member __________________________________ Raymond Dunn, MD, Committee Member
Transcript of In vivo characterization of respiratory forces on the ... · In vivo characterization of...
In vivo characterization of respiratory forces on the sternal midline following median sternotomy
A Thesis Report
Submitted to the Faculty of the
WORCESTER POLYTECHNIC INSTITUTE
In partial fulfillment of the requirements for the
Degree of Master of Science
by
______________________________
Shruti Pai
August 30, 2005
Approved:
__________________________________ Kristen L. Billiar, PhD, Thesis Advisor
__________________________________ George Pins, PhD, Committee Member
__________________________________ Raymond Dunn, MD, Committee Member
Pai-MS Thesis
ii
Acknowledgments
I would like to thank the many friends, family, and colleagues who made the completion of this project possible. I am especially grateful to the following people:
Dr. Nicola Francalancia, Dr. Russell Babbitt, Heather Strom, Suzanne Wheeler, and Timothy Roth of the University of Massachusetts Medical School Department of Surgery for their assistance with the surgeries. Dr. Maggie Delano, Dr. Denice Godfrey, Dr. Paul Bergman, Sheila Donahue, and Robin Knox of the University of Massachusetts Medical School Department of Animal Medicine for accommodating our special needs without hesitation. Dr. A. Kumar and Karen Baldwin of Tufts University for teaching me their large animal embalming procedure. Professor Jason Wilbur for his statistical advice and Steve Derosier, Jim Johnston, Will Johnston, Russ Dresher, and Helena Zec of Worcester Polytechnic Institute for their assistance with building the hardware and software components of my instrumentation. Professor George D. Pins and Dr. Raymond M. Dunn for their invaluable advice, patience, and encouragement in their role as committee members. Professor Kristen L. Billiar for being an exceptional mentor, motivator, and teacher and without whom I would never have summoned the courage to start this project or acquired the knowledge to finish it.
This work was supported in part by Johnson & Johnson Wound Management at the University of Massachusetts Department of Surgery.

Pai-MS Thesis
iii
Abstract
The development and clinical adoption of more effective fixation devices for re-approximating
and immobilizing the sternum after open-heart surgery to enable bony healing has been limited, in
part, by the lack of in vitro test methods used to evaluate these devices which precisely emulate in
vivo loading of the sternum. The present study is an initial effort to determine the loading parameters
necessary to improve current in vitro and numerical test methods by characterizing the direction,
magnitude, and distribution of loading along the sternotomy midline in vivo using a porcine model.
Changes in forces incurred by death and embalming were also investigated to estimate the
applicability of cadavers as chest models for sternal fixation. Two instrumented plating systems were
used to measure the magnitude, direction, and distribution of forces across the bisected sternum in
four pigs during spontaneous breathing, ventilated breathing, and coughing for four treatments; live,
dead, embalmed, and refrigerated. Forces were highest in the lateral direction and highest at the
xiphoid. An important finding was that the magnitude of the respiratory forces in all directions was
smaller than anticipated from previous estimations, ranging from 0.37 N to 43.8 N. No significant
differences in force were found between the four treatments, most likely due to the very small
magnitude of the forces and high variability between animals. These results provide a first
approximation of in vivo sternal forces and indicate that small cyclic fatigue loads should be applied
for long periods of time, rather than large quasistatic loads, to best evaluate the next generation of
sternal fixation devices.

Pai-MS Thesis
iv
Table of contents
1. Introduction.................................................................................................................................... 1 2. Background.................................................................................................................................... 3
2.1. The sternum and midline sternotomy .................................................................................... 3 2.2. Alternate sternal fixation techniques .................................................................................... 4 2.3. Test methods for evaluating fixation devices ........................................................................ 5 2.4. Estimations of sternal midline loading ................................................................................. 7 2.5. Chest wall mechanics............................................................................................................ 8
3. Specific Aims and Rationale of Project Approach ...................................................................... 11 4. Materials and Methods ................................................................................................................ 15
4.1. Experimental protocol......................................................................................................... 15 4.2. Force measurement system ................................................................................................. 15 4.3. Treatments........................................................................................................................... 18 4.4. Estimation of the distribution of loading along the sternal midline ................................... 19 4.5. Statistical analysis............................................................................................................... 20
5. Results ......................................................................................................................................... 21 5.1. Static forces are small and consistent................................................................................. 21 5.2. Extent of sternal retraction has limited effect ..................................................................... 22 5.3. Effect of treatment on force direction and magnitude......................................................... 23 5.4. Intrathoracic pressure varies with treatment...................................................................... 27 5.5. Sternal density predicts manubrium subject to larger loads than xiphoid ......................... 28
6. Discussion.................................................................................................................................... 29 6.1. Comparison of measured and estimated magnitude of force.............................................. 29 6.2. Comparison of measured and estimated distribution of force ............................................ 30 6.3. Comparison of measured and estimated direction of force ................................................ 30 6.4. Potential of cadaveric models in future studies .................................................................. 31 6.5. Limitations of the current study .......................................................................................... 31 6.6. Possible mechanism of sternal fixation device failure ........................................................ 33 6.7. Conclusions......................................................................................................................... 34
7. Recommendations........................................................................................................................ 35 References ............................................................................................................................................ 36 Appendix A: Data from pig one ........................................................................................................... 39 Appendix B: Data from pig two ........................................................................................................... 40 Appendix C: Data from pig three ......................................................................................................... 41 Appendix D: Data from pig four .......................................................................................................... 42 Appendix E: Statistics in SigmaStat (Two-way ANOVA with Tukey HSD post-hoc analysis).......... 44 Appendix F: Block diagram of LabView program used during data acquisition................................. 53 Appendix G: Matlab program used to separate static and dynamic forces .......................................... 54 Appendix H: IACUC protocol.............................................................................................................. 56 Appendix I: Mathcad program used to calculate in vitro stress distribution........................................ 67 Appendix J: Protocol used to generate density plots for cadaver sterna .............................................. 70 Appendix K: Plate component drawings in Pro-E................................................................................ 71

Pai-MS Thesis
v
List of figures
Figure 1: Schematic of sternum.............................................................................................................. 3 Figure 2: Post-operative complications .................................................................................................. 4 Figure 3: Various alternative fixation techniques to wires..................................................................... 5 Figure 4: Fixation device evaluation methods........................................................................................ 6 Figure 5: In vitro testing systems used to evaluate sternal fixation devices........................................... 7 Figure 6: Estimation of force magnitude across the sternal midline in vivo. ......................................... 8 Figure 7: Skeletal anatomy of thorax ..................................................................................................... 8 Figure 8: Anatomy of ribcage showing rotation of rib-neck axis........................................................... 9 Figure 9: Abdomen and thorax............................................................................................................... 9 Figure 10: Musculature surrounding sternum ...................................................................................... 10 Figure 11: Differences in animal anatomies......................................................................................... 12 Figure 12: Schematic showing potential force distribution, magnitude, and direction. ....................... 13 Figure 13: Experimental set-up. ........................................................................................................... 16 Figure 14: Schematics showing sample respiratory waveform. ........................................................... 17 Figure 15: Average static forces for all treatments in each direction ................................................... 21 Figure 16: Effect of level of retraction on dynamic forces in all directions......................................... 23 Figure 17: Effect of spontaneous versus ventilated breathing in all directions .................................... 24 Figure 18: Effect of phrenic cough versus valsalva cough on forces in all directions ......................... 24 Figure 19: Effect of valsalva coughing on lateral forces for different treatments................................ 26 Figure 20: Effect of ventilation at 20cm H2O on lateral forces for different treatments ...................... 26 Figure 21: Effect of increased pressure on lateral forces for different treatments ............................... 27 Figure 22: Estimation of distribution of forces across sternal midline in vivo ..................................... 28
List of tables
Table 1: Summary of different measurement groups within each treatment........................................ 18 Table 2: Average static (expiratory baseline) forces for all treatments for each direction (n=3)......... 22 Table 3: Case study investigating the effect of retraction (n=1) .......................................................... 22 Table 4: Average dynamic forces for each direction and treatment (n=3) ........................................... 23 Table 5: Dynamic force distribution as a function of treatment........................................................... 25 Table 6: Case study investigating effect of thoracic pressure (n=1) .................................................... 27

1. Introduction
Median sternotomy, used by cardiothoracic surgeons to access the heart during surgery, requires
that the bisected sternum be reapproximated post-surgery using a fixation device. Although standard
wire fixation is successful in most patients, complications associated with inadequate fixation such as
sternal discomfort, mediastinitis, and dehiscence affect approximately 15,000 Americans every year
(A.H.A., 2004; Stahle, et al., 1997) and of this population 10-40% risk death (El Oakley and Wright,
1996). Despite recent promising investigations of rigid alternatives to wires to reapproximate the
sternum (Centofanti, et al., 2002; Gottlieb, et al., 1994; Ozaki, et al., 1998; Stahle, et al., 1997;
Tavilla, et al., 1991), limited mechanical study and uncertainty about the stability that these novel
devices provide has diminished their widespread clinical use.
Current testing of the efficacy of sternal closure techniques is typically conducted in vitro because
it is a rapid, controlled, inexpensive, and less variable alternative to using cadavers and animal
models. Mechanical stability afforded by different fixation techniques is usually quantified by
quasistatically applying estimated in vivo loads to a model system and observing the separation at the
midline (Dasika, et al., 2003; Losanoff, et al., 2004; Ozaki, et al., 1998; Trumble, et al., 2002). This
separation is assumed to be indicative of micro-motion at the wound site which is thought to be a
critical factor during healing (Chakkalakal, et al., 1999; Claes, et al., 2002; Yamaji, et al., 2001).
However, the simple loading conditions applied in vitro do not appear to adequately represent the
complex loading of the sternum in vivo; we previously noticed uncharacteristically large separations
at the xiphoid region in comparison with clinical observations with near-uniform lateral loading of
wire-fixed sternal models (Pai, et al., 2005). An estimation of the in vivo forces on the sternal midline
based on Wolff’s Law indicated that the large xiphoid distractions were an artifact of the simplified
loading rather than due to inadequate fixation in this area (Pai, et al., Submitted). Since previous test
methods do not necessarily reproduce the loading in vivo because these forces have yet to be

Pai-MS Thesis
2
characterized, the outcomes of these tests have limited physiological relevance and cannot fully
assess the potential clinical shortcomings of novel fixation devices.
In order to improve current in vitro test methods, knowledge of the direction, magnitude, and
distribution of loading along the sternal midline in vivo are necessary. Forces that are placed on the
sternum include respiratory forces due to breathing and coughing (Casha, et al., 1999). As it is not
practical to measure these forces in humans as it would require invasive surgery, preliminary
measurements must be conducted in a model system. Pigs have previously been used as a model of
the human chest (Losanoff, et al., 2002; Trumble and Magovern, 2004) and are an acceptable model
for a preliminary investigation. However, if the effects of rigor mortis and fixation were quantified
and found to be insignificant with respect to living conditions, cadavers would be a more
anatomically accurate model for future tests. Thus, the purpose of this initial study is two-fold; (i) to
quantify the magnitude, direction, and distribution of relevant in vivo respiratory forces on the porcine
sternum that should be used for future evaluation of sternal fixation devices and (ii) to investigate the
accuracy of using cadavers as a future sternal model system.
Pai-MS Thesis
3
2. Background
2.1. The sternum and midline sternotomy
The sternum, or breastbone, is located in the center of the ventral thorax anterior to the vertebral
column and connects to the upper seven pairs of ribs. It is a flat bicortical bone with an outer cortical
shell and an inner cancellous layer containing bone marrow for producing blood; an important factor
post surgery because excessive blood loss and wound exposure increases the risk of complication
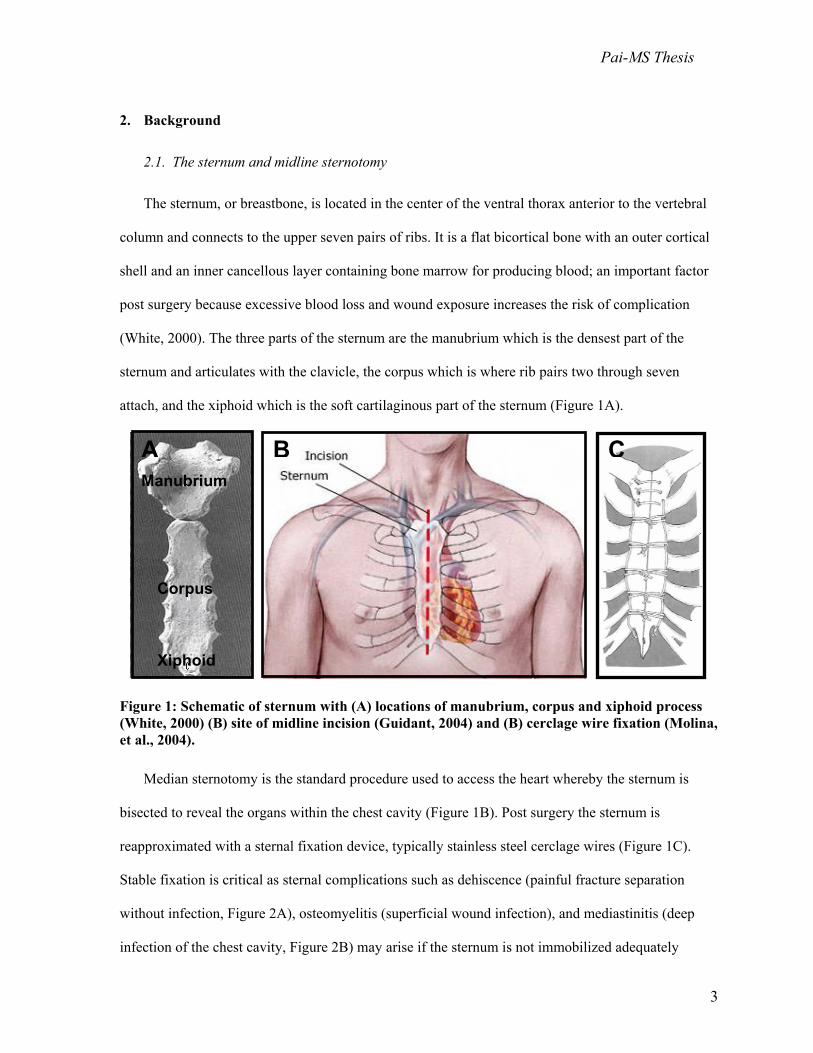
(White, 2000). The three parts of the sternum are the manubrium which is the densest part of the
sternum and articulates with the clavicle, the corpus which is where rib pairs two through seven
attach, and the xiphoid which is the soft cartilaginous part of the sternum (Figure 1A).
Figure 1: Schematic of sternum with (A) locations of manubrium, corpus and xiphoid process (White, 2000) (B) site of midline incision (Guidant, 2004) and (B) cerclage wire fixation (Molina, et al., 2004).
Median sternotomy is the standard procedure used to access the heart whereby the sternum is
bisected to reveal the organs within the chest cavity (Figure 1B). Post surgery the sternum is
reapproximated with a sternal fixation device, typically stainless steel cerclage wires (Figure 1C).
Stable fixation is critical as sternal complications such as dehiscence (painful fracture separation
without infection, Figure 2A), osteomyelitis (superficial wound infection), and mediastinitis (deep
infection of the chest cavity, Figure 2B) may arise if the sternum is not immobilized adequately
Manubrium
Corpus
Xiphoid
A B C

Pai-MS Thesis
4
(Bryan, et al., 1992; Karp, 1996; Loop, et al., 1990; Mayba, 1985; Stoney, et al., 1978). Motion at the
wound site has adverse effects on the healing process (Sargent, et al., 1991) and only a fracture
separation of a few millimeters is thought to be allowable for bony healing to occur (Chakkalakal, et
al., 1999; Claes, et al., 2002; Yamaji, et al., 2001). Patients who are predisposed to poor bone healing
such as those with osteoporosis (weak and brittle bones), diabetes (retarded blood circulation and
healing), and emphysema (large coughing forces) are at higher risk of complications (El Oakley and
Wright, 1996; Stahle, et al., 1997).
Figure 2: Post-operative complications include (A) dehiscence and pull-through of wires (Ozaki, et al., 1998) and (B) mediastinitis (deep infection).
2.2. Alternate sternal fixation techniques
In an attempt to reduce sternal wound healing complications, some surgeons have turned to
alternative more rigid sternal fixation techniques (Figure 3) that are thought to promote faster healing
thereby reducing the likelihood of post-operative complications sternum (Centofanti, et al., 2002;
Gottlieb, et al., 1994; Ozaki, et al., 1998; Stahle, et al., 1997; Tavilla, et al., 1991). Of these methods,
rigid metal plates have been investigated most actively (Gottlieb, et al., 1994; Ozaki, et al., 1998;
Sargent, et al., 1991) due to their established use in reapproximating almost every other fractured
bone in the body (Baugmart and Perren, 1994; Cooper, et al., 1988; Ouellette, et al., 1994). Despite
recent studies reporting the clinical success of rigid metal plates (Hendrickson, et al., 1996; Smoot
BA
Pai-MS Thesis
5
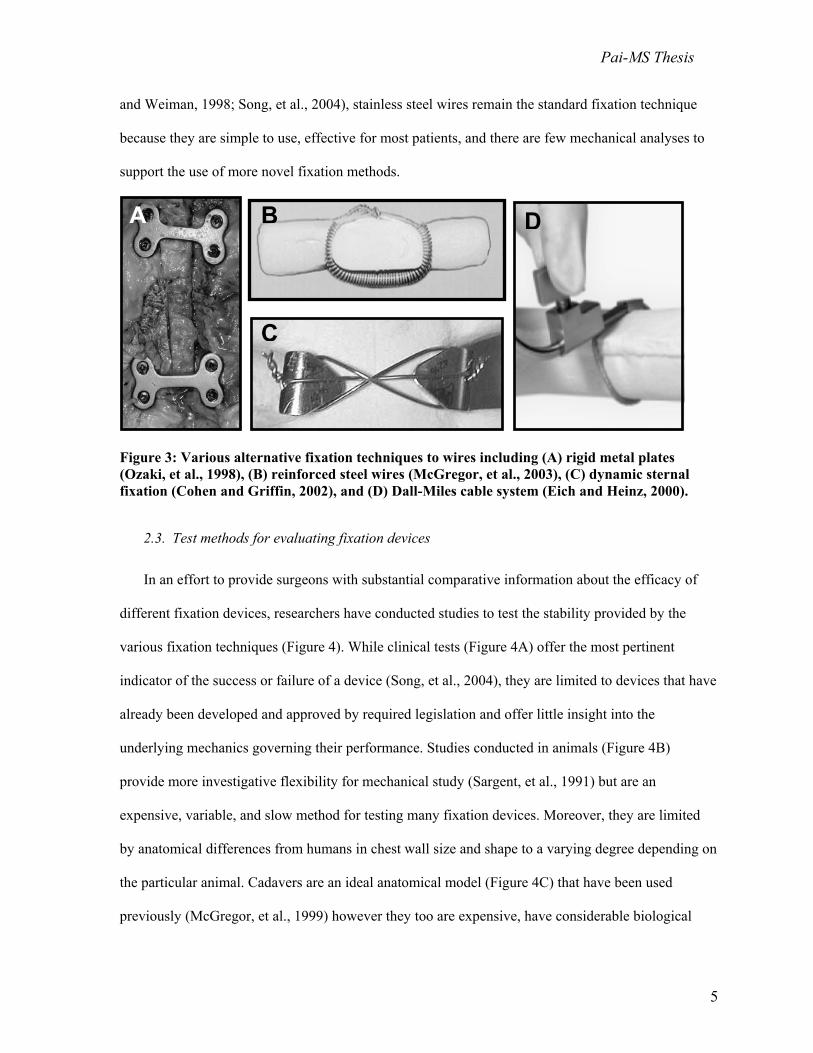
and Weiman, 1998; Song, et al., 2004), stainless steel wires remain the standard fixation technique
because they are simple to use, effective for most patients, and there are few mechanical analyses to
support the use of more novel fixation methods.
Figure 3: Various alternative fixation techniques to wires including (A) rigid metal plates (Ozaki, et al., 1998), (B) reinforced steel wires (McGregor, et al., 2003), (C) dynamic sternal fixation (Cohen and Griffin, 2002), and (D) Dall-Miles cable system (Eich and Heinz, 2000).
2.3. Test methods for evaluating fixation devices
In an effort to provide surgeons with substantial comparative information about the efficacy of
different fixation devices, researchers have conducted studies to test the stability provided by the
various fixation techniques (Figure 4). While clinical tests (Figure 4A) offer the most pertinent
indicator of the success or failure of a device (Song, et al., 2004), they are limited to devices that have
already been developed and approved by required legislation and offer little insight into the
underlying mechanics governing their performance. Studies conducted in animals (Figure 4B)
provide more investigative flexibility for mechanical study (Sargent, et al., 1991) but are an
expensive, variable, and slow method for testing many fixation devices. Moreover, they are limited
by anatomical differences from humans in chest wall size and shape to a varying degree depending on
the particular animal. Cadavers are an ideal anatomical model (Figure 4C) that have been used
previously (McGregor, et al., 1999) however they too are expensive, have considerable biological
B D
C
A

Pai-MS Thesis
6
variation, and it is unknown to what extent rigor mortis and chemical fixation cause physiological
differences (Casha, et al., 1999). More recently numerical simulations such as the finite element
method (FEM, Figure 4D) have been employed (Bruhin, et al., 2005) because they provide a rapid
and inexpensive means of comparing infinite fixation techniques. However, these models are only as
accurate as the geometry, loading, and material property data utilized which are often overly
simplified. Finally, in vitro testing systems are the most common way of testing fixation devices
because they are controlled, precise, rapid and inexpensive.
Figure 4: Fixation device evaluation methods include (A) clinical studies (plate fixation (Song, et al., 2004)), (B) animals ( x-rays of plate and wire fixation in baboons (Sargent, et al., 1991)), (C) cadavers (wire fixation (McGregor, et al., 1999)), and (D) numerical methods (FEM of wire fixation, (Bruhin, et al., 2005)).
Of the in vitro tests conducted to measure sternal stability, two of the main factors used in
determining the mechanical stability of a sternal fixation device are the amount of micro-motion the
device allows (sternal separation or stiffness) and the strength to failure (pull-out strength) of the
device using either cadaveric, porcine, or synthetic (e.g. polyurethane) sterna (Casha, et al., 1999;
Cohen and Griffin, 2002; Dasika, et al., 2003; Losanoff, et al., 2004; McGregor, et al., 1999; Ozaki,
et al., 1998; Pai, et al., 2005; Trumble, et al., 2002). Despite similarities in principle, there is no
standard method of testing sternal fixation devices, and there is considerable variation between
loading regimes (Figure 5) ranging from four-point bending tests (Ozaki, et al., 1998), three-
A B DC

Pai-MS Thesis
7
directional catastrophic loading (Cohen and Griffin, 2002), and lateral loading (Pai, et al., 2005;
Trumble, et al., 2002). Further, we observed phenomena in our in vitro tests (Pai, et al., 2005) that
have not been reported in vivo including separations on the posterior side of the sterna for plated
models and excessively wide separations at the xiphoid for wired models. These discrepancies further
highlight the fact that current in vitro testing systems may not necessarily represent the complex
loading in vivo. Until the forces across the sternal midline are characterized, it will be difficult to
develop a more standardized loading regime for in vitro testing.
Figure 5: In vitro testing systems used to evaluate sternal fixation devices: (A) three directional loading in the lateral, longitudinal shear and transverse shear directions (Cohen and Griffin, 2002), (B) lateral loading (Trumble, et al., 2002), (C) four-point bending compression (Ozaki, et al., 1998), and (D) uniform lateral loading (Pai, et al., 2005).
2.4. Estimations of sternal midline loading
Researchers have suggested that the largest loads placed on the sternum are induced by coughing,
sneezing, or impact (Casha, et al., 1999). Estimations of the magnitude of force exerted on an adult
sternum due to intrathoracic pressure have been calculated using the Law of Laplace (Figure 6).
According to this law, breathing forces range from 160 N to 400 N (Dasika, et al., 2003; Trumble, et
al., 2002) and coughing forces range from 550 N for a normal cough to 1650 N for a maximal cough.
A B C
D

Pai-MS Thesis
8
Figure 6: Estimation of force magnitude across the sternal midline in vivo (Casha, et al., 1999).
2.5. Chest wall mechanics
The respiratory forces on the sternum are complex because they are a product of several factors
including the rotation of the ribs at the spine and sternum as well as the contraction and relaxation of
several muscles of respiration. During inspiration, the ribcage shifts cranially and increases its volume
to allow the lungs to expand as they fill with air (Figure 7).
Figure 7: Skeletal anatomy of thorax showing rib attachments to sternum and spine and changes in anatomy during inhalation (Feher, 1996).
This increase in volume occurs as the diameter of the ribcage increases in the lateral and dorsal-
ventral directions (Figure 8) by rotating the upper and lower ribs about the spine. It is likely that the
forces that act on the ribcage and sternum might act along these directions as well.
Application of Law of Laplace Tension (T) across sternal midline equals product of chest radius (R), chest length (L), and pressure in chest (P):
T = RLP ≈ (0.15 m)(0.25 m)(40 kPa) ≈ 1500 N
L
R
T

Pai-MS Thesis
9
Figure 8: Anatomy of ribcage showing rotation of rib-neck axis during inspiration increases the dorsal-ventral diameter of the upper rib cage (top, pump-handle motion) and the lateral diameter of the lower rib cage (bottom, bucket-handle motion) (De Troyer and Estenne, 1988).
The diaphragm is considered to be the primary muscle of respiration (De Troyer, 1989). During
expiration, the abdominal muscles push the visceral mass (organs within the abdomen) up against the
diaphragm (Figure 9) in what is known as the zone of apposition. The diaphragm transfers the
pressure from the zone of apposition to the thorax, thereby applying an external pressure on the lungs
and forcing them to exhale (De Troyer and Estenne, 1988). Thus the abdominal muscles play an
important role in respiration (Mier, et al., 1985).
Figure 9: Abdomen and thorax showing how the zone of apposition (abdomen) can push the diaphragm towards the chest to create an expiratory pressure (De Troyer and Estenne, 1988).
Pai-MS Thesis
10
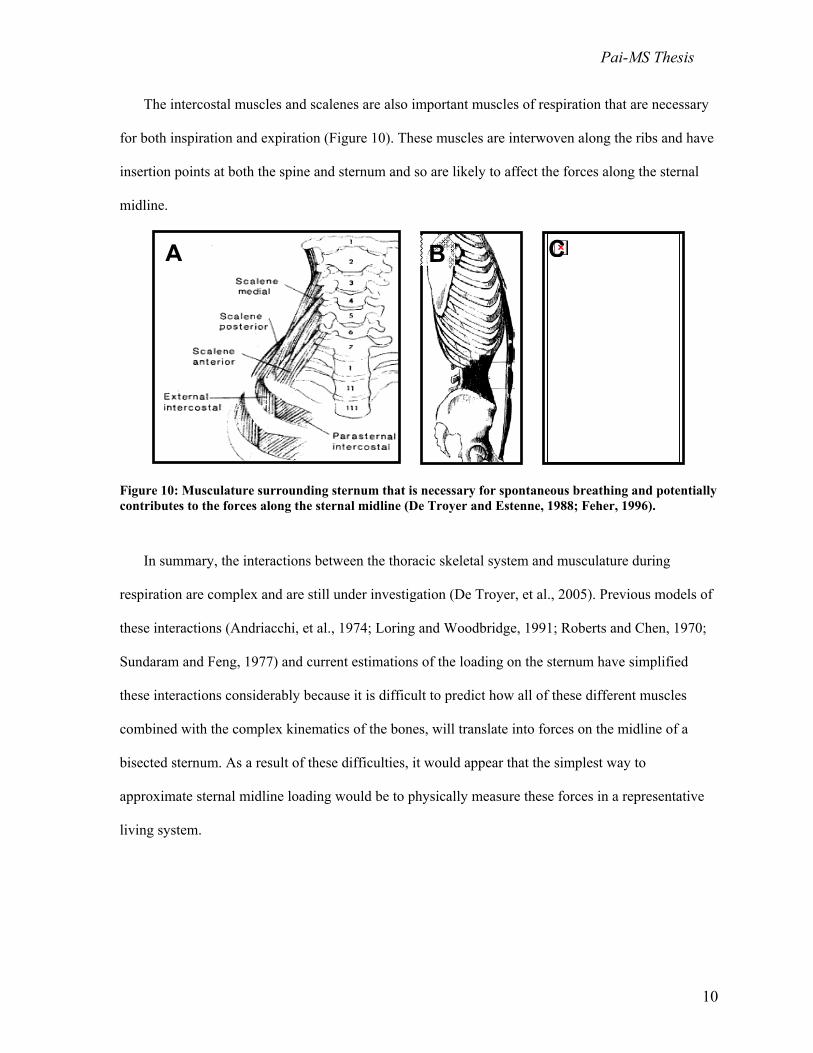
The intercostal muscles and scalenes are also important muscles of respiration that are necessary
for both inspiration and expiration (Figure 10). These muscles are interwoven along the ribs and have
insertion points at both the spine and sternum and so are likely to affect the forces along the sternal
midline.
Figure 10: Musculature surrounding sternum that is necessary for spontaneous breathing and potentially contributes to the forces along the sternal midline (De Troyer and Estenne, 1988; Feher, 1996).
In summary, the interactions between the thoracic skeletal system and musculature during
respiration are complex and are still under investigation (De Troyer, et al., 2005). Previous models of
these interactions (Andriacchi, et al., 1974; Loring and Woodbridge, 1991; Roberts and Chen, 1970;
Sundaram and Feng, 1977) and current estimations of the loading on the sternum have simplified
these interactions considerably because it is difficult to predict how all of these different muscles
combined with the complex kinematics of the bones, will translate into forces on the midline of a
bisected sternum. As a result of these difficulties, it would appear that the simplest way to
approximate sternal midline loading would be to physically measure these forces in a representative
living system.
A B C

Pai-MS Thesis
11
3. Specific Aims and Rationale of Project Approach
The goal of this project was to characterize the physiological forces that occur on the sternum
midline in vivo following median sternotomy in a porcine model. Results from this study will provide
inputs for application in finite element and in vitro sternotomy models used to evaluate sternal
fixation devices. Such improvements to these models will aid in determining the optimal usage and
development of sternal fixation devices. Previous device evaluation methods have been limited by
potentially inaccurate loading conditions, since these forces are not known.
Rationale for experimental model
Although cadavers are anatomically the most appropriate model, it is unclear whether they are a
good approximation of the physiological force conditions in a living model. Clinicians speculate that
the effects of rigor mortis and chemical fixation greatly alter the forces on the sternum due to changes
in chest wall compliance as fixatives such as formaldehyde and formalin have been reported to affect
muscle and bone material properties (Wilke, et al., 1996). Conversely, living animal models are
limited by anatomical differences but are more physiologically appropriate. Primates were too
expensive to use in this study. Dogs have typically been used in respiratory research (De Troyer,
1989; De Troyer and Decramer, 1985; De Troyer, et al., 2005; De Troyer and Wilson, 1993)
however, recent comparisons show that pigs are a more appropriate large animal model of the thorax
(Figure 11A) due to chest wall size and shape (Cook, et al., 1996; Trumble and Magovern, 2004).
While sheep are another popular large animal model, their chest walls are less similarly shaped to
humans than pigs’ are (Popesko, 1977). Although pigs (and other quadrapeds) are limited because of
considerable differences in gross anatomy compared to humans (Figure 11B), they have previously
been used as sternal and thoracic models (Becker, et al., 1972; Losanoff, et al., 2002) and, due to their
aforementioned chest wall size and shape, we found they are an acceptable model for a first
approximation of sternal midline loading.

Pai-MS Thesis
12
Figure 11: Differences in animal anatomies: (A ) comparison of dog, pig and human thorax (Trumble and Magovern, 2004), (B) comparison of human and pig gross skeletal anatomy showing differences between bipeds and quadrapeds (Feher, 1996).
Specific aim 1: Quantify the distribution, magnitude and direction of in vivo sternal forces
during breathing and coughing.
Rationale: We measured respiratory forces because these forces continually act on the sternum
and should be mimicked in a sternal closure testing system. Coughing forces were important to
measure because they are believed to exert the maximum forces on the sternum due to the high
intrathoracic pressures. We measured the force distribution along the sternum because it is not known
whether the manubrium or xiphoid should be loaded more heavily in sternal closure testing systems
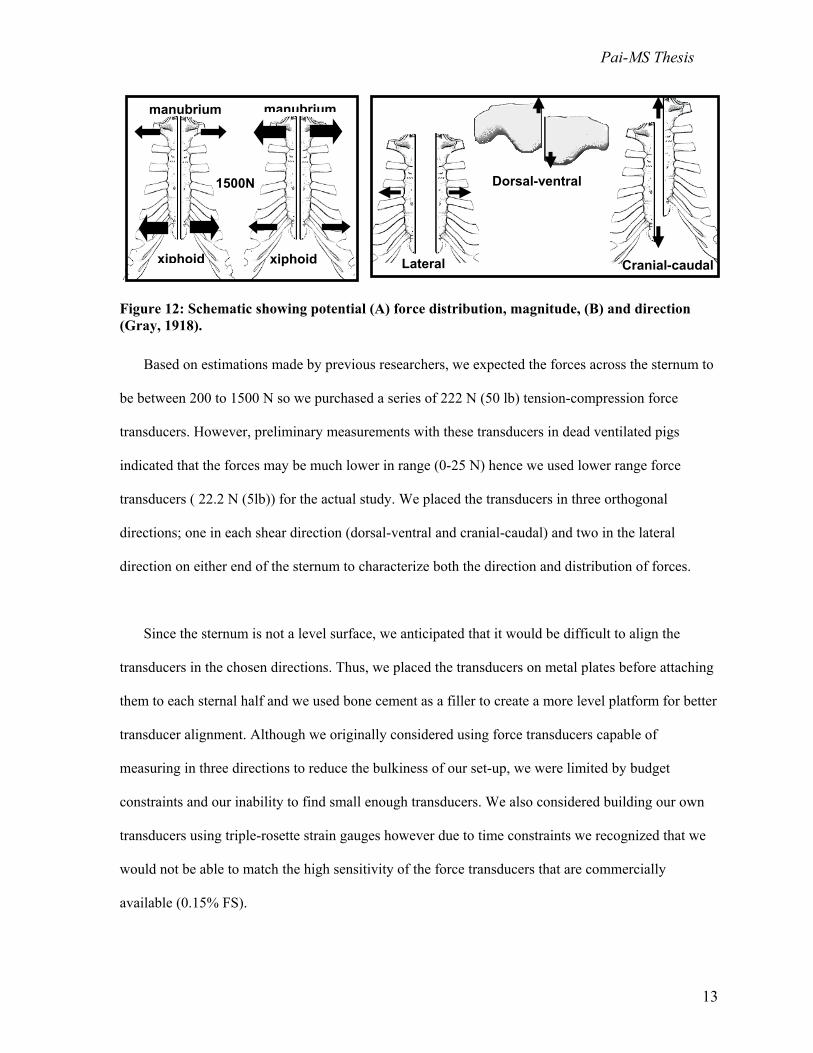
(Figure 12A). Finally, we measured the direction of the forces (Figure 12B) because it seemed likely
that each direction would affect the separation and hence stability at the sternal midline.
A
B
Pai-MS Thesis
13
Figure 12: Schematic showing potential (A) force distribution, magnitude, (B) and direction (Gray, 1918).
Based on estimations made by previous researchers, we expected the forces across the sternum to
be between 200 to 1500 N so we purchased a series of 222 N (50 lb) tension-compression force
transducers. However, preliminary measurements with these transducers in dead ventilated pigs
indicated that the forces may be much lower in range (0-25 N) hence we used lower range force
transducers ( 22.2 N (5lb)) for the actual study. We placed the transducers in three orthogonal
directions; one in each shear direction (dorsal-ventral and cranial-caudal) and two in the lateral
direction on either end of the sternum to characterize both the direction and distribution of forces.
Since the sternum is not a level surface, we anticipated that it would be difficult to align the
transducers in the chosen directions. Thus, we placed the transducers on metal plates before attaching
them to each sternal half and we used bone cement as a filler to create a more level platform for better
transducer alignment. Although we originally considered using force transducers capable of
measuring in three directions to reduce the bulkiness of our set-up, we were limited by budget
constraints and our inability to find small enough transducers. We also considered building our own
transducers using triple-rosette strain gauges however due to time constraints we recognized that we
would not be able to match the high sensitivity of the force transducers that are commercially
available (0.15% FS).
manubrium
xiphoid
manubrium
xiphoid
1500N
Cranial-caudal Lateral
Dorsal-ventral

Pai-MS Thesis
14
Specific aim 2: Determine the effect of spontaneous breathing vs. ventilated breathing on
sternal midline loading.
Rationale: Since sternotomy patients are put on ventilators for substantial periods of time before
being expected to breathe normally, future in vitro device evaluation methods will need to recreate
both forces. Hence, both these forces were important to measure. Additionally, we reasoned that a
difference in response would help estimate the plausibility/ limitations of using cadavers in future
models since they need to be ventilated to simulate breathing.
Specific aim 3: Investigate the difference between live vs. cadaveric sternal midline loading.
Rationale: Since cadavers have more anatomically similar chest walls to living human than any
large animal model, the use of cadavers in lieu of live animals in future biomechanical studies would
increase the anatomical relevance of the studies and minimize animal use and cost. However, the
physiological changes from the living condition to cadaveric state have not been characterized with
respect to sternal forces. By comparing the forces under four treatments in an animal model (living,
dead, embalmed, and refrigerated), we hoped to translate the results to humans to evaluate the
differences between the living condition, fresh cadavers and fixed cadavers.

Pai-MS Thesis
15
4. Materials and Methods
4.1. Experimental protocol
The experiments were conducted in compliance with the University of Massachusetts Medical
School Institutional Animal Care and Use Committee on four female Yorkshire pigs weighing
between 49 and 68 kg (109 and 150 lb). All animals were prepped by fasting for 24 hours prior to
surgery and were anaesthetized with 1 ml/20 kg of a solution of Telazol (2 mg/kg), Ketamine (1
mg/kg), and Xylazine (1 mg/kg), placed on a heating pad in the supine position, intubated, and kept
hydrated by means of a Novalon ear vein catheter supplying saline at 300 ml/hr. Inhaled 1.5%-2.5%
Isofluorane was used for continuous anesthesia. Standard midline sternotomy techniques (Julian, et
al., 1957) were used to separate the sternum while minimizing disturbance of surrounding
musculature (Figure 13A). Two specially designed plating systems used to measure the sternal forces
for several treatments using the same three animals per group were attached sequentially to the sterna
by means of bone screws and bone cement (Depuy Orthopaedics, Warsaw, IN).
4.2. Force measurement system
The first plating system (Figure 13B) was designed to monitor the direction of forces along the
sternum using four 50 lb (222 N) force transducers (Model 31, Honeywell-Sensotec, Columbus, OH)
placed longitudinally, laterally (m-lateral at the manubrium and x-lateral at the xiphoid), and
vertically. The second plating system (Figure 13C) was used to monitor the distribution of the lateral
forces using more sensitive 5 lb (22.2 N) force transducers (Model 31, Honeywell-Sensotec,
Columbus, OH). Additionally, a 50 psi (345 kPa) surface pressure transducer (EPL-B02-10P-/X,
Entran Devices, Inc., Fairfield, NJ) was placed on the posterior side of the sternum to monitor the
local intrathoracic pressure in one animal and a 50 psi (345 kPa) pressure transducer (AB-HP, Data
Instruments, Acton, MA) was placed in the trachea to monitor lung pressure in another animal.

Pai-MS Thesis
16
Figure 13: Experimental set-up showing (A) supine pig with sternum exposed and instrumentation used to measure the forces: a valsalva force was applied at the abdomen near the diaphragm and a phrenic cough was stimulated by applying a voltage to the phrenic nerve. An outline of the directional plating system is shown on the sternum. (B) Close-up of plating system used to measure forces in three orthogonal directions as indicated by the arrows; 222 N (50 lb) force transducers are shown from left to right in the lateral direction at the manubrium, cranial-caudal and dorsal-ventral directions at the midsternum, and lateral direction at the xiphoid. (C) Distributional plating system with 5 lb (22.2 N) force transducers placed laterally at the manubrium and xiphoid. Note that ball-joints were attached to the force transducers from both plating systems to allow free movement in the directions not being measured.
A B
C
manubrium xiphoid
abdomen
diaphragm
cables to force transducers
signal conditioning modules
laptop with DAQ card
to ventilator
connection to phrenic nerve
manubrium xiphoid
manubrium xiphoid
skin & muscle retracted
m-lateral dorsal-ventral
cranial-caudal
x-lateral
m-lateral x-lateral
pressure transducers

Pai-MS Thesis
17
Signals from all force and pressure transducers were filtered (1.6 kHz lowpass filter) and
amplified externally (SC-2345 and SCC-SG24, National Instruments, Austin, TX) before acquisition
using a 12-bit multifunction DAQ board (NI PCI-6221 M-Series, National Instruments, Austin, TX)
at frequency of 100Hz during breathing and ventilation and 500Hz during coughing. Data were
recorded using LabVIEW (National Instruments, Austin, TX) and static forces (expiratory baseline)
were separated from dynamic forces (inspiratory peak, Figure 14) using MATLAB 7.0 (The
MathWorks Inc., Natick, MA).
Figure 14: Schematics showing sample respiratory waveform in red. Static forces are equivalent to the signal base values (shown in green) and represent the force required to bring both sternal halves together without effects of breathing. Dynamic forces are equivalent to the amplitude of the signal (shown in black) and represent the additional force required to hold the sternal halves together due to respiration/coughing.
0 500 1000 1500 2000 2500 3000 3500 4000 4500
1
1.5
2
2.5
3
static
dynamic
5 10 15 20 25 30 35 40 Time(s)
Forc
e (N
)

Pai-MS Thesis
18
4.3. Treatments
Forces were measured under the treatments and measurement groups described below in Table 1.
Table 1: Summary of different measurement groups within each treatment
TREATMENT
MEASUREMENT GROUPS * 1 2 3 4
Live-Spontaneous (L-S) unretracted retracted valsalva cough phrenic cough
Live-Ventilated (L-V) 20 cmH2O 30 cmH2O cough 20 cmH2O
Dead-Ventilated (D-V) 20 cmH2O 30 cmH2O cough 20 cmH2O
Embalmed-Ventilated (E-V) 20 cmH2O 30 cmH2O cough 20 cmH2O 40 cmH2O
Refrigerated-Ventilated (R-V) 20 cmH2O 30 cmH2O cough 20 cmH2O 40 cmH2O
* ventilation pressure values shown with units in cmH20 where 1cmH20 = 98.0665 pascal
The first treatment group we characterized was for animals breathing without the assistance of a
ventilator (“Live-Spontaneous”). The effect of retracting the sternal halves apart was investigated in
the first animal by measuring the forces before and after retractors were used and removed; retracted
sternal halves were separated approximately 4-5 cm and fully retracted sternal halves were separated
by about 10 cm. All subsequent measurements were considered retracted. The effect of coughing was
investigated using two methods; first by electrically stimulating the phrenic nerves in the neck and
second, by manually applying pressures to the abdomen to simulate a valsalva cough. The effect of
spontaneous versus ventilated breathing was investigated by placing the animals on a ventilator for
the “Live-Ventilated” groups. Several pressures were used to investigate the effect of intrathoracic
pressure on sternal force (pressures ranged from 20 to 30 cmH2O; SpO2 was monitored as an indicator
of appropriate ventilation). The effects of death were investigated by euthanizing the animals, storing
them for approximately four hours to ensure similar effects of rigor mortis to a fresh cadaver, and
then measuring the forces (“Dead-Ventilated” group). Similarly, the effects of chemical fixation were
investigated by embalming the animals using embalming fluid typically used to preserve research-
grade cadavers (37% formaldehyde, Cornell Wetting Solution, Hydrol Chemical Co., Yeadon, PA)

Pai-MS Thesis
19
and repeating the measurements (“Embalmed-Ventilated” group). Embalming was performed by first
flushing 20-30 ml of 10,000 units of heparin/ml via catheterization of the common carotid artery to
minimize blood clotting and allow more complete perfusion. Permaflow (Dodge Chemical Co.,
Cambridge, MA) was then pumped through the carotid followed by the embalming fluid at a flow rate
of 3ml/minute by means of a peristaltic pump until the animals were firm to touch (~4 L of fluid).
Finally, the animals were refrigerated for 24 hours at 4ºC before taking the final measurements for the
“Refrigerated-Ventilated” groups.
4.4. Estimation of the distribution of loading along the sternal midline
To estimate the force distribution in our previous in vitro device evaluation system(Pai, et al.,
Submitted), we idealized the polyurethane model as a homogeneous, linearly elastic solid loaded at
multiple locations representing the rib struts. By St. Venant’s principle, the concentrated loads at the
screws were assumed to be distributed evenly at the rib strut/sternum junction and equal to the tether
force divided by the particular strut area. The Flamant/Boussinesq solution (Malvern, 1969)
−+= ∫
i
i
d
c
ixi dssyx
xqyx 222
2
])([2),( πσ
was used to calculate the stress, σ, produced by each rib perpendicular to the midline of the sternum
(x-direction) along its length (y-direction), where rib ‘i’ extends from location ci to di along the y-
direction, and s is an integration variable in the y-direction. The stresses due to the loads at each of
the rib struts, qi, were summed to determine the total stress at each location (x, y), and the load
distribution (force/unit length) was calculated by multiplying the stress along the midline (x = 1.2 cm)
by the thickness and normalizing to unit length. The simulation was implemented in MathCAD
(Mathsoft Engineering and Education Inc., Cambridge, MA).

Pai-MS Thesis
20
For a rough comparison with our loading distribution, we estimated the force distribution at the
midline of human sterna by measuring the cortical bone thickness along the midline of three cadaver
sterna and assuming that the cortical shell bears the majority of the load and that bone forms in
proportion to loading (i.e., Wolff’s law). The sterna were bisected using standard surgical technique,
images were taken using a 6.3 megapixel digital camera (Canon Digital EOS, Japan) and the bone
density was quantified using image analysis software (Scion Image, Scion Corporation, Fredrick,
MD).
4.5. Statistical analysis
The average respiratory forces (dynamic forces caused by inspiration) for both plating systems
were compared for each of the treatments using an analysis of variance (ANOVA) with blocking to
isolate animal-to-animal variability (SigmaStat, Systat Software, Inc., Point Richmond, CA). A p-
value of 0.05 indicated significant differences between groups which were further analyzed by post
hoc analysis using the Tukey HSD.

Pai-MS Thesis
21
5. Results
In general, the measured forces were small relative to previous estimations and all forces were
less than 45 N (~10 lbs). Static forces were larger than dynamic forces in all directions however they
remained under 21 N irrespective of treatment. Dynamic forces ranged from 0.37 N (dorsal-ventral,
L-S unretracted) to 5.33 N (x-lateral, L-S retracted) except for phrenic coughing when forces as high
as 43.8 N (m-lateral) were recorded. The force distribution for each treatment (live, dead, embalmed,
and refrigerated) did not vary significantly. Despite noticeable differences in mean force levels
between measurement groups, the only statistical differences found were between force directions.
5.1. Static forces are small and consistent
The average static forces for all treatment groups are shown in Table 2 and Figure 15. The forces
in the lateral direction, particularly at the manubrium, were 4.5 times higher than the forces in the
other directions. However, there were no statistical differences between directions.
0
5
10
15
20
25
30
35
M-Lateral X-Lateral Cranial-Caudal Dorsal-Ventral
Force Direction
Forc
e (N
)
Figure 15: Average static forces for all treatments in each direction.

Pai-MS Thesis
22
Table 2: Average static (expiratory baseline) forces for all treatments for each direction (n=3)
DIRECTION MEAN ± SD (N )
M-lateral 20.85 ± 10.53
X-lateral 12.79 ± 8.21
Cranial-caudal 4.63 ± 3.21
Dorsal-ventral 9.58 ± 7.42
5.2. Extent of sternal retraction has limited effect
Data from the first animal (Table 3, Figure 16) indicated that increasing the extent of retraction
from unretracted to retracted increased the dynamic forces by over 50% in each direction however,
widely retracting the sternum did not further increase the forces. As a result, the subsequent animals’
sterna were moderately retracted. Retraction increased the forces by approximately 57% to 160%
depending upon direction for all animals.
Table 3: Case study investigating the effect of retraction (n=1)
INSPIRATORY PEAK (N ) Retraction level
(live spontaneous breathing) M-lateral X-lateral Cranial-caudal Dorsal-ventral
Unretracted 0.69 2.42 0.80 0.40
Retracted (4-5 cm) 1.05 5.28 2.42 1.50
Fully retracted (~10 cm) 1.03 5.25 2.31 1.79
Pai-MS Thesis
23
0
1
2
3
4
5
6
unretracted retracted fully retractedLevel of retraction
Forc
e (N
)
M LateralX LateralCranial-CaudalDorsal-Ventral
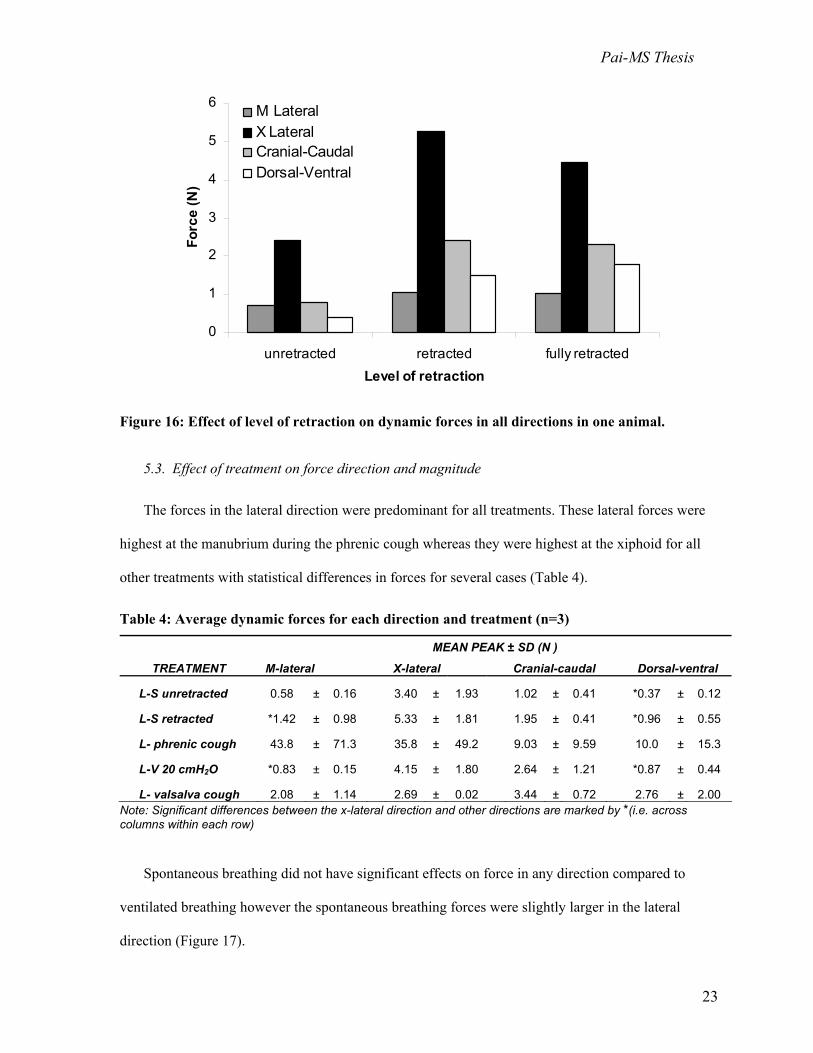
Figure 16: Effect of level of retraction on dynamic forces in all directions in one animal.
5.3. Effect of treatment on force direction and magnitude
The forces in the lateral direction were predominant for all treatments. These lateral forces were
highest at the manubrium during the phrenic cough whereas they were highest at the xiphoid for all
other treatments with statistical differences in forces for several cases (Table 4).
Table 4: Average dynamic forces for each direction and treatment (n=3)
MEAN PEAK ± SD (N )
TREATMENT M-lateral X-lateral Cranial-caudal Dorsal-ventral
L-S unretracted 0.58 ± 0.16 3.40 ± 1.93 1.02 ± 0.41 *0.37 ± 0.12
L-S retracted *1.42 ± 0.98 5.33 ± 1.81 1.95 ± 0.41 *0.96 ± 0.55
L- phrenic cough 43.8 ± 71.3 35.8 ± 49.2 9.03 ± 9.59 10.0 ± 15.3
L-V 20 cmH2O *0.83 ± 0.15 4.15 ± 1.80 2.64 ± 1.21 *0.87 ± 0.44
L- valsalva cough 2.08 ± 1.14 2.69 ± 0.02 3.44 ± 0.72 2.76 ± 2.00 Note: Significant differences between the x-lateral direction and other directions are marked by *(i.e. across columns within each row)
Spontaneous breathing did not have significant effects on force in any direction compared to
ventilated breathing however the spontaneous breathing forces were slightly larger in the lateral
direction (Figure 17).

Pai-MS Thesis
24
Figure 17: Effect of spontaneous versus ventilated breathing in all directions.
Forces in all directions during the phrenic cough were 1.6 to 20-fold higher than those induced by the
valsalva cough. The differences were especially evident in the lateral direction (Figure 18).
0
20
40
60
80
100
120
M-Lateral X-Lateral Cranial-Caudal Dorsal-VentralForce direction
Forc
e (N
)
Phrenic coughValsalva cough
Figure 18: Effect of phrenic cough versus valsalva cough on forces in all directions.
0
1
2
3
4
5
6
7
8
M-Lateral X-Lateral Cranial-Caudal Dorsal-VentralForce direction
Forc
e (N
)
SpontaneousVent 20cmH2O

Pai-MS Thesis
25
Higher forces were generally observed for the live treatments as compared to the dead,
embalmed, and refrigerated treatments (Table 5), although not significantly.
Table 5: Dynamic force distribution as a function of treatment
MEAN PEAK ± SD (N ) TREATMENT M-Lateral X-Lateral
L-V, 20cmH2O 0.61* ± 0.76 1.32* ± 1.40
L-V, 30 cmH2O 0.54* ± 0.06 1.35* ± 0.58
L-V, cough 20 cmH2O 3.99* ± 3.20 3.63* ± 0.31
D-V, 20 cmH2O 0.15 ± 0.06 0.21* ± 0.15
D-V, 30 cmH2O 0.35 ± 0.28 0.30* ± 0.27
D-V, cough 20 cmH2O 0.79 ± 0.84 1.07* ± 0.09
E-V, 20 cmH2O 0.30 ± 0.00 0.24* ± 0.27
E-V, 30 cmH2O 0.53 ± 0.37 0.48* ± 0.42
E-V, cough 20 cmH2O 1.56* ± 1.40 2.14** ± -
E-V, 40 cmH2O 0.58* ± 0.02 0.07** ± -
R-V, 20 cmH2O 0.57 ± 0.33 0.56 ± 0.45
R-V, 30 cmH2O 0.99 ± 1.04 0.94 ± 0.76
R-V, cough 20 cmH2O 2.17 ± 2.42 1.35 ± 1.32
R-V, 40 cmH2O 1.03 ± 0.48 1.38 ± 1.14
R-V, 60 cmH2O 1.54* ± 2.10 1.60* ± 1.95 Note: n=3 unless marked by * which indicates n=2 due to animal loss and dash(-) indicates n=1 due to additional loss of data from equipment malfunction Within each of the treatment groups, coughing caused the highest forces (Figure 19). There were no
significant differences observed between treatments at a constant ventilation pressure of 20 cmH2O
(Figure 20) however, small increases in force were observed with increasing ventilation pressure,
most noticeably for the refrigerated treatment (Figure 21).

Pai-MS Thesis
26
0
1
2
3
4
5
6
7
8
Live Dead Embalmed RefrigeratedTreatment
Forc
e (N
)
M-LateralX-Lateral
Figure 19: Effect of valsalva coughing on lateral forces for different treatments.
0.0
0.5
1.0
1.5
2.0
2.5
3.0
3.5
Live Dead Embalmed Refrigerated Treatment
Forc
e (N
)
M-LateralX-Lateral
Figure 20: Effect of ventilation at 20cm H2O on lateral forces for different treatments.

Pai-MS Thesis
27
0
1
2
3
4
20 30 40 60f ( O)
Forc
e (N
)
M-Lateral
X-Lateral
Figure 21: Effect of increased pressure on lateral forces for the refrigerated treatment.
5.4. Intrathoracic pressure varies with treatment
The static pressures on the sternal surface ranged from 2.18 to 5.11 kPa (Table 6). In comparison,
the dynamic pressures on the posterior side of the sternum were smaller for all treatments. The
dynamic coughing pressures increased by 150% compared to ventilation. Dynamic lung pressures
were typically an order of magnitude higher than the corresponding pressures on the sternal surface
and showed consistent increases during coughing. Static lung pressures also increased during
coughing to a maximum of 38.5 kPa but remained low for all other treatments except for “Live-
Ventilated.”
Table 6: Case study investigating effect of thoracic pressure (n=1)
STERNAL SURFACE (kPa) LUNG (kPa) Treatment Static Dynamic Static Dynamic
L-V 20 cmH2O 2.30 0.32 31.1 7.51 L-phrenic cough 2.18 0.80 35.0 8.67 D-V, 20 cmH2O - - 0.39 1.11 D-V 30 cmH2O 5.11 0.24 0.55 1.60 D-V, cough 20 cmH2O - - 38.5 2.11 E-V, 20 cmH2O - - 0.52 1.21 E-V, 30 cmH2O - - 0.60 1.65 E-V, cough 20 cmH2O - - 40.3 4.57
Ventilation pressure (cmH2O)

Pai-MS Thesis
28
5.5. Sternal density predicts manubrium subject to larger loads than xiphoid
Our analysis of the theoretical force distribution along the sternal midline indicates that the
manubrium would be expected to experience larger loads than the xiphoid in vivo since it is made of
denser and thicker bone (Figure 22, solid line). In comparison with this predicted in vivo loading, our
previous in vitro loading regime using eight points of attachment was relatively consistent in all
locations except for the xiphoid which was loaded substantially higher (Figure 22, dotted line).
Figure 22: Estimation of distribution of forces across sternal midline in vivo (Pai, et al., Submitted).
Forc
e/ U
nit L
engt
h (N
)
0
1 5 0
3 0 0
4 5 0
0 Length of sterna = 1 1
8-tethered
predicted

Pai-MS Thesis
29
6. Discussion
The success of a fixation device depends on its ability to withstand the distracting or separating
forces that act along the sternal midline and to restrict micro-motion between the reapproximated
bone halves. This micro-motion is detrimental to healing because it leads to callus formation (fibrous
tissue that is weaker than native bone) (Chakkalakal, et al., 1999; Claes, et al., 2002; Yamaji, et al.,
2001) and in severe cases may result in infection by preventing the open wound from closing. The
results of this study present the first measurements of the forces acting on the sternal midline in vivo
that may be applied to sternotomy models for the pre-clinical evaluation of a sternal fixation device.
6.1. Comparison of measured and estimated magnitude of force
As presented in the Background section, a simple mathematical model from previous methods
(Casha, et al., 1999) used the Law of Laplace to estimate the lateral forces along the sternotomy
midline by simplifying the chest to be a cylinder. The governing equation, T = RLP, yields that for a
large patient during coughing (P=40 kPa) the force required to hold the sternum halves together may
reach up to 1500 N. According to our data, for an approximate pressure of 35 kPa during a simulated
cough the lateral force at the manubrium and xiphoid were only 44 N and 36 N respectively, yielding
a total force across the sternum of 80 N. While it must be taken into account that a 60 kg (132lb) pig
is not anatomically equivalent to a typical high-risk patient who may weigh over double the pig’s
weight, the difference in force magnitude is still surprising as the forces measured in this study are
twenty times less than those predicted. Even previous in vitro loading regimes that have used smaller
forces between 180 N and 400 N (Dasika, et al., 2003; Trumble, et al., 2002) seem excessive
compared to the forces that might be extrapolated from our data for larger patients. These findings
suggest that, unlike previous in vitro loading regimes, fixation device failure in vivo is not likely due
to large catastrophic forces pulling the sternal halves apart. However, while the sternum may not be
subjected to large respiratory loads, higher forces may result from lifting heavy objects, lying on

Pai-MS Thesis
30
one’s side, or other loading factors which were not investigated in this study and should be considered
in future investigations (see Limitations).
6.2. Comparison of measured and estimated distribution of force
Our estimation of the distribution of forces along the sternal midline using the relative cortical
bone densities of cadaver sterna and assuming Wolff’s law predicts that the manubrium is loaded
twice as heavily as the xiphoid. Thus it should not be surprising that we observed large separations at
the xiphoid with this loading regime in our previous in vitro tests (Pai, et al., 2005) or that similar
models that load the xiphoid heavily have made similar observations (Bruhin, et al., 2005; Dasika, et
al., 2003). However, our current findings show the xiphoid to be subject to larger dynamic loads than
the other locations, significantly during spontaneous and ventilated breathing at 20cm H2O. Since the
forces we measured are so small, it is likely that respiratory forces are not the primary determinant of
sternal bone morphology and that the higher bone density we observed at the manubrium must
compensate for other physiological functions (see Limitations). Thus, future studies should
investigate possible non-respiratory loads placed on the manubrium that might account for its higher
cortical bone density.
6.3. Comparison of measured and estimated direction of force
Many groups have previously assumed that forces in the lateral direction are dominant (Casha, et
al., 1999; Losanoff, et al., 2004; Pai, et al., Submitted; Trumble, et al., 2002) and only a few in vitro
device evaluation methods applied loads in all three coordinate directions (Cohen and Griffin, 2002).
Our results show that while the lateral force direction appears to be predominant for both breathing
and coughing, visible displacements and measurable forces were also noted in the cranial-caudal and
dorsal-ventral directions, and the forces in all directions were on the same order of magnitude. Since
shear forces are believed to delay healing due to shear motion between the bone halves (Augat, et al.,

Pai-MS Thesis
31
2003), the forces in the cranial-caudal and dorsal-ventral directions may play a significant role during
sternal healing. Consequently, our results indicate that future device testing should incorporate
applied loads in multiple directions simultaneously for better physiological accuracy.
6.4. Potential of cadaveric models in future studies
There were few differences in forces along the midline between spontaneous versus ventilated
breathing. This result was surprising because we expected there would be a difference between
negative and positive pressure ventilation. Additionally, the effects of rigor mortis (death) and
chemical fixation (embalming) were not significant. This lack of changes in force between treatments
may be partially due to the fact that our specimens were preserved for a much shorter period than is
typical of research-grade cadavers. Nonetheless, studies investigating the effects of death and fixation
indicate that substantial changes in tissue properties occur within the time frame we employed (Van
Ee, et al., 2000). Although the similarities between treatments might imply that ventilating a cadaver
or dead animal model would simulate live spontaneous breathing, this conclusion should be made
with caution since the forces were too small in general to distinguish between treatments. Thus, future
investigations are still needed to evaluate the accuracy of cadaveric models for sternal device
evaluation.
6.5. Limitations of the current study
The discrepancy between expected and measured force magnitude highlights the fact that
respiratory forces may not be the primary cause of sternal closure failure. Our study is limited in this
respect as we only studied respiratory forces in the supine position. Healthy people are likely to load
their sternum when involved in upper-body exercise such as lifting weights or carrying a back-pack.
However, patients who are recovering from median sternotomy are unlikely to strain themselves in
these ways. In fact, they have the ability to control most forces on their sternum by not exerting

Pai-MS Thesis
32
themselves; the only forces they cannot control are gravitational forces and respiratory forces, such as
those induced by bouts of coughing. Hence, the maximal loads placed on a recovering patient’s
sternal midline are still likely to be induced by coughing. Future tests should consider investigating
the effects of different postures such as prone versus supine or lying on one’s side or chest.
Examining possible sources of error in our data, we ruled out a lack of sensitivity of our
equipment as a source since we specifically chose transducers that are capable of measuring small
changes in force (± 0.03 N for the 22.2 N transducers). Furthermore, the lack of statistical differences
between our results was only partially due to the high animal-to-animal variability; these differences
were taken into account by using pigs as a blocking factor in the ANOVA. One major source of error
may have been the bulky design of our force measurement system. Since we were measuring much
smaller forces than we had anticipated, it is likely that much of the variability in our data came from
the way the force transducers were positioned. It was difficult to pre-tension the transducers or align
the sternal edges perfectly with our instruments because of their size. While we prevented each of the
force transducers from being loaded in any direction other than its specified direction by using ball-
joints, and we used bone cement and metal plates to create a level platform to help align the
transducers, it is possible that slight misalignments that were not immediately visible during
placement on the sternum might have resulted in small differences in force. Since the total forces
were so small, even small changes in force due to non-ideal positioning could lead to substantial
variability. Hence, it is extremely likely that the high standard deviations we observed occurred due to
small changes in transducer positioning. Additionally, it was difficult to control the vigor of both
coughing forces. Although we attempted to apply uniform forces to the animal’s abdomen for each
valsalva cough, we did not take measurements to ensure the same force was applied and even with
stimulation at the same voltage (40 V), there was little consistency between phrenic coughs. Despite
these small inconsistencies that reduced the precision of our data, we remain confident about the
accuracy of our data due to the high sensitivity of our force transducers. If a more ideal measurement

Pai-MS Thesis
33
system were created, we believe that the key findings would be the same; that the respiratory forces
on the sternum in vivo are very small.
6.6. Possible mechanism of sternal fixation device failure
Since the forces we measured are so small, it seems unlikely that the mechanism of failure of a
fixation device is due to catastrophic failure from large loads or inadequate strength of the device
itself. Instead, it is likely due to fatigue from progressive wear of the fixation device into the bone
over long periods of cyclic loading. This fatigue likely occurs due to high stress concentrations at the
bone-device interface, possibly created by pre-tensioning of wires or sharp screw threads. As the
device progressively cuts through the bone, it allows for micro-motion. As an illustrative description
of this mechanism, consider the dynamic forces acting on the sterna (forces pulling bisected sternal
halves apart during respiration or coughing) where the following occurs: (1) instead of resisting the
stresses placed on the bone by the device during each cycle, the device cuts through the bone until (2)
it is also no longer forcing the two sternal halves to be held together so they can now move relative to
each other thereby disrupting healing. For patients considered to be at high risk for complications
because of weak bone quality (osteoporosis) or continual chronic coughing (emphysema), the creation
of stress concentrations at the bone-device interface results in rapid degradation of the sternal wound.
Like most elastic solids, fatigue on bone results from the application of cyclic stresses where the
number of cycles to failure varies with the level of stress (Moore and Gibson, 2003; Pattin, et al.,
1996). For example, it would take many cycles to failure at the low stresses caused by respiration
whereas it would take fewer cycles to failure with the higher stresses caused by coughing. Note that
failure in this context is not the catastrophic destruction of bone but rather the progressive failure at
the bone-device interface leading to micro-motion at the midline that would be disruptive to sternal
healing. Since healing of the sternum may take up to three months in some cases (Wu, et al., 2004), a
fixation device might be considered successful if it could minimize micro-motion in a reapproximated

Pai-MS Thesis
34
sternum for the number of stress cycles that would occur within this time period. Although the critical
factor to control in wound healing is micro-motion, the causative factors that are important for
consideration in the design of future sternal fixation devices will be to reduce stress concentrations
while maintaining adequate purchase in weak bone.
6.7. Conclusions
The results of this paper demonstrate that while coughing produces the highest forces as might be
expected, the magnitudes of respiratory and coughing forces along the sternal midline are much
smaller than previously predicted. We also determined that the forces in the lateral direction are
predominant, most notably at the xiphoid. These forces will need to be characterized for loading
conditions other than respiration and coughing. In contrast to the loading regimes used in previous
investigations of the efficacy fixation devices, it would appear that the success of a fixation device to
reduce micro-motion between the reapproximated sternal halves depends less on withstanding large
static or impulse forces and more on its ability to resist low magnitude cyclic loading. These findings
present a paradigm shift in the way sternal fixation devices should be evaluated in the future. It is our
belief that the development of more physiologically relevant device evaluation methods will reduce
the need for further animal testing, decrease the time and costs associated with testing fixation
devices, and thereby help improve the healthcare of patients undergoing open-heart surgery.

Pai-MS Thesis
35
7. Recommendations
Based on the findings of this study, we recommend that future in vitro and numerical testing
methods used to systematically test sternal fixation devices should incorporate small repetitive cyclic
loads that induce fatigue of bone. This development in testing methods would require that each device
be evaluated for how many cycles it would allow without causing “failure” (disruptive micro-motion
at the sternal midline) in a realistic bone model for both breathing and coughing loading conditions. A
device might be considered successful if the number of loading cycles to “failure” is greater than the
number of cycles necessary for adequate healing. Although acceptable levels of micro-motion and
healing time have been previously studied, we recommend further investigation into these parameters
since they define the success or failure of a device evaluated with our proposed methods. Further, it is
vital that a realistic bone model is used to characterize future loading regimes, particularly one that
mimics poor bone quality, because fixation devices should be able to cater to patients in a worst-case
scenario. To this effect, the device would need to prevent micro-motion for the highest expected
forces. Currently these forces are believed to caused by coughing, as characterized in the present
study; however, we also recommend that future studies investigate other possible forces that might act
on a patient’s sternum (e.g. from lying on their side ).
We also recommend that numerical methods such as FEM should be used in the development of
novel fixation devices because these methods are capable of predicting stress concentrations and
could be used to design fixation systems that will minimize high stresses in bone of poor quality.
Furthermore, they would provide a rapid initial evaluation of which devices and configurations would
yield optimal fixation results before moving on to the above-described in vitro tests.
Pai-MS Thesis
36
References
A.H.A. 2004. Heart disease and stroke statistics - 2005 update. American Heart Association. Andriacchi, T., Schultz, A., Belytschko, T. and Galante, J. 1974. A model for studies of mechanical
interactions between the human spine and rib cage. Journal of Biomechanics 7, 497-507. Augat, P., Burger, J., Schorlemmer, S., Henke, T., Peraus, M. and Claes, L. 2003. Shear movement at
the fracture site delays healing in a diaphyseal fracture model. Journal of Orthopaedic Research 21, 1011-7.
Baugmart, F. W. and Perren, S. M. 1994. Rationale for the design and use of pure titanium internal fixation plates. In: Harvey, J. P. and Games, R. F. (eds.), Clinical and laboratory performance of bone plates, astm stp 1217. American Society for Testing and Materials, pp. 25-33.
Becker, D. M., Lord, L. and Dobell, A. R. 1972. Techniques and pitfalls of anesthesia and thoracic surgery in the pig. Journal of Surgical Research 13, 215-9.
Bruhin, R., Stock, U. A., Drucker, J. P., Azhari, T., Wippermann, J., Albes, J. M., Hintze, D., Eckardt, S., Konke, C. and Wahlers, T. 2005. Numerical simulation techniques to study the structural response of the human chest following median sternotomy. Ann Thorac Surg 80, 623-30.
Bryan, A. J., Lamarra, M., Angelini, G. D., West, R. R. and Breckenridge, I. M. 1992. Median sternotomy wound dehiscence: A retrospective case control study of risk factors and outcome. Journal of the Royal College of Surgeons of Edinburgh 37, 305-8.
Casha, A. R., Yang, L. and Cooper, G. J. 1999. Measurement of chest wall forces on coughing with the use of human cadavers. J Thorac Cardiovasc Surg 118, 1157-8.
Casha, A. R., Yang, L., Kay, P. H., Saleh, M. and Cooper, G. J. 1999. A biomechanical study of median sternotomy closure techniques. European Journal of Cardio-thoracic Surgery 15, 365-9.
Centofanti, P., La Torre, M., Barbato, L., Verzini, A., Patane, F. and di Summa, M. 2002. Sternal closure using semirigid fixation with thermoreactive clips. Annals of Thoracic Surgery 74, 943-5.
Chakkalakal, D. A., Strates, B. S., Mashoof, A. A., Garvin, K. L., Novak, J. R., Fritz, E. D., Mollner, T. J. and McGuire, M. H. 1999. Repair of segmental bone defects in the rat: An experimental model of human fracture healing. Bone 25, 321-32.
Claes, L., Eckert-Hubner, K. and Augat, P. 2002. The effect of mechanical stability on local vascularization and tissue differentiation in callus healing. Journal of Orthopaedic Research 20, 1099-105.
Cohen, D. J. and Griffin, L. V. 2002. A biomechanical comparison of three sternotomy closure techniques. Annals of Thoracic Surgery 73, 563-8.
Cook, K. E., Makarewicz, A. J., Backer, C. L., Mockros, L. F., Przybylo, H. J., Crawford, S. E., Hernandez, J. M., Leonard, R. J. and Mavroudis, C. 1996. Testing of an intrathoracic artificial lung in a pig model. American Society of Artificial Internal Organs Journals 42, M604-9.
Cooper, P. R., Cohen, A., Rosiello, A. and Koslow, M. 1988. Posterior stabilization of cervical spine fractures and subluxations using plates and screws. Neurosurgery 23, 300-6.
Dasika, U. K., Trumble, D. R. and Magovern, J. A. 2003. Lower sternal reinforcement improves the stability of sternal closure. Annals of Thoracic Surgery 75, 1618-21.
De Troyer, A. 1989. The mechanism of the inspiratory expansion of the rib cage. J Lab Clin Med 114, 97-104.
De Troyer, A. and Decramer, M. 1985. Mechanical coupling between the ribs and sternum in the dog. Respir Physiol 59, 27-34.
De Troyer, A. and Estenne, M. 1988. Functional anatomy of the respiratory muscles. Clin Chest Med 9, 175-93.
De Troyer, A., Kirkwood, P. A. and Wilson, T. A. 2005. Respiratory action of the intercostal muscles. Physiol Rev 85, 717-56.

Pai-MS Thesis
37
De Troyer, A. and Wilson, T. A. 1993. Sternum dependence of rib displacement during breathing. J Appl Physiol 75, 334-40.
Eich, B. S. and Heinz, T. R. 2000. Treatment of sternal nonunion with the dall-miles cable system. Plastic and Reconstructive Surgery 106, 1075-8.
El Oakley, R. M. and Wright, J. E. 1996. Postoperative mediastinitis: Classification and management. Annals of Thoracic Surgery 61, 1030-6.
Feher, G. 1996. Cyclopedia anatomicae. Black Dog & Leventhal Publishers, Inc. Gottlieb, L. J., Pielet, R. W., Karp, R. B., Krieger, L. M., Smith, D. J., Jr. and Deeb, G. M. 1994.
Rigid internal fixation of the sternum in postoperative mediastinitis. Archives of Surgery 129, 489-93.
Gray, H. 1918. Anatomy of the human body. Lea & Febiger. Guidant. 2004. Sternotomy. In. http://www.medmovie.com/medialibrary/index.htm. Hendrickson, S. C., Koger, K. E., Morea, C. J., Aponte, R. L., Smith, P. K. and Levin, L. S. 1996.
Sternal plating for the treatment of sternal nonunion. Annals of Thoracic Surgery 62, 512-8. Julian, O. C., Lopez-Belio, M., Dye, W. S., Javid, H. and Grove, W. J. 1957. The median sternal
incision in intracardiac surgery with extracorporeal circulation; a general evaluation of its use in heart surgery. Surgery 42, 753-61.
Karp, R. 1996. Advances in cardiac surgery. Mosby - Year Book Inc. Loop, F. D., Lytle, B. W., Cosgrove, D. M., Mahfood, S., McHenry, M. C., Goormastic, M., Stewart,
R. W., Golding, L. A. and Taylor, P. C. 1990. J. Maxwell chamberlain memorial paper. Sternal wound complications after isolated coronary artery bypass grafting: Early and late mortality, morbidity, and cost of care. Annals of Thoracic Surgery 49, 179-86; discussion 186-7.
Loring, S. H. and Woodbridge, J. A. 1991. Intercostal muscle action inferred from finite-element analysis. Journal of Applied Physiology 70, 2712-8.
Losanoff, J. E., Collier, A. D., Wagner-Mann, C. C., Richman, B. W., Huff, H., Hsieh, F., Diaz-Arias, A. and Jones, J. W. 2004. Biomechanical comparison of median sternotomy closures. Annals of Thoracic Surgery 77, 203-9.
Losanoff, J. E., Foerst, J. R., Huff, H., Richman, B. W., Collier, A. D., Hsieh, F. H., Lee, S. and Jones, J. W. 2002. Biomechanical porcine model of median sternotomy closure. J Surg Res 107, 108-12.
Malvern, L. E. 1969. Introduction to the mechanics of a continuous medium. Prentice-Hall. Mayba, II. 1985. Non-union of fractures of the sternum. The Journal of Bone and Joint Surgery 67,
1091-3. McGregor, W. E., Payne, M., Trumble, D. R., Farkas, K. M. and Magovern, J. A. 2003. Improvement
of sternal closure stability with reinforced steel wires. Ann Thorac Surg 76, 1631-4. McGregor, W. E., Trumble, D. R. and Magovern, J. A. 1999. Mechanical analysis of midline
sternotomy wound closure. Journal of Thoracic and Cardiovascular Surgery 117, 1144-50. Mier, A., Brophy, C., Estenne, M., Moxham, J., Green, M. and De Troyer, A. 1985. Action of
abdominal muscles on rib cage in humans. J Appl Physiol 58, 1438-43. Molina, J. E., Lew, R. S. and Hyland, K. J. 2004. Postoperative sternal dehiscence in obese patients:
Incidence and prevention. Annals of Thoracic Surgery 78, 912-7; discussion 912-7. Moore, T. L. and Gibson, L. J. 2003. Fatigue of bovine trabecular bone. J Biomech Eng 125, 761-8. Ouellette, A., Kato, S., Nakamura, K., Latta, L. L. and Burkhalter, W. E. 1994. Mechanical evaluation
of internal and external fixation for metacarpal fractures. In: Harvey, J. P. and Games, R. F. (eds.), Clinical and laboratory performance of bone plates, astm stp 1217. American Society for Testing and Materials, pp. 95-102.
Ozaki, W., Buchman, S. R., Iannettoni, M. D. and Frankenburg, E. P. 1998. Biomechanical study of sternal closure using rigid fixation techniques in human cadavers. Annals of Thoracic Surgery 65, 1660-5.

Pai-MS Thesis
38
Pai, S., Gunja, N. J., Dupak, E. L., McMahon, N. L., Lalikos, J., Dunn, R. M., Francalancia, N., Pins, G. D. and Billiar, K. L. Submitted. A mechanical study of rigid plate configurations for sternal fixation. Journal of Biomechanics.
Pai, S., Gunja, N. J., Dupak, E. L., McMahon, N. L., Lalikos, J., Dunn, R. M., Roth, T., Francalancia, N., Pins, G. D. and Billiar, K. L. 2005. In vitro comparison of wire and plate fixation for midline sternotomies. Annals of Thoracic Surgery 80, 962-968.
Pattin, C. A., Caler, W. E. and Carter, D. R. 1996. Cyclic mechanical property degradation during fatigue loading of cortical bone. J Biomech 29, 69-79.
Popesko, P. 1977. Atlas of topographical anatomy of the domestic animals. W.B. Saunders Company. Roberts, S. B. and Chen, P. H. 1970. Elastostatic analysis of the human thoracic skeleton. Journal of
Biomechanics 3, 527-45. Sargent, L. A., Seyfer, A. E., Hollinger, J., Hinson, R. M. and Graeber, G. M. 1991. The healing
sternum: A comparison of osseous healing with wire versus rigid fixation. Annals of Thoracic Surgery 52, 490-4.
Smoot, E. C. and Weiman, D. 1998. Paramedian sternal bone plate reinforcement and wiring for difficult sternotomy wounds. Annals of Plastic Surgery 41, 464-7.
Song, D. H., Lohman, R. F., Renucci, J. D., Jeevanandam, V. and Raman, J. 2004. Primary sternal plating in high-risk patients prevents mediastinitis. European Journal of Cardiothoracic Surgery 26, 367-72.
Stahle, E., Tammelin, A., Bergstrom, R., Hambreus, A., Nystrom, S. O. and Hansson, H. E. 1997. Sternal wound complications--incidence, microbiology and risk factors. European Journal of Cardiothoracic Surgery 11, 1146-53.
Stoney, W. S., Alford, W. C., Jr., Burrus, G. R., Frist, R. A. and Thomas, C. S., Jr. 1978. Median sternotomy dehiscence. Annals of Thoracic Surgery 26, 421-6.
Sundaram, S. H. and Feng, C. C. 1977. Finite element analysis in the human thorax. Journal of Biomechanics 10, 505-16.
Tavilla, G., van Son, J. A., Verhagen, A. F. and Lacquet, L. K. 1991. Modified robicsek technique for complicated sternal closure. Annals of Thoracic Surgery 52, 1179-80.
Trumble, D. R. and Magovern, J. A. 2004. Comparison of dog and pig models for testing substernal cardiac compression devices. American Society for Artificial Internal Organs Journal 50, 188-92.
Trumble, D. R., McGregor, W. E. and Magovern, J. A. 2002. Validation of a bone analog model for studies of sternal closure. Annals of Thoracic Surgery 74, 739-44; discussion 745.
Van Ee, C. A., Chasse, A. L. and Myers, B. S. 2000. Quantifying skeletal muscle properties in cadaveric test specimens: Effects of mechanical loading, postmortem time, and freezer storage. J Biomech Eng 122, 9-14.
White, T. 2000. Human osteology. Academic Press. Wilke, H. J., Krischak, S. and Claes, L. E. 1996. Formalin fixation strongly influences biomechanical
properties of the spine. Journal of Biomechanics 29, 1629-31. Wu, L. C., Renucci, J. and Song, D. H. 2004. Rigid-plate fixation for the treatment of sternal
nonunion. J Thorac Cardiovasc Surg 128, 623-4. Yamaji, T., Ando, K., Wolf, S., Augat, P. and Claes, L. 2001. The effect of micromovement on callus
formation. Journal of Orthopaedic Science 6, 571-5.

Pai-MS Thesis
39
Appendix A: Data from pig one

Pai-MS Thesis
40
Appendix B: Data from pig two

Pai-MS Thesis
41
Appendix C: Data from pig three

Pai-MS Thesis
42
Appendix D: Data from pig four
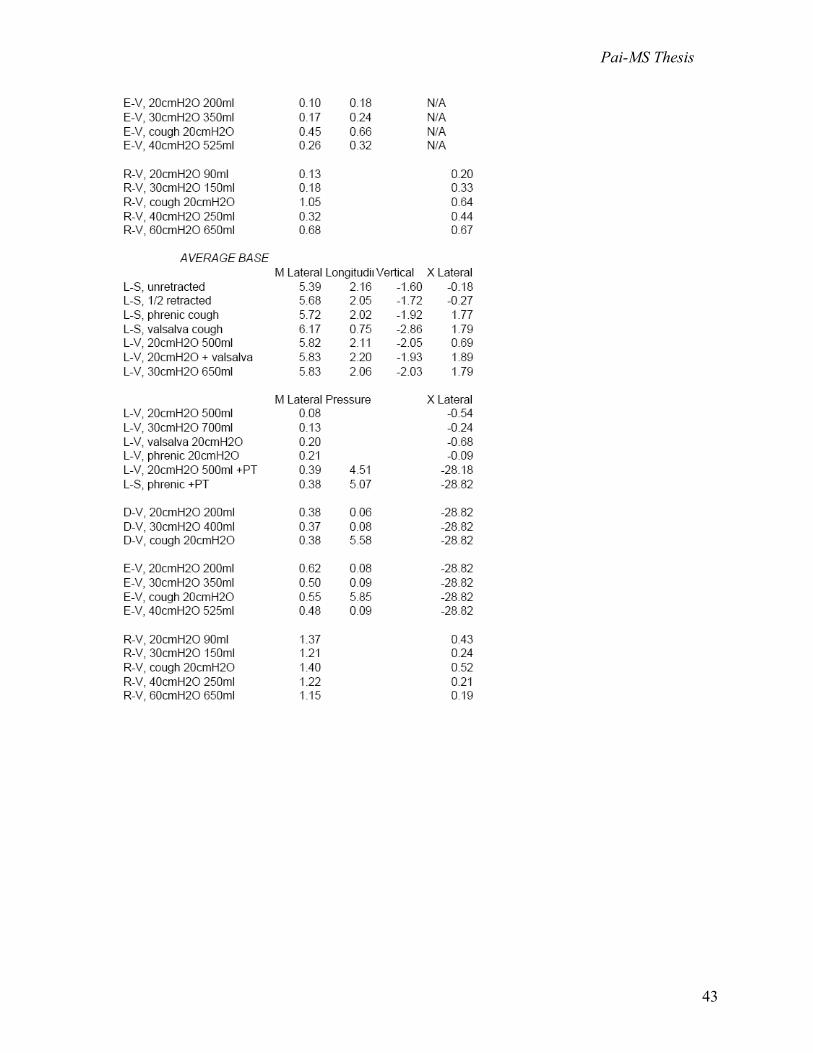
Pai-MS Thesis
43

Pai-MS Thesis
44
Appendix E: Statistics in SigmaStat (Two-way ANOVA with Tukey HSD post-hoc analysis) Question 1: For each treatment, is there a predominant direction? Dependent Variable: L-S unretracted Normality Test: Passed (P = 0.235) Equal Variance Test: Passed (P = 1.000) Source of Variation DF SS MS F P Animal 2 0.0690 0.0345 0.633 0.563 Direction 3 0.888 0.296 5.431 0.038 Residual 6 0.327 0.0545 Total 11 1.283 0.117 The difference in the mean values among the different levels of Direction is greater than would be expected by chance after allowing for effects of differences in Animal. There is a statistically significant difference (P = 0.038). To isolate which group(s) differ from the others use a multiple comparison procedure. Power of performed test with alpha = 0.0500: for Animal : 0.0502 Power of performed test with alpha = 0.0500: for Direction : 0.588 Least square means for Animal : Group Mean Pig 1 0.242 Pig 2 0.254 Pig 3 0.409 Std Err of LS Mean = 0.117
Least square means for Direction : Group Mean M Lateral 0.131 Longitudinal 0.230 Vertical 0.0824 X Lateral 0.764 Std Err of LS Mean = 0.135
All Pairwise Multiple Comparison Procedures (Tukey Test): Comparisons for factor: Direction Comparison Diff of Means p q P P<0.050 X Lateral vs. Vertical 0.681 4 5.056 0.044 Yes X Lateral vs. M Lateral 0.633 4 4.694 0.059 No X Lateral vs. Longitudinal 0.534 4 3.965 0.109 Do Not Test Longitudinal vs. Vertical 0.147 4 1.092 0.865 No Longitudinal vs. M Lateral 0.0983 4 0.730 0.952 Do Not Test M Lateral vs. Vertical 0.0488 4 0.362 0.994 Do Not Test A result of "Do Not Test" occurs for a comparison when no significant difference is found between two means that enclose that comparison. For example, if you had four means sorted in order, and found no difference between means 4 vs. 2, then you would not test 4 vs. 3 and 3 vs. 2, but still test 4 vs. 1 and 3 vs. 1 (4 vs. 3 and 3 vs. 2 are enclosed by 4 vs. 2: 4 3 2 1). Note that not testing the enclosed means is a procedural rule, and a result of Do Not Test should be treated as if there is no significant difference between the means, even though one may appear to exist. Dependent Variable: L-S 1/2 retract Normality Test: Passed (P = 0.172) Equal Variance Test: Passed (P = 1.000) Source of Variation DF SS MS F P Animal 2 0.0416 0.0208 0.288 0.759 Direction 3 1.792 0.597 8.274 0.015 Residual 6 0.433 0.0722 Total 11 2.267 0.206 The difference in the mean values among the different levels of Direction is greater than would be expected by chance after allowing for effects of differences in Animal. There is a statistically significant difference (P = 0.015). To isolate which group(s) differ from the others use a multiple comparison procedure. Power of performed test with alpha = 0.0500: for Animal : 0.0502 Power of performed test with alpha = 0.0500: for Direction : 0.812 Least square means for Animal : Group Mean Pig 1 0.576 Pig 2 0.461 Pig 3 0.593 Std Err of LS Mean = 0.134
Least square means for Direction : Group Mean M Lateral 0.320 Longitudinal 0.439 Vertical 0.216 X Lateral 1.199 Std Err of LS Mean = 0.155

Pai-MS Thesis
45
All Pairwise Multiple Comparison Procedures (Tukey Test): Comparisons for factor: Direction Comparison Diff of Means p q P P<0.050 X Lateral vs. Vertical 0.983 4 6.335 0.017 Yes X Lateral vs. M Lateral 0.879 4 5.663 0.027 Yes X Lateral vs. Longitudinal 0.760 4 4.897 0.050 No Longitudinal vs. Vertical 0.223 4 1.438 0.747 No Longitudinal vs. M Lateral 0.119 4 0.766 0.945 Do Not Test M Lateral vs. Vertical 0.104 4 0.671 0.962 Do Not Test Dependent Variable: L-Phrenic cough Normality Test: Passed (P = 0.136) Equal Variance Test: Passed (P = 1.000) Source of Variation DF SS MS F P Animal 2 531.553 265.777 6.152 0.035 Direction 3 143.707 47.902 1.109 0.416 Residual 6 259.221 43.204 Total 11 934.481 84.953 The difference in the mean values among the different levels of Animal is greater than would be expected by chance after allowing for effects of differences in Direction. There is a statistically significant difference (P = 0.035). To isolate which group(s) differ from the others use a multiple comparison procedure. Power of performed test with alpha = 0.0500: for Animal : 0.592 Power of performed test with alpha = 0.0500: for Direction : 0.0615 Least square means for Animal : Group Mean SEM Pig 1 0.328 3.286 Pig 2 1.367 3.286 Pig 3 14.937 3.286
Least square means for Direction : Group Mean SEM M Lateral 9.839 3.795 Longitudinal 2.030 3.795 Vertical 2.255 3.795 X Lateral 8.051 3.795
All Pairwise Multiple Comparison Procedures (Tukey Test): Comparisons for factor: Direction Comparison Diff of Means p q P P<0.050 M Lateral vs. Longitudinal 7.810 4 2.058 0.514 No M Lateral vs. Vertical 7.584 4 1.998 0.536 Do Not Test M Lateral vs. X Lateral 1.788 4 0.471 0.986 Do Not Test X Lateral vs. Longitudinal 6.022 4 1.587 0.691 Do Not Test X Lateral vs. Vertical 5.796 4 1.527 0.713 Do Not Test Vertical vs. Longitudinal 0.226 4 0.0595 1.000 Do Not Test Dependent Variable: L-V, 20cmH2O Normality Test: Passed (P = 0.630) Equal Variance Test: Passed (P = 1.000) Source of Variation DF SS MS F P Animal 2 0.303 0.151 4.613 0.061 Direction 3 1.158 0.386 11.772 0.006 Residual 6 0.197 0.0328 Total 11 1.658 0.151 The difference in the mean values among the different levels of Direction is greater than would be expected by chance after allowing for effects of differences in Animal. There is a statistically significant difference (P = 0.006). To isolate which group(s) differ from the others use a multiple comparison procedure. Power of performed test with alpha = 0.0500: for Animal : 0.443 Power of performed test with alpha = 0.0500: for Direction : 0.938 Least square means for Animal : Group Mean Pig 1 0.486 Pig 2 0.278 Pig 3 0.667 Std Err of LS Mean = 0.0906
Least square means for Direction : Group Mean M Lateral 0.186 Longitudinal 0.592 Vertical 0.195 X Lateral 0.934 Std Err of LS Mean = 0.105
All Pairwise Multiple Comparison Procedures (Tukey Test): Comparisons for factor: Direction Comparison Diff of Means p q P P<0.050
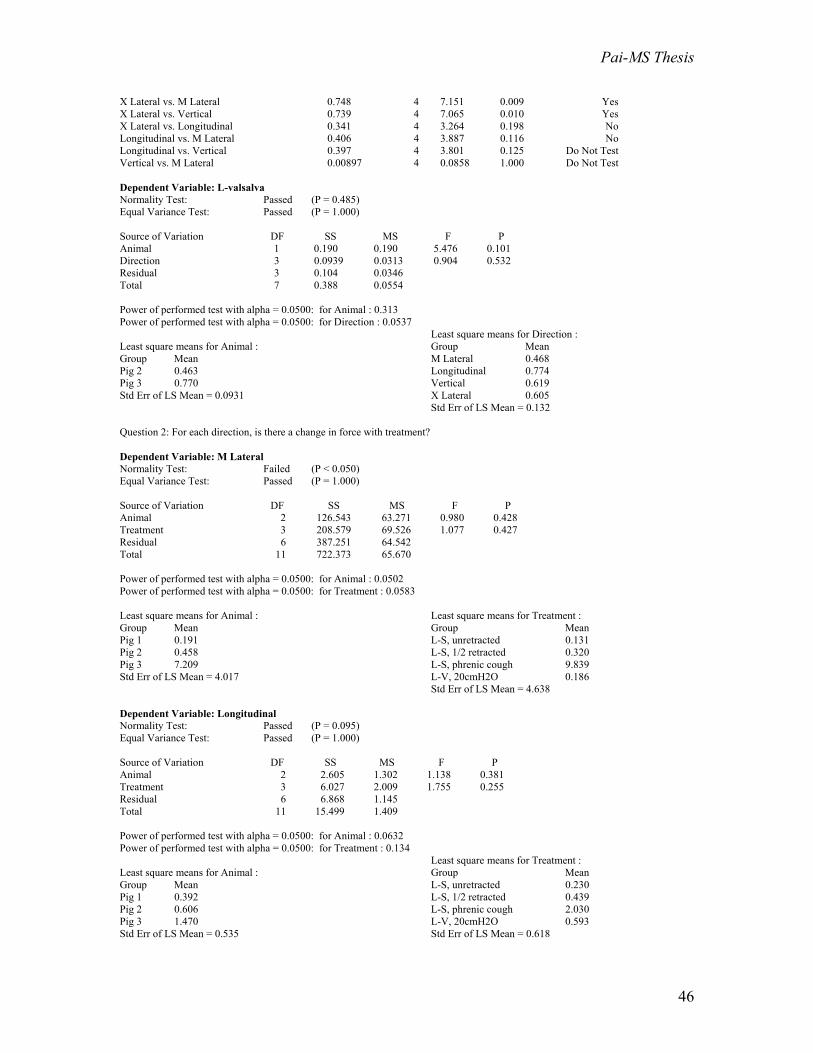
Pai-MS Thesis
46
X Lateral vs. M Lateral 0.748 4 7.151 0.009 Yes X Lateral vs. Vertical 0.739 4 7.065 0.010 Yes X Lateral vs. Longitudinal 0.341 4 3.264 0.198 No Longitudinal vs. M Lateral 0.406 4 3.887 0.116 No Longitudinal vs. Vertical 0.397 4 3.801 0.125 Do Not Test Vertical vs. M Lateral 0.00897 4 0.0858 1.000 Do Not Test Dependent Variable: L-valsalva Normality Test: Passed (P = 0.485) Equal Variance Test: Passed (P = 1.000) Source of Variation DF SS MS F P Animal 1 0.190 0.190 5.476 0.101 Direction 3 0.0939 0.0313 0.904 0.532 Residual 3 0.104 0.0346 Total 7 0.388 0.0554 Power of performed test with alpha = 0.0500: for Animal : 0.313 Power of performed test with alpha = 0.0500: for Direction : 0.0537 Least square means for Animal : Group Mean Pig 2 0.463 Pig 3 0.770 Std Err of LS Mean = 0.0931
Least square means for Direction : Group Mean M Lateral 0.468 Longitudinal 0.774 Vertical 0.619 X Lateral 0.605 Std Err of LS Mean = 0.132
Question 2: For each direction, is there a change in force with treatment? Dependent Variable: M Lateral Normality Test: Failed (P < 0.050) Equal Variance Test: Passed (P = 1.000) Source of Variation DF SS MS F P Animal 2 126.543 63.271 0.980 0.428 Treatment 3 208.579 69.526 1.077 0.427 Residual 6 387.251 64.542 Total 11 722.373 65.670 Power of performed test with alpha = 0.0500: for Animal : 0.0502 Power of performed test with alpha = 0.0500: for Treatment : 0.0583 Least square means for Animal : Group Mean Pig 1 0.191 Pig 2 0.458 Pig 3 7.209 Std Err of LS Mean = 4.017
Least square means for Treatment : Group Mean L-S, unretracted 0.131 L-S, 1/2 retracted 0.320 L-S, phrenic cough 9.839 L-V, 20cmH2O 0.186 Std Err of LS Mean = 4.638
Dependent Variable: Longitudinal Normality Test: Passed (P = 0.095) Equal Variance Test: Passed (P = 1.000) Source of Variation DF SS MS F P Animal 2 2.605 1.302 1.138 0.381 Treatment 3 6.027 2.009 1.755 0.255 Residual 6 6.868 1.145 Total 11 15.499 1.409 Power of performed test with alpha = 0.0500: for Animal : 0.0632 Power of performed test with alpha = 0.0500: for Treatment : 0.134 Least square means for Animal : Group Mean Pig 1 0.392 Pig 2 0.606 Pig 3 1.470 Std Err of LS Mean = 0.535
Least square means for Treatment : Group Mean L-S, unretracted 0.230 L-S, 1/2 retracted 0.439 L-S, phrenic cough 2.030 L-V, 20cmH2O 0.593 Std Err of LS Mean = 0.618

Pai-MS Thesis
47
Dependent Variable: Vertical Normality Test: Failed (P < 0.050) Equal Variance Test: Passed (P = 1.000) Source of Variation DF SS MS F P Animal 2 5.937 2.969 1.011 0.418 Treatment 3 9.867 3.289 1.120 0.412 Residual 6 17.621 2.937 Total 11 33.426 3.039 Power of performed test with alpha = 0.0500: for Animal : 0.0512 Power of performed test with alpha = 0.0500: for Treatment : 0.0626 Least square means for Animal : Group Mean Pig 1 0.220 Pig 2 0.160 Pig 3 1.681 Std Err of LS Mean = 0.857
Least square means for Treatment : Group Mean L-S, unretracted 0.0824 L-S, 1/2 retracted 0.216 L-S, phrenic cough 2.255 L-V, 20cmH2O 0.195 Std Err of LS Mean = 0.989
Dependent Variable: X Lateral Normality Test: Failed (P < 0.050) Equal Variance Test: Passed (P = 1.000) Source of Variation DF SS MS F P Animal 2 74.059 37.030 1.297 0.340 Treatment 3 113.262 37.754 1.323 0.351 Residual 6 171.261 28.544 Total 11 358.582 32.598 Power of performed test with alpha = 0.0500: for Animal : 0.0787 Power of performed test with alpha = 0.0500: for Treatment : 0.0842 Least square means for Animal : Group Mean Pig 1 0.830 Pig 2 1.135 Pig 3 6.246 Std Err of LS Mean = 2.671
Least square means for Treatment : Group Mean L-S, unretracted 0.764 L-S, 1/2 retracted 1.199 L-S, phrenic cough 8.051 L-V, 20cmH2O 0.934 Std Err of LS Mean = 3.085
Dependent Variable: M Lateral Normality Test: Failed (P < 0.050) Equal Variance Test: Passed (P = 1.000) Source of Variation DF SS MS F P Animal 3 126.608 42.203 0.654 0.609 Treatment 4 243.009 60.752 0.941 0.500 Residual 6 387.251 64.542 Total 13 730.373 56.183 Power of performed test with alpha = 0.0500: for Animal : 0.0505 Power of performed test with alpha = 0.0500: for Treatment : 0.0506 Least square means for Animal : Group Mean SEM Pig 1 -1.121 4.400 Pig 2 -0.854 4.400 Pig2 5.535 10.778 Pig 3 5.897 3.593
Least square means for Treatment : Group Mean SEM L-S, unretracted 1.188 5.500 L-S, 1/2 retracted 1.377 5.500 L-S, phrenic cough 10.896 5.500 L-V, 20cmH2O 1.243 5.500 L-S, valsalva cough -2.884 6.811

Pai-MS Thesis
48
Dependent Variable: Longitudinal Normality Test: Failed (P < 0.050) Equal Variance Test: Passed (P = 1.000) Source of Variation DF SS MS F P Animal 3 2.631 0.877 0.766 0.553 Treatment 4 6.298 1.575 1.376 0.346 Residual 6 6.868 1.145 Total 13 15.529 1.195 Power of performed test with alpha = 0.0500: for Animal : 0.0505 Power of performed test with alpha = 0.0500: for Treatment : 0.0924 Least square means for Animal : Group Mean SEM Pig 1 0.275 0.586 Pig 2 0.490 0.586 Pig2 1.126 1.435 Pig 3 1.353 0.478
Least square means for Treatment : Group Mean SEM L-S, unretracted 0.334 0.732 L-S, 1/2 retracted 0.544 0.732 L-S, phrenic cough 2.135 0.732 L-V, 20cmH2O 0.697 0.732 L-S, valsalva cough 0.345 0.907
Dependent Variable: Vertical Normality Test: Failed (P < 0.050) Equal Variance Test: Passed (P = 1.000) Source of Variation DF SS MS F P Animal 3 6.139 2.046 0.697 0.587 Treatment 4 10.310 2.578 0.878 0.529 Residual 6 17.621 2.937 Total 13 33.636 2.587 Power of performed test with alpha = 0.0500: for Animal : 0.0505 Power of performed test with alpha = 0.0500: for Treatment : 0.0506 Least square means for Animal : Group Mean SEM Pig 1 0.0710 0.939 Pig 2 0.0116 0.939 Pig2 0.897 2.299 Pig 3 1.533 0.766
Least square means for Treatment : Group Mean SEM L-S, unretracted 0.172 1.173 L-S, 1/2 retracted 0.305 1.173 L-S, phrenic cough 2.345 1.173 L-V, 20cmH2O 0.285 1.173 L-S, valsalva cough 0.0328 1.453
Dependent Variable: X Lateral Normality Test: Failed (P < 0.050) Equal Variance Test: Passed (P = 1.000) Source of Variation DF SS MS F P Animal 3 74.059 24.686 0.865 0.509 Treatment 4 138.685 34.671 1.215 0.395 Residual 6 171.261 28.544 Total 13 366.373 28.183 Power of performed test with alpha = 0.0500: for Animal : 0.0505 Power of performed test with alpha = 0.0500: for Treatment : 0.0738 Least square means for Animal : Group Mean SEM Pig 1 -0.298 2.926 Pig 2 0.00765 2.926 Pig2 5.112 7.168 Pig 3 5.118 2.389
Least square means for Treatment : Group Mean SEM L-S, unretracted 1.639 3.658 L-S, 1/2 retracted 2.074 3.658 L-S, phrenic cough 8.927 3.658 L-V, 20cmH2O 1.809 3.658 L-S, valsalva cough -2.025 4.529

Pai-MS Thesis
49
Question 3: For each location (m-lateral/ x-lateral), is there a change in force with treatment? Dependent Variable: M Lateral Normality Test: Passed (P = 0.658) Equal Variance Test: Passed (P = 1.000) Source of Variation DF SS MS F P Animal 1 0.00588 0.00588 0.386 0.578 Treatment 3 0.0296 0.00985 0.647 0.635 Residual 3 0.0457 0.0152 Total 7 0.0811 0.0116 Power of performed test with alpha = 0.0500: for Animal : 0.0521 Power of performed test with alpha = 0.0500: for Treatment : 0.0537 Least square means for Animal : Group Mean Pig 2 0.0996 Pig 3 0.154 Std Err of LS Mean = 0.0617
Least square means for Treatment : Group Mean L-V, 20cmH2O 0.183 D-V, 20cmH2O 0.0404 E-V, 20cmH2O 0.0987 R-V, 20cmH2O 0.185 Std Err of LS Mean = 0.0872
Dependent Variable: X Lateral Normality Test: Passed (P = 0.077) Equal Variance Test: Passed (P = 1.000) Source of Variation DF SS MS F P Animal 1 0.0855 0.0855 1.328 0.455 Treatment 3 0.0449 0.0150 0.233 0.870 Residual 1 0.0644 0.0644 Total 5 0.245 0.0491 Power of performed test with alpha = 0.0500: for Animal : 0.0991 Power of performed test with alpha = 0.0500: for Treatment : 0.0940 Least square means for Animal : Group Mean SEM Pig 2 0.111 0.127 Pig 3 0.404 0.220
Least square means for Treatment : Group Mean SEM L-V, 20cmH2O 0.387 0.179 D-V, 20cmH2O 0.217 0.284 E-V, 20cmH2O 0.244 0.284 R-V, 20cmH2O 0.183 0.179
Dependent Variable: M Lateral Normality Test: Passed (P = 0.683) Equal Variance Test: Passed (P = 1.000) Source of Variation DF SS MS F P Animal 1 0.0185 0.0185 1.843 0.268 Treatment 3 0.0569 0.0190 1.891 0.307 Residual 3 0.0301 0.0100 Total 7 0.106 0.0151 Power of performed test with alpha = 0.0500: for Animal : 0.102 Power of performed test with alpha = 0.0500: for Treatment : 0.113 Least square means for Animal : Group Mean Pig 2 0.235 Pig 3 0.138 Std Err of LS Mean = 0.0501
Least square means for Treatment : Group Mean L-V, 30cmH2O 0.121 D-V, 30cmH2O 0.119 E-V, 30cmH2O 0.180 R-V, 30cmH2O 0.326 Std Err of LS Mean = 0.0708
Dependent Variable: X Lateral Normality Test: Passed (P = 0.077) Equal Variance Test: Passed (P = 1.000) Source of Variation DF SS MS F P Animal 1 0.0130 0.0130 2.529 0.357

Pai-MS Thesis
50
Treatment 3 0.0264 0.00881 1.716 0.499 Residual 1 0.00513 0.00513 Total 5 0.0728 0.0146 Power of performed test with alpha = 0.0500: for Animal : 0.121 Power of performed test with alpha = 0.0500: for Treatment : 0.106 Least square means for Animal : Group Mean SEM Pig 2 0.188 0.0358 Pig 3 0.302 0.0621
Least square means for Treatment : Group Mean SEM L-V, 30cmH2O 0.304 0.0507 D-V, 30cmH2O 0.108 0.0801 E-V, 30cmH2O 0.257 0.0801 R-V, 30cmH2O 0.309 0.0507
Dependent Variable: M Lateral Normality Test: Passed (P = 0.458) Equal Variance Test: Passed (P = 1.000) Source of Variation DF SS MS F P Animal 1 0.00180 0.00180 0.00404 0.955 Treatment 2 0.482 0.241 0.543 0.648 Residual 2 0.889 0.444 Total 5 1.373 0.275 Power of performed test with alpha = 0.0500: for Animal : 0.0578 Power of performed test with alpha = 0.0500: for Treatment : 0.0592 Least square means for Animal : Group Mean Pig 2 0.569 Pig 3 0.604 Std Err of LS Mean = 0.385
Least square means for Treatment : Group Mean L-V, cough 0.897 D-V, cough 0.211 R-V, cough 0.651 Std Err of LS Mean = 0.471
Dependent Variable: X Lateral Normality Test: Passed (P = 0.125) Equal Variance Test: Passed (P = 1.000) Source of Variation DF SS MS F P Col 12 1 0.0407 0.0407 0.454 0.623 Col 13 2 0.230 0.115 1.279 0.530 Residual 1 0.0898 0.0898 Total 4 0.424 0.106 Power of performed test with alpha = 0.0500: for Animal : 0.0926 Power of performed test with alpha = 0.0500: for Treatment : 0.0990 Least square means for Animal : Group Mean SEM Pig 2 0.411 0.173 Pig 3 0.613 0.245
Least square means for Treatment : Group Mean SEM L-V, cough 0.816 0.212 D-V, cough 0.326 0.335 R-V, cough 0.394 0.212
Question 4: For each location (m-lateral/ x-lateral), is there a change in force at different ventilation pressures (within treatment groups of live, dead, embalmed, and refrigerated)? Dependent Variable: M Lateral Normality Test: Passed (P = 0.474) Equal Variance Test: Passed (P = 1.000) Source of Variation DF SS MS F P Animal 1 0.0808 0.0808 0.334 0.622 Treatment 2 0.743 0.372 1.538 0.394 Residual 2 0.483 0.242 Total 5 1.307 0.261 Power of performed test with alpha = 0.0500: for Animal : 0.0578 Power of performed test with alpha = 0.0500: for Treatment : 0.0829

Pai-MS Thesis
51
Least square means for Animal : Group Mean Pig 2 0.516 Pig 3 0.284 Std Err of LS Mean = 0.284
Least square means for Treatment : Group Mean L-V, 20cmH2O 0.183 L-V, 30cmH2O 0.121 L-V, cough 0.897 Std Err of LS Mean = 0.348
Dependent Variable: X Lateral Normality Test: Passed (P = 0.365) Equal Variance Test: Passed (P = 1.000) Source of Variation DF SS MS F P Animal 1 0.0670 0.0670 1.286 0.374 Treatment 2 0.302 0.151 2.901 0.256 Residual 2 0.104 0.0521 Total 5 0.473 0.0946 Power of performed test with alpha = 0.0500: for Animal : 0.0703 Power of performed test with alpha = 0.0500: for Treatment : 0.140 Least square means for Animal : Group Mean Pig 2 0.396 Pig 3 0.608 Std Err of LS Mean = 0.132
Least square means for Treatment : Group Mean L-V, 20cmH2O 0.387 L-V, 30cmH2O 0.304 L-V, cough 0.816 Std Err of LS Mean = 0.161
Dependent Variable: M Lateral Normality Test: Passed (P = 0.463) Equal Variance Test: Passed (P = 1.000) Source of Variation DF SS MS F P Animal 1 0.0113 0.0113 0.519 0.546 Treatment 2 0.0293 0.0146 0.672 0.598 Residual 2 0.0436 0.0218 Total 5 0.0842 0.0168 Power of performed test with alpha = 0.0500: for Animal : 0.0578 Power of performed test with alpha = 0.0500: for Treatment : 0.0592 Least square means for Animal : Group Mean Pig 2 0.0800 Pig 3 0.167 Std Err of LS Mean = 0.0852
Least square means for Treatment : Group Mean D-V, 20cmH2O 0.0403 D-V, 30cmH2O 0.119 D-V, cough 0.211 Std Err of LS Mean = 0.104
Dependent Variable: M Lateral Normality Test: Passed (P = 0.197) Equal Variance Test: Passed (P = 1.000) Source of Variation DF SS MS F P Animal 1 0.000148 0.000148 1.126 0.481 Treatment 1 0.00659 0.00659 50.230 0.089 Residual 1 0.000131 0.000131 Total 3 0.00686 0.00229 Power of performed test with alpha = 0.0500: for Animal : 0.0951 Power of performed test with alpha = 0.0500: for Treatment : 0.412 Least square means for Animal : Group Mean Pig 2 0.145 Pig 3 0.133 Std Err of LS Mean = 0.00810
Least square means for Treatment : Group Mean E-V, 20cmH2O 0.0986 E-V, 30cmH2O 0.180 Std Err of LS Mean = 0.00810
Dependent Variable: M Lateral Normality Test: Passed (P = 0.657) Equal Variance Test: Passed (P = 1.000)

Pai-MS Thesis
52
Source of Variation DF SS MS F P Animal 1 0.0155 0.0155 0.130 0.742 Treatment 3 0.231 0.0772 0.649 0.635 Residual 3 0.357 0.119 Total 7 0.604 0.0862 Power of performed test with alpha = 0.0500: for Animal : 0.0521 Power of performed test with alpha = 0.0500: for Treatment : 0.0537 Least square means for Animal : Group Mean Pig 2 0.333 Pig 3 0.421 Std Err of LS Mean = 0.172
Least square means for Treatment : Group Mean R-V, 20cmH2O 0.185 R-V, 30cmH2O 0.326 R-V, cough 0.651 R-V, 40cmH2O 0.345 Std Err of LS Mean = 0.244
Dependent Variable: X Lateral Normality Test: Passed (P = 0.503) Equal Variance Test: Passed (P = 1.000) Source of Variation DF SS MS F P Animal 1 0.0377 0.0377 1.254 0.344 Treatment 3 0.0852 0.0284 0.944 0.518 Residual 3 0.0902 0.0301 Total 7 0.213 0.0304 Power of performed test with alpha = 0.0500: for Animal : 0.0671 Power of performed test with alpha = 0.0500: for Treatment : 0.0537 Least square means for Animal : Group Mean Pig 2 0.267 Pig 3 0.405 Std Err of LS Mean = 0.0867
Least square means for Treatment : Group Mean R-V, 20cmH2O 0.183 R-V, 30cmH2O 0.309 R-V, cough 0.394 R-V, 40cmH2O 0.458 Std Err of LS Mean = 0.123
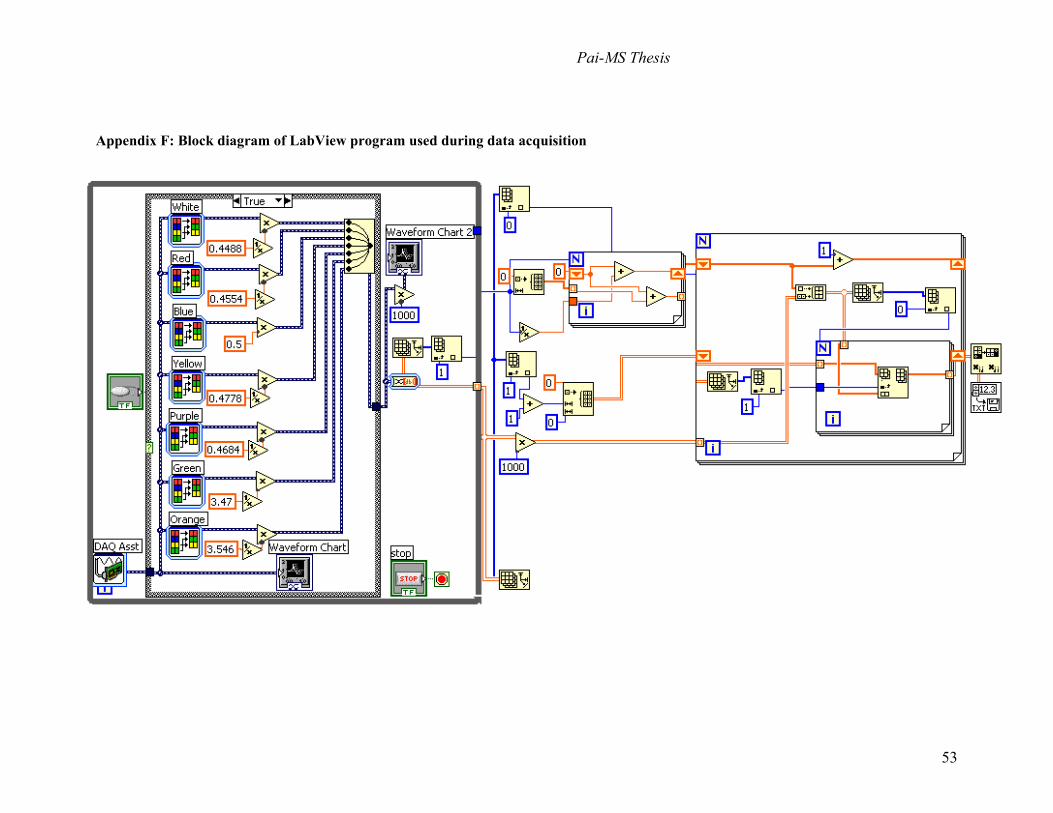
Pai-MS Thesis
53
Appendix F: Block diagram of LabView program used during data acquisition

Pai-MS Thesis
54
Appendix G: Matlab program used to separate static and dynamic forces
%Created by Paul Branche, Modified by Russ Dresher, 6/23/05, Modified by Shruti Pai, 7/18/05 %Calculates the average amplitude and average lower peak of a respiratory waveform %LOADS TEXT FILE + SMOOTHS SIGNAL clear; %clears memory clc; %clears command window load r25_modified.txt %load file X = r25_modified(:,2); %assigns short variable name, looks at specified data column [B,A] = butter (2,.05); %2nd order LPF with 25 Hz cutoff Y = filter(B,A,X); range = (100:3500); %range of data points to be examined for peaks (first 100 data
%points omitted due to transient) %POSITIVE PEAK DETECTION LOOP count = 1; for u = 2:1:(length(Y))-1; r = diff(Y); %first derivative %positive peak detection if r(u - 1) > 0 & r(u) <= 0 & Y(u) >0.51 %detects change in sign of slope u; %shows indeces of peak peaks_index(count) = u; %stores indeces in temp variable count = count + 1; end end %positive spline calculation x = peaks_index; c = Y(peaks_index); xx = [1 :length(Y)]; yy = spline(x,c,xx); %NEGATIVE PEAK DETECTION LOOP counts = 1; for uu = 2:1:(length(Y))-1; %negative peak detection if r(uu - 1) < 0 & r(uu) >= 0 & Y(uu) <0.51 %Y(uu) is amplitude, must adjust boundary for each signal uu; peaks_indexs(counts) = uu; counts = counts + 1; end end %negative spline calculation x1 = peaks_indexs; c1 = Y(peaks_indexs); xx1 = [1 : length(Y)]; yy1 = spline(x1,c1,xx1); %PLOTS WAVEFORM WITH NEGATIVE AND POSITIVE ENVELOPES (splines) figure(1) plot(xx,yy,'b') hold on; plot(Y,'r') hold on; plot(xx,mean(yy(range)),'k') %plots entire signal (positive envelope) hold on; plot(xx,mean(yy1(range)),'k') %plots entire signal (negative envelope) hold on;

Pai-MS Thesis
55
plot(xx1,yy1,'g') hold off; %TWO METHODS TO CALCULATE AVERAGE AMPLITUDE %1) substract mean of negative envelope from mean of positive envelope dynamic_force = mean(yy(range)) - mean(yy1(range)) %2) calculate average peak to peak values countt = 1; for t=1:1:length(xx) individual_peak(countt) = yy(t) - yy1(t); countt = countt + 1; end check_dynamic_force = mean(individual_peak(range)) % mean omits first 100 data points due to transient %CALCULATE AVERAGE PEAK VALUES static_force = mean(yy1(range)) %lower peak maximum_peak = mean(yy(range)) %upper peak

Pai-MS Thesis
56
Appendix H: IACUC protocol
APPLICATION TO USE VERTEBRATE ANIMALS IN RESEARCH OR INSTRUCTION UMMS Institutional Animal Care and Use Committee
Name and Degree Kristen L. Billiar, Ph.D.
Faculty Title Adjunct Assistant Professor of Surgery
Principal Department \ Division or Company Name
Department of Surgery, UMMS Department of Biomedical Engineering, WPI (Primary Appointment)
Investigator
Mailing Address Building
100 Institute Road, Worcester, MA 01602 Salisbury Labs
(Must be UMMS Faculty
M b )
e-mail Address
FAX No. Telephone No.
508-831-5541 Pager #: 781-953-2549 Office: 508-831-5384 Home: 508-793-1946
Name and Degree
Raymond Dunn, M.D.
Co-Investigator
Faculty Title
Chief, Department of Surgery
Department \ Division or Company Name
Department of Surgery, UMMS
Project Title
Mechanical analysis of forces exerted on the sternum in vivo for the design of an accurate sternal fixation testing device
Major X New 3 Year Renewal Amendment FDA-Mandated Level 3 (state changes in a cover letter) (21CFR610)
USE OF THIS APPLICATION FORM • DO NOT change formatting of this document. Type in non-shaded areas only. Forms submitted to IACUC MUST include shading.
If attachments are used, they should be minimum and not replace answers to any section. • In preparing this form, please refer to the Institutional Animal Care and Use Committee Instruction Book. • If you have questions regarding the completion of this form, please contact the IACUC office (508.856.5384) or one of the Dept. of
Animal Medicine veterinarians at (508.856.3151) for guidance. • Please note that upon request the University may be required by law to release a copy of this application to the public.
Signature of Department Chair Date ____________________________________________________
Name (Please Print or Type) Raymond Dunn, M.D.
For IACUC USE ONLY:
Veterinary Review IACUC Reviewer Approved: _____________ DATE
Recommend Modification Recommend or Date Approval Clarification Initials ____________________________________________ ____________________________________________ ____________________________________________ Chair/Vice Chair, IACUC
Docket No. A-1687

Pai-MS Thesis
57
PARTICIPATING PERSONNEL (including PI and Co-Investigator) Identify all personnel expected to be manipulating and/or euthanizing animals at the time of this application.
Name
UMMS Phone
Emergen
cy Phone
How many years of experience do you have with the proposed techniques in this animal model?
Completed
Occupational Health Form
Kristen Billiar, Ph.D.
N/A
781-953-2549
0
X YES NO
Shruti Pai
N/A
215-870-5410
0
X YES NO
Raymond Dunn, M.D.
508-856-5299
1
X YES NO
Nicola Francalancia,
508-334-7828
1
X YES NO
Timothy Roth
508-856-2380
0
X YES NO
Adam Saltman
508-334-3278
20
X YES NO
Suzanne Wheeler
508-856-3644
10
X YES NO
Heather Strom
508-856-1729
0
X YES NO
Helena Zec
N/A
774-253-9595
0
X YES NO
Primary Contact
Name
Kristen Billiar
Person Telephone No.
Office 508-831-5384 Home 508-793-1946
Mailing Address Building
100 Institute Road, Worcester, MA 01602 Salisbury Labs
NOTE: Before other new personnel perform any procedures, a written amendment request must be submitted to and approved by the IACUC. Training and written guidelines on animal handling and basic procedures are available from the Dept. of Animal Medicine (telephone: 508.856.3151). Signatures of all personnel listed above (including PI and Co-Investigator) I have been given an opportunity to read this proposed research study and understand my responsibilities with regard to the care of animals involved. Signature: Name (please type): Kristen Billiar Signature: Name (please type): Raymond Dunn Signature: Name (please type): Nicola Francalancia Signature: Name (please type): Adam Saltman Signature: Name (please type): Timothy Roth Signature: Name (please type): Suzanne Wheeler Signature: Name (please type): Shruti Pai Signature: Name (please type): Heather Strom Signature: Name (please type): Helena Zec

Pai-MS Thesis
58
A. OBJECTIVES OF PROPOSED RESEARCH OR INSTRUCTION A1. Check the box below that describes the type of animal use being proposed.
X Basic Research Service (Cores, Sentinels, etc.) Testing (Biologicals, Toxicity, etc.)
Field Research Instruction or Training Applied Research Other_____
A2: Lay Summary: In clear, concise, non-technical, language (i.e., that could be understood by someone at a high school level), summarize the background and specific aims of your studies involving animals. Sternal fixation has been studied in cadavers and live animals, yet the magnitude, direction, and distribution of forces on the sternum in vivo and how they are altered by median sternotomy are not known. The purpose of this pilot study is to determine the validity of cadaveric models. Although cadavers have been proposed as anatomically appropriate models, cadaveric soft tissue, whether “fresh” or embalmed, is less compliant than live tissue and hence may shield the actual loading that would be experienced by the sternum in a living patient. Alternatively, live animals such as pigs are considered more physiologically accurate, yet they are not anatomically equivalent to a human. We propose to quantify the forces acting on the sternum in pigs before and after sacrifice and embalming to investigate the effects of death and chemical fixation. If substantial changes in the magnitude or distribution of loads occur due to death and fixation, we will use the loading data from the living animals as a first approximation of the loads in a human patient. Specific aims of the project are to determine the: 1) forces acting on the sternum acting at each rib strut in a living porcine model under normal respiration and coughing. 2) distribution of force on the sternum in living, fresh, and embalmed pigs to evaluate the validity of using fresh or embalmed cadavers in lieu of live animals in future biomechanical studies. A3: Briefly explain the relevance of the proposed research or instruction to human or animal health and/or to the advancement of scientific knowledge. Median sternotomy, a routine surgical approach used in open-heart surgery, has a 0.5 to 2.5% complication rate associated with its traditional use of stainless steel sutures for sternal closure (Stahle et al., 1997) translating to approximately 15,000 cases of poor sternal healing and dehiscence in the US every year (NCHS, 2003). Sternal dehiscence leads to discomfort, mediastinitis, osteomyelitis, and is associated with a 10-40% mortality rate (Tavilla et al., 1991). Improving the mechanical stability of sternal fixation devices using rigid plates, as is done for all other bone fractures, appears to facilitate more rapid sternal healing and decrease the likelihood of complications (Ozaki, 1998; Sargent, 1991; Song, 2004). Currently, the number and placement of plates are chosen by the surgeon intuitively. Our goal is to determine the optimal sternal fixation configuration to obtain maximum stability of fixation of the sternum following midline sternotomy. We recently completed an engineering investigation of sternal fixation (in preparation) which indicates that plates are superior to wires. Our testing model consisted of a custom machined pulley system that would replicate the lateral forces across the sternum during normal breathing. However, in analyzing our data (and data from other groups), we determined that a more physiologically relevant testing model is needed to make valid comparisons between plate configurations in vitro. Specifically, an even lateral distribution of forces along the sternum appears to yield unrealistically large distraction of a) the xiphoid region and b) the posterior region. To avoid these limitations, sternal fixation has been studied in cadavers and live animals, however, optimization studies must be conducted in vitro to limit variability and cost. To develop a better model, measurements of the forces on the sternum need to be made in intact chest cavities subjected to realistic breathing and coughing loads. For our studies, we propose to 1) determine the validity of cadavers for measurements of in vivo forces, 2) measure the forces acting on the sternum in animal and/or cadavers, 3) design a test system which applies a controlled and accurate distribution of forces in vitro, and 4) compare the stability of various fixation plate types and configurations using this device. DATABASE SEARCHES In the space below, document that you have searched databases 1. To determine that you are not unnecessarily duplicating previous experiments, AND 2. To determine that alternatives to animal use are either not available or not appropriate. Dates of Searches: 07/01/04, 07/10/04, 07/26/04, 02/07/05, 02/09/05, 04/13/05 Name of the database(s) you searched: Science Direct, PUBMed/Medline, UMMS veterinarians (508.856.3151), Virtual Library of Biosciences http://golgi.harvard.edu/biopages.html, Virtual Library of Veterinary Medicine http://netvet.wustl.edu/vetmed.htm, Altweb http://www.jhsph.edu/~altweb/ Years Covered by Searches: 1965 to present Keywords Searched: Chest Wall Mechanics, Thoracic Surgery, Sternal Fixation, Pig, Sternum, Animal Model, Animal alternatives, In Vitro Model Other Sources of Information: Worcester Polytechnic Institute Database

Pai-MS Thesis
59
B. FUNDING INFORMATION 1. SOURCE(S) OF FUNDING: Name the funding source(s) and then check the appropriate box(es).
Sponsor or Company Name:
Johnson & Johnson
UMMS Account
Number:
Speedtype: 110286 Fund: 23323 DeptID: W824000014 Program: B03 P/G: S82050082000000
Federal Government
Industry Sponsor
UMMS Programs
State or Other Government
Other Private
Department
2. STATUS OF FUNDING: Is funding pending or approved? Pending
Approved X
3. Has or will this protocol undergo peer review as part of a grant application and be evaluated for scientific merit and experimental design:
Yes X
No
C. RATIONALE FOR USING ANIMALS AND ALTERNATIVES TO THE USE OF ANIMALS
C1: Briefly explain why animals are required for your studies. We have already conducted a study in vitro to determine how different closure devices affect the stability of the sternum after post-surgery fixation but found that the results were strongly dependent on the way the force was applied. Since the methods we used were only an approximation of what happens in vivo and it is not possible to measure these forces in humans as it requires invasive surgery, we require animals to study the actual force distribution on a living sternum. Although several studies have used cadavers as a better indicator of in vivo conditions, we are not sure that this is physiologically accurate. Hence in order to validate whether using cadavers is acceptable, we also need to first conduct tests in a living model to see the difference in tissue compliance after fixation. The proposed study is non-survival. C2: Briefly explain why the species you propose to use is/are the most appropriate. Pigs have been shown to be a good large animal model of the human thorax and have been used extensively in cardiothoracic studies. (American Society of Artificial Internal Organs Journals, 1996; 42; p. M604-9 and 2004; 50; p. 188-92) C3: Describe the steps you have taken to reduce the usage of animals and to minimize the lethality of procedures in your experiments (e.g., using cell culture, computer simulations, or non-living models; doing pilot studies, using most specific assays possible. We will first be conducting pilot studies in vitro using cadaveric pig thoraxes from previous studies to determine exactly how we will conduct each stage of the experiments. Thus we will have the opportunity to refine our methods to ensure satisfactory

Pai-MS Thesis
60
NUMBER OF ANIMALS REQUESTED FOR 3 YEARS: PAIN / DISTRESS LEVEL
D1: List the number of animals you will use over the 3-year duration of this protocol. All animals must be accounted for, including embryos and neonates. The total for each row should equal the sum of the values in that row. Species
Number in Pain / Distress Level C
Number in Pain / Distress Level D
Number in Pain / Distress Level E
Species Total
For 3 Years
Yorkshir
0
3
0
3
Pain / Distress level indicates maximum pain or distress level to be experienced by animal(s): C = negligible; D = pain / distress relieved by appropriate drug use; E = pain / distress not relieved by appropriate drug use. See IACUC Instruction Book for definitions and examples D2: If you have animals in category E, use this space to provide a description of the procedures producing pain or distress, and list
the reasons why pain-relieving drugs cannot or will not be used to relieve pain or distress. If pain/distress relief would interfere with
test results, justify why that is true.
N/A D3: If there are federal guidelines that require that you use a category E procedure, then use this space to cite the agency, CFR title, number and specific section. N/A

Pai-MS Thesis
61
E. JUSTIFICATION OF THE NUMBER OF ANIMALS REQUESTED NIH rules require that animal use must be kept to the minimum consistent with a sound scientific outcome. Please use the space below to document that the number of animals requested is appropriate for the goals of the experiments. E1: Write a brief description of experimental design. In a table, show all of the experimental groups and the number of animals per group. Be sure that the totals in the table match the totals shown in Section D (Number of Animals Requested). Three test groups (treatments) will be used, namely Live, Dead, and Embalmed. The same three pigs will be tested after each treatment so although n=3 for each group, the total number of pigs used in the experiment will also be three. For each treatment the pigs intact chest cavities will be subjected to realistic breathing and coughing loads and measurements of the forces on the sternum will be made using force and pressure transducers. The force transducers will be implanted along the midline of the sternum after a routing sternotomy by a surgeon using custom fixture plates that will be screwed into the bone. Pressure transducers will be placed on underside of the sternum. The experiments will be conducted in the Animal Medicine main operating rooms for the first treatment (Live); after euthanasia the animals will be moved to the necropsy facility in Animal Medicine to measure forces for the remaining treatments (Dead and Embalmed).
Treatment (Group) No. of animals used (pigs)
Total No. of Animals
Live 3 Dead 3 Embalmed 3
3 E2: Describe, in general terms, the statistical tests required for the study. Repeated measures ANOVA will be used to determine the effect of treatment (live, dead, embalmed) on the average force magnitude measured and the distribution of forces along the length of the sternum. F. USE OF ANIMALS OUTSIDE OF ANIMAL FACILITIES.
F1. Will animals be used in areas, e.g., laboratories, outside one of the general animal facilities? (A Level, BioTech II, Shriver main facility, MBL main facility, BNRI 1st floor, LRB 1st floor, Rose Gordon Facility) If “No”, proceed to Section G.
YES X NO
If “yes”, list the building and room number(s) where animals will be housed or used outside the animal facility.
Indicate which of the following procedures will be used in the protocol: ___ Breeding ___ Fluid Collection ___ Non-Surgical Procedure _X__ Non-Survival Surgery ___ Survival Surgery ___ Tissue Harvesting ___ Other: Will animals be held, housed, and/or used in study areas outside of the animal facility for more than 12 hours? If “Yes”, in the space below list the building and room number(s), and justify scientifically the need to hold animals for over 12 hours.
YES X NO
F2. Use this space to describe how you will transport animals between the animal facility and the study area. F3. Is a patient procedural area to be used for animal studies? If “Yes”, use the space below to provide room number and/or location of patient area.
YES X NO
F4. If “Yes”, describe any special animal transport or facility procedures that will be followed to assure health and safety of both animals and patients. G. ANIMAL SPECIFICS
G1. Describe the age/weight, sex, and source of each animal species/strain. SPECIES / STRAIN AGE / WEIGHT SEX *VENDOR
Yorkshire Pigs 100lb-200lb F Parsons Farm
G2. If any of your animals have special needs, use the space below to list needs for special handling or housing.
G3. Specify what parameters you will assess to ensure that the animals are healthy before your experiments begin. Check all boxes that apply.
Activity X Appearance X Appetite X Behavior X
Excreta X Respiratory Pattern X Temperature X Weight X Laboratory tests or other observations (specify)
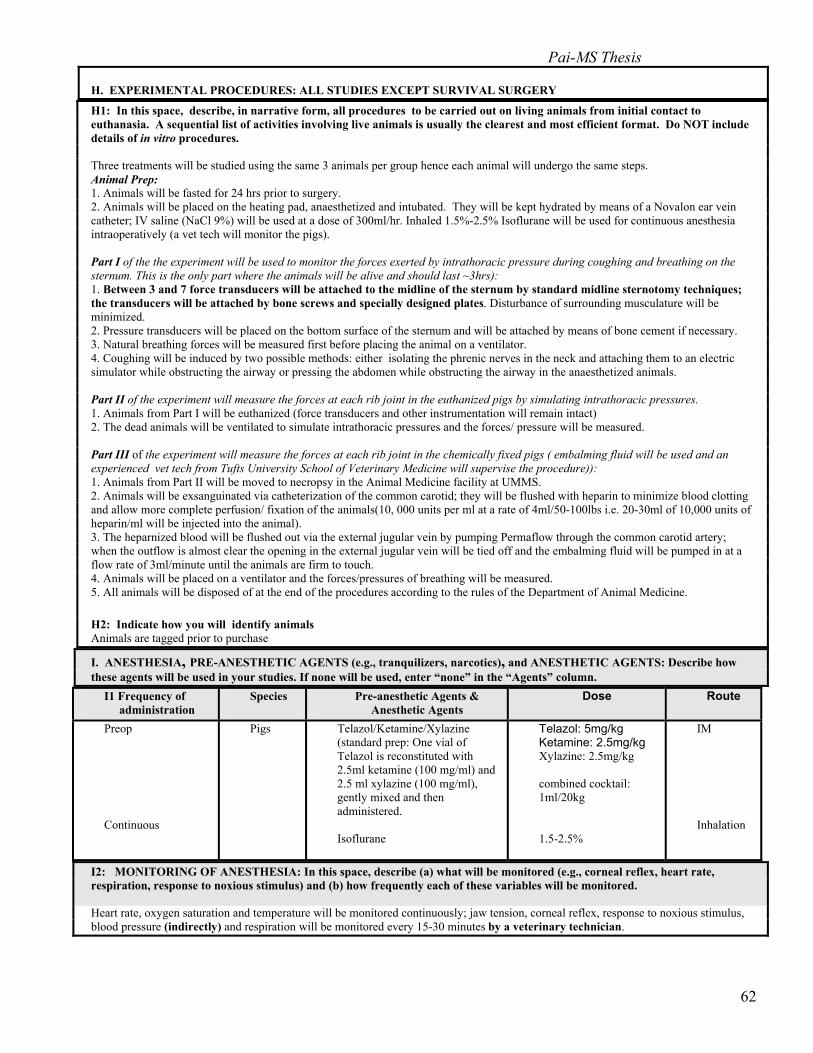
Pai-MS Thesis
62
H. EXPERIMENTAL PROCEDURES: ALL STUDIES EXCEPT SURVIVAL SURGERY
H1: In this space, describe, in narrative form, all procedures to be carried out on living animals from initial contact to euthanasia. A sequential list of activities involving live animals is usually the clearest and most efficient format. Do NOT include details of in vitro procedures. Three treatments will be studied using the same 3 animals per group hence each animal will undergo the same steps. Animal Prep: 1. Animals will be fasted for 24 hrs prior to surgery. 2. Animals will be placed on the heating pad, anaesthetized and intubated. They will be kept hydrated by means of a Novalon ear vein catheter; IV saline (NaCl 9%) will be used at a dose of 300ml/hr. Inhaled 1.5%-2.5% Isoflurane will be used for continuous anesthesia intraoperatively (a vet tech will monitor the pigs). Part I of the the experiment will be used to monitor the forces exerted by intrathoracic pressure during coughing and breathing on the sternum. This is the only part where the animals will be alive and should last ~3hrs): 1. Between 3 and 7 force transducers will be attached to the midline of the sternum by standard midline sternotomy techniques; the transducers will be attached by bone screws and specially designed plates. Disturbance of surrounding musculature will be minimized. 2. Pressure transducers will be placed on the bottom surface of the sternum and will be attached by means of bone cement if necessary. 3. Natural breathing forces will be measured first before placing the animal on a ventilator. 4. Coughing will be induced by two possible methods: either isolating the phrenic nerves in the neck and attaching them to an electric simulator while obstructing the airway or pressing the abdomen while obstructing the airway in the anaesthetized animals. Part II of the experiment will measure the forces at each rib joint in the euthanized pigs by simulating intrathoracic pressures. 1. Animals from Part I will be euthanized (force transducers and other instrumentation will remain intact) 2. The dead animals will be ventilated to simulate intrathoracic pressures and the forces/ pressure will be measured. Part III of the experiment will measure the forces at each rib joint in the chemically fixed pigs ( embalming fluid will be used and an experienced vet tech from Tufts University School of Veterinary Medicine will supervise the procedure)): 1. Animals from Part II will be moved to necropsy in the Animal Medicine facility at UMMS. 2. Animals will be exsanguinated via catheterization of the common carotid; they will be flushed with heparin to minimize blood clotting and allow more complete perfusion/ fixation of the animals(10, 000 units per ml at a rate of 4ml/50-100lbs i.e. 20-30ml of 10,000 units of heparin/ml will be injected into the animal). 3. The heparnized blood will be flushed out via the external jugular vein by pumping Permaflow through the common carotid artery; when the outflow is almost clear the opening in the external jugular vein will be tied off and the embalming fluid will be pumped in at a flow rate of 3ml/minute until the animals are firm to touch. 4. Animals will be placed on a ventilator and the forces/pressures of breathing will be measured. 5. All animals will be disposed of at the end of the procedures according to the rules of the Department of Animal Medicine. H2: Indicate how you will identify animals Animals are tagged prior to purchase I. ANESTHESIA, PRE-ANESTHETIC AGENTS (e.g., tranquilizers, narcotics), and ANESTHETIC AGENTS: Describe how these agents will be used in your studies. If none will be used, enter “none” in the “Agents” column.
I1 Frequency of administration
Species Pre-anesthetic Agents & Anesthetic Agents
Dose Route
Preop Continuous
Pigs Telazol/Ketamine/Xylazine (standard prep: One vial of Telazol is reconstituted with 2.5ml ketamine (100 mg/ml) and 2.5 ml xylazine (100 mg/ml), gently mixed and then administered. Isoflurane
Telazol: 5mg/kg Ketamine: 2.5mg/kg Xylazine: 2.5mg/kg combined cocktail: 1ml/20kg 1.5-2.5%
IM Inhalation
I2: MONITORING OF ANESTHESIA: In this space, describe (a) what will be monitored (e.g., corneal reflex, heart rate, respiration, response to noxious stimulus) and (b) how frequently each of these variables will be monitored. Heart rate, oxygen saturation and temperature will be monitored continuously; jaw tension, corneal reflex, response to noxious stimulus, blood pressure (indirectly) and respiration will be monitored every 15-30 minutes by a veterinary technician.
Pai-MS Thesis
63
J. SURVIVAL SURGERY Complete this section if any animals will recover from anesthesia after a surgical procedure. N/A
J1. In the space below, explain why it is necessary for the animals to recover from surgery.
J2. In the space below, describe pre-operative care (including physical examinations, lab tests, and any preconditioning apparatus). All anesthetic agents and pre-operative medications should be listed in Section I (above).
J3. Use the space below to describe in detail the surgical procedure(s) to be used. J4. List all participating surgeons, technicians, and students, and indicate the number of years of experience with the particular species and procedures to be used. NAME YEARS OF EXPERIENCE
J5. Describe immediate postoperative care, and provide dosage, route, and frequency of administration of specified analgesics for the first 48 hours. Note that “As needed” or “ PRN” do not constitute an acceptable schedule for analgesia.
Species Analgesic Agents Dose Route Frequency of Administration
J6. List the names of individual(s) who will check animals during recovery.
NAME AREA CODE/TELEPHONE#
J7. In the space below describe any expected or potential postoperative complications and describe how you will handle them.
J8. Do all your procedures comply with the GUIDELINES for Common Animal Procedures in the IACUC Instruction Book?
Yes No
J9. Where will surgery be performed? Rm
J10. Where will animals be housed during recovery? Rm
J11. Where will animals be housed after recovery? Rm
J12. MULTIPLE SURVIVAL SURGERIES: If multiple survival surgeries will be performed on the same animal:
J12a: Justify the need for multiple surgeries. (See Instruction Booklet for valid reasons)
J12b: Give the species and number of animals that will have multiple survival surgeries.
J12c: Specify the time intervals between the surgical procedures.
K. ADMINISTRATION OF SUBSTANCES OTHER THAN ANESTHETICS
List all 1) Therapeutic and 2) Experimental/Study non-anesthetic agents that will be administered to the animals, including but not limited to: 1) drugs such as antibiotics, analgesics or local anesthetics used to minimize post-procedural pain, distress, or discomfort, and 2) drugs, infectious agents such as viruses or other substances under study. For drugs under study in the experimental component of your protocol, drug type or group (e.g., non-steroidal anti-inflammatory agents, α-adrenergic receptor blockers) will suffice; however specific drugs should be indicated if known. 1) Therapeutic agents N/A
Species
Agent
Dose
Route
Frequency & Total Duration
Pai-MS Thesis
64
2) Experimental / Study Agents NONE
Species
Agent/Substance Dose
Range
Route Frequency
& Total Duration
L. PROLONGED PHYSICAL RESTRAINT OR STRESS OF CONSCIOUS ANIMALS Complete this section if any unanesthetized animals will be restrained, except when the restraint is for a brief examination, sample collection, or injection. Also complete if noxious stimuli will be administered, if food or water will be withheld, etc. L1. Explain rationale for use of restraint or induction of stress: NONE, all animals will be anaesthetized during experiment and will not be restrained otherwise. Animals will be however be fasted 24hrs before surgery. L2. Describe device, dimensions, etc.: N/A L3. Duration and frequency animal will be confined to device: N/A L4. Observation intervals during confinement: N/A L5. Qualified faculty or staff making observations: Name: AREA CODE/TELEPHONE #: L6. Will pain or discomfort be induced? If yes, describe in detail using the space below.
YES x NO
L7. Will stimulation, including light and sound, be used to modify animal behavior? If yes, describe in detail.
YES x NO
L8. Will animals be fasted (food, approx. 24 hours and/or water, approx. 12 hours) or placed on a diet deficient in one or more nutrients? If yes, how long? How will the general well-being of the animal be determined? How often will the animal be weighed?
x YES NO 12-24 hrs Water only
L9. Will analgesics, sedatives, or tranquilizers be used to provide additional restraint? If yes, make sure that the agent(s) are listed in Section I (above).
YES x NO
M. HAZARDOUS AGENT INFORMATION M1. Will this project require the use of infectious biological agents? (pathogenic to man or animal) If Yes, an IBC form needs to be submitted
YES
X NO
M2. Will this project require the use of recombinant DNA technology in live animals? If Yes, an IBC form needs to be submitted
YES
X NO
M3. Will this project require the use of ionizing radiation in live animals? If Yes, radiation safety approval is required
YES X NO
M4. Will this project require the use of cytotoxic or chemotherapeutic chemicals in live animals? If Yes, an Environmental Health & Safety form needs to be submitted
YES
X NO
M5. If you will be using any of the above agents, use this space to describe briefly what you will be doing. However, you will need to get approval from the appropriate committee overseeing that activity. The IACUC will take no action on your application until approval has been obtained from the appropriate committee(s). If M1.,M2., or M4. is checked “yes”, please contact the IBC contact person from the EH&S office (508-856-3985) to obtain the proper forms and to begin the process of approval for Biosafety issues. If M3 is checked “yes”, please contact the Radiation Safety Office.

Pai-MS Thesis
65
N. ADVERSE EFFECTS OF PROCEDURES AND EXPERIMENTS/ MONITORING AND MANAGEMENT N1. What will be monitored to assess the presence of pain, discomfort, or other potential adverse effects caused by your studies? NOTE: This period includes the time from initiation of experiments until the animals are removed from the study; for surgically operated animals, this includes the time after anesthesia recovery (Section J) until animals are removed from the study. Check all that apply. N/A, no recovery from anesthesia is anticipated
Activity Appearance Appetite Behavior
Excreta Grooming Guarding Heart rate
Licking, biting Posture Respiratory rate Temperature
Vocalizing Weight loss Wound site Other
Laboratory tests or other evaluation
N2. Indicate the frequency with which you will monitor your animals during and after all procedures. Please indicate both monitoring interval and total length of time.
Animals will be monitored during the first treatment phase but will be euthanized immediately after.
N3. Describe the conditions and complications that would lead to removal of an animal from the study and how this will be accomplished (e.g., stopping treatment and/or euthanasia).
O TERMINATION OF STUDY / EUTHANASIA O1. Is death used as an endpoint in this study? Death as an endpoint means that the animal is permitted to die as a result of experimental manipulation, i.e. exclusive of planned euthanasia. If yes, explain why an earlier end point is not acceptable. (Studies using death as an endpoint are Category 3 (E) and require full IACUC review)
YES X NO
O2. What criteria will be used to perform euthanasia earlier than planned? O3. Other Use – Will animals be available for further use by other investigators?
O4. Describe the method(s) of euthanasia for each species or procedure. For injectable drugs, give name, dose and route. Must comply with 2000 Report of the American Veterinary Medical Association (AVMA) Panel on Euthanasia. See the IACUC Instruction Book. (Animal Welfare Act, 9 CFR, 2.31)(PHS Policy – Section B-2-3)(AVMA Panel on Euthanasia)
Species Method/Drug Dose (mg/kg body wt.) Route Pig Fatal Plus 1cc per 10lbs IV (sodium pentobarbital (390 mg/ml)) O5. Current rules require that after euthanasia, death be confirmed by using a second method. For example bilateral pneumothorax is done after euthanasia using CO2. Indicate below how you will double kill your animals. Bilateral pneumothorax will be performed after an IV sodium pentobarbital (Fatal Plus ®) injection (1 mL/10 lbs).

Pai-MS Thesis
66
P. APPLICANT’S CERTIFICATION IACUC is charged with carrying out the rules and regulations of the Federal Government’s Animal Welfare Act governing the care and use of animals in research and instruction. The Act stipulates that (a) Principal Investigators must give written assurance that the activities do not unnecessarily duplicate previous experiments; (b) procedures involving animals must avoid or minimize discomfort, distress, and pain to the animals; (c) Principal Investigators must consider alternatives to procedures that cause more than momentary or slight pain or distress to the animals and give a written description of methods used to determine that alternatives are not available; and (d) paralytic agents cannot be used in unanesthetized animals. Accordingly, the Applicant, who must be a member of the faculty holding Principal Investigator status, is required to read and sign the following certification: BY SIGNING BELOW, I CERTIFY THE FOLLOWING:
1. I am thoroughly familiar with the literature in the field of research proposed in this application, and I have determined that the research does not unnecessarily duplicate experiments, that appropriate non-animal models are not available, and that the research must be conducted on living animals.
2. I will abide by all UMMS policies and procedures regulating use of animals in instruction and research, by the provisions of the PHS/NIH Guide for the Care and Use of Laboratory Animals, and by all other applicable laws, policies, and regulations governing the use of animals in instruction and research.
3. I will supervise all experiments involving live animals. Furthermore, I will ensure that all listed participants are qualified or will be trained in proper procedures, including animal handling, anesthesia, surgery, post-procedural management, and euthanasia. Also, I will ensure that individuals not listed in the application will not have responsibility in experiments involving animals.
4. All listed personnel will read the IACUC-approved Application to Use Vertebrate Animals in Research or Instruction before undertaking any procedures on laboratory animals.
5. Survival surgery will be performed using standard aseptic procedures.
6. Animal Medicine clinical veterinary staff will be consulted as needed to ensure satisfactory veterinary care.
7. If I cannot be contacted, and animals in this project show evidence of illness or pain, emergency care, including euthanasia, may be administered at the discretion of the Animal Medicine veterinary staff.
8. This application meets all animal use and care requirements of the funding agencies that have been asked to support the research.
9. By signing below, I certify that all animal studies described in grant proposals using this protocol are described in this animal use application. Signature: Date:___________

Pai-MS Thesis
67
Appendix I: Mathcad program used to calculate in vitro stress distribution
0 5 10 15 200
10
20
30
40
50
σx_total x1 y,( )
σx_trumble x1 y,( )
q_ave y( )
σx x1 y, 4,( )
y
σx_trumble x y,( )
j
2σx x y, 2 j+,(∑:=q_ave y( )FL
:=x1 1.2:=
j 0 3..:=
σx_total x y,( )
i
σx x y, i,( )∑
:=σx x y, i,( )
1π
ci
di
s2qix3
x2 y s−( )2+
2⋅
⌠⌡
d
⋅:=
i 0 7..:=
Force per length (N/cm)
Length (cm)
L 19.5:=q
25
30
28.125
30
30
28.125
32.143
32.143
=q
F
ribs
d c−( ):=
d
3
4.5
6.6
9.2
11.7
14.1
16.7
18.1
:=c
1.2
3
5
7.7
10.2
12.5
15.3
16.7
:=
Force (N) in each rib is F/8force per length, q,depends upon thewidth of each rib
F 360:=
ribs 8:=
analytical solution from Malvern 1969
Two-dimensional stress field due to multiple distributed loads

Pai-MS Thesis
68
Data export, just right click on the data arrray and choose export
k 0 195..:= distance along length in mm
stress k 0,k10
:= distance along length in cm
stress k 1, σx_total x1k10,
:= force per length along sternum at chosen x value
stress k 2, σx_trumble x1k10,
:=
stress k 3, q_avek10
:=
stress
0 1 2 3
01
2
3
4
5
6
7
8
9
10
11
12
13
14
15
0 2.275 0.114 18.4620.1 2.638 0.122 18.462
0.2 3.066 0.13 18.462
0.3 3.57 0.138 18.462
0.4 4.161 0.148 18.462
0.5 4.851 0.158 18.462
0.6 5.648 0.169 18.462
0.7 6.559 0.181 18.462
0.8 7.584 0.194 18.462
0.9 8.717 0.209 18.462
1 9.943 0.225 18.462
1.1 11.238 0.243 18.462
1.2 12.571 0.262 18.462
1.3 13.906 0.284 18.462
1.4 15.208 0.308 18.462
1.5 16.448 0.334 18.462
=stress 0 4, x1:=
x position in cm

Pai-MS Thesis
69
i 0 7..:= σx0 x y,( ) σx x y, 0,( ):=
σx0
σx_total x y,( )
i
σx x y, i,( )∑
:=
σx_total
σx4 x y,( ) σx x y, 4,( ):=
σx4
j 0 3..:=
σx_trumble x y,( )
j
2σx x y, 2 j+,( )∑:=
σx trumble
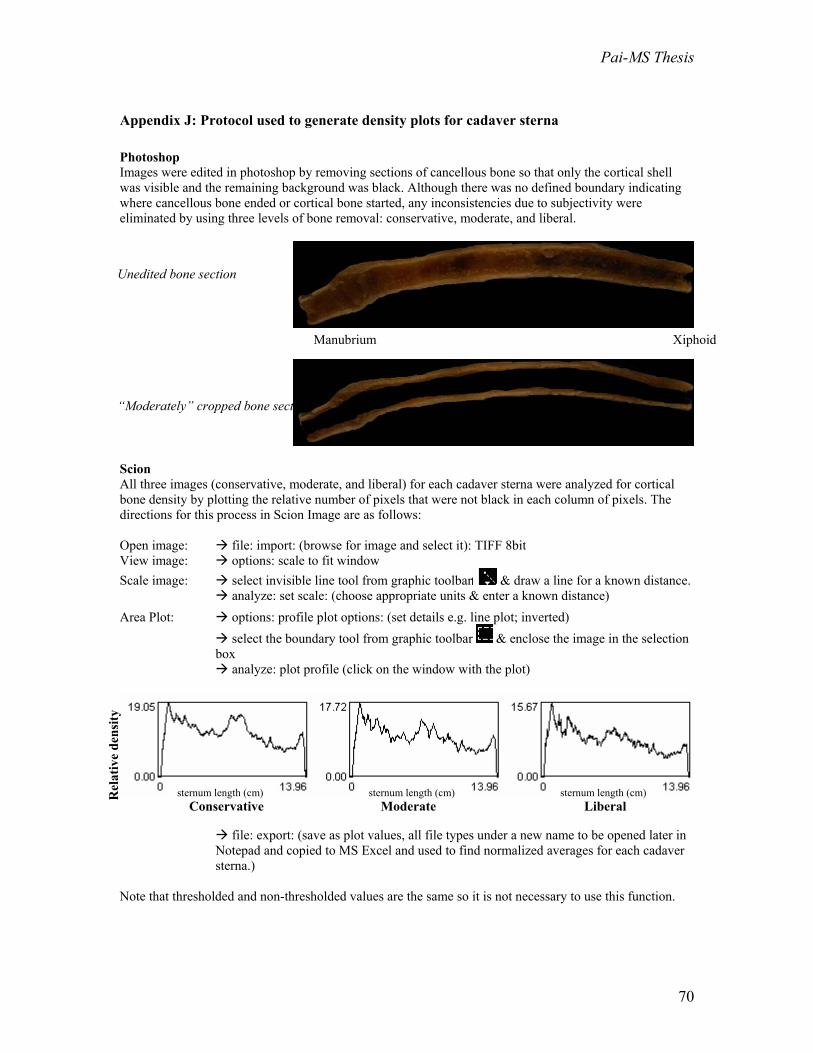
Pai-MS Thesis
70
Appendix J: Protocol used to generate density plots for cadaver sterna
Photoshop Images were edited in photoshop by removing sections of cancellous bone so that only the cortical shell was visible and the remaining background was black. Although there was no defined boundary indicating where cancellous bone ended or cortical bone started, any inconsistencies due to subjectivity were eliminated by using three levels of bone removal: conservative, moderate, and liberal.
Scion All three images (conservative, moderate, and liberal) for each cadaver sterna were analyzed for cortical bone density by plotting the relative number of pixels that were not black in each column of pixels. The directions for this process in Scion Image are as follows: Open image: file: import: (browse for image and select it): TIFF 8bit View image: options: scale to fit window Scale image: select invisible line tool from graphic toolbar & draw a line for a known distance.
analyze: set scale: (choose appropriate units & enter a known distance)
Area Plot: options: profile plot options: (set details e.g. line plot; inverted) select the boundary tool from graphic toolbar & enclose the image in the selection
box analyze: plot profile (click on the window with the plot)
file: export: (save as plot values, all file types under a new name to be opened later in
Notepad and copied to MS Excel and used to find normalized averages for each cadaver sterna.)
Note that thresholded and non-thresholded values are the same so it is not necessary to use this function.
Unedited bone section
“Moderately” cropped bone section
sternum length (cm) sternum length (cm) sternum length (cm) Rel
ativ
e de
nsity
Conservative Moderate Liberal
Manubrium Xiphoid

Pai-MS Thesis
71
Appendix K: Plate component drawings in Pro-E

Pai-MS Thesis
72

Pai-MS Thesis
73

Pai-MS Thesis
74


![Impact Loading and Locomotor-Respiratory Coordination ...s PDF/Daley human ventilation.pdf · entrainment to locomotor forces [2,21,22]. Furthermore, evidence suggests coupling improves](https://static.fdocuments.in/doc/165x107/5f442037fcace86ced45235c/impact-loading-and-locomotor-respiratory-coordination-s-pdfdaley-human-ventilationpdf.jpg)

![Respiratory Research BioMed Central...pimozide (a CNG channel blocker) is ineffective in fetal lamb lung [17]. Recently, such in vivo observations have been corroborated in a cellular](https://static.fdocuments.in/doc/165x107/6135c8ef0ad5d2067647990b/respiratory-research-biomed-central-pimozide-a-cng-channel-blocker-is-ineffective.jpg)