In vitro exposure of Ulva lactuca Linnaeus (Chlorophyta...
10
In vitro exposure of Ulva lactuca Linnaeus (Chlorophyta) to gasoline e Biochemical and morphological alterations Fernanda Kokowicz Pilatti a, * , Fernanda Ramlov b , Eder Carlos Schmidt c , Marianne Kreusch c ,D ebora Tomazi Pereira c , Christopher Costa d , Eva Regina de Oliveira a , Cl audia M. Bauer a , Miguel Rocha d , Zenilda Laurita Bouzon c , Marcelo Maraschin a a Plant Morphogenesis and Biochemistry Laboratory, Federal University of Santa Catarina, 88049-900 Florian opolis, Brazil b Phycology Laboratory, Department of Botany, Federal University of Santa Catarina, 88040-900 Florian opolis, Brazil c Department of Cell Biology, Embryology and Genetics, Federal University of Santa Catarina, 88049-900 Florian opolis, Brazil d Centre Biological Engineering, School of Engineering, University of Minho, Braga, Portugal highlights Effect of gasoline on the ultrastructure and metabolism of Ulva lactuca was studied. Changes in thalli mucilage and cell cytoplasm were noted after exposure to gasoline. Carotenoid and polyphenol contents decreased in gasoline-exposed thalli. Increase in soluble sugars and starch were positively correlated to time of exposure. article info Article history: Received 11 January 2016 Received in revised form 8 April 2016 Accepted 30 April 2016 Handling Editor: Caroline Gaus Keywords: Ulva lactuca Gasoline Cytochemistry Scanning electron microscopy Carbohydrates abstract Refined fuels have considerable share of pollution of marine ecosystems. Gasoline is one of the most consumed fuel worldwide, but its effects on marine benthic primary producers are poorly investigated. In this study, Ulva lactuca was chosen as a biological model due to its cosmopolitan nature and tolerance to high levels and wide range of xenobiotics and our goal was to evaluate the effects of gasoline on ultrastructure and metabolism of that seaweed. The experimental design consisted of in vitro exposure of U. lactuca to four concentrations of gasoline (0.001%, 0.01%, 0.1%, and 1.0%, v/v) over 30 min, 1 h, 12 h, and 24 h, followed by cytochemical, SEM, and biochemical analysis. Increase in the number of cytoplasmic granules, loss of cell turgor, cytoplasmic shrinkage, and alterations in the mucilage were some of the ultrastructural alterations observed in thalli exposed to gasoline. Decrease in carotenoid and polyphenol contents, as well as increase of soluble sugars and starch contents were associated with the time of exposure to the xenobiotic. In combination, the results revealed important morphological and biochemical alterations in the phenotype of U. lactuca upon acute exposure to gasoline. This seaweed contain certain metabolites assigned as candidates to biomarkers of the environmental stress investi- gated and it is thought to be a promise species for usage in coastal ecosystems perturbation monitoring system. In addition, the findings suggest that U. lactuca is able to metabolize gasoline hydrocarbons and use them as energy source, acting as bioremediator of marine waters contaminated by petroleum derivatives. © 2016 Elsevier Ltd. All rights reserved. 1. Introduction Marine oil pollution has been receiving attention since the middle of the 19th century with the intensification of tanker op- erations and oil use, marine tanker collisions, pollutant release from coastal refineries, and continuous operative discharges from * Corresponding author. E-mail address: [email protected] (F.K. Pilatti). Contents lists available at ScienceDirect Chemosphere journal homepage: www.elsevier.com/locate/chemosphere http://dx.doi.org/10.1016/j.chemosphere.2016.04.126 0045-6535/© 2016 Elsevier Ltd. All rights reserved. Chemosphere 156 (2016) 428e437
Transcript of In vitro exposure of Ulva lactuca Linnaeus (Chlorophyta...

lable at ScienceDirect
Chemosphere 156 (2016) 428e437
Contents lists avai
Chemosphere
journal homepage: www.elsevier .com/locate/chemosphere
In vitro exposure of Ulva lactuca Linnaeus (Chlorophyta) to gasoline e
Biochemical and morphological alterations
Fernanda Kokowicz Pilatti a, *, Fernanda Ramlov b, Eder Carlos Schmidt c,Marianne Kreusch c, D�ebora Tomazi Pereira c, Christopher Costa d,Eva Regina de Oliveira a, Cl�audia M. Bauer a, Miguel Rocha d, Zenilda Laurita Bouzon c,Marcelo Maraschin a
a Plant Morphogenesis and Biochemistry Laboratory, Federal University of Santa Catarina, 88049-900 Florian�opolis, Brazilb Phycology Laboratory, Department of Botany, Federal University of Santa Catarina, 88040-900 Florian�opolis, Brazilc Department of Cell Biology, Embryology and Genetics, Federal University of Santa Catarina, 88049-900 Florian�opolis, Brazild Centre Biological Engineering, School of Engineering, University of Minho, Braga, Portugal
h i g h l i g h t s
� Effect of gasoline on the ultrastructure and metabolism of Ulva lactuca was studied.� Changes in thalli mucilage and cell cytoplasm were noted after exposure to gasoline.� Carotenoid and polyphenol contents decreased in gasoline-exposed thalli.� Increase in soluble sugars and starch were positively correlated to time of exposure.
a r t i c l e i n f o
Article history:Received 11 January 2016Received in revised form8 April 2016Accepted 30 April 2016
Handling Editor: Caroline Gaus
Keywords:Ulva lactucaGasolineCytochemistryScanning electron microscopyCarbohydrates
* Corresponding author.E-mail address: [email protected] (F.K. Pila
http://dx.doi.org/10.1016/j.chemosphere.2016.04.1260045-6535/© 2016 Elsevier Ltd. All rights reserved.
a b s t r a c t
Refined fuels have considerable share of pollution of marine ecosystems. Gasoline is one of the mostconsumed fuel worldwide, but its effects on marine benthic primary producers are poorly investigated.In this study, Ulva lactuca was chosen as a biological model due to its cosmopolitan nature and toleranceto high levels and wide range of xenobiotics and our goal was to evaluate the effects of gasoline onultrastructure and metabolism of that seaweed. The experimental design consisted of in vitro exposure ofU. lactuca to four concentrations of gasoline (0.001%, 0.01%, 0.1%, and 1.0%, v/v) over 30 min, 1 h, 12 h, and24 h, followed by cytochemical, SEM, and biochemical analysis. Increase in the number of cytoplasmicgranules, loss of cell turgor, cytoplasmic shrinkage, and alterations in the mucilage were some of theultrastructural alterations observed in thalli exposed to gasoline. Decrease in carotenoid and polyphenolcontents, as well as increase of soluble sugars and starch contents were associated with the time ofexposure to the xenobiotic. In combination, the results revealed important morphological andbiochemical alterations in the phenotype of U. lactuca upon acute exposure to gasoline. This seaweedcontain certain metabolites assigned as candidates to biomarkers of the environmental stress investi-gated and it is thought to be a promise species for usage in coastal ecosystems perturbation monitoringsystem. In addition, the findings suggest that U. lactuca is able to metabolize gasoline hydrocarbons anduse them as energy source, acting as bioremediator of marine waters contaminated by petroleumderivatives.
© 2016 Elsevier Ltd. All rights reserved.
tti).
1. Introduction
Marine oil pollution has been receiving attention since themiddle of the 19th century with the intensification of tanker op-erations and oil use, marine tanker collisions, pollutant releasefrom coastal refineries, and continuous operative discharges from

Table 1Hydrocarbon and ethanol contents (%, v/v) in Petrobras® common gasoline.
Compounds Concentration (%, v/v)
Ethanol (C2H6O) 35.1Paraffinic hydrocarbons (CnH2nþ2) 9.7Isoparaffinic hydrocarbons 18.6Aromatic hydrocarbons (CnH2n-6) 15.6Naphtenic hydrocarbons 10.9Olefinic hydrocarbons (CnH2n) 6.4Unidentified hydrocarbons 3.7
F.K. Pilatti et al. / Chemosphere 156 (2016) 428e437 429
ships (Torres et al., 2008). The ecological effects of these spills havebeen subject of considerable laboratory and field research, butdetermination of toxic concentrations of crude and dispersed oilsfor seaweeds have received relatively minor efforts and apparentlyless interest when compared to determining toxicities for faunalspecies, presumably due to the assumption that animals are moresensitive than plants. However, some studies and reviews havebeen showing that the sensitivity of organisms is species-specificand depends on the chemical substances used, as algae havefound to be more sensitive than animal species in many cases(Eklund and Kautsky, 2003; Lewis and Pryor, 2013).
In marine hard bottom coastal regions, seaweeds form the baseof the ecosystem, both as primary producers and as commonstructural components of the biotope, providing substrate for roe,shelter, and nursery areas for juvenile fishes (Eklund and Kautsky,2003). Despite of its ecological and economical importance, theknowledge of the toxic effects of xenobiotics on this group of or-ganisms is remarkably low. In their review, Eklund and Kautsky(2003) found that out of 120 compounds tested for toxicity inseaweeds, only 14% consisted on oil. Similarly, Lewis and Pryor(2013) counted less than 10% of entries for toxicity of oils and dis-persants for 135 species of aquatic plants, of which 32 wereseaweed species. According to these authors, there are no oil-specific standardized phytotoxicity tests, which results in diverseexperimental conditions and parameters analyzed, making difficultto compare the results. Nevertheless, common findings in thereviewed papers (Coffey et al., 1977; Batterton et al., 1978;Vandermeulen et al., 1979; Gaur and Singh, 1989; Ansari et al.,1997; Tukaj et al., 1998) indicate that refined oils exhibitincreased toxicity on algae than crude oil, especially on their earlydevelopmental stages, and toxicity is directly related to growthinhibition and photosynthetic rate decrease.
Although the environmental perturbations of large oil spills tomarine waters has received the most attention by the public, reg-ulatory and scientific communities, damages may occur from lowlevel continuous discharges to fresh- and salt-water environments(Lewis and Pryor, 2013). In fact, annually, 48% of the oil pollution inthe oceans is due to fuels and 29% to crude oil. Tanker accidentscontribute only by 5% of all pollution entering into the sea (Torreset al., 2008). In Brazil, the distribution infrastructure for petro-leum, petroleum derivatives, and ethyl alcohol includes inlandterminals, waterway terminals, collector centers for ethanol, re-fineries, and several pipelines. In the inlands, fuel distribution ter-minals and countless tank trucks are filled daily with gasoline anddiesel fuel for nation-wide distribution. Leaks and accidental spillsare a regular occurrence during the exploration, production,refining, transport, and storage of petroleum and petroleumproducts (Vieira, 2007).
In this sense, the lack of knowledge resulting from the scarceinformation on the effects of fuel oils on seaweed species motivatedthis investigation. Ulva lactuca Linnaeus (Chlorophyta) was chosenas study model for its cosmopolitan occurrence, its tolerance to awide variety of environmental stress factors, and its ability to sur-vive in highly contaminated places, being a candidate to be a spe-cies useful for biomonitoring purposes (Rainbow, 1995). Gasolinewas the fuel oil chosen for this study for its worldwide importance,being a complex blend of hydrocarbon compounds, including thoseknown as BTEX (benzene, toluene, ethylbenzene, and xylene) andnaphthalene, which make up from 10% to 59% of the fuel, andaliphatic hydrocarbons that make up from 41 to 62% (Tiburtiuset al., 2004; Rodrigues et al., 2010). Thus, this study aimed toinvestigate the biochemical responses and morphological changesof U. lactuca exposed in vitro to gasoline. Our working hypothesisassumes that U. lactuca responds with specific biochemical andmorphological changes in its phenotype even upon short exposure
times to the xenobiotic in study.
2. Material and methods
2.1. Algal material
Thalli of Ulva lactuca were collected in April 2013 at Armaç~aoBeach (27�7409600 S, 48�5000100 W), Florian�opolis, SC, southernBrazil, packed in plastic flasks containing seawater and immedi-ately transferred to the Plant Cell Biology Laboratory (LaBCeV-UFSC). Seaweed samples were rinsed with sterile seawater andmanually cleaned up for epibionts removal. Culture conditionsduring acclimation and experimental periods consisted in sterileseawater enrichedwith 4mL L�1 (v/v) of von Stoschmedium (VSES,Edwards, 1970), water continuous aeration, 24 ± 2 �C, illuminationfrom above with fluorescent lights (Philips C-5 Super 84 16W/840),PAR at 80 mmol photons m�2 s�1 (Li-cor light meter 250, USA), and12 h photocycle (starting at 8: 00 a.m.). For acclimation, algalbiomass was cultivated in PET flasks (25 g biomass L�1 of seawater)during 10 days.
2.2. Experimental design
A certified quality control common gasoline sample was pur-chased from Petrobras® at a commercial gas station in Florian�opolis(Santa Catarina state, southern Brazil) and its chemical profile wasdetermined by gas chromatography (GC, 2010-2, Shimadzu), usinga flame ionization detector. The gasoline sample presented a typicalhydrocarbon composition (Tables 1 and 2), with paraffinic hydro-carbons that include the alkane series, the naphthene hydrocar-bons comprising the cycloalkanes and the aromatic ones coveringall compounds that contain one or more ring structures similar tobenzene, aside from ethanol (35.1%, v/v) whose addition to gasolineis regulated by Brazilian National Agency of Petroleum.
The experimental designwas as previously described by Ramlovet al. (2013) and consisted in the combination of four concentra-tions of gasoline (0.001%, 0.01%, 0.1%, and 1.0% e v/v, nominalconcentrations) and four times of exposure to the pollutant(30min,1 h,12 h, and 24 h), resulting in a contingency tablewith 16groups. Each group consisted in 5 replicates, i.e., 2 g of U. lactucathalli cultivated in Erlenmeyer flasks containing the previouslydescribed nominal concentrations of gasoline and enrichedseawater (described in section 2.1) at final volume of 400mL. Flasksapertures were closed with plastic film, but not sealed, and wateraeration system was not closed, aiming at to mimic the real con-ditions found in case of environmental pollution cause by gasolinein aquatic ecosystems. Therefore, gasoline compounds volatiliza-tion was not impeded and dissolved hydrocarbons were notmeasured over the experimental period. At the end of the experi-ment, algal biomasses were removed from the flasks and thallisurfaces were gently patted dry with paper towel. From each group,two portions of thalli (1 cm � 1 cm) were collected for microscopyprocedures and the remaining biomass was aliquoted (1 g, FW) in

Table 2Types of hydrocarbon categories (%) in Petrobras® common gasoline according to the number of carbon atoms in the molecule.
Number of carbons Hydrocarbon categories
Paraffinic (%) Isoparaffinic (%) Aromatic (%) Naphtenic (%) Olefinic (%)
C4 0.14 0.04 e e 0.05C5 1.73 3.16 e 0.26 3.00C6 2.26 3.94 0.56 3.63 1.52C7 2.39 3.69 3.04 3.77 1.35C8 1.52 4.84 3.52 2.15 0.34C9 0.78 1.84 3.06 0.97 0.10C10 0.32 1.08 4.80 0.12 e
C11 0.16 e 0.46 e e
C12 0.21 e 0.16 e e
C13 0.18 e e e e
Total 9.70 18.60 15.60 10.90 6.40
F.K. Pilatti et al. / Chemosphere 156 (2016) 428e437430
packs, immediately frozen in liquid nitrogen (LN), and kept at�80 �C for further analysis. For the control group, 10 g fresh thalliwere separated in aliquots directly from the acclimation flasks,surface dried with paper towels, and frozen (�80 �C).
2.3. Light microscopy and cytochemistry
Samples were processed and stained according to Schmidt et al.(2009). For that, thallus samples were fixed using a 2.5% para-formaldehyde (w/v) solution in 0.1 M phosphate buffer (pH 7.2), ina vacuum chamber, overnight, at 4 �C. Subsequently, samples werewashed in phosphate buffer, dehydrated in increasing series ofethanol aqueous solutions, pre-infiltrated with ethanol/Historesin(Leica Historesin, Heidelberg, Germany) solution (1: 1, v/v) for 4 h,and then infiltrated with 100% Historesin for 24 h. Samples wereincluded in Historesin by adding the polymerizer at room tem-perature, for 2e3 h. Thallus sections (5 mm thickness) were stainedwith Toluidine Blue (TB-O) 0.5% (w/v) (Merck Darmstadt, Ger-many), pH 3.0, for acidic polysaccharides detection and CoomassieBrilliant Blue (CBB) 0.4% (w/v) in Clarke’s solution (Serva, Heidel-berg, Germany) for proteins. Slides were cemented with Canadabalsam and investigated with an Epifluorescent microscope(Olympus BX 41) equipped with the Image Q Capture Pro 5.1Software (Qimaging Corporation, Austin, TX, USA).
2.4. Scanning electronic microscopy (SEM)
Samples underwent fixation and dehydration steps as describedin section 2.3. Subsequently, they were dried with hexamethyldi-silazane, transferred to aluminum stubs, coated with gold, andanalyzed under SEM JSM 6390 LV (JEOL Ltd., Tokyo, Japan) at 10 kV.
2.5. Biochemical analyses
2.5.1. Desalination and grindingPrior to analysis, the whole biomass was desalinated with 0.5 M
ammonium formate for 30 s, profusely rinsed with distilled water,and gently dried with paper towels. For extractions, algal biomasswas ground using mortar, pestle, and liquid nitrogen.
2.5.2. Chlorophylls a and bChlorophylls were extracted according to Hiscox and Israelstam
(1979), with modifications. Fresh thalli (100 mg) were added to10 mL dimethyl sulfoxide (DMSO) and incubated for 30 min, at40 �C. Absorbances of extracts were measured at 645 nm and663 nm (n ¼ 3) in a UVevisible spectrophotometer (SpectrumlabD180) and concentration of chlorophylls was calculated accordingto Arnon (1949).
2.5.3. CarotenoidsCarotenoids were extracted from fresh thalli (1 g) using 10mL of
hexane: acetone (1: 1, v/v) solution containing tert-butyl-hydrox-ytoluene (BHT) 0.001% (w/v), for 1 h (Ramlov et al., 2013). Extractswere filtered and solvent was evaporated under N2 flux. To improveidentification of the analytes by HPLC, saponification of carotenoidswas performed prior to chromatographic analysis. The dry residuewas solubilized in 3 mL hexane prior to chromatographic analysisand 10% KOH in methanol was added (100 mL mL�1) to the orga-nosolvent extract, followed by incubation for 3 h, in the dark, atroom temperature. The solution was washed (3x) with distilled-deionized water, the non-esterified extract collected, concen-trated under N2 flux, and re-solubilized in hexane (100 mL) forchromatographic analysis as previously described (Ramlov et al.,2013). Samples (10 mL, n ¼ 3) were injected into liquid chromato-graph (Shimadzu LC-10A) equipped with a C18 reverse-phase col-umn (Vydac 218TP54; 250 mm � 4.6 mm :, 5 mm particle, 30�C),protected by a 5 mm C18 reverse-phase guard column (Vydac218GK54), and a UVevisible detector (450 nm). Elution was per-formed with MeOH: CH3CN (90: 10, v/v) at a flow rate of1 mL min�1. Carotenoid identification (a-carotene, b-carotene,lutein, zeaxanthin, and b-cryptoxanthin) was performed usingretention times and co-chromatography of standard compounds(Sigma-Aldrich, USA), as well as by analogy with other reports ofcarotenoid analysis under similar conditions (Scott and Eldridge,2005; Hulshof et al., 2007). Carotenoid contents were calculatedbased on external standard curves, e.g., lutein standard curve(0.5e45 mgmL�1; y¼ 7044x; r2 ¼ 0.999) for lutein, zeaxanthin, andb-cryptoxanthin and b-carotene standard curve (0.01e12 mg L�1;y ¼ 1019x; r2 ¼ 0.998) for a- and b-carotene quantification.
2.5.4. PolyphenolsPolyphenols were extracted from 1 g powdered fresh thalli by
incubating samples for 1 h in 10 mL methanol (80%, v/v). Theextract was recovered by filtration on cellulose paper underreduced pressure and polyphenols were determined according toSchiavon et al. (2012), with modifications. 100 mL of methanolicextracts were added to 75 mL Folin-Ciocalteu reagent, 825 mL 2%sodium carbonate (w/v), and incubated for 1 h, in the dark.Absorbance was measured at 750 nm (n¼ 3) in a microplate reader(ThermoPlate TP-Reader) and concentration of polyphenols wascalculated using an external gallic acid standard curve(50e500 mg mL�1; y ¼ 0.0044x; r2 ¼ 0.999).
2.5.5. Soluble sugars and starchSoluble sugars were extracted from fresh thalli (50 mg) with
methanol: chloroform: water solution (12: 5: 3, v/v/v) and starchwas extracted with perchloric acid 30% (v/v) from the pelletresultant of the soluble sugars extraction, as described by Trevelyan

F.K. Pilatti et al. / Chemosphere 156 (2016) 428e437 431
and Harrison (1952). Determination of soluble sugars and starchconcentrations in extracts was performed through the colorimetricanthrone reaction (0.2% anthrone in sulfuric acid, w/v) and absor-bance was recorded at 630 nm (n ¼ 6) in a UVevisible spectro-photometer (Spectrumlab D180). Concentrations of the analyteswere calculated using external standard curves for glucose(10e200 mg mL�1; y ¼ 0.0088x; r2 ¼ 0.998) and starch(0.5e5 mg mL�1; y ¼ 0.34x; r2 ¼ 0.998).
2.6. Statistical analysis
One-way and multifactorial analysis of variance (ANOVA) fol-lowed by the post hoc Tukey test and Pearson’s correlation testwereperformed on the biochemical data, considering the confidencelevel of 95% (p � 0.05). Further, data was normalized and tested forprincipal component analysis (PCA) and hierarchical clusteringanalysis (HCA). All statistical analysis and graphics design werecarried out using scripts written in R language (v. 3.1.1) employingtools designed by the authors at the University of Minho (Portugal)and UFSC in Brazil (the scripts used are freely available as a CRANpackage named specmine), as well as the functions from the pack-ages “devtools” (Wickham and Chang, 2015), “agricolae”(Mendiburu, 2014), and “ggplot2” (Wickham, 2009). The data andthe HTML reports generated from the analysis (using R Markdownfeatures) are provided in supplementary material, making theanalysis fully reproducible.
3. Results and discussion
The hydrocarbons commonly present in petroleum and theirderivatives are paraffins (15%e60%), napthenes (30%e60%), andaromatics (3%e30%), with asphaltics making up the remainder.However, one could note that the percentages of hydrocarbon typesin petroleum derivatives (gasoline, diesel oil, kerosene, e.g.) canvary greatly, giving them a quite distinct compound profiledepending upon geographic origin of the petroleum and the re-finery processes used, for instance. In this sense, in view of theeventual chemical heterogeneity of gasoline marketed all over theworld, caution should be taken when analyzing comparatively thepollutant impact of this xenobiotic in aquatic systems. Moreover, inthis regard it is worth mentioning the peculiar trait of addingethanol up to 35% (v/v) to gasoline in Brazil, a practice regulated bygovernmental agencies.
3.1. Morphological alterations
In the pursuit for cellular injuries caused by acute exposure of U.lactuca thalli to gasoline, we started examining cell morphologyusing cytochemistry techniques and scanning electronic micro-scopy (SEM). Toluidine Blue (TB-O) staining showedmetachromaticreaction to the cell wall resulting in purple color in control andtreated cells (Fig. 1aem). This reaction indicates the presence ofacidic polysaccharides such as ulvan. Metachromatic reaction wasalso observed in granules dispersed throughout the cytoplasm. Thiscytochemical test made also possible to detect cytoplasmicretraction, specially where the two layers of cells join together(Fig. 1bem). When stained with Coomassie Brilliant Blue (CBB),protein structures of cytoplasm were noted, as well as a thin outerlayer on the cell wall (Fig. 2aem). In control samples (Fig. 2a), thecytoplasm was well distributed around the vacuole, while cellsexposed to gasoline (Fig. 2bem) exhibited their cytoplasm agglu-tinated. SEM analysis of the thalli’s surface in the control sample(Fig. 3a) exhibited well-marked contours of the cell wall and turgidcytoplasm. In their turn, the samples exposed to gasoline(Fig. 3bem) presented drastic changes in the mucilage deposited
on the cell surface. Besides, cell wall contours were lost and thesurface was found to be wrinkly in some samples (Fig. 3b, d, fek)and smooth in others (Fig. 3c, e, l, m).
As the first and main physical barrier against mechanical andchemical threats, seaweed mucilage is expected to readily exhibitevidences of disturbances in the surroundings. Even a short periodof exposure (1 h) to the smallest concentration of gasoline tested(0.001%) was able to produce dramatic changes in U. lactuca’s sur-face when compared to control sample. Gasoline might comprisehigh levels of BTEX, which are small apolar molecules that caneasily diffuse through cell wall and cell membrane, displacing fattyacid molecules and causing membrane disruption. One of theconsequences of membrane disruption is the leakage of cell-sapinto intercellular space, resulting in the loss of cell turgor (Baker,1970). Taking into account the amount of BTEX found in the stud-ied gasoline (15.6%, v/v), this finding is thought to be one of thecauses for the alteration observed in U. lactuca’s mucilage by SEMimages in samples exposed to gasoline, as cytoplasm retractionwasdetected in cytochemical analysis as well. Despite the fact thatbenzene is by far the most harmful compound in gasoline, it hasbeen claimed that due to low background concentrations of BTEX inwater, their rapid volatilization and degradation processes and lowto moderate toxicity, the overall risk to the aquatic environment isconsidered low.
On the other hand, one cannot rule out the possibility thatchanges observed by SEM in the mucilage after exposure to gaso-line result from the adsorption of hydrocarbons to the poly-saccharides of the cell wall, or to the augment of accumulation ofthose macromolecules as a physical barrier against the penetrationof gasoline into the cells. Both effects were observed in situ in manyseaweed species after oil spills (O’Brien and Dixon, 1976). As shownherein, the hypothesis of increased accumulation of cell wall’spolysaccharides as a protection mechanism is reinforced by theobservation of metachromatic granules in TB-O cytochemicalanalysis. The metachromatic reaction observed in the granules ispossibly due to the synthesis and exportation of polysaccharides tothe cell wall, as suggested by Schmidt et al. (2012). Although thealgae might be enhancing the mucilage production and accumu-lation in the cell wall as a physical protection, it is still plausible toassume that gasoline is able to penetrate cells and disrupt theirstructures. First evidences for this are found in CBB cytochemicalanalysis, which stains proteins present in organelles membranes. Incontrol samples, CBB staining marked protein structures in thecytoplasm and their shapes surrounding the vacuole are visible.Interestingly, cytoplasm of cells exposed to gasoline becameshapeless and cells agglutinated after increasing time of exposureand concentration of the pollutant. Importantly, one should keep inmind the high content of ethanol (~35% v/v) of the studied gasoline,which might also contribute to disrupt the cell/organelle mem-branes due to its well known destructive effect of the hydrophobiccore of proteins and of the hydrogen bonding pattern of thosemacromolecules, leading to their denaturation.
3.2. Biochemical analysis
The contents of total chlorophylls (chlorophyll a þ chlorophyllb), total carotenoids, polyphenols, soluble sugars, and starch areplotted in Fig. 4aee. Moreover, variables means, standard deviationand Tukey test results by group are displayed in Table 1 ofsupplementary material. Tables 3 and 4 contain the results of one-way ANOVA by factor (time of exposure and concentration) andmultifactorial ANOVA, respectively. Table 5 shows the results ofPearson’s correlation between biochemical variables and factors.Finally, carotenoid profiles obtained by RP-HPLC are presented inTable 2 of supplementary material with Tukey test results.
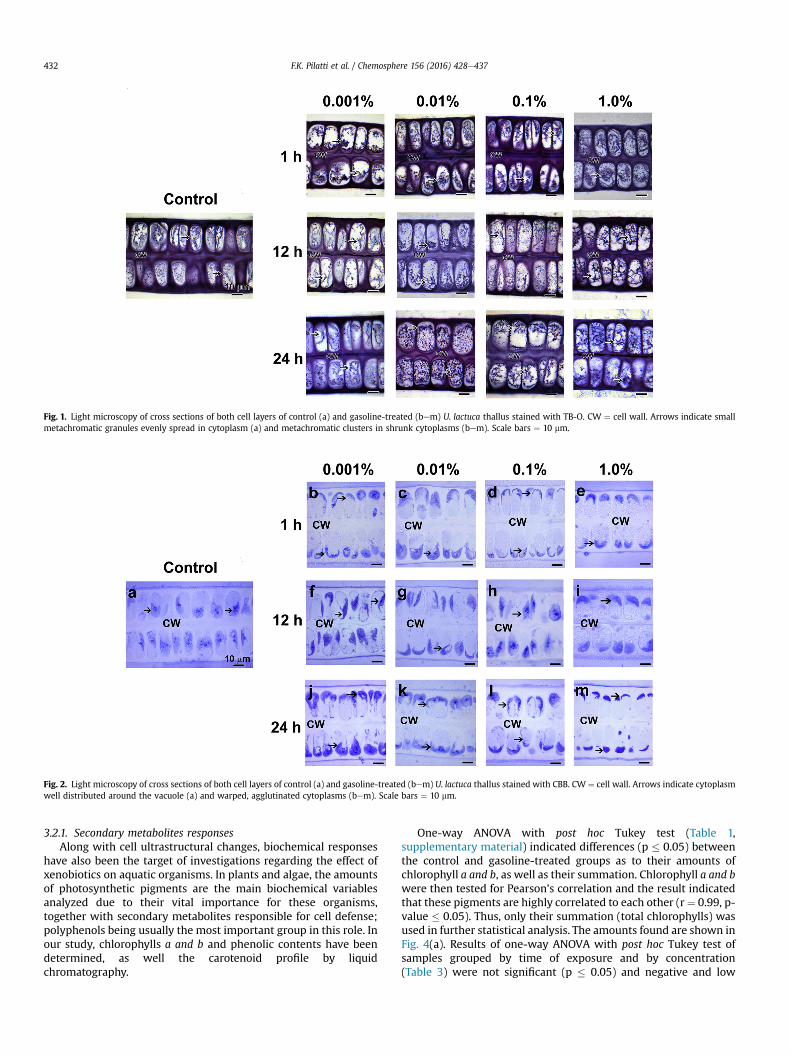
Fig. 1. Light microscopy of cross sections of both cell layers of control (a) and gasoline-treated (bem) U. lactuca thallus stained with TB-O. CW ¼ cell wall. Arrows indicate smallmetachromatic granules evenly spread in cytoplasm (a) and metachromatic clusters in shrunk cytoplasms (bem). Scale bars ¼ 10 mm.
Fig. 2. Light microscopy of cross sections of both cell layers of control (a) and gasoline-treated (bem) U. lactuca thallus stained with CBB. CW ¼ cell wall. Arrows indicate cytoplasmwell distributed around the vacuole (a) and warped, agglutinated cytoplasms (bem). Scale bars ¼ 10 mm.
F.K. Pilatti et al. / Chemosphere 156 (2016) 428e437432
3.2.1. Secondary metabolites responsesAlong with cell ultrastructural changes, biochemical responses
have also been the target of investigations regarding the effect ofxenobiotics on aquatic organisms. In plants and algae, the amountsof photosynthetic pigments are the main biochemical variablesanalyzed due to their vital importance for these organisms,together with secondary metabolites responsible for cell defense;polyphenols being usually the most important group in this role. Inour study, chlorophylls a and b and phenolic contents have beendetermined, as well the carotenoid profile by liquidchromatography.
One-way ANOVA with post hoc Tukey test (Table 1,supplementary material) indicated differences (p � 0.05) betweenthe control and gasoline-treated groups as to their amounts ofchlorophyll a and b, as well as their summation. Chlorophyll a and bwere then tested for Pearson’s correlation and the result indicatedthat these pigments are highly correlated to each other (r¼ 0.99, p-value � 0.05). Thus, only their summation (total chlorophylls) wasused in further statistical analysis. The amounts found are shown inFig. 4(a). Results of one-way ANOVA with post hoc Tukey test ofsamples grouped by time of exposure and by concentration(Table 3) were not significant (p � 0.05) and negative and low
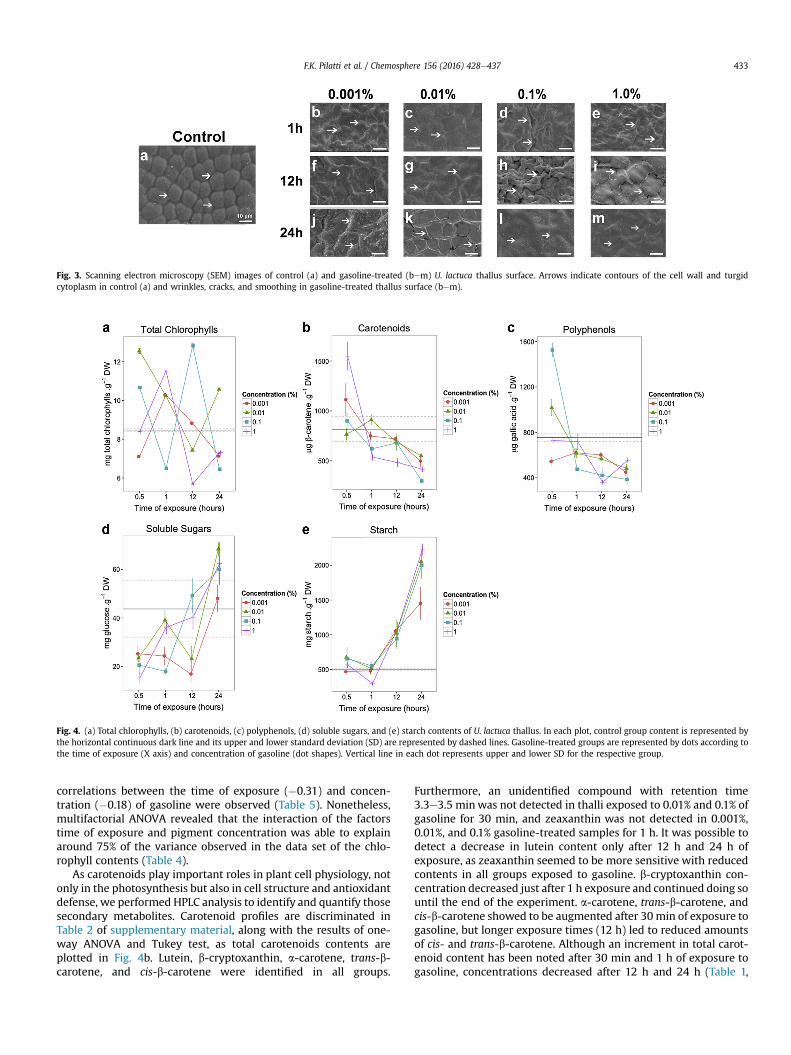
Fig. 3. Scanning electron microscopy (SEM) images of control (a) and gasoline-treated (bem) U. lactuca thallus surface. Arrows indicate contours of the cell wall and turgidcytoplasm in control (a) and wrinkles, cracks, and smoothing in gasoline-treated thallus surface (bem).
Fig. 4. (a) Total chlorophylls, (b) carotenoids, (c) polyphenols, (d) soluble sugars, and (e) starch contents of U. lactuca thallus. In each plot, control group content is represented bythe horizontal continuous dark line and its upper and lower standard deviation (SD) are represented by dashed lines. Gasoline-treated groups are represented by dots according tothe time of exposure (X axis) and concentration of gasoline (dot shapes). Vertical line in each dot represents upper and lower SD for the respective group.
F.K. Pilatti et al. / Chemosphere 156 (2016) 428e437 433
correlations between the time of exposure (�0.31) and concen-tration (�0.18) of gasoline were observed (Table 5). Nonetheless,multifactorial ANOVA revealed that the interaction of the factorstime of exposure and pigment concentration was able to explainaround 75% of the variance observed in the data set of the chlo-rophyll contents (Table 4).
As carotenoids play important roles in plant cell physiology, notonly in the photosynthesis but also in cell structure and antioxidantdefense, we performed HPLC analysis to identify and quantify thosesecondary metabolites. Carotenoid profiles are discriminated inTable 2 of supplementary material, along with the results of one-way ANOVA and Tukey test, as total carotenoids contents areplotted in Fig. 4b. Lutein, b-cryptoxanthin, a-carotene, trans-b-carotene, and cis-b-carotene were identified in all groups.
Furthermore, an unidentified compound with retention time3.3e3.5 minwas not detected in thalli exposed to 0.01% and 0.1% ofgasoline for 30 min, and zeaxanthin was not detected in 0.001%,0.01%, and 0.1% gasoline-treated samples for 1 h. It was possible todetect a decrease in lutein content only after 12 h and 24 h ofexposure, as zeaxanthin seemed to be more sensitive with reducedcontents in all groups exposed to gasoline. b-cryptoxanthin con-centration decreased just after 1 h exposure and continued doing sountil the end of the experiment. a-carotene, trans-b-carotene, andcis-b-carotene showed to be augmented after 30min of exposure togasoline, but longer exposure times (12 h) led to reduced amountsof cis- and trans-b-carotene. Although an increment in total carot-enoid content has been noted after 30 min and 1 h of exposure togasoline, concentrations decreased after 12 h and 24 h (Table 1,

Table 3One-way ANOVA and Tukey test performed on total chlorophylls, total carotenoids, polyphenols, soluble sugars, and starch contents in U. lactuca grouped by time of exposure(30min,1 h,12 h, 24 h) and by concentration of gasoline (0.001%e1.0%, v/v). C¼ control (non exposed group). Confidence level of 95% was considered. p-values presented referto ANOVA. Groups with significant differences in Tukey test (p � 0.05) are shown in the last column.
p-values Groups with significant difference (Tukey test)
By time of exposure Total chlorophylls 2.142E-01 e
Carotenoids 4.281E-04 24 h e C; 1 h e 30min; 12 h e 30min; 24 h e 30min; 24 h e 1 hPolyphenols 3.511E-06 1 h e 30min; 12 h e 30min; 24 h e 30minSoluble sugars 3.446E-11 30min e C; 12 h e 30min; 24 h e 30min; 24 h e 1 h; 24 h e 12 hStarch 1.621E-22 12 h e C; 24 h e C; 12 h e 30min; 24 h e 30min; 12 h e 1 h; 24 h e 1 h; 24 h e 12 h
By concentration Total chlorophylls 0.168 e
Carotenoids 0.866 e
Polyphenols 0.611 e
Soluble sugars 0.477 e
Starch 0.601 e
Table 4Multifactorial ANOVA performed on total chlorophylls, total carotenoids, polyphenols, soluble sugars, and starch contents in U. lactuca, considering the effect of time ofexposure and concentration of gasoline separately and combined. Confidence level of 95% was considered (p � 0.05).
Time of exposure Concentration Time of exposure: concentration Residuals
Variance explainedTotal chlorophylls 0.116 0.125 0.758 0.000Carotenoids 0.606 0.034 0.316 0.044Polyphenols 0.488 0.047 0.451 0.015Soluble sugars 0.714 0.041 0.185 0.060Starch 0.906 0.019 0.049 0.027p-valuesTotal chlorophylls 1.228E-41 8.850E-43 2.754E-53Carotenoids 2.383E-19 1.887E-04 5.773E-13Polyphenols 1.256E-24 3.278E-10 5.670E-22Soluble sugars 9.464E-17 9.390E-04 2.697E-07Starch 5.360E-25 4.844E-04 2.061E-05
Table 5Pearson’s correlation performed on total chlorophylls, total carotenoids, poly-phenols, soluble sugars, and starch contents in U. lactuca not exposed (control) andexposed to gasoline (0.001e1%, v/v) for 30 min, 1 h, 12 h, and 24 h. Confidence levelof 95% was considered. (*) indicates p-value � 0.05; (***) indicates p-value � 0.01.
Time of exposure Concentration
Total chlorophylls �0.31 �0.18Carotenoids �0.65 *** �0.03Polyphenols �0.51 * �0.08Soluble sugars 0.75 *** 0.09Starch 0.95 *** 0.08
F.K. Pilatti et al. / Chemosphere 156 (2016) 428e437434
supplementary material). One-way ANOVA of total carotenoidcontents of samples grouped by time of exposure (Table 3) indi-cated significant differences (p � 0.05, Tukey test) for the 30 min-exposure treatment with respect to other exposure times, as wellas between the 24 h-exposed samples, control group, and thatexposed for 30 min. Multifactorial ANOVA indicated that the timeof exposure alone explained about 60% of the variance associatedwith the total concentration of carotenoids and its combinationwith the variable concentration of gasoline was able to increasethat value by 31% (Table 4). In addition, a negative linear correlationcoefficient (r ¼ �0.65) between total carotenoids and time ofexposure to gasoline was observed (Table 5, p � 0.05).
One-way ANOVA of polyphenol contents showed significantincreases compared to control for 30 min-samples exposure to0.01% and 0.1% of gasoline (p � 0.05, Tukey test), followed by asignificant decrease after 12 h and 24 h of exposure in all concen-trations assayed (Fig. 4c). Samples grouped by time of exposure(Table 3) differed (p � 0.05, Tukey test) in their polyphenol con-centrations in U. lactuca exposed to gasoline for 30 min
comparatively to those with longer exposure times (1 h, 12 h, and24 h). According to the multifactorial ANOVA (Table 4), the factortime of exposure alone (48%) and its interaction with the concen-tration of gasoline (45%) showed to be important to explain thevariance of polyphenol contents observed. Corroborating withthese results, a negative linear correlation coefficient (r¼�0.51) forthe polyphenol contents and time of exposure was found (Table 5,p � 0.05).
The displacement of fatty acids followed by the disruption of celland organelle membranes increases the distance between enzymesand photosystem components, i.e. chlorophylls and carotenoids,interrupting importantmetabolic functions, such as photosynthesisand respiration, as these processes depend on the enzyme activityand integrity of cytoplasmic and sub-cellular membranes (O’Brienand Dixon, 1976). Additionally, one could speculate that the dam-age caused by the Brazilian gasoline herein investigated to the celland organelle membranes, mostly to the protein fraction thereof,might be also increased due to its relevant content of ethanol.Decrease in chlorophylls content has been associated to deleteriouseffects of many xenobiotics in water as reported for U. lactucaexposed to cadmium and copper, for H. musciformis exposed todiesel, and Hydrilla verticillata exposed to toluene, xylene, andethylbenzene (Han et al., 2008; Kumar et al., 2010; Yan and Zhou,2011; Ramlov et al., 2013). Nevertheless, our measurements ofphotosynthetic pigments of U. lactuca exposed to gasoline revealedfluctuations in chlorophyll a and b contents along the time ofexposure and concentrations studied, without a pattern ofresponse.
Regarding the carotenoid profile, the metabolites investigatedfluctuated in their contents without a linear associationwith any ofthe factors investigated. However, total carotenoid contents starteddecreasing after 12 h and 24 h of exposure to gasoline, suggesting a

F.K. Pilatti et al. / Chemosphere 156 (2016) 428e437 435
biochemical damage to their biosynthesis and accumulation path-ways. For these observations, it seems that photosynthetic pig-ments in U. lactuca resist to acute gasoline injuries. Given theimportance of these pigments in plant metabolism, it is expectedthat they are able to cope with some level of injuries and carot-enoids might be involved in mechanisms of protection againstthese threats, once they stabilize and protect the lipid phase ofthylakoid membranes, which contributes to preserve the func-tionality of photosynthetic machinery (Frank and Cogdell, 1996;Havaux, 1998).
Carotenoids also play an important role in non-enzymatic de-fense against oxidative damage, together with phenolic com-pounds, which are synthesized in plants as a response to ecologicaland physiological pressures (Khoddami et al., 2013; Petrussa et al.,2013). Increase in carotenoid and polyphenol contents have beenassociated to oxidative stress due to pollutants such as metals andhydrocarbons. Increase in these metabolites were also attributed toprotection against oxidative stress in U. lactuca and H. verticillataexposed to selenium, cadmium, and toluene (Kumar et al., 2010;Yan and Zhou, 2011; Schiavon et al., 2012). However, the expo-sure to gasoline led to a decrease in carotenoid and polyphenolcontents in U. lactuca as shown herein. These results suggest that U.lactuca’s carotenoids and polyphenols are sensitive to gasolinetreatment even for a short time of exposure and could be used asbiomarkers to this type of pollution in biomonitoring programswith this species.
3.2.2. Carbohydrates metabolism e the main detoxificationpathway in U. lactuca?
In order to gain more insight on U. lactuca responses afterexposure to gasoline, we decided to investigate the cell carbohy-drate pool (i.e., soluble sugars and starch), since soluble sugars arecrosslinked to energetic, storing, and detoxifying pathways.
Content of soluble sugars in 30 min- and 1 h-treated samplessignificantly decreased compared to control group (p � 0.05, one-way ANOVA, post-hoc Tukey test), increasing afterward andachieving significantly higher values after 24 h (Fig. 4d). One-wayANOVA of samples grouped by time of exposure indicated differ-ences between samples exposed for 30min to gasoline in respect tocontrol and groups exposed for 12 h and 24 h. The latter was alsosignificantly different from groups exposed for 1 h and 12 h(Table 3). The factor time of exposure explained about 71% of thevariance obtained for soluble sugars (Table 4), while a relevantcorrelation coefficient between soluble sugars and time of expo-sure, i.e. 0.75, has been detected (Table 5).
Starch content (Fig. 4e) in U. lactuca exposed to gasoline for 12 hand 24 h significantly increased compared to control (Table 1,supplement material, p � 0.05, Tukey test). Results of one-wayANOVA applied to samples grouped by time of exposure to gaso-line showed that both times of exposure (12 h and 24 h) differedfrom control and 30 min- and 1 h-treated samples still differingfrom each other (p� 0.05 - Table 3). Multifactorial ANOVA revealedthat around 90% of the starch data set variance is explained by thetime of exposure (Table 4), and a high linear correlation coefficient(r ¼ 0.95) has been found between the starch content and time ofexposure to the xenobiotic (Table 5).
Desmodesmus armatus cultures exposed to diesel and gasolineexhibited decrease in chlorophylls and carotenoids contents, butcontinued growing for 9 days, which was assigned to the assimi-lation of the hydrocarbons in seaweedmetabolism as carbon source(Kureyshevich and Guseynova, 2008). It is possible that U. lactucahas shown similar ability to detoxify gasoline hydrocarbons and usethem as a carbon source. The ability to metabolize organic com-pounds has already been reported for the green algae Chlorellavulgaris, Scenedesmus platydiscus, Scenedesmus quadricauda, and
Selenastrum capricornutumin (Haritash and Kaushik, 2009). Theinitial steps in the metabolism of aromatic hydrocarbons in plantcells include hydroxylation and glycosylation, followed by thecleavage of the aromatic ring, with the formation of aliphaticproducts that go through further modifications ending up in thetricarboxylic acid cycle (Korte et al., 2000).
When exposed to gasoline, U. lactuca presented a decrease insoluble sugars content after 30 min and 1 h. After 12 h exposure,soluble sugar amount was similar to control groups and after 24 hexposure higher contents in respect to control groupwere detected.It is possible that during the first hours of exposure, a great amountof soluble sugars has been driven by the cell to the glycosylation ofgasoline hydrocarbons. As the penetration of thesemolecules in thecells implied disrupting the cell membranes and possibly blockedphotosynthesis, cellular levels of soluble sugars could not bemaintained in this pathway. Nevertheless, increased soluble sugarslevels after 12 h exposure to gasoline might be due to the pro-duction of such metabolites during the detoxification process. As aconsequence of progressive membrane damages and decoupling ofenzymatic chains, soluble sugars are unable to go through therespiration pathway and accumulate in the cytoplasm. Based on thestarch content measurements, the excess of soluble sugars prob-ably has been driven to starch synthesis, once this pathway workswith soluble enzymes and might be relatively unaffected by gaso-line treatment. Unfortunately, no similar investigation aiming toinvestigate the carbohydrates metabolism of algae exposed to hy-drocarbons was found in the literature so far to help furtherdiscussion.
3.3. Unsupervised multivariate analysis e a picture of biochemicalprofile
In an attempt to mend the pieces obtained by the biochemicalanalysis, we performed and compared two unsupervised multi-variate analysis methods over the studied biochemical variables.Hierarchical clustering analysis (Fig. 5a) was able to separate in onebranch of the dendrogram the thallus samples exposed to 0.01%,0.1%, and 1.0% of gasoline for 24 h. In the neighbor branch, thallussamples treated with 0.001% of gasoline for 24 h were set togetherwith all groups of thalli exposed to gasoline for 12 h. A third branchencompassed all groups exposed to gasoline for 1 h, those exposedto 0.001% of gasoline for 30 min, and control thalli. Thalli exposedto 0.01%, 0.1%, and 1.0% of gasoline for 30 min were set in a fourthbranch, closer to the former one.
Principal components analysis shown lesser discriminatingpower in respect to hierarchical clustering analysis, but yetreturned interesting results available in supplementary material.PC1 and PC2 together were able to explain around 77% of thesample variance, while near 96% was achieved by adding the extracontributions of PC3 and PC4, suggesting the relevance of allbiochemical parameters involved in the model (Table 3,supplementary material). Groups exposed to 0.01%, 0.1%, and 1.0%of gasoline for 24 h grouped in negative PC1, far from the axis(Fig. 5b), while control and groups exposed to 1 h and 12 h wereclose to PC1 axis. By plotting the variables as vectors, it was foundthat soluble sugars and starch strongly contributed for the samplegrouping in negative PC1, while total chlorophylls, total caroten-oids, and polyphenols contributed mostly for a positive PC1. Totalchlorophylls and polyphenols contributed for a negative PC2, as thecontents of carotenoids contributed for a positive PC2. Unsuper-vised methods are in agreement with the analysis of variance andthe correlation results, reinforcing that the time of exposure wasthe decisive factor affecting U. lactuca metabolism, and that 12 h ofexposure to gasoline was a turning point for the metabolic alter-ations found.

Fig. 5. a) Dendrogram of hierarchical cluster analysis of biochemical variables of control (black leaf) and gasoline-treated U. lactuca thallus. Group labels: G ¼ gasoline; Time ofexposure: T1 ¼ 30min (red leaves), T2 ¼ 1 h (green leaves), T3 ¼ 12 h (blue leaves), T4 ¼ 24 h (cyan leaves); Concentration of gasoline (C1 ¼ 0.001%; C2 ¼ 0.01%; C3 ¼ 0.1%;C4 ¼ 1.0%); b) PCA of biochemical variables of control and gasoline-treated U. lactuca thallus. Group labels defined as above. (For interpretation of the references to colour in thisfigure legend, the reader is referred to the web version of this article.)
F.K. Pilatti et al. / Chemosphere 156 (2016) 428e437436
4. Final considerations
Literature concerning the toxicity of oil and its derivatives inseaweeds highlights that tolerance or susceptibility to these hy-drocarbons is species-dependent, in addition to the importance ofdeveloping standard methods that allow comparing results andincluding more effectively the macroalgae in the scenario of envi-ronmental monitoring programs (O’Brien and Dixon, 1976; Baker,1970; Eklund and Kautsky, 2003). Although U. lactuca is consid-ered to be a tolerant species to a wide range of environmentalpollutants, including heavy metals (Han et al., 2008), susceptibilityto gasoline was observed in our short-term experiments throughmorphological alterations and decreasing in carotenoid and poly-phenol contents after 12 h and 24 h of exposure. Nonetheless, ourfindings on soluble sugars and starch contents indicate that thismacroalgae is able to detoxify these hydrocarbons and possibly usethem as a carbon source in its metabolism. Further chronic expo-sure and recovery experiments are needed to confirm our findings,however our results shed a light on an important detoxifyingpathway in macroalgae that remains poorly comprehended andmight help to elucidate the crucial role of this species in bioreme-diation of aquatic environments.
Acknowledgements
To Coordination for the Improvement of Higher EducationPersonnel (CAPES) for financial support. Authors are thankful to theCentral Laboratory of Electron Microscopy (LCME) and Multi-UserLaboratory for Studies in Biology (LAMEB) at Federal University ofSanta Catarina. The research fellowships granted to M. Maraschin(Proc. 307099/2015-6) and Fernanda Ramlov (Proc. 473408/2013-9)by National Council of Technological and Scientific Development(CNPq) are also acknowledged. This work was partially funded byCNPq and FCT agreement through the PropMine (Proc. 490383/2013-0) and PVE (Proc. 407323/2013-9, Dr. Miguel Rocha) grants.
Appendix A. Supplementary data
Supplementary data related to this article can be found at http://dx.doi.org/10.1016/j.chemosphere.2016.04.126.
References
Arnon, D.I., 1949. Copper enzyme in isolated chloroplast. Plant Physiol. 24, 1e15.http://dx.doi.org/10.1104/pp.24.1.1.
Ansari, Z.A., Saldanha, M.C., Rajkumar, R., 1997. Effects of petroleum hydrocarbonson the growth of a microalga, Isochrysis sp. (Chrysophyta). Indian J. Mar. Sci. 26,372e376.
Baker, J.M., 1970. The effects of oils on plants. Environ. Pollut 1, 27e44. http://dx.doi.org/10.1016/0013-9327(70)90004-2.
Batterton, J.C., Winters, K., Van Baalen, C., 1978. Sensitivity of three microalgae tocrude oils and fuel oils. Mar. Environ. Res. 1, 31e41. http://dx.doi.org/10.1016/0141-1136(78)90011-9.
Coffey, C., Ward, C.H., King, J.M., 1977. Effects of petroleum hydrocarbons on growthof freshwater algae. Developments in industrial microbiology. In: Proceedingsof the Thirty-third General Meeting of the Society for Industrial Microbiology,vol. 18. American Institute of Biological Sciences, Washington, D.C, pp. 661e672.
Edwards, P., 1970. Illustrated Guide to the Seaweeds and Sea Grasses in the Vicinityof Port Aransas, Texas: by Peter Edwards, vol. 1. University of Texas Press.
Eklund, B.T., Kautsky, L., 2003. Review on toxicity testing with marine macroalgaeand the need for method standardization e exemplified with copper andphenol. Mar. Pollut. Bull. 46, 171e181. http://dx.doi.org/10.1016/S0025-326X(02)00225-4.
Frank, H.A., Cogdell, R.J., 1996. Carotenoids in photosynthesis. Photochem. Photo-biol. 63, 257e264. http://dx.doi.org/10.1351/pac198557050723.
Gaur, J.P., Singh, K., 1989. Comparative studies on the toxicity of petroleum oils andtheir aqueous extracts towards Anabaena doliolum. P. Indian A. S. 99, 459e466.
Han, T., Kang, S.H., Park, J.S., Lee, H.K., Brown, M.T., 2008. Physiological responses ofUlva pertusa and U. armoricana to copper exposure. Aquat. Toxicol. 86, 176e184.http://dx.doi.org/10.1016/j.aquatox.2007.10.016.
Haritash, A.K., Kaushik, C.P., 2009. Biodegradation aspects of polycyclic aromatichydrocarbons (PAHs): a review. J. Hazard. Mater. 169, 1e15. http://dx.doi.org/10.1016/j.jhazmat.2009.03.137.
Havaux, M., 1998. Carotenoids as membrane stabilizers in chloroplasts. Trends PlantSci. 3, 147e151. http://dx.doi.org/10.1016/S1360-1385(98)01200-X.
Hiscox, J.D., Israelstam, G.F., 1979. A method for the extraction of chlorophyll fromleaf tissue without maceration. Can. J. Bot. 57, 1332e1334. http://dx.doi.org/10.1139/b79-163.
Hulshof, P.J.M., Kosmeijer-Schuil, T., West, C.E., Hollman, P.C.H., 2007. Quickscreening of maize kernels for provitamin a content. J. Food Compos. Anal. 20,655e661. http://dx.doi.org/10.1016/j.jfca.2006.04.014.
Khoddami, A., Wilkes, M.A., Roberts, T.H., 2013. Techniques for analysis of plantphenolic compounds. Molecules 18, 2328e2375. http://dx.doi.org/10.3390/molecules18022328.
Korte, F., Kvesitadze, G., Ugrekhelidze, D., Gordeziani, M., Khatisashvili, G.,Buadze, O., Zaalishvili, G., Coulston, F., 2000. Organic toxicants and plants.Ecotoxicol. Environ. Saf. 47, 1e26. http://dx.doi.org/10.1006/eesa.2000.1929.
Kumar, M., Kumari, P., Gupta, V., Anisha, P.A., Reddy, C.R.K., Jha, B., 2010. Differentialresponses to cadmium induced oxidative stress in marine macroalga Ulva lac-tuca (Ulvales, Chlorophyta). BioMetals 23, 315e325. http://dx.doi.org/10.1007/s10534-010-9290-8.
Kureyshevich, A.V., Guseynova, V.P., 2008. Influence of oil products on the growthand content of pigments in the cultures of Microcystis aeruginosa Kütz. emend.Elenk. and Desmodesmus armatus (Chod.) Hegew. Hydrobiol. J. 44, 70e80.

F.K. Pilatti et al. / Chemosphere 156 (2016) 428e437 437
http://dx.doi.org/10.1615/HydrobJ.v44.i4.70.Lewis, M., Pryor, R., 2013. Toxicities of oils, dispersants and dispersed oils to algae
and aquatic plants: review and database value to resource sustainability. En-viron. Pollut. 180, 345e367. http://dx.doi.org/10.1016/j.envpol.2013.05.001.
Mendiburu, F., 2014. Agricolae: Statistical Procedures for Agricultural Research. RPackage. Version 1.2e1.
O’Brien, P.Y., Dixon, P.S., 1976. The effects of oils and oil components on algae: areview. Br. Phycol. J. 11, 115e142. http://dx.doi.org/10.1080/00071617600650161.
Petrussa, E., Braidot, E., Zancani, M., Peresson, C., Bertolini, A., Patui, S., Vianello, A.,2013. Plant flavonoids-biosynthesis, transport and involvement in stress re-sponses. Int. J. Mol. Sci. 14, 14950e14973. http://dx.doi.org/10.3390/ijms140714950.
Rainbow, P.S., 1995. Biomonitoring of heavy metal availability in the marine envi-ronment. Mar. Pollut. Bull. 31, 183e192. http://dx.doi.org/10.1016/0025-326X(95)00116-5.
Ramlov, F., Carvalho, T.J.G., Schmidt, �E.C., Martins, C.D.L., Kreusch, M.G., OliveiraRodrigues, E.R., Bauer, C.M., Bouzon, Z.L., Horta, P.A., Maraschin, M., 2013.Metabolic and cellular alterations induced by diesel oil in Hypnea musciformis(Wulfen) J. V. Lamour. (Gigartinales, Rhodophyta). J. Appl. Phycol. http://dx.doi.org/10.1007/s10811-013-0209-y.
Rodrigues, R.V., Miranda-Filho, K.C., Gusm~ao, E.P., Moreira, C.B., Romano, L.A.,Sampaio, L.A., 2010. Deleterious effects of water-soluble fraction of petroleum,diesel and gasoline on marine pejerrey Odontesthes argentinensis larvae. Sci.Total Environ. 408, 2054e2059. http://dx.doi.org/10.1016/j.scitotenv.2010.01.063.
Schiavon, M., Moro, I., Pilon-Smits, E.A.H., Matozzo, V., Malagoli, M., DallaVecchia, F., 2012. Accumulation of selenium in Ulva sp. and effects onmorphology, ultrastructure and antioxidant enzymes and metabolites. Aquat.Toxicol. 122e123, 222e231. http://dx.doi.org/10.1016/j.aquatox.2012.06.014.
Schmidt, E.C., Pereira, B., dos Santos, R.W., Gouveia, C., Costa, G.B., Faria, G.S.M.,Scherner, F., Horta, P.A., Martins, R.D.P., Latini, A., Ramlov, F., Maraschin, M.,Bouzon, Z.L., 2012. Responses of the macroalgae Hypnea musciformis afterin vitro exposure to UV-B. Aquat. Bot. 100, 8e17. http://dx.doi.org/10.1016/j.aquabot.2012.03.004.
Schmidt, E.C., Scariot, L.A., Rover, T., Bouzon, Z.L., 2009. Changes in ultrastructure
and histochemistry of two red macroalgae strains of Kappaphycus alvarezii(Rhodophyta, Gigartinales), as a consequence of ultraviolet B radiation expo-sure. Micron 40, 860e869. http://dx.doi.org/10.1016/j.micron.2009.06.003.
Scott, C.E., Eldridge, A.L., 2005. Comparison of carotenoid content in fresh, frozenand canned corn. J. Food Compos. Anal. 18, 551e559. http://dx.doi.org/10.1016/j.jfca.2004.04.001.
Tiburtius, E.R.L., Peralta-Zamora, P., Leal, E.S., 2004. Contaminaç~ao de �aguas porBTXs e processos utilizados na remediaç~ao de sítios contaminados. Quim. Nova27, 441e446. http://dx.doi.org/10.1590/S0100-40422004000300014.
Torres, M.A., Barros, M.P., Campos, S.C.G., Pinto, E., Rajamani, S., Sayre, R.T.,Colepicolo, P., 2008. Biochemical biomarkers in algae and marine pollution: areview. Ecotoxicol. Environ. Saf. 71, 1e15. http://dx.doi.org/10.1016/j.ecoenv.2008.05.009.
Trevelyan, W.E., Harrison, J.S., 1952. Studies on yeast metabolism. 1. Fractionationand microdetermination of cell carbohydrates. Biochem. J. 50, 298e303. http://dx.doi.org/10.1042/bj0500298.
Tukaj, Z., Bohdanowicz, J., Aksmann, A., 1998. A morphometric and stereologicalanalysis of ultra structural changes in two Scenedesmus (Chlorococcales,Chlorophyta) strains subjected to diesel fuel oil pollution. Phycologia 37,388e393. http://dx.doi.org/10.2216/i0031-8884-37-5-388.1.
Vandermeulen, J.H., Buckley, D.E., Levy, E.M., Long, B.F.N., McLaren, P., Wells, P.G.,1979. Sediment penetration of Amoco Cadiz oil, potential for future release, andtoxicity. Mar. Pollut. Bull. 10, 222e227. http://dx.doi.org/10.1016/0025-326X(79)90294-7.
Vieira, P.A., Vieira, R.B., de França, F.P., Cardoso, V.L., 2007. Biodegradation of effluentcontaminated with diesel fuel and gasoline. J. Hazard. Mater 140, 52e59. http://dx.doi.org/10.1016/j.jhazmat.2006.06.048.
Wickham, H., 2009. Ggplot2: Elegant Graphics for Data Analysis. Springer, NewYork.
Wickham, H., Chang, W., 2015. Tools to Make Developing R Packages Easier.Devtools.
Yan, S., Zhou, Q., 2011. Toxic effects of Hydrilla verticillata exposed to toluene, eth-ylbenzene and xylene and safety assessment for protecting aquatic macro-phytes. Chemosphere 85, 1088e1094. http://dx.doi.org/10.1016/j.chemosphere.2011.07.040.