IN THIS ISSUE - Kotak Securities Ltd. Online Trading€¦ · · 2015-12-16IN THIS ISSUE Monthly...
28
Transcript of IN THIS ISSUE - Kotak Securities Ltd. Online Trading€¦ · · 2015-12-16IN THIS ISSUE Monthly...


15Investment Strategist November 2015
BUYBUY
)nm sR( paC tkM)sR( L/H keeW 25)sR( ecirP tekraM tnerruC08883131 / 262571
Source: Bloomberg
Source: Bloomberg
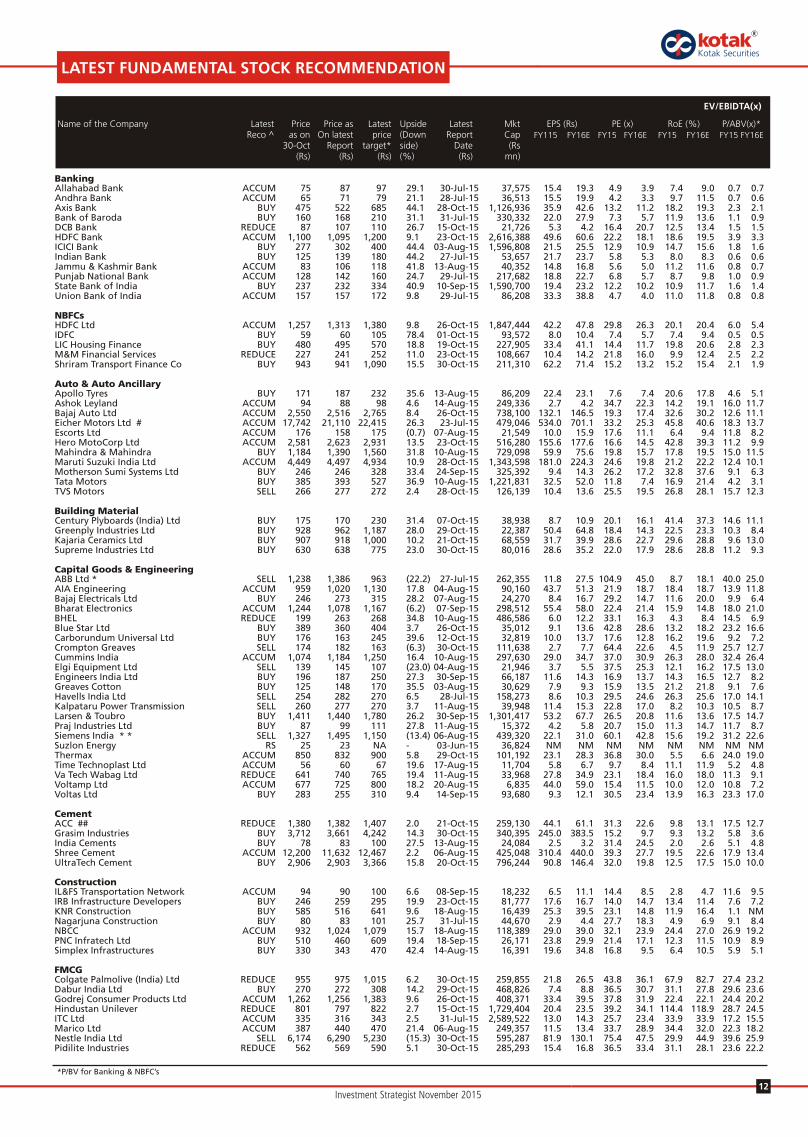
FINANCIALS (RS MN) FY15 FY16E FY17E525,51selaS 18,618 21,909
%81%02%12)%( htworG915,2ADTIBE 3,165 3,834
EBITDA margin (%) 16.2% 17.0% 17.5%897,1TBP 2,276 2,863805,1tiforp teN 1,935 2,4338.6)sR( SPE 8.7 10.9
%62%82%521)%( htworG8.8)sR( SPEC 10.7 13.2
Book value (Rs/share) 17.4 24.6 34.0Dividend per share (Rs) 1.2 1.2 1.2 Source: Company, Kotak Securities - Private Client Research
4.44)%( EOR 41.4 37.37.62)%( ECOR 29.4 30.7848,4tbed teN 4,426 3,940
Net Working Capital (Days) 140.1 147.0 147.0
VALUATION PARAMETERS FY15 FY16E FY17E8.52)x( E/P 20.1 16.00.01)x( VB/P 7.1 5.18.2)x( selaS/VE 2.3 1.92.71)x( ADTIBE/VE 13.5 11.1
PRICE PERFORMANCE (%) 1M 3M 6M13.3 (14.9) (13.1)
Source: Bloomberg, Company, Kotak Securities - Private Client Research Source: Company
Revenues (Rs mn)
Potential Upside (%)31.4%
1 Year Performance
Share Holding Pattern (%)
Revenue mix (%)
Last report at Rs.170 on 7 October 2015CENTURY PLYBOARDS (INDIA) LTD
Target Price (Rs)230
Promoter73.3%
FII10.7%
DII3.4%
Others12.5%
0
200
400
600
800
1000
1200
Dec
-13
Feb-
14
Apr
-14
Jun-
14
Aug
-14
Oct
-14
Dec
-14
Feb-
15
Apr
-15
Jun-
15
Aug
-15
Oct
-15
Century Plyboards (India) Ltd Nifty
INVESTMENT ARGUMENT Demand environment likely to revive in medium term - We expect the
demand to recover at 10-12% every year going forward in medium to longterm.
GST implementation to be a game changer for the sector - With GST implementation, organized players would be able to tap the low costsegment captured by unorganized segment as it would bring both thesegments on a level playing field
Strong distribution network and branding to help in improving marketshare - Company has a strong dealer network of nearly 1500 dealers, 35branch offices, 6 regional distribution centres and 7 manufacturinglocations
Volume expansion and strong margin to drive PAT growth goingahead- We expect revenues and net profits to grow at a CAGR of 19% and27% respectively between FY15-FY17
Attractive valuations - We expect the stock to trade at higher multiplesgoing forward also as the company is ideally positioned to capture theupcoming demand as well as increased consumption with its leadershipposition and strong branding.
RISKS & CONCERNS Demand slowdown Forex volatility Delay in GST implementation Higher raw material prices
COMPANY BACKGROUND Century Plyboards is the largest plywood manufacturer with more than
30% share in the India's organized plywood sector with an annual capacity of 209420 CBM in plywood and 4.8 mn sheets in laminates.
SECTOR BACKGROUND Indian panel products and laminate industry is estimated at nearly Rs 285
bn - of which plywood accounts for Rs 180 bn, laminates account for Rs 66bn while rest is constituted by MDF.
0.0%
20.0%
40.0%
60.0%
80.0%
100.0%
120.0%
FY14 FY15 FY16E FY17E
Others CFS Laminate Plywood
0.0
10.0
20.0
30.0
40.0
50.0
FY14 FY15 FY16E FY17E
ROE (%) ROCE (%)

16Investment Strategist November 2015
BUYACCUMULATE
)nm sR( paC tkM)sR( L/H keeW 25)sR( ecirP tekraM tnerruC317792127 / 84214701
Source: Bloomberg
Source: Bloomberg
FINANCIALS (RS MN) FY15 FY16E FY17E850,44selaS 52,506 62,9628.01)%( htworG 19.2 19.9053,7ADTIBE 9,033 11,093
EBITDA margin (%) 16.7 17.2 17.6473,9TBP 10,178 12,188459,6tiforp teN 8,041 9,6291.52)sR( SPE 29.0 34.79.51)%( htworG 15.6 19.80.82)sR( SPEC 31.9 37.81.401)erahs/sR( VB 116.8 131.6
Dividend/share (Rs) 13.0 14.0 17.0 Source: Company, Kotak Securities - Private Client Research5.52)%( EOR 26.3 28.09.32)%( ECOR 24.7 26.5997)tbed( hsac teN 1,684 2,424
NW Capital (Days) 50.8 30.5 26.3
VALUATION PARAMETERS FY15 FY16E FY17E8.24)x( E/P 37.0 30.93.01)x( VB/P 9.2 8.26.6)x( selaS/VE 5.6 4.68.93)x( ADTIBE/VE 32.5 26.4
PRICE PERFORMANCE (%) 1M 3M 6M(1.3) 7.7 24.7
Source: Bloomberg, Company, Kotak Securities - Private Client Research Source: Company
Revenue mix (%)
Potential Upside (%)16.4%
1 Year Performance
Share Holding Pattern (%)
Export Sales (Rs bn)
Last report at Rs.1184 on 10 August 2015
CUMMINS INDIA LTD
Target Price (Rs)1250
Promoter51.0%
FII17.1%
DII18.1%
Others13.8%
0
10
20
30
40
50
60
Q1 FY15 Q2 FY15 Q3FY15 Q4FY15 Q1FY16
Power44%
Industrial18%
Automotive6%
Distribution32%
50
110
170
230
290
350
Dec
-13
Feb-
14
Apr
-14
Jun-
14
Aug
-14
Oct
-14
Dec
-14
Feb-
15
Apr
-15
Jun-
15
Aug
-15
Oct
-15
Cummins India Ltd Nifty
INVESTMENT ARGUMENT CIL reported YoY revenue growth in FY15 exports revenues on
back of recovery in key overseas markets. Company is well poised to benefit from recovery in the
infrastructure spending in the country. Commencement of mega production site at Phaltan is likely to
ease out capacity constraints and would add to cash flowgeneration in future. Company has committed a Capex of USD300 mn funded mainly through internal accruals.
We recommend 'BUY' on company's stock with a DCF basedprice target of Rs 1250.
RISKS & CONCERNS Slowdown in industrial production and core sector growth Rising interest rate scenario can put further pressure on domestic
capex cycle.
COMPANY BACKGROUND A Cummins Inc subsidiary. Significant player in domestic market Diversified across power, industrial and automotive sector.
SECTOR BACKGROUND Oil engines (backup power) sales is expected to grow with the
overall economic growth going ahead. Indian Low KVA oil engines market is highly competitive. Mid/High
KVA engines space is dominated by few players.

17Investment Strategist November 2015
BUYBUYY
)nm sR( paC tkM)sR( L/H keeW 25)sR( ecirP tekraM tnerruC9001431033 / 52042173
Source: Bloomberg
Source: Bloomberg
FINANCIALS (RS MN) FY15 FY16E FY17E673,423selaS 369,234 427,271
%61%41%21)%( htworG843,74ADTIBE 60,536 87,571
EBITDA margin (%) 14.6% 16.4% 20.5%334,43TBP 43,109 69,199834,71tiforp teN 22,498 35,2239.981)sR( SPE 245.0 383.5
)8.51()%( htworG 29.0 56.61.063)sR( SPEC 447.9 604.4
Book value (Rs/share) 2,517.0 2,735.6 3,092.7Dividend per share (Rs) 21.0 21.0 21.0 Source: Company, Kotak Securities - Private Client Research
8.7)%( EOR 9.3 13.29.21)%( ECOR 14.9 21.5
Net cash (debt) (13,968) (12,176) 22,876Net Working Capital (Days) 71 71 71
VALUATION PARAMETERS FY15 FY16E FY17E6.91)x( E/P 15.2 9.75.1)x( VB/P 1.4 1.21.1)x( selaS/VE 1.0 0.75.7)x( ADTIBE/VE 5.8 3.6
PRICE PERFORMANCE (%) 1M 3M 6M3.6 (1.6) 1.8
Source: Bloomberg, Company, Kotak Securities - Private Client Research Source: Company
Last report at Rs.3661 on 30 October 2015GRASIM INDUSTRIES LTD
Target Price (Rs)4242
Segmentwise Revenue breakup
Potential Upside (%)14.3%
1 Year Performance
Share Holding Pattern (%)
Cement industry capacity (MT)
Promoter29.7%
FII26.5%
DII20.2%
Others23.5%
0
100
200
300
400
500
FY09 FY10 FY11 FY12 FY13 FY14 FY15
8090
100110120130140150160
Dec
-13
Feb-
14
Apr
-14
Jun-
14
Aug
-14
Oct
-14
Dec
-14
Feb-
15
Apr
-15
Jun-
15
Aug
-15
Oct
-15
Grasim Industries Ltd Nifty
INVESTMENT ARGUMENT VSF prices started recovering during H1FY16 along with volume
improvement and cost reduction which led to good performance ofVSF division.
Capacity expansion in VSF and chemical division to translate into increased volumes during FY16 and FY17.
Cement division volumes are also likely to increase on demandimprovement, capacity expansion, higher dispatch from JCCLplants.
We expect revenues to grow at a CAGR of 15% between FY15-FY17. We expect margins to improve to 16.4% and 20.5% for FY16and FY17 respectively. Profits are likely to grow at a CAGR of 42% between FY15-17.
We recommend BUY on the stock.
RISKS & CONCERNS Further decline in VSF prices may impact revenues and margins of
VSF division Steep increases in pulp and sulphur prices may increase costs for
VSF division
COMPANY BACKGROUND Grasim Industries is a diversified player in cement, viscose staple
fibre (VSF) and chemicals Company is expanding its capacity in cement to enhance its overall
markets share in cement and in VSF division to capture higherdemand.
0%
20%
40%
60%
80%
100%
FY10 FY11 FY12 FY13 FY14 FY15
Others Textiles Chemicals Cement VSF

18Investment Strategist November 2015
BUYBUY
)nm sR( paC tkM)sR( L/H keeW 25)sR( ecirP tekraM tnerruC8278061842 / 393772
Source: Bloomberg
Source: Bloomberg
FINANCIALS (RS MN) FY15 FY16E FY17E194emocni tseretnI 540 610
Interest expense 300.5 324.4 363.4Net interest income 190 215 246
%4.41%0.31%6.51)%( htworG221emocni rehtO 129 146791tiforp ssorG 216 2488.111tiforp teN 123.4 143.5
%3.61%4.01%9.31)%( htworG9.3)%( APN ssorG 3.8 3.26.1)%( APN teN 1.6 1.1
Net interest margin (%) 3.4 3.4 3.4 Source: Company, Kotak Securities - Private Client Research0.71)%( RAC 17.3 16.95.41)%( EoR 14.6 15.28.1)%( AAoR 1.8 1.9
Dividend per share (Rs) 5.0 5.5 6.03.91)sR( SPE 21.3 24.7
Adjusted BVPS (Rs) 127.9 141.4 161.6
VALUATION PARAMETERS FY15 FY16E FY17E4.41)x( E/P 13.0 11.22.2)x( VB/P 2.0 1.7
PRICE PERFORMANCE (%) 1M 3M 6M4.4 (7.8) (15.8)
Source: Bloomberg, Company, Kotak Securities - Private Client Research Source: Company
Last report at Rs.277 on 2 November 2015ICICI BANK LTD
Target Price (Rs)400
Trend in Asset Quality
Potential Upside (%)44.4%
1 Year Performance
Share Holding Pattern (%)
Trend in earnings (Rs bn)
Promoter0.0%
FII53.9%
DII33.5%
Others12.7%
70
90
110
130
150
170
190
Dec
-13
Feb-
14
Apr
-14
Jun-
14
Aug
-14
Oct
-14
Dec
-14
Feb-
15
Apr
-15
Jun-
15
Aug
-15
Oct
-15
ICICI Bank Ltd Nifty
INVESTMENT ARGUMENT We like the quality of liability franchise - CASA mix at 45.1% (Q2FY16),
one of the best in the industry. NIM has been strong on back of strong accretion to low cost deposits as
well as better ALM. Lower risk on SME portfolio (~5% of total portfolio). While retail piece has
witnessed insignificant net slippage, corporate segment continues toperform well.
RoA is likely to remain stronger at 1.8% (FY16/17), driving up the RoE to15%+ (FY17). Management focus on stable growth with improvingstructural profitability reinforces our existing positive outlook on the stock.
Incremental stress build-up is front-loaded and likely to be lower in FY16as compared to the same seen during FY15.
We have used SOTP method to value the stock, where standalone business comes to Rs.323 (2.0x FY17E ABV) and subsidiaries are valued at Rs.77 (holding co discount: 20%).
RISKS & CONCERNS Retail book stands at ~44% of total book, highly vulnerable to system-
wide deterioration in retail asset quality. Deregulation of interest rates on saving deposits (~32% of deposits)
might increase the funding costs and in turn impacting its NIM.
COMPANY BACKGROUND Largest private sector banks (4054 branches in Q2FY16) with 4.2%
market share in domestic loans. After conscious strategy of de-growing their B/S post Lehman collapse,
bank has started focusing on profitable growth
SECTOR BACKGROUND Easing bond yield is positive for wholesale funded entities and is likely to
result into higher trading gains for banks. Retail segment continues to drive loan growth. Prefer private sector
banks and remain cautious on PSU banks.
0.0
10.0
20.0
30.0
40.0
50.0
60.0
Q2FY15 Q3FY15 Q4FY15 Q1FY16 Q2FY16
NII PAT
2.5
3.0
3.5
4.0
90
100
110
120
130
140
150
160
170
Q2FY15 Q3FY15 Q4FY15 Q1FY16 Q2FY16
Gross NPA (Rs bn - LHS)Gross NPA (% - RHS)

19Investment Strategist November 2015
BUY
)nm sR( paC tkM)sR( L/H keeW 25)sR( ecirP tekraM tnerruC037431681 / 962052
Source: Bloomberg
Source: Bloomberg
FINANCIALS (RS MN) FY15 FY16E FY17E985,34722,93124,53selaS1.117.013.11)%( htworG145,6636,5944,4ADTIBE
EBITDA margin (%) 12.6 14.4 15.0190,6002,5989,3TBP241,4635,3617,2tiforp teN7.76.60.5)sR( SPE
Growth (%) 21.7 30.2 17.1CEPS (Rs) 6.3 7.8 9.0Book value (Rs/share) 29.7 33.3 37.9Dividend per share (Rs) 1.1 1.1 1.1 Source: Company, Kotak Securities - Private Client ResearchROE (%) 17.0 19.7 20.3ROCE (%) 16.9 19.7 20.3Net cash (debt) 2,216 2,609 2,846Net Working Capital (Days) 43.2 42.2 42.5
VALUATION PARAMETERS FY15 FY16E FY17E6.94)x( E/P 38.1 32.54.8)x( VB/P 7.5 6.67.3)x( selaS/VE 3.3 3.06.92)x( ADTIBE/VE 23.3 20.0
PRICE PERFORMANCE (%) 1M 3M 6M3.6 (2.9) 11.1
Source: Bloomberg, Company, Kotak Securities - Private Client Research Source: Company
Average price increase for KNPL in %
Potential Upside (%)10.0%
1 Year Performance
Share Holding Pattern (%)
Volume in million litres for KNPL
Last report at Rs.256 on 26 October 2015KANSAI NEROLAC PAINTS LTD
Target Price (Rs)275
Promoter69.3%
FII7.5%
DII8.2%
Others15.1%
0
50
100
150
200
250
300
350
FY14 FY15 FY16E FY17E
4.24.34.44.54.64.74.84.95.05.1
FY14 FY15 FY16E FY17E
50
110
170
230
290
350
Dec
-13
Feb-
14
Apr
-14
Jun-
14
Aug
-14
Oct
-14
Dec
-14
Feb-
15
Apr
-15
Jun-
15
Aug
-15
Oct
-15
Kansai Nerolac Paints Ltd Nifty
INVESTMENT ARGUMENT KNPL is the market leader in the Industrial Paint Segment with 42%
market share, with automotive segment contributing 75% of theindustrial segment revenues.
Company which currently has 15% market share in the decorativepaint segment is also looking to expand aggressively in thesegment.
We expect revival in auto sales and capex cycle to pick up fromhere
We estimate margins of the company to improve over FY15 toFY17E by 240 bps
RISKS & CONCERNS Prolong slowdown in the automotive segment Prolong slowdown in the economy leading to weak capex cycle
impacting industrial demand Increase in competition
COMPANY BACKGROUND Kansai Nerolac Paints Ltd. (KNPL), a subsidiary of Kansai Paint,
Japan, is one of India's leading paint companies and the largest player in the industrial segment.
The company is the market leader in the automotive coatingsegment in India with a dominant market share
SECTOR BACKGROUND The paint sector is broadly divided into two areas: Decorative
segment with 80% market share and Industrial Segment with 20%market share.
ACCUMULATE

20Investment Strategist November 2015
BUYACCUMULATE
)nm sR( paC tkM)sR( L/H keeW 25)sR( ecirP tekraM tnerruC45934319423 / 36749444
Source: Bloomberg
Source: Bloomberg
FINANCIALS (RS MN) FY15 FY16E FY17E607,994selaS 591,484 711,4133.41)%( htworG 18.4 20.3921,76ADTIBE 96,663 113,542
EBITDA margin (%) 13.4 16.3 16.0936,84TBP 74,900 92,811960,73tiforp teN 54,677 67,7527.221)sR( SPE 181.0 224.30.43)%( htworG 47.5 23.90.081)sR( SPEC 245.0 291.7
Book value (Rs/share) 784.7 924.8 1,096.4Dividend per share (Rs) 25.0 35.0 45.0 Source: Company, Kotak Securities - Private Client Research
6.61)%( EOR 21.2 22.23.12)%( ECOR 28.0 28.7
Net cash (debt) 121,469 149,638 207,666Net Working Capital (Days) (7.2) (7.9) (10.2)
VALUATION PARAMETERS FY15 FY16E FY17E3.63)x( E/P 24.6 19.87.5)x( VB/P 4.8 4.14.2)x( selaS/VE 2.0 1.62.81)x( ADTIBE/VE 12.4 10.0
PRICE PERFORMANCE (%) 1M 3M 6M(2.2) 3.5 20.3
Source: Bloomberg, Company, Kotak Securities - Private Client Research Source: Company
Last report at Rs.4497 on 28 October 2015MARUTI SUZUKI INDIA LTD
Target Price (Rs)4934
Market Share (%)
Potential Upside (%)10.9%
1 Year Performance
Share Holding Pattern (%)
Sales Volumes (Units)
Promoter56.2%FII
22.1%
DII14.4%
Others7.3%
0
200,000
400,000
600,000
800,000
1,000,000
1,200,000
1,400,000
FY07 FY08 FY09 FY10 FY11 FY12 FY13 FY14 FY15
48.0
45.9 46.5
44.7 45.3
38.4 40.1
42.1
45.0
35
40
45
50
FY07 FY08 FY09 FY10 FY11 FY12 FY13 FY14 FY15
80
120
160
200
240
280
320
Dec
-…
Feb-
14
Apr
-14
Jun-
14
Aug
-…
Oct
-14
Dec
-…
Feb-
15
Apr
-15
Jun-
15
Aug
-…
Oct
-15
Maruti Suzuki India Ltd Nifty
INVESTMENT ARGUMENT MSIL is expected to benefit from multiple earnings growth lever in the
next 2-3 years. On the back of expected recovery in the economy, the domestic
passenger car industry is likely to grow on a strong note. MSIL, being themarket leader will be the key beneficiary of this expected revival in cardemand.
Factors such as expected recovery in small car demand, preference shifttowards petrol cars due to fall in fuel prices and strong urban centric newproduct pipeline should lead to healthy market share for the company.
MSIL's operating margins is likely to stay healthy on the back offavorable currency, reduction in discounts on demand recovery andbenefits of operating leverage from expected strong volume growthoutlook.
RISKS & CONCERNS Lower than anticipated growth will jeopardize our revenue and profit
estimates. MSIL benefits from yen depreciation. Any unfavorable movement of yen
can have significant impact on the company's profitability.
COMPANY BACKGROUND MSIL, India's largest passenger car company, is a subsidiary of Suzuki
Motor Corporation of Japan. Formed as a government owned company(Maruti Udyog Limited), it entered into a JV with Suzuki MotorCorporation. Over the years the company has been one the mostsuccessful player in the Indian car market.
SECTOR BACKGROUND India’s passenger vehicle industry sold ~3mn vehicles in FY14. While
80% of sales happened in the domestic market, balance 20% wereexported. Top five players account for ~80% of industry sales volumes.
21Investment Strategist November 2015
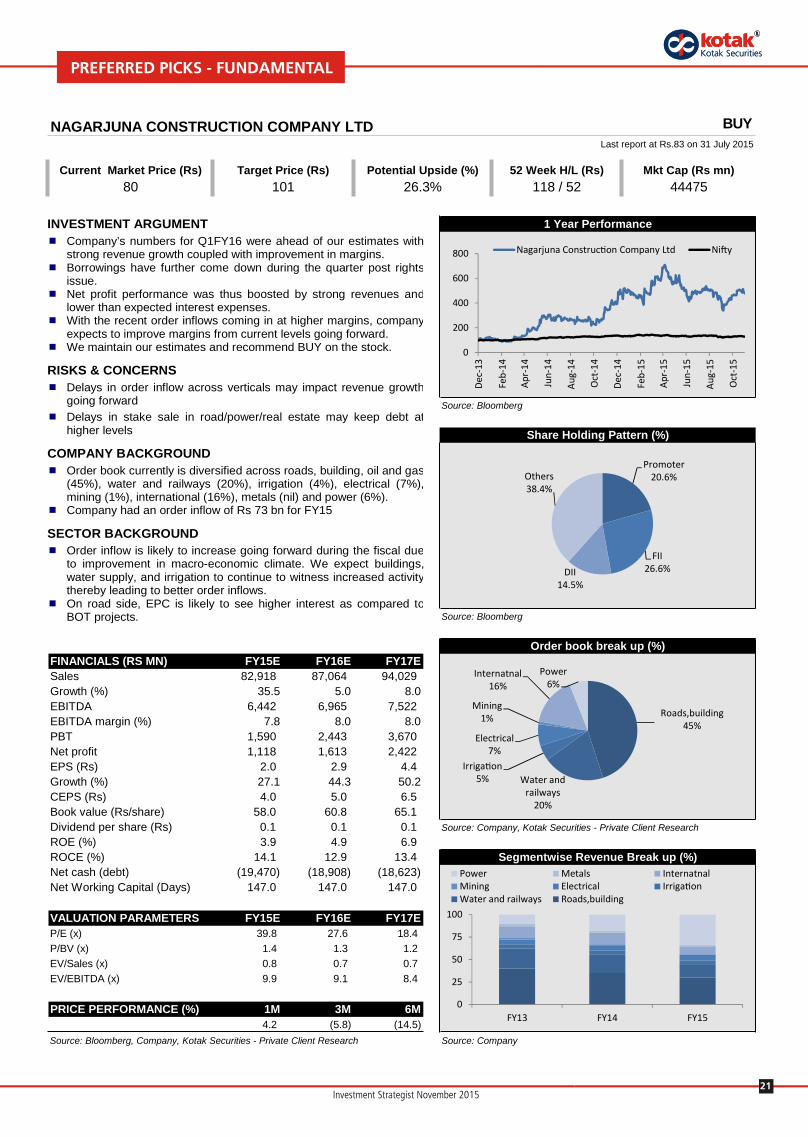
BUYBUYNAGARJUNA CONSTRUCTION COMPANY LTD
)nm sR( paC tkM)sR( L/H keeW 25)sR( ecirP tekraM tnerruC5744425 / 81108
Source: Bloomberg
Source: Bloomberg
FINANCIALS (RS MN) FY15E FY16E FY17E819,28selaS 87,064 94,029
0.80.55.53)%( htworG244,6ADTIBE 6,965 7,522
EBITDA margin (%) 7.8 8.0 8.0095,1TBP 2,443 3,670811,1tiforp teN 1,613 2,4220.2)sR( SPE 2.9 4.4
2.053.441.72)%( htworG0.4)sR( SPEC 5.0 6.5
Book value (Rs/share) 58.0 60.8 65.1Dividend per share (Rs) 0.1 0.1 0.1 Source: Company, Kotak Securities - Private Client Research
9.3)%( EOR 4.9 6.91.41)%( ECOR 12.9 13.4
Net cash (debt) (19,470) (18,908) (18,623)Net Working Capital (Days) 147.0 147.0 147.0
VALUATION PARAMETERS FY15E FY16E FY17E8.93)x( E/P 27.6 18.44.1)x( VB/P 1.3 1.28.0)x( selaS/VE 0.7 0.79.9)x( ADTIBE/VE 9.1 8.4
PRICE PERFORMANCE (%) 1M 3M 6M4.2 (5.8) (14.5)
Source: Bloomberg, Company, Kotak Securities - Private Client Research Source: Company
Last report at Rs.83 on 31 July 2015
Target Price (Rs)101
Segmentwise Revenue Break up (%)
Potential Upside (%)26.3%
1 Year Performance
Share Holding Pattern (%)
Order book break up (%)
Promoter20.6%
FII26.6%DII
14.5%
Others38.4%
Roads,building45%
Water and railways
20%
Irrigation5%
Electrical7%
Mining1%
Internatnal16%
Power6%
0
200
400
600
800
Dec
-13
Feb-
14
Apr
-14
Jun-
14
Aug
-14
Oct
-14
Dec
-14
Feb-
15
Apr
-15
Jun-
15
Aug
-15
Oct
-15
Nagarjuna Construction Company Ltd Nifty
INVESTMENT ARGUMENT Company’s numbers for Q1FY16 were ahead of our estimates with
strong revenue growth coupled with improvement in margins. Borrowings have further come down during the quarter post rights
issue. Net profit performance was thus boosted by strong revenues and
lower than expected interest expenses. With the recent order inflows coming in at higher margins, company
expects to improve margins from current levels going forward. We maintain our estimates and recommend BUY on the stock.
RISKS & CONCERNS Delays in order inflow across verticals may impact revenue growth
going forward Delays in stake sale in road/power/real estate may keep debt at
higher levels
COMPANY BACKGROUND Order book currently is diversified across roads, building, oil and gas
(45%), water and railways (20%), irrigation (4%), electrical (7%),mining (1%), international (16%), metals (nil) and power (6%).
Company had an order inflow of Rs 73 bn for FY15
SECTOR BACKGROUND Order inflow is likely to increase going forward during the fiscal due
to improvement in macro-economic climate. We expect buildings,water supply, and irrigation to continue to witness increased activitythereby leading to better order inflows.
On road side, EPC is likely to see higher interest as compared toBOT projects.
0
25
50
75
100
FY13 FY14 FY15
Power Metals InternatnalMining Electrical IrrigationWater and railways Roads,building

22Investment Strategist November 2015
BUYBUY
)nm sR( paC tkM)sR( L/H keeW 25)sR( ecirP tekraM tnerruC1871412597 / 1021098
Source: Bloomberg
Source: Bloomberg
FINANCIALS (RS MN) FY15 FY16E FY17E433,472selaS 275,789 358,1276.07)%( htworG 0.5 29.9636,08ADTIBE 77,166 123,661
EBITDA margin (%) 29.6 28.3 34.5140,46TBP 63,824 116,526909,74tiforp teN 51,442 94,7109.81)sR(SPE 21.4 39.4)0.62()%(htworG 13.3 84.1
3.42)sR(SPEC 21.8 42.82.011)sR(SPVB 130.6 172.1
-)sR( SPD 2.0 2.2 Source: Company, Kotak Securities - Private Client Research2.02)%( EOR 15.4 26.03.33)%( ECOR 23.8 29.6)718,81(tbed teN (64,572) (135,398)
Net working capital(Days) 110.4 118.0 122.0
VALUATION PARAMETERS FY15 FY16E FY17E2.74)x( E/P 41.6 22.61.8)x( VB/P 6.8 5.24.7)x( selaS/VE 7.1 5.31.52)x( ADTIBE/VE 25.5 15.4
PRICE PERFORMANCE (%) 1M 3M 6M(3.1) 5.0 (8.0)
Source: Bloomberg, Company, Kotak Securities - Private Client Research Source: Company
Rev/PAT to post 16%/16% CAGR over FY14-17E
Potential Upside (%)18.5%
1 Year Performance
Share Holding Pattern (%)
US revenues to post 18% CAGR
Last report at Rs.842 on 12 August 2015
SUN PHARMACEUTICALS LTD
Target Price (Rs)1055
Promoter54.7%
FII19.8%
DII15.8%
Others9.7%
80
105
130
155
180
Dec
-13
Jan-
14
Feb-
14
Mar
-…
Apr
-14
May
-…
Jun-
14
Jul-1
4
Aug
-14
Sep-
14
Oct
-14
Nov
-…
Dec
-14
Jan-
15
Sun Pharmaceuticals Ltd Nifty
INVESTMENT ARGUMENT Sun has registered resilient growth year over year in the domestic formulations segment
led by strong branding and core focus on the chronic ailments. Along with Ranbaxy,though the initial quarters are showing signs of lower growth, we expect the trajectory topick up in FY17E led by product launches, marketing tie ups and better penetration. Weexpect Sun to post ~17% CAGR in the segment over FY15-17E.
Sun's US revenues are split between Sun (ex-Taro) and Taro (the acquired subsidiary).The recent quarters have seen slowdown in both segments of US revenues. However,with interesting opportunities like gGleevec gAngiomax and gAbilify in near term as wellcertain price increases taken by Taro, we expect both segments to see revival inrevenues in FY17E (we expect 38% growth in US revenues in FY17E).
Though FY16E will be a challenging year for SUNP, we believe with better outlook forFY17E coupled with lower valuations (at current valuations SUNP trades at 21.5x FY17EEPS) Sun looks poised for good run up over the next 9-12 months. Factoring for strongFY17E, lower valuations and few initial indications of rescaling of supplies from Halolplant, we recommend Buy with a target price of Rs. 1055, 25x FY17E EPS and an NPVof Rs. 70 (for MK-3222, a novel molecule).
RISKS & CONCERNS Sun’s largest USFDA approved plant, Halol, is currently under compliance issues.
Though management remains confident is resolving the same, in adverse events, it cansignificantly impact our assumptions.
Sun expects Ranbaxy integration benefits to be ~US$ 350mn by FY18E, any issues inintegration can impact the valuations of the company.
COMPANY BACKGROUND Sun Pharma was established in 1983 with a portfolio of five products to treat psychiatry
ailments and a manufacturing facility in Vapi, Gujarat. Over the last 30 years, SunPharma has become one of the most profitable pharmaceuticals manufacturers. SunPharma's growth has been dirven by both organic as well inorganic expansion
SECTOR BACKGROUND The Indian Pharma Market (IPM) stood at ~US$ 14.0 bn and is expected to post 13-15%
CAGR over the next 4-5 years. Moreover, US, is the largest pharma market at ~US$390bn, is expected to witness US$ 44bn worth drugs going off patent which will providefurther fillip to Indian companies.
0
10
20
30
40
50
050,000
100,000150,000200,000250,000300,000350,000400,000
FY13 FY14 FY15 FY16E FY17E
Revenues (Rs mn) Net Income (Rs mn) EBIDTAM (%)
0%
10%
20%
30%
40%
50%
60%
0
500
1,000
1,500
2,000
2,500
3,000
3,500
FY13 FY14 FY15 FY16E FY17E
US $ mn Growth (%)