
In this edition: July 2019 Public Policy Analysis · Our approach to producing admin-based...
23
Quarterly Review Public Policy Analysis edition three – April to June 2019 In this edition: This review shines a light on what public policy analysis ONS has been working on in the past quarter. We welcome your feedback, questions and suggestions . July 2019 Outputs You can either scroll through the whole document or click the buttons to jump to the relevant pages Links to other releases
Transcript of In this edition: July 2019 Public Policy Analysis · Our approach to producing admin-based...

Quarterly Review
Public Policy Analysis
edition three – April to June 2019
In this edition:
This review shines a light on what public
policy analysis ONS has been working on in
the past quarter.
We welcome your feedback, questions and
suggestions.
July 2019
Outputs
You can either scroll through the whole document or click the buttons to jump to the relevant pages
Links to other releases

Public Policy Analysis
April to June 2019
You can either scroll through the whole document or click the buttons to jump to the relevant pages
Outputs
Home screen
Outputs list
Analytical insights
Centre for Crime and
Justice
Burglary TaskforceEvidence of recent burglary trends using data
from the Crime Survey for England and Wales
(CSEW) and Police Recorded Crimes (PRC).
Centre for International
Migration
Migration and Population
Transformation updateUpdate on how we are transforming the way we
produce population and migration statistics, to better
meet the needs of our users.
Migration and the education
sectorThe impact and contribution of international
migration on the education sector is a topic of high
public interest.
Centre for Equalities and
Inclusion
Children’s lonelinessAnalysis of children's (aged 10 to 15 years)
reporting of loneliness and perception of their
circumstances from The Children’s Society
Household Survey.
Persistent povertyComparisons of persistent poverty between
UK and other EU countries.
What matters most to life
satisfactionInsights into socio-demographic and economic
factors that matter to life satisfaction, such as
an individual’s characteristics or
circumstances as well as household income
and spending.
Centre for Subnational
Analysis
High StreetsMapping the location and characteristics of
high streets in Great Britain, working with
experimental Ordnance Survey High Street
extents and Office for National Statistics data.
Small area house pricesHouse prices and number of transactions for
property sales in England and Wales, on an
annual basis, updated quarterly.
Centre for Ageing and
Demography
Old-age dependenciesExamining the relationship between population ageing,
economic dependency and international migration in the
UK.
Population and household
projections2016-based variant subnational population projections and
an indication of the future number of households in
England under a range of alternative assumptions
Population estimatesNational and subnational mid-year population estimates
for the UK and its constituent countries by administrative
area, age, sex and components of population change.
Health and Wellbeing
Child and infant mortalityStillbirths, infant and childhood deaths
occurring annually in England and Wales, and
associated risk factors.
Cancer AnalysisLinks data from our Cancer registrations in
England and our Cancer Survival in England
publications to produce robust 5-year net
cancer survival estimates by stage at
diagnosis
Suicides in WalesA compendium of analysis, including suicide
over time by age, sex and method and new
analysis of suicide risk by occupation in
Wales.
Public service dashboardsFour dashboards which bring together a range
of existing public service data covering:
education, health, criminal justice and work
and pensions.
Efficiency seriesThree short stories that are the first in a series
providing analysis and insight in the area of
public service efficiency
Environmental accountsMeasuring the contribution of the environment
to the economy, the impact of economic
activity on the environment, and society's
response to environmental issues.
Living aloneAs the number of one-person households
continues to rise, analysis reveals the financial
situation and personal well-being of those
living alone.
SDGs Voluntary National
ReviewThe government published its first review of
UK progress towards the Sustainable
Development Goals on 26 June.
Inequalities in avoidable
mortalityAvoidable mortality in England and Wales,
using measures of multiple deprivation to
measure socioeconomic inequalities.

Links
What did we find?
What will we be looking at next?
Public Policy Analysis
April to June 2019
You can either scroll through the whole document or click the buttons to jump to the relevant pages
Home screen
Outputs list
Published:
[email protected] @JayLindop_ONS
21 June 2019
Click to open our articles
Transformation of the
population and
migration statistics
system
We are transforming the way we
produce population and migration
statistics, to better meet the needs
of our users.
Our users have told us that they want us to deliver population and migration statistics frequently,
and in a timely manner to be able to make evidence-based decisions. Our statistics also need to
be relevant in a rapidly changing society, and we need to be able to report on their quality.
We have used activity-based rules and records from single and linked data sources to develop
our approach for producing admin-based population estimates. Initial rules have been combined
to produce the first admin-based population estimates (ABPE) using this approach. These rules
have largely removed patterns of over-coverage seen in previous research. While this now
results in higher levels of under-coverage, this is much more comparable with the results seen
from the census before adjustment takes place.
Our progress report on understanding different migration data sources shows that a range of
factors (such as coverage of source and survey issues) impact the coherence between these
outputs, and the impact of those factors accumulate in combination.
In 2020 we will aim to publish migration and population estimates based on administrative data,
integrating where possible into our published headline statistics.
We will be updating our users later this year on:
• Our administrative-based flows research and our work exploring concepts and definitions for
population and migration statistics
• Our further work explaining the coherence of different sources on international migration (as
set out in our workplan)
Population and
migration
transformation
Overview
Our approach to
producing admin-
based population
estimates
User feedback on
transformation work
so far
Understanding
different migration
data sources

International migration and its impact and contribution on the education sector is a complex topic.
Using the best available indicators of international migration, we can get some insights:
• The main driver of changes in the demand for school places is the number of children born,
rather than the recent international migration of children; however, international migration
affects the number of births, and births to non-
UK born mothers have increased over the last
20 years.
Links
What did we find?
What will we be looking at next?
Public Policy Analysis
April to June 2019
You can either scroll through the whole document or click the buttons to jump to the relevant pages
Home screen
Outputs list
Overview
Published: 8 May 2019
[email protected] @JayLindop_ONS
Click to open our article
International Migration
and the education
sector – what does the
current evidence show?
International migration
and education
Whether it be the number of children
requiring school places, the
attainment of pupils or the number
of teaching and support staff in
schools, the impact and contribution
of international migration on the
education sector is a topic of high
public interest.
This article provides an overview of
the current evidence from published
and survey sources on the impact
and contribution of migration on the
state-funded primary and secondary
education sector. The article
includes a number of interactive
tools to enable the reader to explore
data for their local area.
• In January 2018, around 7% of children in state-
funded primary schools and 10% in state-
funded secondary schools in England were born
outside the UK.
• Analysis of data from the Department for
Education showed no evidence of a relationship
between the proportion of pupils with English as
an Additional Language in a local area and the
overall level of pupil attainment, either in
primary or secondary schools
• International migration contributes to the
workforce in schools, with around 12% of school
staff in England born outside the UK in 2015-17.
We plan to publish a follow-up piece considering what further questions administrative data can
help us answer about migrants and their interactions with the education sector. We are also
looking at the health sector, with a publication planned for Summer 2019.
Click below to explore proportion of pupils in state-
funded schools born outside the UK by local
authority in England, January 2018

Links
What did we find?
What will we be looking at next?
Public Policy Analysis
April to June 2019
You can either scroll through the whole document or click the buttons to jump to the relevant pages
Home screen
Outputs list
Overview
Published:
[email protected] @RichPereira_ONS
24 June 2019
Click to open our articles
How would you
support our ageing
population?
Living longer and old-
age dependency – what
does the future hold?
Old age dependencies
The UK population is changing in
both size and structure. By 2050, it
is projected that one in four people
in the UK will be aged 65 years and
over – an increase from almost one
in five in 2018.
Our article examines the relationship
between population ageing,
economic dependency and
international migration in the UK.
We also produced a tool to explore
how these factors affect the Old Age
Dependency Ratio (OADR).
• Traditional measures of the population
age structure such as the OADR may
become less useful as more people
work up to and beyond State Pension
age; an alternative measure that
includes economic activity may
provide a more meaningful picture of
economic dependency.
• Higher levels of net migration slow
population ageing but will not prevent
it; under both measures of
dependency, the population is
projected to age twice as quickly
under zero migration than under a
high migration scenario.
• Projected changes in economic
activity at older ages have a greater
impact on future dependency rates
than projected migration scenarios.
• Continuing our Living Longer series, we will be looking at the implications of an ageing population
for older households and housing. We are also researching new measures of ageing and what
these tell us.
• We also want to provide helpful insight into what an ageing population means at the local level and
have begun to develop a tool so that local data related to ageing will be more readily accessible.
Click below to explore how the Old Age Dependency
Ratio (OADR) changes depending on different
factors

Links
What did we find?
• The 2018-based subnational population projections are planned for publication in Spring 2020
and the 2018-based household projections in Spring/Summer 2020.
• In August 2019, we will also publish a ‘User guide to household projections across the United
Kingdom’ where we compare the methodologies used in household projections across each of
the four countries of the UK. Alongside this, we will also publish some research on local authority
outliers between the 2014-based and 2016-based household projections.
Public Policy Analysis
April to June 2019
You can either scroll through the whole document or click the buttons to jump to the relevant pages
Home screen
Outputs list
Published: 9 April 2019
[email protected] @RichPereira_ONS
Click to open our articles
Variant subnational
population projections for
England: 2016-based
Variant population and
household projections
The 2016-based variant subnational
population projections, include a
variant based on a 10-year trend of
migration data and variants with
higher and lower levels of net
international migration.
The 2016-based household
projections includes four variants:
three show alternative assumptions
of migration and one is a continuous
projection of the household
representative rates, which were
held constant from 2022 onwards in
the principal projection.
Population projections:
• The West Midlands is the region with the
largest negative difference in population
in the 10-year migration variant, with
38,300 fewer residents compared with
the principal projection by mid-2026.
• London is the region with the largest
positive difference in population in the
10-year migration variant, with 36,200
more residents compared with the
principal projection by mid-2026.
• Liverpool is the local authority with the
largest negative difference in population
in the 10-year migration variant and
Ealing is the local authority with the
largest positive difference in population,
compared with the principal projection by
mid-2026
What will we be looking at next?
Household projections:
• Projecting household representative rates to
2041 results in a large reduction in the projected
number of households.
Variant household
projections for
England: 2016-based
Published: 16 May 2019
Overview
Households with dependent children show the largest
difference to the principal projection under the
migration variants.Projected number of households by household type for the
principal and variant household projections by mid-2041, England

Links
What did we find?
What will we be looking at next?
Public Policy Analysis
April to June 2019
You can either scroll through the whole document or click the buttons to jump to the relevant pages
Home screen
Outputs list
Overview
Published:
[email protected] @RichPereira_ONS
26 June 2019
Click to open our article
Related publications
Small area population
estimates in England and
Wales: mid-2017 and revised
mid-2012 to mid-2016
Population estimates for
the UK, England and
Wales, Scotland and
Northern Ireland: mid-
2018
Population estimates
for mid-2018
The mid-2018 population estimates
provide estimates for the UK,
constituent countries and
administrative geographies. The
release also provides details on the
drivers of population growth for each
country, region and local authority in
the UK.
The mid-2018 release also includes
data that used to make up the
separate “Internal Migration”
publication.
• The population of the UK in mid-2018 was
estimated to be 66,436,000.
• Growth in the last two years (0.6% per year)
was slower than in any year since mid-2004.
• In the year to mid-2018 there were fewer births
(-2%) and more deaths (+3%) than in the last
year, natural change was at its lowest since
2004.
• Small area population estimates for mid-2018 for publication in October 2019. These will
provide details for statistical electoral and health geographies consistent with the mid-year
estimates.
• Providing data for the 2018 based national and subnational projections rounds and sending
data to Eurostat.
• Net International migration in the year to
mid-2018 was 275,000, 6,000 higher than
the average for the past 5 years and
45,000 higher than last year.
UK population continues to grow, but at a slower rate
than any year since 2004
UK, 1953 to 2018
In the 12 months to mid-2018 the UK population
grew by a similar amount to mid-2017, despite the
lowest natural change in 14 yearsUK, 1992 to 2018

Links
What did we find?
What will we be looking at next?
Public Policy Analysis
April to June 2019
You can either scroll through the whole document or click the buttons to jump to the relevant pages
Home screen
Outputs list
Overview
Published:
@dawnsnape
3rd April 2019
Click to open our article
Related publications
Children’s and young
people’s experiences of
loneliness: 2018
Exploring loneliness in
children, Great Britain:
2018
Children’s loneliness
Our analysis looked at associations
between children’s circumstances,
perspectives about their lives and
their reported experiences of
loneliness, using data from The
Children’s Society.
Our findings show that children’s
happiness with friendships and the
amount of choice they have in their
lives are both important. Children
living in relative poverty are also at
greater risk of loneliness, suggesting
both objective circumstances and
subjective feelings matter.
• We are currently reviewing our indicators of children’s wellbeing to make sure they reflect what
matters to children in their lives now as well as capturing important aspects of the future of
childhood. As part of this, we will be consulting with children themselves and with organisations
representing children’s interests.
• We are also considering how best to measure social capital, with a view to providing advice and
guidance on this by the end of the year to encourage greater consistency and comparability
Happiness with relationships with friends has the greatest
impact on reported loneliness in childrenOdds ratios of reporting feeling lonely more often compared with the
reference category, Great Britain, children aged 10 to 15 years
On average, the odds of children
reporting loneliness significantly
increased if:
• they have low happiness with their
friendships
• they have low happiness with the
amount of choice they have
• their parent or guardian doesn’t have
very high life satisfaction
• they live in a city
• their household is in relative poverty
The following are not significant in
children’s reporting of loneliness: age,
gender, ethnicity, number of children in
the household, living in a single parent
household, living away from parents
(such as with another relative).

Links
What did we find?
What will we be looking at next?
Public Policy Analysis
April to June 2019
You can either scroll through the whole document or click the buttons to jump to the relevant pages
Home screen
Outputs list
Published:
[email protected] @richt2
This report compares estimates of
poverty, persistent poverty and
material deprivation in the UK with
the rest of the EU.
This definition of poverty used is at-
risk-of-poverty – living in a
household whose equivalised
disposable income falls below 60%
of the national median.
Persistent poverty is defined as
being at-risk-of-poverty in the current
year and at least two of three
preceding years.
6 June 2019
Click to open our articles
Related publications
Effects of taxes and benefits
on UK household income:
2017/2018
Persistent Poverty in
the UK and EU: 2017
Persistent Poverty
• The UK and the EU have broadly
similar poverty rates
• The UK’s persistent poverty rate is
roughly the same as it was in 2008,
while the EU’s has increased.
• Poverty in the UK is more temporary
compared with other European
Countries, with 46% of people in
poverty were also in persistent poverty
compared to the EU28 average of
67%.
At the end of July, we will publish our flash estimates of household income for 2018/19
• More people exited in-work poverty than stayed in
in-work poverty between 2016 and 2017.
• 44% exited in-work poverty due to increases in
their hourly pay without significant increases in
the hours they worked, while remaining in the
same job
• 33% of individuals cannot afford an unexpected
expense and 24% cannot afford one week annual
holiday
Overview
UK’s persistent poverty rates are relatively stable between
2008 to 2017, while the EU average has increasedPoverty and persistent at risk of poverty from 2008 to 2017 in the UK
and EU28
Click below to explore the transitions between
work status and poverty status, 2016 to 2017

Links
What did we find?
What will we be looking at next?
Public Policy Analysis
April to June 2019
You can either scroll through the whole document or click the buttons to jump to the relevant pages
Home screen
Outputs list
Overview
Published:
[email protected] @ONS
15 May 2019
Click to open our article
Related publications
Personal and economic well-
being in the UK : April 2019
Personal and economic
well-being: what matters
most to our life
satisfaction?
In February 2019, we introduced a
new series on “people and
prosperity” as part of our “Beyond
GDP” initiative, bringing together
personal and economic well-being
for the first time. This release follows
on from this in investigating how a
range of socio-demographic and
economic factors, such as an
individual’s characteristics or
circumstances as well as household
income and spending, may have a
direct impact on people’s personal
well-being.
• Self-reported health, marital status and
economic activity have the strongest
associations with how positively we rate our life
satisfaction.
• People who own their home outright or with a
mortgage rate their life satisfaction more highly
than those living in both private and social
rented housing.
• In terms of household economic
circumstances, higher household spending is
more strongly linked to how we rate our life
satisfaction than higher household income,
though both matter less than personal
circumstances.
• How we spend our money also matters;
comparing people with the same level of
spending, those able to spend a higher share
on experiences, such as hotels and
restaurants, are more likely to be very satisfied
with life than those spending more on food,
insurance and mobile phone subscriptions.
We will continue to provide timely indicators and analysis of household financial health, personal
well-being and optimism about the future as part of our new series on “people and prosperity”. We
also plan to focus more on the environmental aspects of well-being. In doing this, we will move a
step closer to looking holistically at “people, prosperity and the planet”.
What matters most to
our life satisfaction?

Links
What did we find?
What will we be looking at next?
Public Policy Analysis
April to June 2019
You can either scroll through the whole document or click the buttons to jump to the relevant pages
Home screen
Outputs list
Overview
Published:
[email protected] @FionaDaweONS
26 June 2019
Click to open our article
Related publications
UK SDG data site
UK Voluntary
National Review
SDGs VNR
The government published its first
review of UK progress towards the
Sustainable Development Goals
on 26 June. The Voluntary
National Review (VNR) was
launched at Torriano Primary
school in London by the Secretary
of State for International
Development, Rory Stewart.
The Department for International
Development (DFID) has
published the review. The SDGs
Team at ONS played a significant
role in supporting DfID to ensure
that data is central to the UK VNR.
• This first review has involved almost all Government Departments.
• All of the Goals are now reflected throughout the UK government’s
programme of work collectively delivering activity on social, economic, and
environmental issues. Each UK government department has embedded
the Goals in its Single Departmental Plan – an established process to
focus government efforts on important issues.
• The review will be presented by Baroness Sugg to the United Nations, in July.
• In September, the UK Prime Minister will address the United Nations SDG Summit, in new York.
• The UK government has committed to focus on achievement of the SDGs, post-Brexit.
• The SDG team at ONS will be developing the UK SDG data site further. This will involve user
testing – if you want to help, contact them on [email protected]
• The 2030 Agenda is not just for and about government initiatives; it involves many
stakeholders including the private sector, civil society, local communities and individuals.
• As of June 2019, the ONS reports UK data on 180 (74%) indicators of the total 244.
• Of the 180 indicators for which UK data is being reported, over 70% are disaggregated by at
least one variable.
• While the Voluntary National Review identifies many reasons to be proud, it also outlines key
areas where further action is required and the steps being taken, with a clear emphasis on
Leave No One Behind.
VNR Statistical Annex
Links
What was the role of the ONS?
What will we be looking at next?
Public Policy Analysis
April to June 2019
Published:
[email protected] @ONS
28 February 2019
Click to open our article
Related publications
Crime in England and Wales:
year ending December 2018
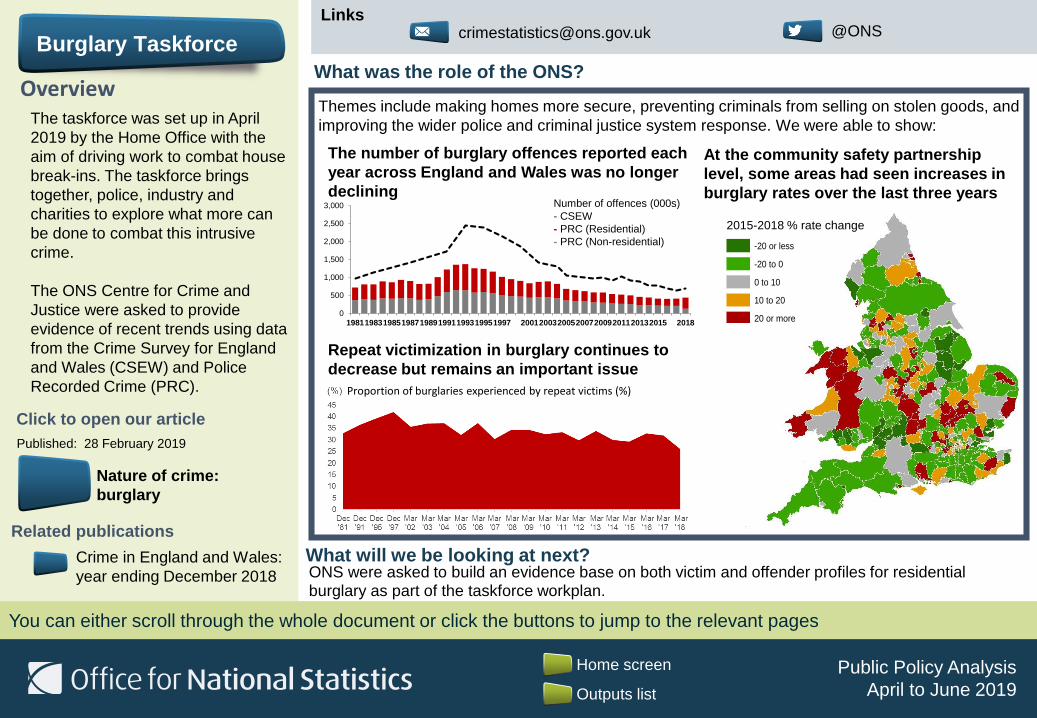
The taskforce was set up in April
2019 by the Home Office with the
aim of driving work to combat house
break-ins. The taskforce brings
together, police, industry and
charities to explore what more can
be done to combat this intrusive
crime.
The ONS Centre for Crime and
Justice were asked to provide
evidence of recent trends using data
from the Crime Survey for England
and Wales (CSEW) and Police
Recorded Crime (PRC).
Themes include making homes more secure, preventing criminals from selling on stolen goods, and
improving the wider police and criminal justice system response. We were able to show:
ONS were asked to build an evidence base on both victim and offender profiles for residential burglary as part of the taskforce workplan.
Nature of crime:
burglary
0
500
1,000
1,500
2,000
2,500
3,000
198119831985198719891991199319951997 20012003200520072009201120132015 2018
The number of burglary offences reported each
year across England and Wales was no longer
declining
At the community safety partnership
level, some areas had seen increases in
burglary rates over the last three years
Repeat victimization in burglary continues to
decrease but remains an important issue
Number of offences (000s)
- CSEW
- PRC (Residential)
- PRC (Non-residential)
Proportion of burglaries experienced by repeat victims (%)
2015-2018 % rate change
Legend
Community_Safety_Partnerships_December_2017_EW_BUC_500
2015-18
-20 or less
-20 to 0
0 to 10
10 to 20
20 or more
You can either scroll through the whole document or click the buttons to jump to the relevant pages
Burglary Taskforce
Overview
Home screen
Outputs list

Links
What did we find?
What will we be looking at next?
Public Policy Analysis
April to June 2019
You can either scroll through the whole document or click the buttons to jump to the relevant pages
Home screen
Outputs list
Published:
[email protected] @ONS
6 June 2019
Click to open our article
High Streets of Great
Britain
High streets
The Office for National Statistics
(ONS) and Ordnance Survey (OS)
have joined together to identify high
streets across Great Britain and to
produce some initial analysis that
investigates a range of data
comparing the recent trends on the
high street with those in non-high
street areas.
This article provides an introduction
to the work, provides some initial
results, and importantly, seeks
feedback to inform the next stages
of the project.
• There are nearly 7,000 high streets in
Great Britain included in the analysis,
defined by a cluster of 15 or more retail
addresses within 150 metres.
• In 2017, around 10.3 million people,
16% of the British population, lived
within 200 metres of a high street.
• High streets have seen higher recent
population growth, compared with non-
high street areas; between 2012 and
2017, high street areas saw a 6%
population growth, compared with 3% in
non-high street areas.
• The number of businesses on the high
street increased by 15% between 2012
and 2017, compared with a 22%
increase in non-high street areas.
Looking ahead, our aims at the ONS and OS include further developing the high street geography
to enable it to be widely used across government as a means for assessing high street topics, and
also to expand on the initial results in this article with further articles to provide more detailed
breakdowns of the data including at more local geographic levels.
OverviewEmployment on the high street in the retail sector
declined in every region and country except for
London, whilst employment in the accommodation and
food sector increased in all regionsChange in employment on high streets by industry, Great Britain,
2012 to 2017

The total value of residential property transactions (unadjusted for inflation) decreased most in London in the year ending December 2018
Links
What did we find?
What will we be looking at next?
Public Policy Analysis
April to June 2019
You can either scroll through the whole document or click the buttons to jump to the relevant pages
Home screen
Outputs list
Published:
[email protected] @ONS
26 June 2019
Click to open our article
Related publications
Housing Affordability in
England and Wales
House price statistics for
small areas in England
and Wales: year ending
December 2018
Small Area House
Prices
The house price statistics for small
areas (HPSSAs) use data from HM
Land Registry to provide statistics
on the price paid and number of
residential property transactions at
the smallest geographic levels.
They are useful when identifying the
change in price for properties sold,
which helps local policy makers
better understand house prices and
the property market in the small
areas to which local housing policy
relates.
• The median price paid for residential properties in Lower layer Super Output Areas in
England and Wales ranged from £25,000 (within Sunderland and County Durham) to £3.9
million (within Kensington and Chelsea)
• Publishing a new annual statistic on the number of transactions for leasehold and freehold
properties
• Publishing statistics on UK House Building, which was formerly published by the Ministry for
Housing, Communities and Local Government
• Transactions of flats and
maisonettes in the year
ending December 2018 fell
10.3% from the previous
year, a larger fall than any
other property type
• The total value of
residential property
transactions (unadjusted
for inflation) decreased
most in London in the year
ending December 2018
• The number of residential property sales recorded by HM Land Registry in England and
Wales fell 5.3% to 856,420 in the year ending December 2018
Overview
Click below to explore the median price paid for all dwellings by Lower
layer Super Output Area, England and Wales, year ending December
2018

Links
What did we find?
What will we be looking at next?
Public Policy Analysis
April to June 2019
You can either scroll through the whole document or click the buttons to jump to the relevant pages
Home screen
Outputs list
Published:
[email protected] @NickStripe_ONS
17 June 2019
Click to open our article
Child and infant mortality
in England and Wales:
2017
Child and infant mortality
This release presented final
statistics on stillbirths, infant deaths
and childhood deaths that occurred
in England and Wales in a calendar
year.
Occurrence figures allow us to
capture late death registrations and
therefore give a more accurate
picture of what happened in any
given year and allow for meaningful
comparisons over time.
We produce two datasets for this
release: Child mortality (death
cohort) tables, and Infant mortality
(birth cohort) tables.
• There were 2,636 infant deaths (aged
under 1 year) that occurred in England
and Wales in 2017, a decrease of
0.6% compared with 2,651 in 2016.
• There were also fewer live births in
England and Wales in 2017 and this
meant the infant mortality rate
increased to 3.9 deaths per 1,000 live
births compared with 3.8 in 2016.
• The infant mortality rate decreased
from 12.0 deaths per 1,000 live births
in 1980 to a record low of 3.6 deaths
per 1,000 live births in 2014; since
then it has increased to 3.9 deaths per
1,000 live births in 2017.
• The stillbirth rate decreased to 4.2 per
1,000 total births in 2017, the lowest
rate on record; in the last decade since
2008 the stillbirth rate has decreased
by 17.6%
This is an annual publication and the next release for child and infant mortality in England and
Wales: 2018 will be published in February/March 2020.
• The infant mortality rate was highest in the most
deprived areas of England at 5.2 deaths per 1,000
live births and lowest in the least deprived areas at
2.7 deaths per 1,000 live births; rates in both areas
have decreased compared with 2008 but the rate in
the most deprived areas has decreased more, by
23.5%.Neonatal and infant mortality rates have generally been
declining since 2008Stillbirth, neonatal and infant mortality rates for England, and Wales,
2008 to 2017
Overview

Links
What did we find?
What will we be looking at next?
Public Policy Analysis
April to June 2019
You can either scroll through the whole document or click the buttons to jump to the relevant pages
Home screen
Outputs list
[email protected] NickStripe_ONS
Click to open our article
Related publications
Cancer registration statistics,
England
Which cancers would
benefit most from
earlier diagnosis?
Cancer Analysis
This article links data from our
Cancer registrations in England and
our Cancer Survival in England
publications.
Within our Cancer Survival in
England publication, for the first
time we were able to produce
robust 5-year net cancer survival
estimates by stage at diagnosis
based on five years’ worth of cancer
diagnoses (2012 to 2016).
• Whilst all cancer patients would
benefit from earlier diagnosis
there are some cancer types
where earlier diagnosis would
be most beneficial
• Colorectal and kidney cancer
patients would see the greatest
increase in their chances of
survival if they were diagnosed
at an earlier stage. This is due
to the fact that overall net-
survival lies between stages 3
and 4.
• This new data helps us
understand more about how
the stage of diagnosis affects
health outcomes and provides
evidence for where health
intervention resources should
be concentrated
Public Health England (PHE) and Office for National Statistics (ONS) work in partnership
to produce cancer survival statistics. A user event is being organised for the autumn to
discover what users require from our statistics and how we can make improvements.
Cancer survival in England
Published: 18 June 2019
Geographic patterns of
cancer survival in England
Index of cancer survival for
CCGs in England
OverviewOverall net-survival for colorectal and kidney cancer falls between
stages 3 and 45- year net-survival, by stage of diagnosis

Links
What did we find?
What will we be looking at next?
Public Policy Analysis
April to June 2019
You can either scroll through the whole document or click the buttons to jump to the relevant pages
Home screen
Outputs list
Published:
[email protected] @ons
27 June 2019
Click to open our article
Related publications
Suicides in the UK
Suicide in Wales
since 1981
Suicide in Wales
The Office for National Statistics
publishes suicide statistics for the
UK. This analysis specifically
focuses on bringing data together to
report on suicide trends in Wales.
This analysis included suicide death
registrations from 1981 to 2017 with
breakdowns by age, sex, suicide
method and deprivation. Also,
suicide risk by occupation analysis
was produced for Wales for the first
time.
We will continue to monitor what evidence gaps we can fill to inform the National Advisory
Group for suicide prevention in Wales.
• Males working in the lowest-skilled occupations
had a 71% higher risk of suicide than the male
national average; for females working in the
lowest-skilled occupations the risk was 57%
higher than the female national average.
Overview• The suicide rate for males has
seen an increase from 2008 to
2010 (16.1 deaths per 100,000
men) to the latest period (20.6
deaths per 100,000 men in
2015-2017); for females the rate
of suicide has remained
relatively stable since the mid-
1990s (5.1 deaths per 100,000
females in 2015 to 2017).
• Males aged 25 to 44 years have
had the highest age-specific
suicide rate since the early
1990s with a rate of 28.3 deaths
per 100,000 in latest period
(2015 to 2017); for females the
highest rate seen for the latest
period was among those aged
45 to 64 years (6.9 per 100,000).
Male suicides in each major occupational group
Deaths registered in Wales 2011 to 2015

Links
What did we find?
What will we be looking at next?
Public Policy Analysis
April to June 2019
You can either scroll through the whole document or click the buttons to jump to the relevant pages
Home screen
Outputs list
Published:
[email protected] @ONS
1 May 2019
Click to open our article
Socioeconomic
inequalities in avoidable
mortality, England and
Wales: 2001 to 2017
This article looks at the
socioeconomic inequalities in
avoidable mortality in England and
Wales from 2001 to 2017. The
analyses use age-standardised
mortality rates by deprivation
decile, sex and broad cause as
well as absolute (slope index of
inequality) and relative (relative
index of inequality) measures of
inequality.
Figures are calculated using death
registration data for England and
Wales held by the Office for
National Statistics (ONS).
We will be exploring life expectancy by cause of death which will include avoidable deaths by
deprivation.
Overview• In 2017, males and females living in the most deprived areas (decile 1) in England were 4.5
and 3.9 times more likely to die from an avoidable cause than those living in the least deprived
areas (decile 10) respectively.
• In Wales, in 2017, males and females living in the most deprived areas were 3.7 and 3.8 times
more likely to die from an avoidable cause than those living in the least deprived areas
respectively.
This chart shows the avoidable rate of death
caused by cardiovascular diseases over time.
• For males in decile 1 there was a large
significant reduction in the rate of death of
135 deaths per 100,000 between 2001-11,
representing a 4.5% annual fall in death
rates.
• In the period 2011-17 a pronounced slow-
down in improvement occurred for decile 1
males reducing to on average 0.9% per
year.
• Females in decile 1 had a similar pattern of change in the trend to males with a strong rate of
improvement of 4.9% per year in the first period followed by an abrupt slowing in the second
period.
• Both males and females in decile 10 had faster rates of improvement to decile 1, but they too
experienced a slowdown in improvement during the period 2011-17.
Inequalities in
avoidable mortality

Links
What did we find?
What will we be looking at next?
Public Policy Analysis
April to June 2019
You can either scroll through the whole document or click the buttons to jump to the relevant pages
Home screen
Outputs list
Published:
[email protected] @ONS @GSS
4 June 2019
Click to open our article
Related publications
Don’t dash off – check out
our Public Service Data
Dashboards!
Public Service Data
Dashboards
Public Service Data
Dashboards
Four dashboards have been
developed which bring together a
range of existing public service data
covering: education, health, criminal
justice and work and pensions.
By bringing spend, input, output and
outcome data together in one place
into an interactive tool, we hope to
enable users, from departments and
HM Treasury through to the public to
have a shared understanding of the
efficiency story.
Education
The number of pupils of primary school age in
England in 2018 has increased by nearly half
a million from 2004 but the number of primary
schools has decreased by around a 1000 over
the same period.
Health Care
Between 2012/13 and 2017/18, total hospital
admissions rose from 13.0m to 14.5m.
Work and Pensions
With an aging population, over two-thirds of
DWP’s claimants were of State Pension age
in 2017-18. Despite retirement age increasing,
the pension caseload has remained stable,
increasing for those aged 70-74.
Criminal Justice
The prison population has decreased by more
than 2,000 people between December 2017
and December 2018 and now stands at
82,236 people.
To continue improving these Beta products, we invite users of the dashboards to provide us with
feedback to inform the next stage of development. We are continuously striving to improve the
quality of these dashboards and would welcome feedback on how they are being used and what
improvements we should consider for future iterations.
Overview

Links
What will we be looking at next?
Public Policy Analysis
April to June 2019
You can either scroll through the whole document or click the buttons to jump to the relevant pages
Home screen
Outputs list
Published:
30 May 2019
Is staff retention an issue
in the public sector?
Activities, spending and
productivity in the Fire and
Rescue Services since
2009
Efficiency short stories
These three short stories are the first
in a series that provides analysis and
insight in the area of public service
efficiency to government and the
inquiring citizen.
The public sector worker story
explored the demographics of public
sector workers. The staff retention
story analysed trends in staff
retention in main public sector
occupations. The fire story described
trends in activities, spending and
productivity in the fire and rescue
service.
We will be exploring both the vacancy rates in the public sector, and flexible working patterns of
public sector workers.
The public sector worker story found
that:
• The public sector has a much higher
proportion of high-skilled jobs than the private sector.
• More women than men work in the
public sector (65% female, 35% male)
• Public and private sectors are split
along fairly similar lines when looking
at the ethnicity of employees
Building on this article, the retention
story showed that one-year retention
rates declined slightly across the
workforce since 2013.
Our analysis of the fire and rescue
service found that the service is smaller,
fire incidents have fallen and there is
evidence of productivity improvement.Published: 4 June 2019
Published: 17 June 2019
Who works in the public
sector?
One-year retention rates in largest public sector occupations, UK, 2012 to
2013 and 2016 to 2017
OverviewWhat did we find?

Links
What did we find?
What will we be looking at next?
Public Policy Analysis
April to June 2019
You can either scroll through the whole document or click the buttons to jump to the relevant pages
Home screen
Outputs list
Published:
[email protected] @StatsAinslie @ONS
5th June 2019
Click to open our article
Related publications
Measuring material footprint
in the UK
Environmental
Accounts
Environmental
Accounts
Released on World Environment Day
and including natural capital
estimates for the first time, the
Environmental Accounts provide UK
time series data on:
• Air emissions and their removal
• Energy use
• Material use
• Revenue from environmental
taxes
• Expenditure by government and
industry on environmental
protection
• The size of the environmental
goods and services sector of the
economy
• While other government departments do publish similar environmental indicators, those presented
here are aligned to the UK National Accounts so can be used comparatively with economic
indicators such as GDP.
• A range of data was released with the Environmental Accounts that were only briefly discussed in
the text of the article. Future articles will seek to examine different aspects of the accounts and
explore comparisons with economic, natural capital and well-being indicators.
Overview• The continued switch away from coal
towards gas and renewable energy resulted
in a fall in UK greenhouse gas (GHG)
emissions in 2017, the continuation of a
long-term trend.
• Households have been the biggest emitter
of GHGs since 2015, accounting for one-
quarter of total UK GHG emissions in 2017.
• Vegetation in the UK removed an estimated
28 million tonnes (CO2 equivalent) of
carbon gases in 2017.
• Households accounted for almost two-fifths
of revenue from environmental taxes in
2016.
• Just over half (56%) of all environmental tax
revenue in 2018 was related to taxes on
petrol, diesel and other fuels used for
transport or heating.
Greenhouse gas emissions from the energy supply
industry continued to fall in 2017Greenhouse gas emissions for the four highest-emitting
industries, including households, UK, 1990 to 2017

Links
What did we find?
What will we be looking at next?
Public Policy Analysis
April to June 2019
You can either scroll through the whole document or click the buttons to jump to the relevant pages
Home screen
Outputs list
Published:
[email protected] @ONS
4 April 2019
Click to open our article
Related publications
Families and Households:
2017
The cost of
living alone
The cost of living
alone
More and more of us in the UK are
living alone. The number of people
living on their own went up by 16%
to 7.7 million between 1997 and
2017, while the UK population
increased by only 13%. By 2039, the
number of one-person households is
projected to rise to 10.7 million
This article compares the
demographics, personal well-being
and financial situation of working
age (25-64 years) one person
households to couple households
without children
• People living on their own spend an average
of 92% of their disposable income, compared
with two-adult households who spend 83% of
theirs.
• For both one person and two adult
households, housing costs are the biggest
expense. Those who live alone spend a
greater proportion of their disposable
household income than two-adult households
on rent, mortgages and other housing costs,
including energy bills, water and Council Tax.
Considering the feasibility of producing this analysis to include households with children and
exploring whether there is a demand for this.
• People who live alone are less likely to own
their own home than couples without
children. Meaning that those who live alone
have less opportunity to accumulate wealth
through buying a home or paying off a
mortgage.
• Of those living alone, 35% say they would
not be able to make ends meet for more
than a month, compared with 14% of
couples without children.
Overview
People living alone spend more on housing costs
than those who live with another adultProportion of household disposable income spent on housing
costs, by household type, UK, financial year ending 2018
Well-being lowest for those who live aloneAverage ratings of personal well-being (out of 10) by
household type for people aged 25 to 64 years, UK, 2017
Public Policy Analysis
April to June 2019
You can either scroll through the whole document or click the buttons to jump to the relevant pages
Links to other releases
Home screen
Outputs list
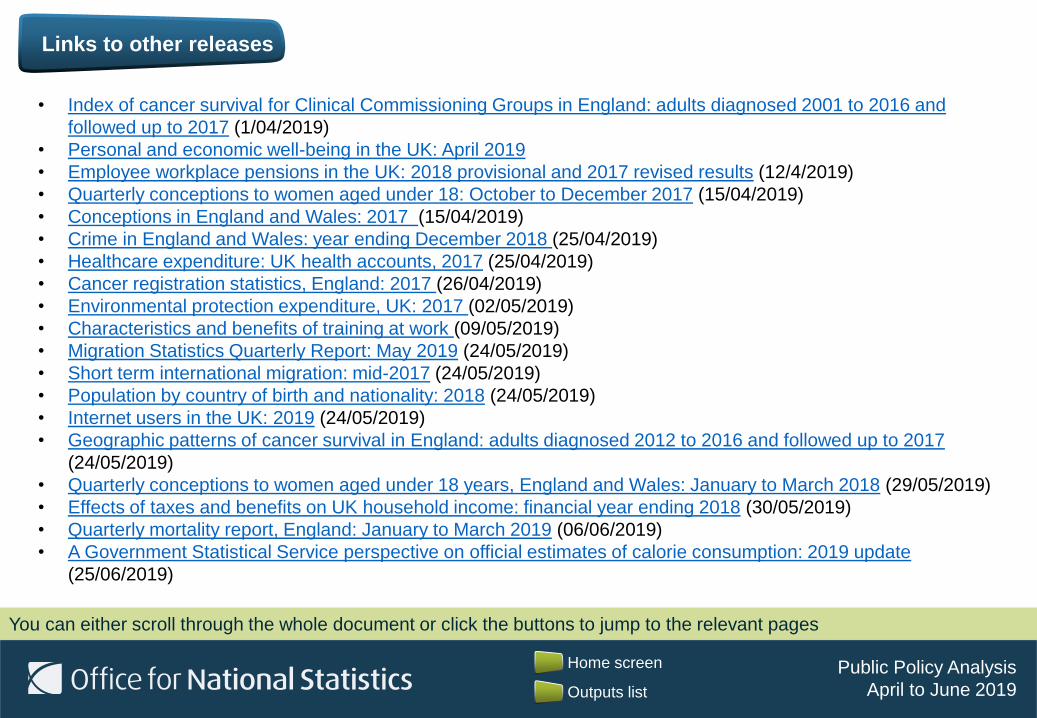
• Index of cancer survival for Clinical Commissioning Groups in England: adults diagnosed 2001 to 2016 and
followed up to 2017 (1/04/2019)
• Personal and economic well-being in the UK: April 2019
• Employee workplace pensions in the UK: 2018 provisional and 2017 revised results (12/4/2019)
• Quarterly conceptions to women aged under 18: October to December 2017 (15/04/2019)
• Conceptions in England and Wales: 2017 (15/04/2019)
• Crime in England and Wales: year ending December 2018 (25/04/2019)
• Healthcare expenditure: UK health accounts, 2017 (25/04/2019)
• Cancer registration statistics, England: 2017 (26/04/2019)
• Environmental protection expenditure, UK: 2017 (02/05/2019)
• Characteristics and benefits of training at work (09/05/2019)
• Migration Statistics Quarterly Report: May 2019 (24/05/2019)
• Short term international migration: mid-2017 (24/05/2019)
• Population by country of birth and nationality: 2018 (24/05/2019)
• Internet users in the UK: 2019 (24/05/2019)
• Geographic patterns of cancer survival in England: adults diagnosed 2012 to 2016 and followed up to 2017
(24/05/2019)
• Quarterly conceptions to women aged under 18 years, England and Wales: January to March 2018 (29/05/2019)
• Effects of taxes and benefits on UK household income: financial year ending 2018 (30/05/2019)
• Quarterly mortality report, England: January to March 2019 (06/06/2019)
• A Government Statistical Service perspective on official estimates of calorie consumption: 2019 update
(25/06/2019)


![ON (DE)HOMOGENIZED GRÖBNER BASESscientificadvances.co.in/admin/img_data/56/images/[5] JANTAA 030320... · 36 HUISHI LI and CANG SU in turn, producing a homogeneous Gröbner basis](https://static.fdocuments.in/doc/165x107/5ae309927f8b9ad47c8dc3dd/on-dehomogenized-grbner-bas-5-jantaa-03032036-huishi-li-and-cang-su-in-turn.jpg)


