Department of Assessment, Curriculum, and Instruction Kahle Charles, Director of Curriculum.

1
IN THE CIRCUIT COURT OF THE 17th
JUDICIAL CIRCUIT, IN AND FOR
BROWARD COUNTY, FLORIDA
CASE NO. 12-028324 (07)
COMPLEX LITIGATION UNIT
P & S ASSOCIATES, GENERAL
PARTNERSHIP and S & P ASSOCIATES,
GENERAL PARTNERSHIP,
Plaintiff,
v.
ROBERTA P. ALVES, ET AL.,
Defendants.
_____________________________________/
CONSERVATOR’S REPLY IN FAVOR OF
MOTION FOR SUMMARY JUDGMENT1
Philip J. von Kahle (the “Conservator”), as Conservator for P&S Associates,
General Partnership (“P&S”) and S&P Associates, General Partnership (“S&P) (together,
the “Partnerships”), by and through undersigned counsel, pursuant to the Conservator
Order (as defined below) hereby files the Conservator’s Reply in Favor of Motion for
Summary Judgment (the “Reply”), and in support thereof states as follows:
Introduction
The Partnerships are Florida general partnerships organized under the Florida
partnerships laws. They were properly formed as an investment vehicle for the individual
partners. Unfortunately, the Partnerships only invested with what turned out to be a
complete fraud, Bernard L. Madoff Investment Securities, LLC (“BLMIS”).
Accordingly, the Partnerships and ultimately, certain of its partners, were victims of the
1 Capitalized terms not defined herein shall have the meaning ascribed them in the May 31, 2013
Conservator’s Motion for Summary Judgment to (i) Approve Determination Claims; (ii) Approve Plan of
Distribution, and (iii) Establish Objection Procedures (the “Distribution Motion”).

2
Madoff Ponzi Scheme. Recently, the Madoff trustee made distributions to victims of the
Madoff Ponzi Scheme, including the Partnerships, based on their Net Investment Method
losses. On or before July 2012, a dispute arose between the partners as to how the
remaining assets of the Partnerships ought to be distributed. This Interpleader Action
was commenced to, among other things, allow the Court to determine the proper
distribution methodology.
To that end, on May 31, 2013, the Conservator filed his: Motion for Summary
Judgment to (i) Approve Determination Claims; (ii) Approve Plan of Distribution, and
(iii) Establish Objection Procedures (the “Distribution Motion”). The Distribution
Motion apprises the Court and Partners of possible distribution methodologies.
Ultimately the Conservator recommended the Net Investment Method based upon,
among other things, the equities surrounding Partnerships and their relationship to the
Madoff Ponzi Scheme. As part of his analysis, the Conservator explained that one
construction of the Partnerships agreements would result in calculations identical to the
Net Investment Method.
Certain parties filed responses to the Distribution Motion. Some support the
Conservator’s recommendations and others favor alternative methods of distributing the
Partnership Property. This Reply includes exhibits and explanations to illustrate how
distribution would flow under these alternative methodologies.
Additionally, certain parties have objected to the Conservator’s recommendation
that certain distributions be withheld until further investigation by the Conservator was
complete. The Conservator has resolved certain of these disputes. Others remain
pending.

3
I. BRIEF STATEMENT OF THE FACTS
The Partnerships were each victims in what has become known as the largest
fraud in human history, the Bernard L. Madoff Investment Securities, LLC (“BLMIS”)
ponzi scheme (the “Ponzi Scheme”).
Each Partnership was formed pursuant to a separate written partnership agreement
dated December 11, 1992. In 1994 the partnership agreements were amended (the
“Partnerships’ Agreements”). The Partnerships’ stated purpose was to invest in “all types
of marketplace securities.” In practice, the Partnerships invested solely in BLMIS.
In late 2008 it was discovered that BLMIS was a ponzi scheme orchestrated by,
among others, Bernard Madoff. Thereafter, a liquidation proceeding was commenced in
the Southern District of New York to liquidate BLMIS pursuant to the Securities
Investment Act (“SIPA”) (the “BLMIS Liquidation”).
The Partnerships asserted claims in the BLMIS liquidation based on its statement
balance losses. The Madoff Trustee objected. The Partnerships and the Madoff Trustee
ultimately settled and the Partnerships were allowed, among other things, claims against
the BLMIS liquidation based on their Net Investment losses.
Based on such Net Investment loss claims, each Partnership received a
distribution. On or before July 2012, a dispute arose between the partners as to how the
remaining assets of the Partnerships ought to be distributed.
To resolve the dispute, in July of 2012, the Partnerships commenced the instant
interpleader action (the “Interpleader Action”).
On January 17, 2013, this Court appointed Philip Von Kahle as Conservator of the
Partnerships in a parallel proceeding2 by entering the Order Appointing Conservator (the
“Conservator Order”). The Conservator Order provides, among other things, that the
Conservator’s powers include:
Winding down of the affairs of the Partnerships and distribution of assets of
the Partnerships, including following up on the Interpleader Action filed
with the Court in determining how the partnership funds are to be
distributed, making all necessary and appropriate applications to the
Court in order to effect such wind-down and distributions.
Conservator Order at 5.(a) (emphasis added).
2 Matthew Carone, et. al. v. Michael D. Sullivan, Case No. 12-24051 (07) (the “Conservator Suit”).

4
To that end, on May 31, 2013 the Conservator filed his Distribution Motion.
II. Partnership Property
The principal sources of Partnerships’ Property are: (i) the claims asserted by the
Partnerships in the BLMIS Liquidation; (ii) funds the Partnerships held in certain bank
accounts prior to the discovery of the Ponzi Scheme; and (iii) claims and causes of action the
Partnerships have against certain individuals, professionals, and entities.
As discussed more fully in the Distribution, at this time, S&P funds available for the
initial interim distribution, net of holdbacks for administrative costs and other claims, is
approximately $3,900,000.00. Likewise, P&S funds available for the initial interim
distribution, net of holdbacks for administrative costs and other claims, is approximately
$1,000,000.00.
III. PARTNER CLAIMS ANALYSIS/CAPITAL ACCOUNT
A. Overview of the Conservator’s Claims Analysis
Based upon the books and records of the Partnerships in the Conservator’s
possession, the Conservator and his professional staff at Michael Moecker and
Associates, Inc. have reviewed and analyzed the Partners’ interests in the Partnerships
and their relative rights in the current assets of the Partnerships’ Property.
To accurately determine each individual Partner’s capital account, the
Conservator and his team were required to recreate each account based on the total cash
contributions made by the Partner and total cash distributions received by the Partner
from the beginning of the Partnerships. Moreover, as the original Partnership records
reflected hundreds and hundreds of transactions accounting for reductions of each
Partner’s capital account for fees and other costs, adjustments were required to determine
each Partner’s true ‘net’ position.

5
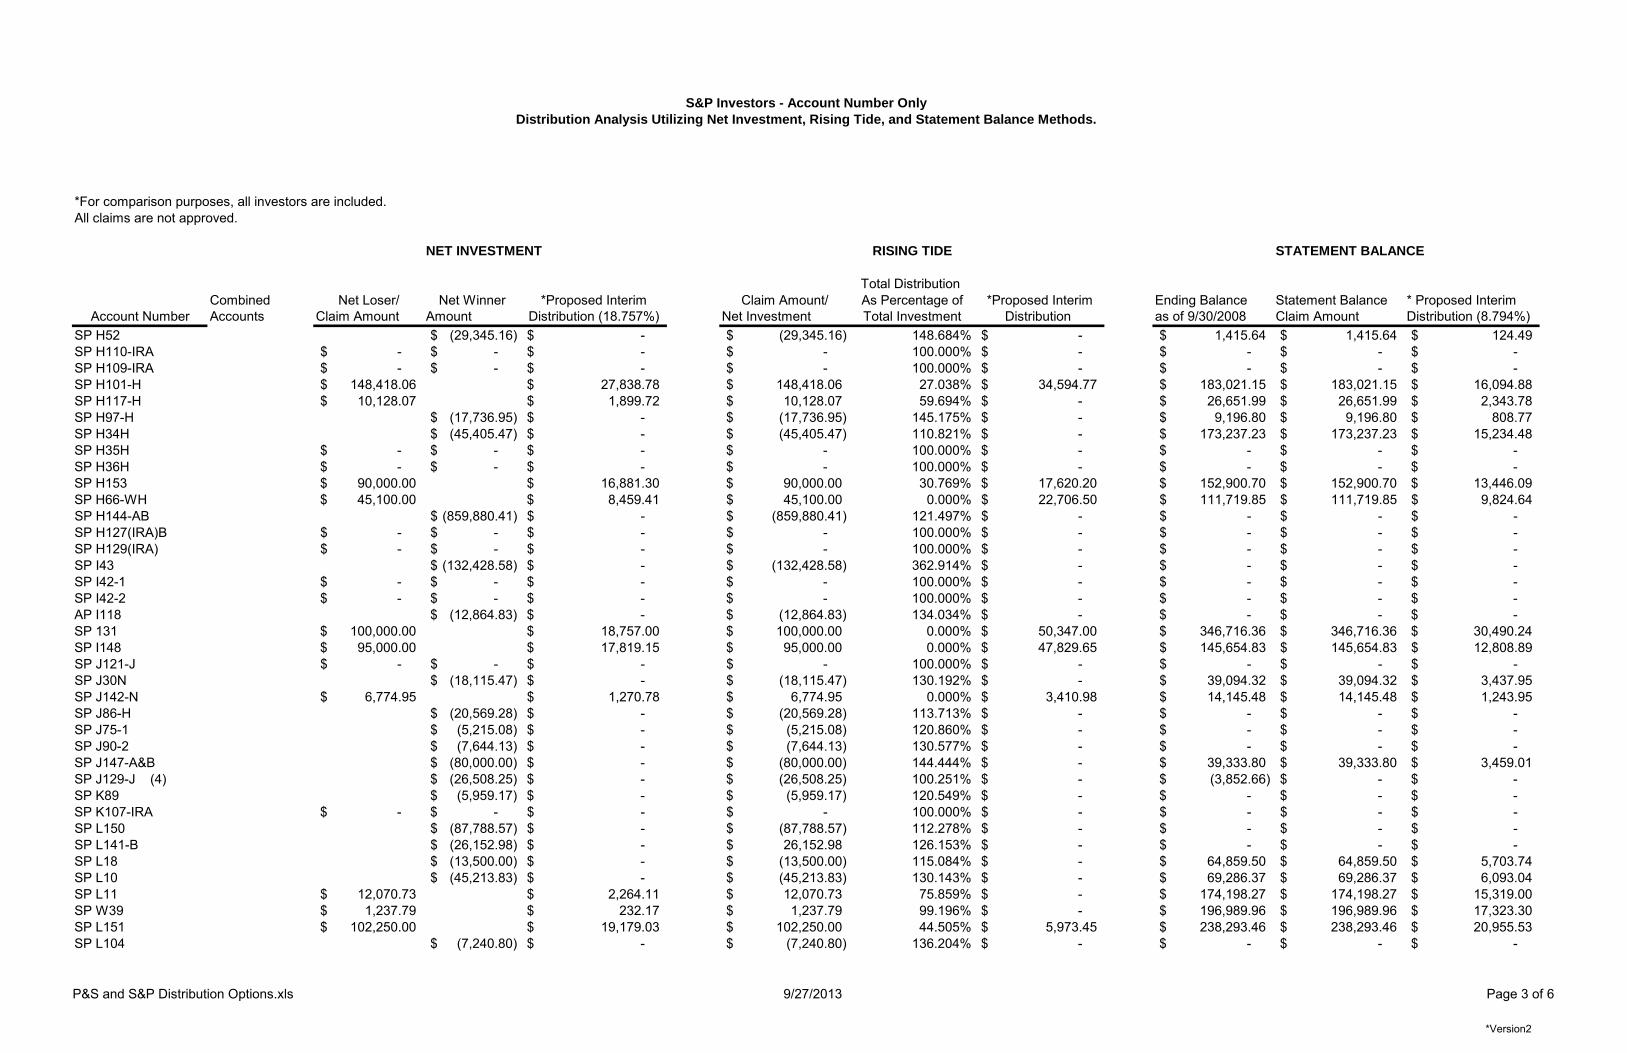
Attached hereto and incorporated by reference herein as Exhibit “A” (P&S) and
Exhibit “B” (S&P) are spreadsheets reflecting the results of the Conservator’s analysis
(the “Spreadsheets”).
Based on the review of the available documents, the Conservator has determined
that the Partners generally fall within one of two classes:
1. The first class of Partners is comprised of Partners who contributed more
cash to the Partnerships than they received distributions from the
Partnerships. On a ‘net’ basis, these Partners – Net Losers – lost at least
some investment dollars that originated outside of the Ponzi Scheme (“Net
Loss”).
2. The second class of Partners is comprised of Partners who received more
distributions from the Partnerships than they made contributions to the
Partnerships. On a ‘net’ basis, these Partners – Net Winners – received
100% of their investment dollars plus at least some amount of money
(‘fictitious profits’) which originated from the Ponzi Scheme (“Net
Winnings”).
To protect the identities of all of the Partners, the Spreadsheets identify Partners
only by Investor Account Number.3 In the Distribution Motion the Conservator provided
spreadsheets demonstrating how Partnerships Property would be distributed pursuant to
the Net Investment Method.4 Certain Partners filed papers which recommended the
3 If you are a Partner and you do not know your Investor Account Number, please contact the attorneys for
the Conservator at the undersigned law firm by calling 954-712-7400. Please have available information to
help confirm your identity. 4 Importantly, the Net Investment Method calculates the Partner’s net position if ‘profits’ are not
considered. The Net Investment Method accurately reflects the application of the Partnerships’
Agreements if the false ‘profits’ are omitted.

6
Rising Tide Method and/or the Last Statement Method.5 Accordingly, the Conservator
attaches Exhibit “A” and “B” Spreadsheets hereto to illustrate how distributions would
occur pursuant to the Net Investment, Rising Tide, and the Last Statement methods.
Each of the Spreadsheets contain: 1) the Partners’ Investor Account Number; 2)
the amount of Net Loss or Net Winnings; 3) a proposed interim distribution amount for
each methodology; and 4) remarks or footnotes with specific information for certain
Partners. Please note, in certain circumstances accounts held by the same investor were
combined (consolidated) to reach a total ‘net’ figure for the particular Partner.6 For
example, if John Doe is a Partner with two accounts: Account #1 which is a Net Winner
of $10,000; and Account #2 which is a Net Loser of $15,000, Account #1 and Account
#2 were consolidated resulting in John Doe being treated as a Net Loser in the
consolidated amount of $5,000.7
B. The Partners’ Positions
P&S Net Losers
Based on the Conservator’s analysis, there are forty-seven (47) P&S Net Losers.
S&P Net Losers
Based on the Conservator’s analysis, there are approximately fifty-seven (57)
S&P Net Losers.
5 Under the Last Statement balance, false profits derived by the ponzi investment are credited to the
Partners accounts. 6 Corporate formalities have been respected such that accounts were not consolidated where an individual
Partner is also the owner of an entity Partner. For Example, John Doe is a Partner with Account #1. John
Doe is also the owner of Company ABC. Company ABC is a Partner with Account #2. Account #1 and
Account #2 were not consolidated. 7 The right of setoff (also called "offset") allows entities that owe each other money to apply their mutual
debts against each other, thereby avoiding "the absurdity of making A pay B when B owes A." Studley v.
Boylston Nat. Bank, 229 U. S. 523, 528 (1913); see also Wiand v. Meeker, 8:10-CV-166-T-EAK, 2013 WL
298335 at *4 (M.D. Fla. Jan. 25, 2013) (noting that set-off is appropriate in certain instances where
investors have multiple accounts).

7
All Net Losers are projected to receive an initial distribution under the Net
Investment and Last Statement Methods. Under the Rising Tide Method 23 of 47 P&S
Net Losers and 21 of 57 S&P Net Losers would be excluded from an initial distribution.
Under Last Statement Balance all of the Net Losers will receive a smaller distribution
than under the Net Investment Method.
Net Winners
Based upon the review of the Partnerships books and records, the Conservator has
identified approximately ninety-seven (97) S&P Net Winners and thirty-one (31) P&S
Net Winners. The Last Statement Method is the only method under which Net Winners
would receive an initial distribution.
IV. Distribution Methods Available to the Conservator
In the Distribution Motion the Conservator identified the following
methodologies for distribution of the Partnership Property:
Equitable Methodologies:
1. Net Investment or Cash-In-Cash-Out-Method
2. Rising Tide Method
Partnership Law Methodologies:
1. Partnership Agreement Method
a. Last Statement Balance Interpretation
b. Pure Partnership Interpretation
2. Statutory General Partnership Law Method
The Distribution Motion provided a detailed description of each method and why
certain courts have advocated in favor of a particular method.

8
Ultimately, the Conservator recommended distribution based upon the Net
Investment Method as this method is equitable and was utilized in the BLMIS
Liquidation from which most of the Partnerships Property originated. In re Bernard L.
Madoff Inv. Sec. LLC, 654 F.3d 229, 238 (2d Cir. 2011). Importantly, a strict
interpretation of the Partnerships Agreements essentially results in the same distribution
as the Net Investment Method. One significant difference is that under the Partnerships
Agreement method, Net Winners would be required to give back their net winning to
share in the losses of the Partnership.
Additionally, the Net Investment Method has been applied by several United
States Circuit Courts as well as Florida Federal Courts. See, e.g., CFTC v. Topworth
Int’l, Ltd., 205 F.3d 1107, 1115-16 (9th Cir. 2000); Focht v. Athens (In re Old Naples
Sec., Inc.), 311 B.R. 607, 616-17 (M.D. Fla. 2002).
In response to the Complaint or the Distribution Motion, approximately 57 parties
have filed pleadings, in support or opposition.8
In summary,9
Takes no
position/
Requests Court
Make
Determination10
Net
Investment
Rising
Tide
Partnership
Agreement/ Last
Statement Balance
Florida
Statute
Total
Responses
31 11 7 Partnership
Agreement
5
Last
Statement
Balance
0 58
8 Recognizing that Partners who support the Conservator’s recommendation were not required to respond.
9 Attached as Exhibit “C” is a spreadsheet reflecting the interested parties’ responses.
10Wayne Horwitz as Trustee for Howard H. and Joyce Living Trust response does not endorse any
particular distribution method (the “Horwitz Objection”). However, he objected to the Distribution Motion
on the basis that the Conservator’s scheduled amount was for less than that parties claim. This may favor a
distribution based upon the last statement balance. The Conservator replies to the Horwitz Objection by
stating that the statement balance includes false profits which ought not be considered if the Court adopts
an Equitable Method. However, in the event that the Court adopts the Last Statement view of the
Partnership Agreements Method then Horwitz Objection would be moot.

9
4
As was the case prior to the commencement of the Interpleader Action, parties
generally selected the distribution method which favored them. Of the Partners who
suggested a method other than Net Invesment, only the Rising Tide and Last Statement
were recommended. Accordingly, the Conservator’s Reply is limited to the virtues and
consequences associated with the Rising Tide and the Last Statement Balance Methods.
1. Rising Tide Method
The Rising Tide Method has steadily gained approval when equitable distribution
of assets is appropriate. S.E.C. v. Huber, 702 F.3d 903, 904 (7th Cir. 2012). Rising Tide
Method attempts to spread losses as evenly as possible across the parties on a percentage
basis. To do so, the Rising Tide Method treats all interim distributions to investors as
‘deemed’ recoveries paid from the hypothetical pool of total assets available for recovery.
“Imagine that three investors lose money in a Ponzi scheme. A invested
$150,000 and withdrew $60,000 before the scheme collapsed, so his net
loss was $90,000. B invested $150,000 but withdrew only $30,000; his net
loss was $120,000. C invested $150,000 and withdrew nothing, so lost
$150,000. Suppose the receiver gets hold of $60,000 in assets of the Ponzi
scheme--one-sixth of the total loss of $360,000 incurred by the three
investors ($90,000 + $120,000 + $150,000). We'll call these recovered
assets ‘receivership assets’…In our example, the total of withdrawn plus
receivership assets is $150,000 ($60,000 + $30,000 + $0 [the withdrawals]
+ $60,000 [the receivership assets]), but there is only the $60,000 in such
assets to distribute. A, having been deemed (as a consequence of the rising
tide approach) to have "recovered" $60,000 before the collapse of the
Ponzi scheme, is entitled to nothing from the receiver, as otherwise the
remaining sum of withdrawals and receivership assets--a total of $90,000
($30,000 in withdrawals, all by B, and $60,000 in receivership assets)--
would be insufficient to bring the remaining investors up to anywhere
near A's level. For remember that under the net loss method each investor
would have received the same fraction of receivership assets as his
fraction of the loss, and thus A would have received $15,000, B $20,000,
and C$25,000. The result, since under the rising tide method withdrawals
are treated as compensation, is that A would have been ‘compensated’ to
the tune of $75,000 ($60,000 withdrawn + $15,000 in receiver

10
assets),B $50,000 ($30,000 + $20,000), and C $25,000 (the balance of
receiver assets, C having had no withdrawals). For the ‘tide’ to
raise B and C as close to A as possible, B has to receive $15,000 in
receiver assets, for a total ‘recovery’ of $45,000, and C the remaining
receiver assets, giving him $45,000 too. The division of withdrawals plus
receiver assets is then 60–45–45, as shown in the next chart, versus 75–
50–25 under the net loss method. A and B, the withdrawers, are thus
disadvantaged in the litigation by the rising tide method compared to the
net loss method; they correspond to the eleven appellants. C, the non-
withdrawer, is advantaged; he corresponds to the investors in Huber's
scheme who had made no withdrawals.”
S.E.C. v. Huber, 702 F.3d 903, 904-906 (7th Cir. 2012)
Like the Net Investment Method, the Rising Tide Method disregards the fictitious
profits inherent in ponzi schemes, only recognizes the actual capital contributions, and
treats all withdrawals as return of capital. Additionally, neither the Net Investment
Method nor Rising Tide Method include any allowance for the time value of money. The
Partnerships were established in December of 1992 and operated until December 2008.
While Partners invested at different times; an investment made at the inception is treated
the same as an investment made at the conclusion under both Equitable Methodologies.
A key distinction in the Rising Tide Method is that not all Net Losers receive a
distribution. In fact, Net Losers only receive a distribution to the extent required to make
all of the Net Loser’s loss percentage the same. This is because the interim distributions
the partners received are treated differently.
Certain Partners who the Conservator recommended withholding their
distributions due to, among other things, their ‘insider’ status favor the Rising Tide
Method. These Partners include:
Burt and Susan Moss, Burt Moss and Associates, Inc., and Burton Harold Moss
IRA (collectively “the Moss Parties”) filed an objection to the Distribution
Motion on June 30, 2013 (the “Moss Objection”);

11
Steven Jacob,11
Guardian Angel Trust, LLC (“Guardian Angel”), and SPJ
Investments, Ltd. (“SPJ”) (collectively the “Insiders”) filed an objection to the
Distribution Motion on July 1, 2013 (the “Jacob Objection”).12
The Rising Tide Method benefits the Insiders. It appears that, the Insiders
received improper fees which would not be viewed as returns of capital under this
method. If approved, the Rising Tide Method would allow these Insiders to receive more
dollars at the expense of other net losers. The Conservator recommends holding back the
proposed interim distribution, or at least the amount of the impermissible commissions
and fees until a trial on the matter or the parties resolve issue.13
Under the circumstances here, under the Rising Tide Method not all Net Losers
would receive a distribution. For example, 23 of 47 P&S Net Losers and 21 of 57 S&P
Net Losers will not receive an initial distribution under the Rising Tide Method.
Accordingly, the Rising Tide Method penalizes certain good faith investors who did not
know of the fraudulent scheme.
2. Actual Capital Account Method v. Last Statement Balance Method
Certain Partners favor Partnership Agreement Method. However, there two
interpretations of the Partnership Agreement Method. The first view provides that the
Partnership Agreement would pro-rata distribution based upon the last statement balance
received from the Partnerships (the “Last Statement Method”). Partners in favor of the
Last Statement interpretation suggest that the Last Statement purportedly reflects each
Partner’s capital account balance. Another view, favored by the Conservator, as reflected
11
The Conservator has not located records which reflect that Steven Jacob (“Jacob”) was a partner in his
individual capacity.
12
Jacob’s Objection ought to be stricken as it is a pro se pleading on behalf of two business entities,
Guardian Angel and SPJ, which must be represented by a Florida licensed attorney. 13
Moss Objection agrees with holding back only the disputed portion. Moss Objection at pp. 4, 6, and 8.
12
in the Distribution Motion is that all Partner’s capital accounts be recalculated pursuant to
the Partnership Agreements to ignore false profits.14
Such method is essentially the Net
Investment Method.15
The Net Investment interpretation of the Partnership Agreements,
among other things, adjusts the Partner’s capital account balances to ignore the false
profits purportedly generated by investing in the Madoff Ponzi and does not require
supplementing the Partnership Agreements with RUPA which would require all Partners
who have negative capital accounts to supply capital.
Last Statement Interpretation of Partnership Agreements
The Partners who suggest that the Partnership Agreements require pro rata
distributions based upon the Last Statement may rely on certain references to the
Partnerships’ books in the Partnerships’ Agreements.
Among the negative features of the Last Statement interpretation of the
Partnership Agreements is the legitimization of the false profits of the Ponzi Scheme.
Such interpretation is contrary to Florida law which presumes that parties to a contract
intend a lawful purpose. Umbel v. Foodtrader.com, Inc., 820 So.2d 372, 375 (Fla. 3rd
Dist. Ct. App. 2002) (“It is true that the law presumes that contracts are created for legal
purposes.”) The Last Statements reflect years of false profits which ‘accumulated’ in a
Partner’s account. By providing pro rata distributions based upon the Last Statements
certain Net Winners will receive a windfall; while Net Losers will receive a reduced
share compared to the Equitable Methods. It is contrary to partnership law that the
Partnerships could be overall Net Losers; while certain Partners who are Net Winners
receive additional funds upon wind down.
14
See Distribution Motion at pp. 26-29. 15
Certain de minimis operating expenses not considered in the Net Investment Method would reduce
Partner’s capital accounts.

13
Moreover, a large portion of the Partnerships’ funds were derived upon the
Partners Net Investment losses as paid by the Trustee. Accordingly, such distributions
ought to be paid fore benefit of those Net Losers whose claims were paid.
Proponents of the Last Statement interpretation argue that the use of this method
protects the ponzi investor’s reasonable reliance on the statements produced by the
company (however fraudulent) and accounts for the time value of money lost as a result
of the investment.
The Net Investment Interpretation of the Partnership Agreements
The Conservator disagrees with the Last Statement interpretation of the
Partnership Agreements. Among other things, the Last Statement fails to account for the
losses suffered by the Partnerships and does not eliminate the false profits.
The Partnerships’ Agreements provide that the partnership interest should be
“adjusted” to include “net profits or losses not previously credited or charged against the
income or capital accounts.” (S&P Partnership Agreement Article 11.01); (P&S
Partnership Agreement Article 11.01). However, here, the Last Statement provided to the
Partners is silent about net losses not previously charged against the income or capital
accounts.
Accordingly, the Partner’s partnership interests must be reduced to reflect the
losses suffered by the Partnerships as a result of their investments in the Ponzi Scheme.
The Internal Revenue Service (“IRS”) has indicated that partners of a general
partnership that directly invested in a ponzi scheme, such as the Partnerships, should treat
these losses as “theft losses”. Revenue Ruling 2009-9. The Partnerships’ Agreement
approach to losses is consistent with the IRS position that theft losses should be passed

14
through to the partners and reflected on the partner’s individual returns. IRS PLR 2009-
0154 (“Partnerships (or entities that may elect to be taxed as partnerships, such as limited
liability companies) that qualify as direct investors may use the safe harbor treatment and
pass the loss through to the indirect investor (partner)”).
Additionally, the partners’ capital accounts should be adjusted to reflect prior
distributions as returns of capital because the sole investment was in the Madoff Ponzi.
Perkins v. Haines, 661 F.3d 623, 627 (11th Cir. 2011) (in ponzi schemes, the general rule
is that defrauded investors may receive returns of their principle investment as being for
‘value’). To the extent a partner received more in distributions than actual contributions
of capital, i.e. Net Winners, these partners will have negative capital accounts.
Partners with negative capital accounts are not entitled to any distribution under
the Partnerships Agreements until all other partners have received 100% of their capital
contributions.
As a final concern, the Partnerships’ Agreements do not explicitly contemplate
Net Winners, i.e., Partners with negative capital accounts at the time of liquidation.
Instead, one must look to the Florida RUPA default rules. Fla. Stat. §620.8103(1).
When a partner has a negative capital account at the time for liquidation, FL
RUPA provides that, “a partner shall contribute to the partnership an amount equal
to any excess of the charges over the credits in the partner’s account.” Fla. Stat. §
620.8807(2).
Accordingly, a partner with a negative capital account, a Net Winner, owes a debt
to the respective partnership and is required to return their capital account to zero upon

15
liquidation by contributing the Partnerships. This result is reflected in Uniform Comment
3 of RUPA § 807 which provides:
Any partner with a negative account balance must contribute to the
partnership an amount equal to the excess of charges over the credits in
the account provided the excess relates to an obligation for which the
partner is personally liable under Section 306. The partners may, however,
agree that a negative account does not reflect a debt to the partnership and
need not be repaid in settling the partners' accounts.
RUPA § 807 Cmt. 3.
In this case, because certain of the Partners (the Net Winners), received more
from the Partnerships than they contributed, they have negative capital accounts.16
Accordingly, the Conservator would contend that even if this Court were to
determine that the Partnerships’ Agreements govern distribution, the Last Statements
should not be used to determine the pro rata distribution. Rather, the Net Investment
accurately reflects the Partners’ capital accounts. Notwithstanding the Conservator’s
view that the Net Investment is correct, the Conservator has included an illustration
within the Spreadsheet to of how distribution would occur under Last Statement.
3. The Court Should Not Enforce the Partnerships Agreements to the Extent They
Further an Illegal Activity
The Partnerships Agreements provide that their purpose was to invest in
securities. However, in practice the Partnerships invested solely with Madoff in an
illegal Ponzi Scheme. “‘W]hen a contract or agreement, express or implied, is tainted
with the vice of such illegality, no alleged right founded upon the contract or agreement
16
Recovery of transfers to the Net Winners is the subject of a related case styled: Margaret Smith as
General Partner of P&S Associates, General Partnership and S&P Associates, General Partnership,
Plaintiffs v. Janet A. Hooker Charitable Trust, et. al., Case No. 12-034121 (21) (the “Net Winners Suit”)
presently pending in the Complex Litigation Division in the Circuit Court of the Seventeenth Judicial
Circuit, in and for Broward County, Florida.

16
can be enforced in a court of justice’” Jupiter Med. Ctr., Inc. v. Visiting Nurse Ass'n of
Florida, Inc., 72 So. 3d 184, 186 (Fla. 4th
Dist. Ct. App. 2011), quoting Schaal v. Race,
135 So.2d 252, 256 (Fla. 2d Dist. Ct. App. 1961). Accordingly, this Court ought not
distribute pursuant to the Last Statement Method as doing so would attempt to legitimize
the illegal Ponzi enterprise which provided false profits to the Partnerships.
V. Disputes Concerning Particular Parties
In the Distribution Motion the Conservator recommended holding back
distributions to certain parties while the Conservator investigated their accounts. These
parties include:
S&P Partners
1. Fox Family Trust
2. Ralph C. Fox, Trustee
3. Guardian Angel, LLC
4. SPJ Limited Investment, LTD
5. Michael or Ann Sullivan
6. Ann Sullivan, with Michael Sullivan as beneficiary
7. James E. Yonge
P&S Partners
1. Vincent T. Kelly
2. Vincent T. Kelly Irrevocable Trust
3. Burt Moss 401K
4. Burt and Susan Moss, TBE
5. Sam and Edith Rosen
6. Rebekah & Richard Wills
The Conservator requested that these parties voluntarily turnover over certain
documents to assist with his investigation.
In response to the Distribution Motion, three objections were filed based upon the
Conservator’s recommendation to reserve and withhold all interim distributions. The
following objections were filed:
1. An affidavit filed by Carol Fox on behalf of Fox Family Trust;

17
2. the Jacob Objection; and
3. the Moss Objection.
Based upon, among other things, a review of documents provided, the
Conservator has determined that his holdback recommendation ought to be withdrawn as
to:
1. Fox Family Trust17
2. James E. Yonge18
Additionally, certain parties agree with the Conservator’s recommendation to
reserve and withhold all interim distributions until further order of the Court. These
parties include:
1. Vincent T. Kelly
2. Vincent T. Kelly Irrevocable Trust
Accordingly, it appears only the Moss Objection and Jacob Objection remain
outstanding.
The Moss Objection
The Moss Objection agrees that the Conservator has correctly computed the
amount of his claim for two his three accounts.19
However, the Moss Objection disagrees
with the Conservator’s recommendation to holdback payments to Moss pending an
investigation of the Moss’ accounts.
The Conservator requested and has since been provided with certain documents
related to the Moss’ accounts. Based upon, among other things, the review of these
documents the Conservator has determined that a deposition of Burt and Susan Moss is
17
The Fox Family Trust provided documentation which reflects that the person who received commissions
and fees would not receive a distribution from the Partnerships. 18
The Conservator has completed his investigation of Yonge and believes distribution to same is
appropriate. 19
One of Moss’ “accounts” was not directly invested with either of the Partnerships. Rather, it was a
purportedly a limited partner in SPJ which in turn invested in the Partnerships.

18
appropriate. Accordingly, the Conservator recommends that the Court reserve, but
withhold interim distributions to the Moss Parties as noted in the Distribution Motion. If
the Court determines that a complete holdback is inappropriate, the Conservator
recommends holding back the amount of the impermissible commissions and fees as part
of the initial distribution until a trial on the matter or the parties resolve issue.20
Jacob Objection on behalf of Guardian Angel and SPJ
Initially, the Conservator notes that Jacob’s Objection is improper and untimely.
This Court’s Third Order Resetting Deadlines and Case Management Conference
provided that interested parties had until June, 30, 2013 to file a response to the
Conservator’s Distribution Motion. Jacob received notice of the deadline. Accordingly,
this Court ought not consider Jacob’s Objection as it was filed on July 1, 2013 and is
therefore untimely.
Additionally, the Jacob Objection is a pro se filing purportedly on behalf of
Guardian Angel and SPJ. Such action is impermissible under Florida law. Florida law
requires business entities to be represented by attorneys. Szteinbaum v. Kaes Inversiones
y Valores, C.A., 476 So. 2d 247, 248 (Fla. 3d Dist. Ct. App. 1985) (“It is well recognized
that a corporation, unlike a natural person, cannot represent itself and cannot appear in a
court of law without an attorney.”) Jacob, as a non-attorney, is not authorized to
represent entities before this Court. James D. Pauls, Ltd. v. Pauls, 633 F. Supp. 34, 35
(S.D. Fla. 1986) (Standing for the proposition that general partner, who is not a licensed
attorney, may not represent a limited partnership in a pro se lawsuit).
20
Moss Objection does not dispute holding back only the disputed portion. Moss Objection at pp. 4, 6, and
8.

19
Further, Jacob Objection attempts to create a factual dispute where non-exist.
Jacob Objection states that “[t]he Plaintiffs are not a Ponzi Scheme…A Ponzi Scheme is
not a Ponzi scheme just because the Conservator calls it a Ponzi scheme.” However, the
Distribution Motion does not provide that the Partnerships are ponzi schemes. Rather,
the Distribution Motion reflects that the Partnerships invested exclusively in a Ponzi
Scheme and therefore this Court ought to consider equitable methods utilized in cases
where the funds were derived from a Ponzi scheme.
In the event that this Court considers the Jacob’s Objection, the Conservator
replies as follows.
Guardian Angel
Guardian Angel appears on the books and records of S&P as a Partner.
Based upon, among other things, the Conservator’s review of the available books
and records of the Partnerships, it appears that certain Partners were unknowingly
transferred from being partners in one of the Partnerships to being partners of Guardian
Angel Trust, LLC (“Guardian Angel”). In fact, certain partners of Guardian Angel have
contacted the Conservator in writing and have requested that he oversee the distribution
to the partners of Guardian Angel.
Guardian Angel appears to be an entity formed by the insiders of the Partnerships
and still appears to be controlled by insiders of the Partnerships.
The Conservator requested certain information from the purported general
manager of Guardian Angel, Jacob (“Jacob”). Initially, Jacob refused to turnover the
requested information.

20
The Conservator obtained an Order compelling Jacob to turnover information
related to the Guardian Angel. Jacob turned over certain documents related to Guardian
Angel and the Conservator has reviewed the same.
Based upon, among other things, the Conservator’s review of certain documents
the Conservator recommends reserving but withholding all proposed distributions to
Guardian Angel. Among other things, the records reflect that Jacob received
approximately $800,000.00 in the form of improper fees. Accordingly, the Court ought
not require the Conservator to turnover Partnerships funds to the defendants of the Insider
Suit.
In the event that this Court determines that a complete holdback is not
appropriate, the Conservator recommends distributing directly to any members of
Guardian Angel who are not also not defendants in the Insider Suit. Further, the
Conservators recommends that the same distribution methodology applied to the Partners
of the Partnerships also be applied to the partners of Guardian Angel. Jacob appears to
agree with this view. Jacob Objection at p. 6.
SPJ Limited Investments, Ltd.
SPJ Limited Investments, Ltd. (“SPJ”) appears on the books and records of S&P
as a Partner. It appears that SPJ was formed by insiders of the Partnerships to create a
conduit for self-directed IRA monies (“IRA Investors”) to be invested in the Partnerships.
Like Guardian Angel, SPJ still appears to be controlled by insiders of the
Partnerships and Jacob purports to be one of its managing general partners.
Like Guardian Angel, certain partners of SPJ have contacted the Conservator in
writing and have requested that he oversee the distribution to the partners of SPJ.

21
According to Jacob, the IRA Investors were required to go through a qualified
custodian to invest in SPJ (a “Custodian”).
As of this date, Jacob has failed to identify a Custodian. Jacob Objection reflects
that certain of these accounts likely do not have Custodians.
Accordingly, the Conservator recommends reserving but withholding all proposed
distributions to Guardian Angel until a Custodian is in place to receive the distribution or
until an alternative method of distributions is authorized. If this Court does not deem a
complete holdback appropriate the Conservator recommends providing each partner of
SPJ of notice of the forthcoming distribution and distribute it to each partner of SPJ, who
is not a defendant in the Insider Suit, directly so as to bypass interference by insiders. In
such a case, the Conservator recommends sending letters to each partner of SPJ and
requesting that they respond to the Conservator within 60 days (i) the name of the
Custodian they wish to receive the funds; or (ii) a request to receive the distribution
directly with a 1099.21
In the event the Conservator is unable to locate a partner in SPJ,
the Conservator recommends distributing the funds to an independent Custodian until the
partner can be located.
VI. Improper Defenses
Additionally certain parties,22
asserted the defense that the Third Amended
Complaint fails to state a cause of action for relief. The Conservator has moved to strike
such defense. Another party, Mildred Richardson (“Richardson”) has filed a motion to
21
Jacob agrees with this approach. Jacob Objection at p. 6. 22
These parties include Robert A. Uchin Revocable Trust (“Uchin”), Kathleen G. Walsh, James R.
(deceased) & Kathleen Walsh, Margaret B. Gwinn Trust, Walsh Family Trust #1, Walsh Family Trust #2,
Walsh Family Trust #3, Robert G. Walsh Family Trust #1, Robert G. Walsh Family Trust #2, Robert G.
Walsh Family Trust #3, Robert G. Walsh Family Trust #4 (collectively, the “Walsh Family Claimants”),
Dalores Barone, Carl Boschetti, Annette Boschetti, and Denise Bryan (Collectively, the “Boschetti
Defendants”), Sam and Edith Rosen (“Rosen Defendants”).
22
dismiss on the basis that this Court lacks personal jurisdiction over her. However, as a
Partner of the Partnerships which as Florida general partnerships she subject to this
Court’s personal jurisdiction.
WHEREFORE, the Conservator respectfully requests that this Court enter an Order:
(i) Approving the Conservator’s determination of Allowed Claims as set forth in herein and in
attached as Exhibits “A” and “B” to the Distribution Motion; (ii) Approving the Net
Investment Method as set forth herein and attached as Exhibits “A” and “B” to the
Distribution Motion as the proper method for determining the Partners’ Allowed Claims; (iii)
Approving the amount of initial distributions to Net Losers as proposed herein and pursuant to
Exhibits “A” and “B” attached to the Distribution Motion; (iv) Approving withholding
distributions to certain Partners as proposed herein and identified in Exhibits “A” and “B”;
(v) Authorizing the Conservator to make the interim distributions to the Partners as proposed
herein pursuant to Exhibits “A” and “B” attached to the Distribution Motionwithin a
reasonable time of the entry of an Final Non-Appealable Order granting this Distribution
Motion; and (vi) (vii) for any further relief that this Court deems necessary and appropriate.
Dated: September 30, 2013
MESSANA, P.A.
Attorneys for Conservator
401 East Las Olas Boulevard, Suite 1400
Ft. Lauderdale, FL 33301
Telephone: (954) 712-7400
Facsimile: (954) 712-7401
By: /s/ Thomas M. Messana
Thomas M. Messana, Esq.
Florida Bar No. 991422
Brett D. Lieberman, Esq.
Florida Bar No. 69583
Thomas Zeichman
Florida Bar No. 99239

23
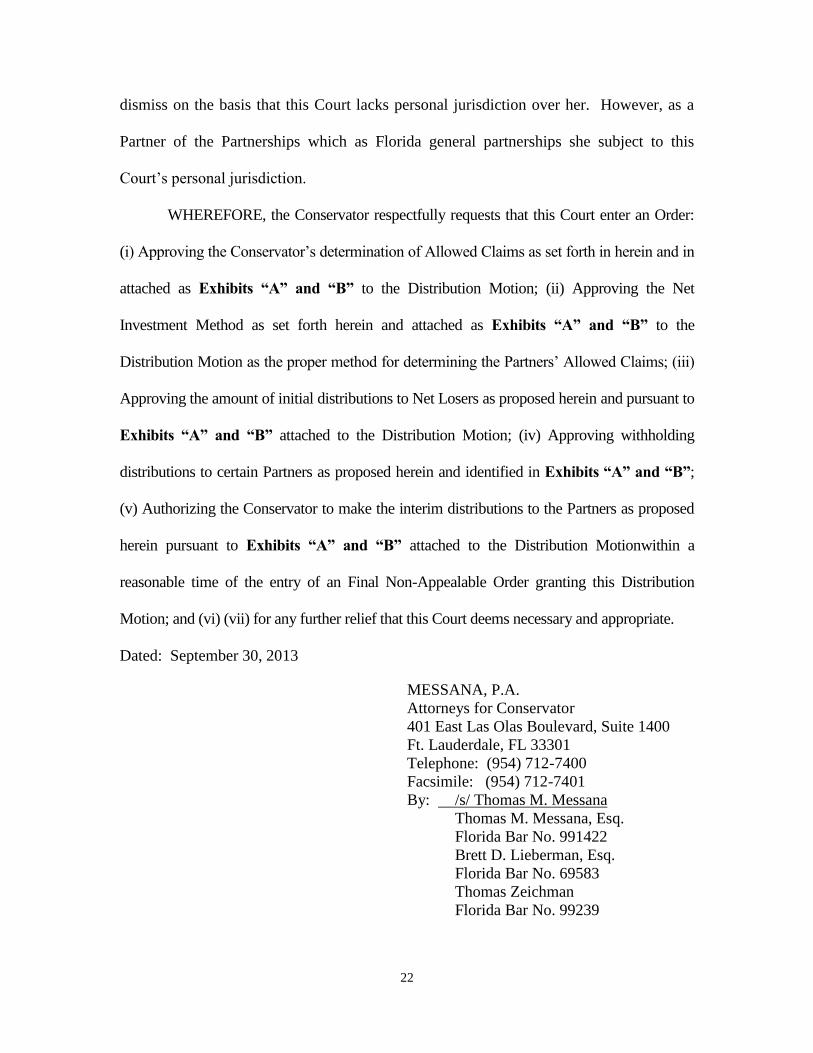
Exhibit “A”
P&S Spreadsheet Without Names
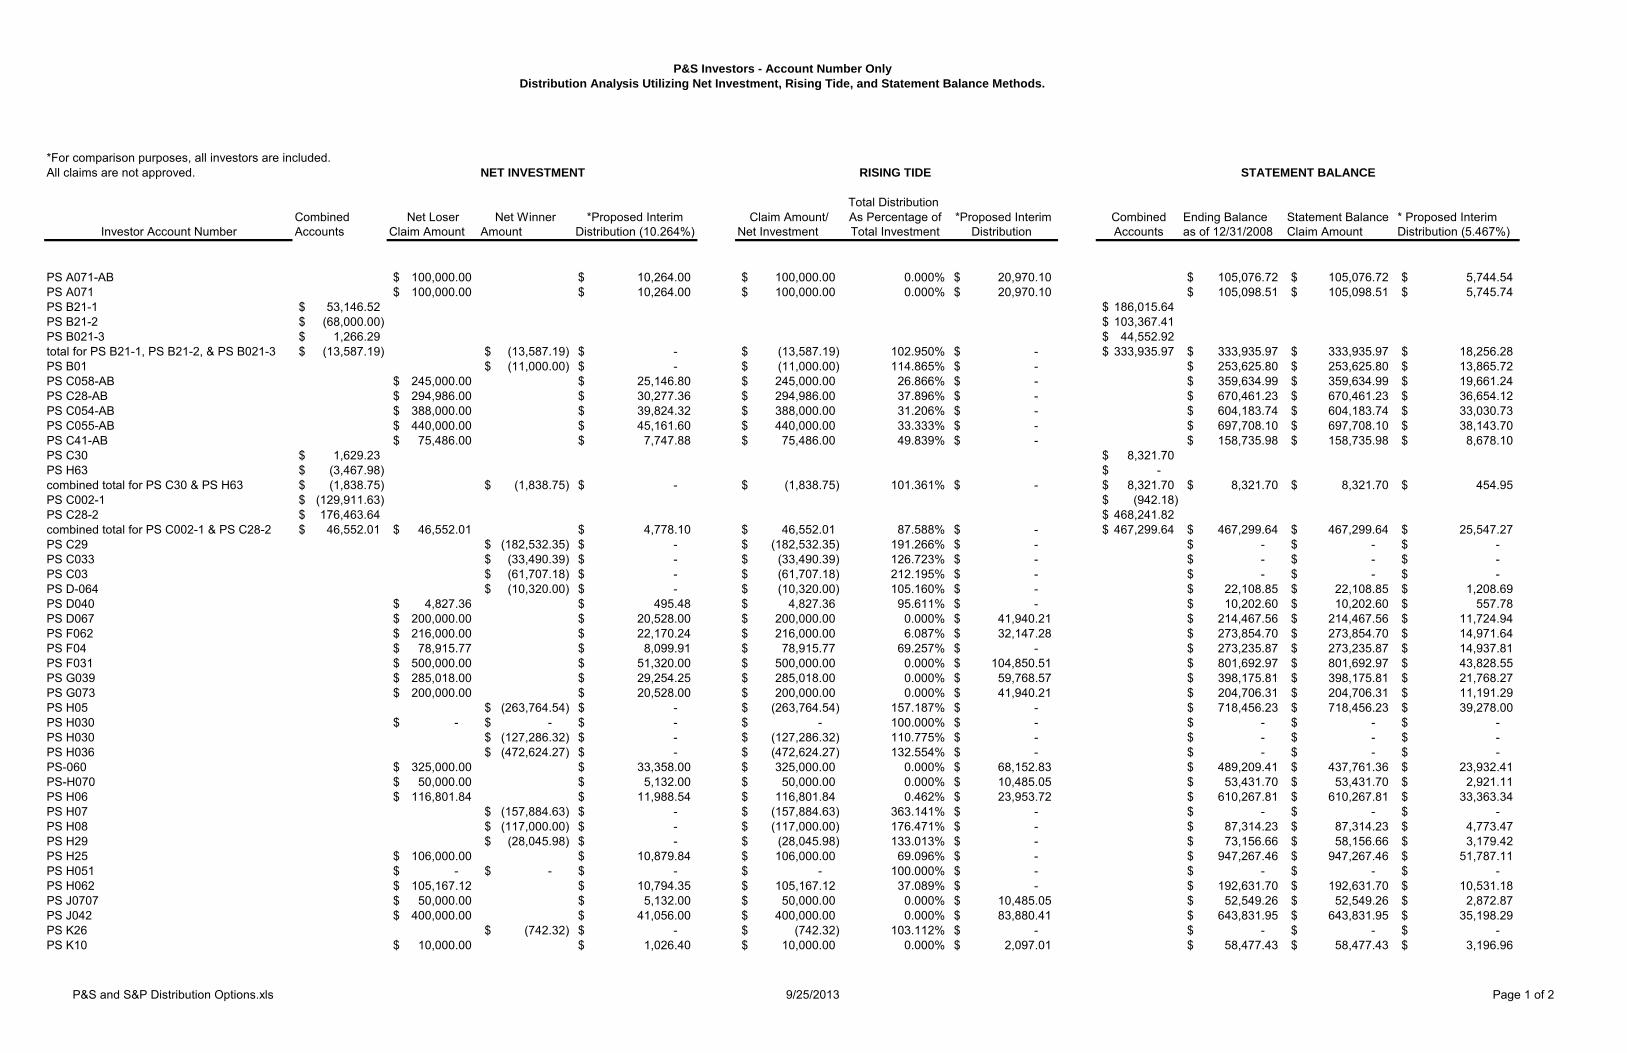
P&S and S&P Distribution Options.xls 9/25/2013 Page 1 of 2
*For comparison purposes, all investors are included.
All claims are not approved. NET INVESTMENT RISING TIDE
Total Distribution
Combined Net Loser Net Winner *Proposed Interim Claim Amount/ As Percentage of *Proposed Interim Combined Ending Balance Statement Balance * Proposed Interim
Investor Account Number Accounts Claim Amount Amount Distribution (10.264%) Net Investment Total Investment Distribution Accounts as of 12/31/2008 Claim Amount Distribution (5.467%)
PS A071-AB 100,000.00$ 10,264.00$ 100,000.00$ 0.000% 20,970.10$ 105,076.72$ 105,076.72$ 5,744.54$
PS A071 100,000.00$ 10,264.00$ 100,000.00$ 0.000% 20,970.10$ 105,098.51$ 105,098.51$ 5,745.74$
PS B21-1 53,146.52$ 186,015.64$
PS B21-2 (68,000.00)$ 103,367.41$
PS B021-3 1,266.29$ 44,552.92$
total for PS B21-1, PS B21-2, & PS B021-3 (13,587.19)$ (13,587.19)$ -$ (13,587.19)$ 102.950% -$ 333,935.97$ 333,935.97$ 333,935.97$ 18,256.28$
PS B01 (11,000.00)$ -$ (11,000.00)$ 114.865% -$ 253,625.80$ 253,625.80$ 13,865.72$
PS C058-AB 245,000.00$ 25,146.80$ 245,000.00$ 26.866% -$ 359,634.99$ 359,634.99$ 19,661.24$
PS C28-AB 294,986.00$ 30,277.36$ 294,986.00$ 37.896% -$ 670,461.23$ 670,461.23$ 36,654.12$
PS C054-AB 388,000.00$ 39,824.32$ 388,000.00$ 31.206% -$ 604,183.74$ 604,183.74$ 33,030.73$
PS C055-AB 440,000.00$ 45,161.60$ 440,000.00$ 33.333% -$ 697,708.10$ 697,708.10$ 38,143.70$
PS C41-AB 75,486.00$ 7,747.88$ 75,486.00$ 49.839% -$ 158,735.98$ 158,735.98$ 8,678.10$
PS C30 1,629.23$ 8,321.70$
PS H63 (3,467.98)$ -$
combined total for PS C30 & PS H63 (1,838.75)$ (1,838.75)$ -$ (1,838.75)$ 101.361% -$ 8,321.70$ 8,321.70$ 8,321.70$ 454.95$
PS C002-1 (129,911.63)$ (942.18)$
PS C28-2 176,463.64$ 468,241.82$
combined total for PS C002-1 & PS C28-2 46,552.01$ 46,552.01$ 4,778.10$ 46,552.01$ 87.588% -$ 467,299.64$ 467,299.64$ 467,299.64$ 25,547.27$
PS C29 (182,532.35)$ -$ (182,532.35)$ 191.266% -$ -$ -$ -$
PS C033 (33,490.39)$ -$ (33,490.39)$ 126.723% -$ -$ -$ -$
PS C03 (61,707.18)$ -$ (61,707.18)$ 212.195% -$ -$ -$ -$
PS D-064 (10,320.00)$ -$ (10,320.00)$ 105.160% -$ 22,108.85$ 22,108.85$ 1,208.69$
PS D040 4,827.36$ 495.48$ 4,827.36$ 95.611% -$ 10,202.60$ 10,202.60$ 557.78$
PS D067 200,000.00$ 20,528.00$ 200,000.00$ 0.000% 41,940.21$ 214,467.56$ 214,467.56$ 11,724.94$
PS F062 216,000.00$ 22,170.24$ 216,000.00$ 6.087% 32,147.28$ 273,854.70$ 273,854.70$ 14,971.64$
PS F04 78,915.77$ 8,099.91$ 78,915.77$ 69.257% -$ 273,235.87$ 273,235.87$ 14,937.81$
PS F031 500,000.00$ 51,320.00$ 500,000.00$ 0.000% 104,850.51$ 801,692.97$ 801,692.97$ 43,828.55$
PS G039 285,018.00$ 29,254.25$ 285,018.00$ 0.000% 59,768.57$ 398,175.81$ 398,175.81$ 21,768.27$
PS G073 200,000.00$ 20,528.00$ 200,000.00$ 0.000% 41,940.21$ 204,706.31$ 204,706.31$ 11,191.29$
PS H05 (263,764.54)$ -$ (263,764.54)$ 157.187% -$ 718,456.23$ 718,456.23$ 39,278.00$
PS H030 -$ -$ -$ -$ 100.000% -$ -$ -$ -$
PS H030 (127,286.32)$ -$ (127,286.32)$ 110.775% -$ -$ -$ -$
PS H036 (472,624.27)$ -$ (472,624.27)$ 132.554% -$ -$ -$ -$
PS-060 325,000.00$ 33,358.00$ 325,000.00$ 0.000% 68,152.83$ 489,209.41$ 437,761.36$ 23,932.41$
PS-H070 50,000.00$ 5,132.00$ 50,000.00$ 0.000% 10,485.05$ 53,431.70$ 53,431.70$ 2,921.11$
PS H06 116,801.84$ 11,988.54$ 116,801.84$ 0.462% 23,953.72$ 610,267.81$ 610,267.81$ 33,363.34$
PS H07 (157,884.63)$ -$ (157,884.63)$ 363.141% -$ -$ -$ -$
PS H08 (117,000.00)$ -$ (117,000.00)$ 176.471% -$ 87,314.23$ 87,314.23$ 4,773.47$
PS H29 (28,045.98)$ -$ (28,045.98)$ 133.013% -$ 73,156.66$ 58,156.66$ 3,179.42$
PS H25 106,000.00$ 10,879.84$ 106,000.00$ 69.096% -$ 947,267.46$ 947,267.46$ 51,787.11$
PS H051 -$ -$ -$ -$ 100.000% -$ -$ -$ -$
PS H062 105,167.12$ 10,794.35$ 105,167.12$ 37.089% -$ 192,631.70$ 192,631.70$ 10,531.18$
PS J0707 50,000.00$ 5,132.00$ 50,000.00$ 0.000% 10,485.05$ 52,549.26$ 52,549.26$ 2,872.87$
PS J042 400,000.00$ 41,056.00$ 400,000.00$ 0.000% 83,880.41$ 643,831.95$ 643,831.95$ 35,198.29$
PS K26 (742.32)$ -$ (742.32)$ 103.112% -$ -$ -$ -$
PS K10 10,000.00$ 1,026.40$ 10,000.00$ 0.000% 2,097.01$ 58,477.43$ 58,477.43$ 3,196.96$
STATEMENT BALANCE
P&S Investors - Account Number Only
Distribution Analysis Utilizing Net Investment, Rising Tide, and Statement Balance Methods.

P&S and S&P Distribution Options.xls 9/25/2013 Page 2 of 2
*For comparison purposes, all investors are included.
All claims are not approved. NET INVESTMENT RISING TIDE
Total Distribution
Combined Net Loser Net Winner *Proposed Interim Claim Amount/ As Percentage of *Proposed Interim Combined Ending Balance Statement Balance * Proposed Interim
Investor Account Number Accounts Claim Amount Amount Distribution (10.264%) Net Investment Total Investment Distribution Accounts as of 12/31/2008 Claim Amount Distribution (5.467%)
STATEMENT BALANCE
P&S Investors - Account Number Only
Distribution Analysis Utilizing Net Investment, Rising Tide, and Statement Balance Methods.
PS K11 30,000.00$ 3,079.20$ 30,000.00$ 0.000% 6,291.03$ 175,478.22$ 175,478.22$ 9,593.39$
PS k029-K-1 -$ -$ -$ -$ 100.000% -$ -$ -$ -$
PS K034-K-2 (40,463.20)$ -$ (40,463.20)$ 141.329% -$ -$ -$ -$
PS K035 270,000.00$ 27,712.80$ 270,000.00$ 41.304% -$ 527,625.70$ 527,625.70$ 28,845.30$
PS K09 (6,172.48)$ -$ (6,172.48)$ 147.481% -$ -$ -$ -$
PS L24 (6,659.81)$ -$ (6,659.81)$ 113.320% -$ -$ -$ -$
PS L037 41,127.45$ 4,221.32$ 41,127.45$ 40.395% -$ 76,598.78$ 76,598.78$ 4,187.66$
PS L-49-R 574,697.83$ 58,986.99$ 574,697.83$ 12.219% 53,142.31$ 757,176.09$ 757,176.09$ 41,394.82$
PS W059 (2,058.41)$ -$ (2,058.41)$ 129.406% -$ -$ -$ -$
PS M12 (5,846.41)$ -$ (5,846.41)$ 119.414% -$ -$ -$ -$
PS M13 (52,427.58)$ -$ (52,427.58)$ 169.257% -$ -$ -$ -$
PS M14 (116,943.03)$ -$ (116,943.03)$ 193.033% -$ -$ -$ -$
PS M16 (68,514.07)$ -$ (68,514.07)$ 146.293% -$ -$ -$ -$
PS M15 125,000.00$ 12,830.00$ 125,000.00$ 0.000% 26,212.63$ 450,635.81$ 450,635.81$ 24,636.26$
PS M67 483,101.28$ 49,585.52$ 483,101.28$ 0.000% 101,306.83$ 521,381.33$ 521,381.33$ 28,503.92$
PS M52 1,183,000.00$ 121,423.12$ 1,183,000.00$ 4.055% 200,104.45$ 1,436,413.49$ 1,436,413.49$ 78,528.73$
PS N30 76224.09 7,823.64$ 76,224.09$ 63.354% -$ 154,997.09$ 154,997.09$ 8,473.69$
PS N17-N (79,357.00)$ -$ (79,357.00)$ 189.165% -$ 66,200.05$ 66,200.05$ 3,619.16$
PS O18 (16,143.93)$ -$ (16,143.93)$ 139.589% -$ -$ -$ -$
PS K033 (1,948,756.02)$ -$ (1,948,756.02)$ 124.359% -$ -$ -$ -$
PS P038 459,517.09$ 47,164.83$ 459,517.09$ 27.236% -$ 794,837.43$ 794,837.43$ 43,453.76$
PS 053 132,000.00$ 13,548.48$ 132,000.00$ 12.000% 12,495.12$ 204,235.89$ 204,235.89$ 11,165.58$
PS 066 446,000.00$ 45,777.44$ 446,000.00$ 10.800% 47,570.36$ 516,775.00$ 516,775.00$ 28,252.09$
PS P27 210,000.00$ 21,554.40$ 210,000.00$ 10.638% 22,738.80$ 220,868.86$ 272,316.91$ 14,887.57$
PS P26 (20,629.68)$ -$ (20,629.68)$ 142.979% -$ -$ -$ -$
PS R19-R 182,181.82$ 18,699.14$ 182,181.82$ 67.351% -$ 414,553.94$ 414,553.94$ 22,663.66$
PS S028 65,993.00$ 6,773.52$ 65,993.00$ 70.670% -$ 181,993.77$ 181,993.77$ 9,949.60$
PS S27 31,560.97$ 3,239.42$ 31,560.97$ 24.061% -$ 134,639.03$ 134,639.03$ 7,360.72$
PS 068 30,000.00$ 3,079.20$ 30,000.00$ 0.000% 6,291.03$ 32,170.13$ 32,170.13$ 1,758.74$
PS S22 (2,600.18)$ -$ (1,460.31)$ 228.112% -$ -$ -$ -$
PS U50 (92,946.21)$ -$ (92,946.21)$ 137.178% -$ -$ -$ -$
PS W032-B 397,151.00$ 40,763.58$ 397,151.00$ 32.914% -$ 651,184.69$ 651,184.69$ 35,600.27$
PS W43 (4,000.00)$ -$ (4,000.00)$ 116.000% -$ 3,819.22$ 3,819.22$ 208.80$
PS W060 32,500.00$ 3,335.80$ 32,500.00$ 30.704% -$ 40,705.44$ 40,705.44$ 2,225.37$
PS W44 5,000.00$ 513.20$ 5,000.00$ 80.000% -$ 18,404.53$ 18,404.53$ 1,006.18$
PS W45 21,000.00$ 2,155.44$ 21,000.00$ 16.000% 1,147.86$ 35,094.78$ 35,094.78$ 1,918.63$
PS W48 3,951.31$ 405.56$ 3,951.31$ 93.683% -$ 23,892.40$ 23,892.40$ 1,306.20$
PS W23 (12,661.52)$ -$ (12,661.52)$ 115.883% -$ -$ -$ -$
PS W056 5,000.00$ 513.20$ 5,000.00$ 0.000% 1,048.51$ 7,445.54$ 7,445.54$ 407.05$
PS S065 22,800.00$ 2,340.19$ 22,800.00$ 34.857% -$ 26,724.79$ 26,724.79$ 1,461.04$
PS W067 (13,700.00)$ -$ (13,700.00)$ 106.116% -$ 402.53$ 402.53$ 22.01$
PS Z058-AB 578,000.00$ 59,325.92$ 578,000.00$ 42.200% -$ 942,559.89$ 942,559.89$ 51,529.75$
Totals 9,743,559.94$ 1,000,078.99$ 999,989.98$ 18,290,935.31$ 999,965.43$
(1) Account closed in 2000

24
Exhibit “B”
S&P Spreadsheet Without Names
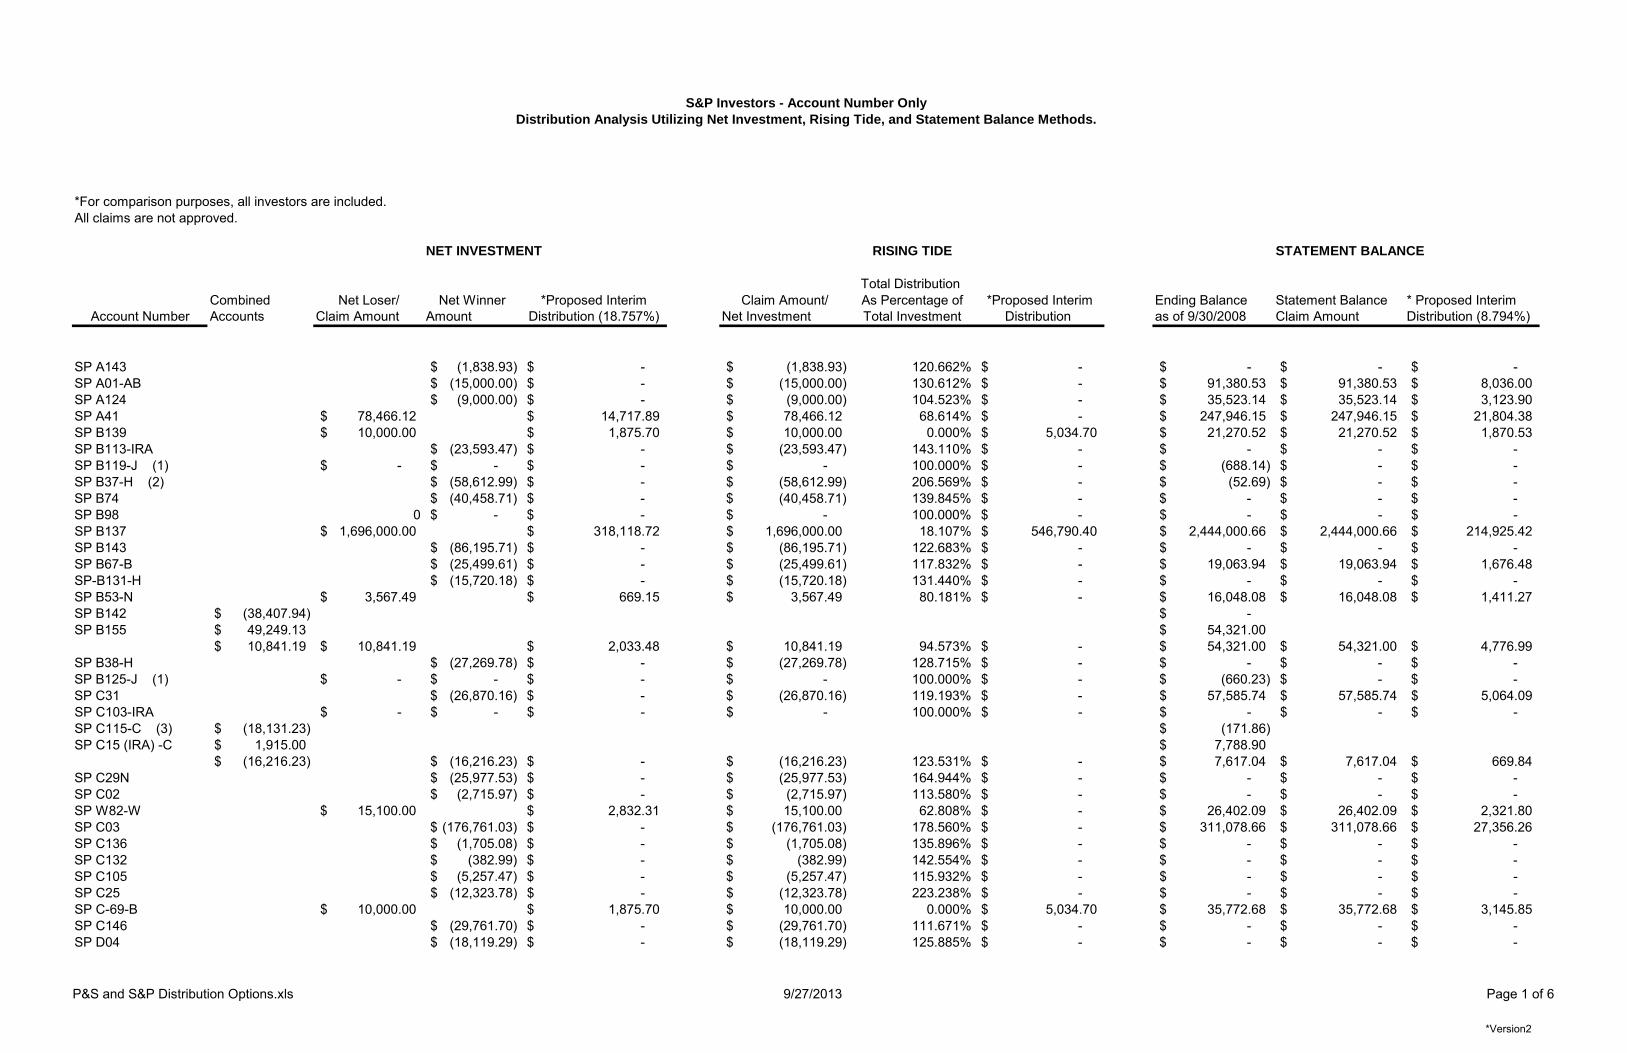
P&S and S&P Distribution Options.xls 9/27/2013 Page 1 of 6
*For comparison purposes, all investors are included.
All claims are not approved.
NET INVESTMENT RISING TIDE STATEMENT BALANCE
Total Distribution
Combined Net Loser/ Net Winner *Proposed Interim Claim Amount/ As Percentage of *Proposed Interim Ending Balance Statement Balance * Proposed Interim
Account Number Accounts Claim Amount Amount Distribution (18.757%) Net Investment Total Investment Distribution as of 9/30/2008 Claim Amount Distribution (8.794%)
SP A143 (1,838.93)$ -$ (1,838.93)$ 120.662% -$ -$ -$ -$
SP A01-AB (15,000.00)$ -$ (15,000.00)$ 130.612% -$ 91,380.53$ 91,380.53$ 8,036.00$
SP A124 (9,000.00)$ -$ (9,000.00)$ 104.523% -$ 35,523.14$ 35,523.14$ 3,123.90$
SP A41 78,466.12$ 14,717.89$ 78,466.12$ 68.614% -$ 247,946.15$ 247,946.15$ 21,804.38$
SP B139 10,000.00$ 1,875.70$ 10,000.00$ 0.000% 5,034.70$ 21,270.52$ 21,270.52$ 1,870.53$
SP B113-IRA (23,593.47)$ -$ (23,593.47)$ 143.110% -$ -$ -$ -$
SP B119-J (1) -$ -$ -$ -$ 100.000% -$ (688.14)$ -$ -$
SP B37-H (2) (58,612.99)$ -$ (58,612.99)$ 206.569% -$ (52.69)$ -$ -$
SP B74 (40,458.71)$ -$ (40,458.71)$ 139.845% -$ -$ -$ -$
SP B98 0 -$ -$ -$ 100.000% -$ -$ -$ -$
SP B137 1,696,000.00$ 318,118.72$ 1,696,000.00$ 18.107% 546,790.40$ 2,444,000.66$ 2,444,000.66$ 214,925.42$
SP B143 (86,195.71)$ -$ (86,195.71)$ 122.683% -$ -$ -$ -$
SP B67-B (25,499.61)$ -$ (25,499.61)$ 117.832% -$ 19,063.94$ 19,063.94$ 1,676.48$
SP-B131-H (15,720.18)$ -$ (15,720.18)$ 131.440% -$ -$ -$ -$
SP B53-N 3,567.49$ 669.15$ 3,567.49$ 80.181% -$ 16,048.08$ 16,048.08$ 1,411.27$
SP B142 (38,407.94)$ -$
SP B155 49,249.13$ 54,321.00$
10,841.19$ 10,841.19$ 2,033.48$ 10,841.19$ 94.573% -$ 54,321.00$ 54,321.00$ 4,776.99$
SP B38-H (27,269.78)$ -$ (27,269.78)$ 128.715% -$ -$ -$ -$
SP B125-J (1) -$ -$ -$ -$ 100.000% -$ (660.23)$ -$ -$
SP C31 (26,870.16)$ -$ (26,870.16)$ 119.193% -$ 57,585.74$ 57,585.74$ 5,064.09$
SP C103-IRA -$ -$ -$ -$ 100.000% -$ -$ -$ -$
SP C115-C (3) (18,131.23)$ (171.86)$
SP C15 (IRA) -C 1,915.00$ 7,788.90$
(16,216.23)$ (16,216.23)$ -$ (16,216.23)$ 123.531% -$ 7,617.04$ 7,617.04$ 669.84$
SP C29N (25,977.53)$ -$ (25,977.53)$ 164.944% -$ -$ -$ -$
SP C02 (2,715.97)$ -$ (2,715.97)$ 113.580% -$ -$ -$ -$
SP W82-W 15,100.00$ 2,832.31$ 15,100.00$ 62.808% -$ 26,402.09$ 26,402.09$ 2,321.80$
SP C03 (176,761.03)$ -$ (176,761.03)$ 178.560% -$ 311,078.66$ 311,078.66$ 27,356.26$
SP C136 (1,705.08)$ -$ (1,705.08)$ 135.896% -$ -$ -$ -$
SP C132 (382.99)$ -$ (382.99)$ 142.554% -$ -$ -$ -$
SP C105 (5,257.47)$ -$ (5,257.47)$ 115.932% -$ -$ -$ -$
SP C25 (12,323.78)$ -$ (12,323.78)$ 223.238% -$ -$ -$ -$
SP C-69-B 10,000.00$ 1,875.70$ 10,000.00$ 0.000% 5,034.70$ 35,772.68$ 35,772.68$ 3,145.85$
SP C146 (29,761.70)$ -$ (29,761.70)$ 111.671% -$ -$ -$ -$
SP D04 (18,119.29)$ -$ (18,119.29)$ 125.885% -$ -$ -$ -$
S&P Investors - Account Number Only
Distribution Analysis Utilizing Net Investment, Rising Tide, and Statement Balance Methods.
*Version2

P&S and S&P Distribution Options.xls 9/27/2013 Page 2 of 6
*For comparison purposes, all investors are included.
All claims are not approved.
NET INVESTMENT RISING TIDE STATEMENT BALANCE
Total Distribution
Combined Net Loser/ Net Winner *Proposed Interim Claim Amount/ As Percentage of *Proposed Interim Ending Balance Statement Balance * Proposed Interim
Account Number Accounts Claim Amount Amount Distribution (18.757%) Net Investment Total Investment Distribution as of 9/30/2008 Claim Amount Distribution (8.794%)
S&P Investors - Account Number Only
Distribution Analysis Utilizing Net Investment, Rising Tide, and Statement Balance Methods.
SP D145-1 (14,736.38)$ 17,451.52$
SP D145-2 (279,121.29)$ 883.06$
(293,857.67)$ (293,857.67)$ -$ (293,857.67)$ 135.527% -$ 18,334.58$ 18,334.58$ 1,612.34$
SP D70-N (44,375.61)$ -$ (44,375.61)$ 173.959% -$ 1,125.26$ 1,125.26$ 98.96$
SP D71-DRG (3) (31,322.30)$ -$ (31,322.30)$ 168.870% -$ (574.07)$ -$ -$
SP D68-B (4,210.00)$ -$ (4,210.00)$ 142.100% -$ 18,828.70$ 18,828.70$ 1,655.80$
SP E155 (31,228.24)$ -$
SP E154 593,368.00$ 668,840.50$
562,139.76$ 562,139.76$ 105,440.55$ 562,139.76$ 46.123% 23,744.78$ 668,840.50$ 668,840.50$ 58,817.83$
SP E111-H (287,454.40)$ -$ (287,454.40)$ 156.364% -$ -$ -$ -$
SP F140 22,742.30$ 4,265.77$ 22,742.30$ 56.265% -$ 54,897.06$ 54,897.06$ 4,827.65$
SP F57 -$ -$ -$ -$ 100.000% -$ -$ -$ -$
SP F58 (48,786.66)$ -$ (48,786.66)$ 169.564% -$ 93,617.89$ 93,617.89$ 8,232.76$
SP F147 5,343,298.44$ 1,002,242.49$ 5,343,298.44$ 35.957% 768,900.65$ 12,610,868.54$ 12,610,868.54$ 1,108,999.78$
SP F60-F -$ -$ -$ -$ 100.000% -$ -$ -$ -$
SP F61-F -$ -$ -$ -$ 100.000% -$ -$ -$ -$
SP F65-F -$ -$ -$ -$ 100.000% -$ -$ -$ -$
SP 130-F 47,053.57$ 8,825.84$ 47,053.57$ 0.000% 23,690.06$ 147,531.26$ 147,531.26$ 12,973.90$
SP F146-F 160,522.43$ 30,109.19$ 160,522.43$ 19.739% 49,132.71$ 286,242.62$ 286,242.62$ 25,172.18$
SP F05 58,127.47$ 10,902.97$ 58,127.47$ 87.675% -$ 993,221.76$ 993,221.76$ 87,343.92$
SP G06 (159,349.71)$ -$ (159,349.71)$ 181.718% -$ 161,175.73$ 161,175.73$ 14,173.79$
SP G45 (768.48)$ -$ (768.48)$ 103.074% -$ -$ -$ -$
SP G44 (768.48)$ -$ (768.48)$ 103.074% -$ -$ -$ -$
SP G91-H 129,137.86$ 24,222.39$ 129,137.86$ 20.107% 39,051.29$ 269,870.99$ 269,870.99$ 23,732.45$
SP G86-H-IRA -$ -$ -$ -$ 100.000% -$ -$ -$ -$
SP G85-H-IRA -$ -$ -$ -$ 100.000% -$ -$ -$ -$
SP G81-B (71,294.81)$ -$ (71,294.81)$ 246.380% -$ 5,823.52$ 5,823.52$ 512.12$
SP G133N (62,180.21)$ -$ (62,180.21)$ 232.298% -$ 514.63$ 514.63$ 45.26$
SP G145-J 3,897,207.97$ 730,999.30$ 3,897,207.97$ 24.990% 988,215.02$ 6,409,798.33$ 6,409,798.33$ 563,677.67$
SP G148 33,352.30$ 6,255.89$ 33,352.30$ 75.966% -$ 135,215.44$ 135,215.44$ 11,890.85$
SP H07H -$ -$ -$ -$ 100.000% -$ -$ -$ -$
SP H50 (15,569.04)$ -$ (15,569.04)$ 294.613% -$ 183.91$ 183.91$ 16.17$
SP H126 25,000.00$ 4,689.25$ 25,000.00$ 0.000% 12,586.75$ 62,933.18$ 62,933.18$ 5,534.34$
SP H144 6,000.00$ 1,125.42$ 6,000.00$ 0.000% 3,020.82$ 12,376.91$ 12,376.91$ 1,088.43$
SP H08 (2,447.89)$ -$
SP H09 11,834.82$ 127,451.30$
9,386.93$ 9,386.93$ 1,760.71$ 9,386.93$ 91.394% -$ 127,451.30$ 127,451.30$ 11,208.07$
SP H108 9,600.00$ 1,800.67$ 9,600.00$ 5.882% 4,268.64$ 10,292.80$ 10,292.80$ 905.15$
*Version2
P&S and S&P Distribution Options.xls 9/27/2013 Page 3 of 6
*For comparison purposes, all investors are included.
All claims are not approved.
NET INVESTMENT RISING TIDE STATEMENT BALANCE
Total Distribution
Combined Net Loser/ Net Winner *Proposed Interim Claim Amount/ As Percentage of *Proposed Interim Ending Balance Statement Balance * Proposed Interim
Account Number Accounts Claim Amount Amount Distribution (18.757%) Net Investment Total Investment Distribution as of 9/30/2008 Claim Amount Distribution (8.794%)
S&P Investors - Account Number Only
Distribution Analysis Utilizing Net Investment, Rising Tide, and Statement Balance Methods.
SP H52 (29,345.16)$ -$ (29,345.16)$ 148.684% -$ 1,415.64$ 1,415.64$ 124.49$
SP H110-IRA -$ -$ -$ -$ 100.000% -$ -$ -$ -$
SP H109-IRA -$ -$ -$ -$ 100.000% -$ -$ -$ -$
SP H101-H 148,418.06$ 27,838.78$ 148,418.06$ 27.038% 34,594.77$ 183,021.15$ 183,021.15$ 16,094.88$
SP H117-H 10,128.07$ 1,899.72$ 10,128.07$ 59.694% -$ 26,651.99$ 26,651.99$ 2,343.78$
SP H97-H (17,736.95)$ -$ (17,736.95)$ 145.175% -$ 9,196.80$ 9,196.80$ 808.77$
SP H34H (45,405.47)$ -$ (45,405.47)$ 110.821% -$ 173,237.23$ 173,237.23$ 15,234.48$
SP H35H -$ -$ -$ -$ 100.000% -$ -$ -$ -$
SP H36H -$ -$ -$ -$ 100.000% -$ -$ -$ -$
SP H153 90,000.00$ 16,881.30$ 90,000.00$ 30.769% 17,620.20$ 152,900.70$ 152,900.70$ 13,446.09$
SP H66-WH 45,100.00$ 8,459.41$ 45,100.00$ 0.000% 22,706.50$ 111,719.85$ 111,719.85$ 9,824.64$
SP H144-AB (859,880.41)$ -$ (859,880.41)$ 121.497% -$ -$ -$ -$
SP H127(IRA)B -$ -$ -$ -$ 100.000% -$ -$ -$ -$
SP H129(IRA) -$ -$ -$ -$ 100.000% -$ -$ -$ -$
SP I43 (132,428.58)$ -$ (132,428.58)$ 362.914% -$ -$ -$ -$
SP I42-1 -$ -$ -$ -$ 100.000% -$ -$ -$ -$
SP I42-2 -$ -$ -$ -$ 100.000% -$ -$ -$ -$
AP I118 (12,864.83)$ -$ (12,864.83)$ 134.034% -$ -$ -$ -$
SP 131 100,000.00$ 18,757.00$ 100,000.00$ 0.000% 50,347.00$ 346,716.36$ 346,716.36$ 30,490.24$
SP I148 95,000.00$ 17,819.15$ 95,000.00$ 0.000% 47,829.65$ 145,654.83$ 145,654.83$ 12,808.89$
SP J121-J -$ -$ -$ -$ 100.000% -$ -$ -$ -$
SP J30N (18,115.47)$ -$ (18,115.47)$ 130.192% -$ 39,094.32$ 39,094.32$ 3,437.95$
SP J142-N 6,774.95$ 1,270.78$ 6,774.95$ 0.000% 3,410.98$ 14,145.48$ 14,145.48$ 1,243.95$
SP J86-H (20,569.28)$ -$ (20,569.28)$ 113.713% -$ -$ -$ -$
SP J75-1 (5,215.08)$ -$ (5,215.08)$ 120.860% -$ -$ -$ -$
SP J90-2 (7,644.13)$ -$ (7,644.13)$ 130.577% -$ -$ -$ -$
SP J147-A&B (80,000.00)$ -$ (80,000.00)$ 144.444% -$ 39,333.80$ 39,333.80$ 3,459.01$
SP J129-J (4) (26,508.25)$ -$ (26,508.25)$ 100.251% -$ (3,852.66)$ -$ -$
SP K89 (5,959.17)$ -$ (5,959.17)$ 120.549% -$ -$ -$ -$
SP K107-IRA -$ -$ -$ -$ 100.000% -$ -$ -$ -$
SP L150 (87,788.57)$ -$ (87,788.57)$ 112.278% -$ -$ -$ -$
SP L141-B (26,152.98)$ -$ 26,152.98$ 126.153% -$ -$ -$ -$
SP L18 (13,500.00)$ -$ (13,500.00)$ 115.084% -$ 64,859.50$ 64,859.50$ 5,703.74$
SP L10 (45,213.83)$ -$ (45,213.83)$ 130.143% -$ 69,286.37$ 69,286.37$ 6,093.04$
SP L11 12,070.73$ 2,264.11$ 12,070.73$ 75.859% -$ 174,198.27$ 174,198.27$ 15,319.00$
SP W39 1,237.79$ 232.17$ 1,237.79$ 99.196% -$ 196,989.96$ 196,989.96$ 17,323.30$
SP L151 102,250.00$ 19,179.03$ 102,250.00$ 44.505% 5,973.45$ 238,293.46$ 238,293.46$ 20,955.53$
SP L104 (7,240.80)$ -$ (7,240.80)$ 136.204% -$ -$ -$ -$
*Version2

P&S and S&P Distribution Options.xls 9/27/2013 Page 4 of 6
*For comparison purposes, all investors are included.
All claims are not approved.
NET INVESTMENT RISING TIDE STATEMENT BALANCE
Total Distribution
Combined Net Loser/ Net Winner *Proposed Interim Claim Amount/ As Percentage of *Proposed Interim Ending Balance Statement Balance * Proposed Interim
Account Number Accounts Claim Amount Amount Distribution (18.757%) Net Investment Total Investment Distribution as of 9/30/2008 Claim Amount Distribution (8.794%)
S&P Investors - Account Number Only
Distribution Analysis Utilizing Net Investment, Rising Tide, and Statement Balance Methods.
SP M134 (16,223.36)$ -$
SP M123 50,000.00$ 64,879.53$
33,776.64$ 33,776.64$ 6,335.48$ 33,776.64$ 83.018% -$ 64,879.53$ 64,879.53$ 5,705.51$
SP O128-B 125,000.00$ 23,446.25$ 125,000.00$ 0.000% 62,933.75$ 179,773.09$ 179,773.09$ 15,809.25$
SP M12 (72,144.10)$ -$ (72,144.10)$ 132.819% -$ -$ -$ -$
SP M138 (9,545.90)$ -$ (9,545.90)$ 130.453% -$ -$ -$ -$
SP M73 (487.18)$ -$ (487.18)$ 102.564% -$ -$ -$ -$
SP M78-F (2,673.99)$ -$ (2,673.99)$ 107.640% -$ -$ -$ -$
SP Mc093-F 4,968.35$ 931.91$ 4,968.35$ 0.000% 2,501.42$ 13,158.11$ 13,158.11$ 1,157.12$
SP Mc123-F (13,137.87)$ -$ (13,137.87)$ 245.170% -$ 445.57$ 445.57$ 39.18$
SP Mc092-F (7,991.44)$ -$ (7,991.44)$ 265.545% -$ 235.39$ 235.39$ 20.70$
SP Mc013-1 (55,193.70)$ -$ (55,193.70)$ 133.622% -$ 76,983.97$ 76,983.97$ 6,769.97$
SP M64-2 -$ -$ -$ -$ 100.000% -$ -$ -$ -$
SP M87-F (16,362.72)$ -$ (16,362.72)$ 116.363% -$ -$ -$ -$
SP M83-M (6,188.33)$ -$ (6,188.33)$ 223.767% -$ -$ -$ -$
SP M96-M 25,000.00$ 4,689.25$ 25,000.00$ 0.000% 12,586.75$ 76,344.83$ 76,344.83$ 6,713.76$
SP M130-J (1) -$ -$ -$ -$ 100.000% -$ (726.82)$ -$ -$
SP M22 155,687.63$ 29,202.33$ 155,687.63$ 46.989% 5,227.99$ 488,517.02$ 488,517.02$ 42,960.19$
SP N99-N 10,000.00$ 1,875.70$ 10,000.00$ 0.000% 5,034.70$ 29,944.83$ 29,944.83$ 2,633.35$
SP O88 (14,659.63)$ -$ (14,659.63)$ 161.082% -$ -$ -$ -$
SP O90 45,000.00$ 8,440.65$ 45,000.00$ 0.000% 22,656.15$ 131,059.72$ 131,059.72$ 11,525.39$
SP P129-B 50,000.00$ 9,378.50$ 50,000.00$ 0.000% 25,173.50$ 104,736.64$ 104,736.64$ 9,210.54$
SP P88 (5,500.00)$ -$ (5,500.00)$ 103.929% -$ 31,401.31$ 31,401.31$ 2,761.43$
SP P131 114,000.00$ 21,382.98$ 114,000.00$ 0.000% 57,395.58$ 114,131.45$ 114,131.45$ 10,036.72$
SP P131 78,807.98$ 14,782.01$ 78,807.98$ 51.946% -$ 153,000.01$ 153,000.01$ 13,454.82$
SP P14 (17,094.66)$ -$ (17,094.66)$ 185.473% -$ 16,590.75$ 16,590.75$ 1,458.99$
SP P15 (9,944.84)$ -$ (9,944.84)$ 238.318% -$ -$ -$ -$
SP P16 70,221.61$ 13,171.47$ 70,221.61$ 60.726% -$ 236,936.34$ 236,936.34$ 20,836.18$
SP P133 10,000.00$ 1,875.70$ 10,000.00$ 77.778% -$ 31,889.01$ 31,889.01$ 2,804.32$
SP P77 (36,292.40)$ -$ (36,292.40)$ 242.323% -$ (27.53)$ -$ -$
SP P94(IRA) -$ -$ -$ -$ 100.000% -$ -$ -$ -$
SP P76 (7,151.94)$ -$ (7,151.94)$ 117.880% -$ -$ -$ -$
SP P116-J (112,538.76)$ -$ (112,538.76)$ 150.017% -$ -$ -$ -$
SP P112-J (1) -$ -$ -$ -$ 100.000% -$ (689.93)$ -$ -$
SP R40 47,946.36$ 8,993.30$ 47,946.36$ 40.067% 4,928.89$ 146,011.23$ 146,011.23$ 12,840.23$
SP R141 (9,015.93)$ -$ (9,015.93)$ 110.018% -$ -$ -$ -$
SP R23R (114,956.18)$ -$ (114,956.18)$ 182.702% -$ -$ -$ -$
SP R128R (51,142.13)$ -$ (51,142.13)$ 136.530% -$ -$ -$ -$
*Version2

P&S and S&P Distribution Options.xls 9/27/2013 Page 5 of 6
*For comparison purposes, all investors are included.
All claims are not approved.
NET INVESTMENT RISING TIDE STATEMENT BALANCE
Total Distribution
Combined Net Loser/ Net Winner *Proposed Interim Claim Amount/ As Percentage of *Proposed Interim Ending Balance Statement Balance * Proposed Interim
Account Number Accounts Claim Amount Amount Distribution (18.757%) Net Investment Total Investment Distribution as of 9/30/2008 Claim Amount Distribution (8.794%)
S&P Investors - Account Number Only
Distribution Analysis Utilizing Net Investment, Rising Tide, and Statement Balance Methods.
SP R149-R 54,000.00$ 10,128.78$ 54,000.00$ 0.000% 27,187.38$ 91,192.35$ 91,192.35$ 8,019.46$
SP R100-R (48,500.00)$ -$ (48,500.00)$ 182.203% -$ 930.90$ 930.90$ 81.86$
SP R27N (12,418.09)$ -$ (12,418.09)$ 224.181% -$ -$ -$ -$
SP R59-W (2,000.00)$ -$ (2,000.00)$ 108.000% -$ 60,243.79$ 60,243.79$ 5,297.84$
SP R72-B (37,678.82)$ -$ (37,678.82)$ 135.885% -$ 84,182.22$ 84,182.22$ 7,402.98$
SP R48H (5,628.73)$ -$ (5,628.73)$ 111.976% -$ -$ -$ -$
SP S28N (37,670.45)$ -$ (37,670.45)$ 153.815% -$ -$ -$ -$
SP S55-N (3,205.43)$ -$ (3,205.43)$ 132.054% -$ -$ -$ -$
SP S46 (13,054.14)$ -$ (13,054.14)$ 113.887% -$ 9,925.31$ 9,925.31$ 872.83$
SP S56 (3,500.00)$ -$ (3,500.00)$ 170.000% -$ 8,527.63$ 8,527.63$ 749.92$
SP S47 553.66$ 103.85$ 553.66$ 98.985% -$ 22,270.04$ 22,270.04$ 1,958.43$
SP 017 (1,757.24)$ -$ (1,757.24)$ 108.786% -$ -$ -$ -$
SP S130 (5,803.89)$ -$ (5,803.89)$ 135.381% -$ -$ -$ -$
SP S63-F (155,572.02)$ -$ (155,572.02)$ 184.093% -$ -$ -$ -$
SP S122 (3,916.69)$ -$ (3,916.69)$ 110.307% -$ -$ -$ -$
SP S85 130,000.00$ 24,384.10$ 130,000.00$ 0.000% 65,451.10$ 402,177.62$ 402,177.62$ 35,367.50$
SP S139 5,397,729.32$ 1,012,452.09$ 5,397,729.32$ 35.145% 820,562.81$ 10,593,543.55$ 10,593,543.55$ 931,596.22$
SP S033 33,729.66$ 6,326.67$ 33,729.66$ 28.104% 7,502.49$ 306,967.72$ 306,967.72$ 26,994.74$
SP S20 76,874.24$ 14,419.30$ 76,874.24$ 82.240% -$ 395,935.91$ 395,935.91$ 34,818.60$
SP S26-1 -$ -$ -$ -$ 100.000% -$ -$ -$ -$
SP S26-2 (47,373.20)$ -$ (47,373.20)$ 172.795% -$ 31,032.02$ 31,032.02$ 2,728.96$
SP S140 (705.18)$ -$ (705.18)$ 170.518% -$ -$ -$ -$
SP S138 (853.09)$ -$ (853.09)$ 117.062% -$ -$ -$ -$
SP T21 (8,382.49)$ -$ (8,382.49)$ 113.947% -$ -$ -$ -$
SP T108 -$ -$ -$ -$ 100.000% -$ -$ -$ -$
SP T147-F 59,943.84$ 11,243.67$ 59,943.84$ 60.037% -$ 123,756.74$ 123,756.74$ 10,883.17$
SP W106-IRA (17,105.35)$ -$ (17,105.35)$ 137.589% -$ -$ -$ -$
SP W120 54,706.00$ 10,261.20$ 54,706.00$ 52.430% -$ 85,665.65$ 85,665.65$ 7,533.44$
SP W62 1,039,500.00$ 194,979.02$ 1,039,500.00$ 53.790% -$ 1,534,882.59$ 1,534,882.59$ 134,977.57$
SP W95 (84,974.47)$ -$ (84,974.47)$ 108.247% -$ 28,340.01$ 28,340.01$ 2,492.22$
SP W151 (20,732.67)$ -$ (20,732.67)$ 187.341% -$ -$ -$ -$
SP W152 (20,558.62)$ -$ (20,558.62)$ 142.669% -$ 1,371.11$ 1,371.11$ 120.58$
SP W150 171,071.16$ 32,087.82$ 171,071.16$ 28.593% 37,214.82$ 254,999.25$ 254,999.25$ 22,424.63$
SP W149 82,814.42$ 15,533.50$ 82,814.42$ 83.381% -$ 559,436.79$ 559,436.79$ 49,196.87$
SP W32 (12,772.76)$ -$ (12,772.76)$ 202.951% -$ -$ -$ -$
SP W19 -$ -$ -$ -$ 100.000% -$ -$ -$ -$
SP W102-H -$ -$ -$ -$ 100.000% -$ -$ -$ -$
SP W51 (85,032.70)$ -$ (85,032.70)$ 155.943% -$ 2,565.90$ 2,565.90$ 225.65$
*Version2

P&S and S&P Distribution Options.xls 9/27/2013 Page 6 of 6
*For comparison purposes, all investors are included.
All claims are not approved.
NET INVESTMENT RISING TIDE STATEMENT BALANCE
Total Distribution
Combined Net Loser/ Net Winner *Proposed Interim Claim Amount/ As Percentage of *Proposed Interim Ending Balance Statement Balance * Proposed Interim
Account Number Accounts Claim Amount Amount Distribution (18.757%) Net Investment Total Investment Distribution as of 9/30/2008 Claim Amount Distribution (8.794%)
S&P Investors - Account Number Only
Distribution Analysis Utilizing Net Investment, Rising Tide, and Statement Balance Methods.
SP W114-J (3) (47,061.40)$ -$ (47,061.40)$ 127.683% -$ (1,641.73)$ -$ -$
SP W89-F (30,917.88)$ -$ (30,917.88)$ 161.836% -$ -$ -$ -$
SP W49-W -$ -$ -$ -$ 100.000% -$ 47,409.68$ 47,409.68$ 4,169.21$
SP W80-W (16,398.28)$ -$ (16,398.28)$ 137.269% -$ 1,435.39$ 1,435.39$ 126.23$
SP W149 45,000.00$ 8,440.65$ 45,000.00$ 0.000% 22,656.15$ 67,017.59$ 67,017.59$ 5,893.53$
SP W79 37,000.00$ 6,940.09$ 37,000.00$ 0.000% 18,628.39$ 69,847.52$ 69,847.52$ 6,142.39$
SP W120(IRA) -$ -$ -$ -$ 100.000% -$ -$ -$ -$
SP Y135-Y 100,000.00$ 18,757.00$ 100,000.00$ 0.000% 50,347.00$ 223,892.44$ 223,892.44$ 19,689.10$
SP Z87 (6,851.64)$ -$ (6,851.64)$ 168.516% -$ -$ -$ -$
20,791,854.30$ 3,899,928.11$ 16,470,926.39$ 3,899,941.94$ 44,347,459.37$ 3,899,915.58$
(1) Transferred to Guardian Angel Trust, LLC
(2) Account closed in 2001
(3) Account closed in 2000
(4) Partnership terminated in 2002
*Version2

25
Exhibit “C”
Summary of Responses

Interested Party
Takes no
Position/
Requests Court
to Make
Determination Net Investment Rising Tide Partnership Agreement Last Statement Balance Florida Statute Total
Alex E. Molchan Trust DTD 05/19/94 x
Barone, Dalores x
Bonhage, Laurel and William x
Boschetti, Annette x
Boschetti, Carl x
Bryan, Denise x
Burt Moss & Associates, Inc. x
Burton Harold Moss IRA x
Clark, Johanna x
Combs, John x
Combs, Lois x
Congregation of the Holy Ghost, Western Province x
Crowe, Bridgette x
Crowe, James x
Fellman, Morton x
Festus and Helen Stacey Foundation x
Fox Family Trust x
Frank, Paul J (PR is Vince T Kelly) x
Friedman, Myra x
Guardian Angel, LLC x
Gutter, Calla x
Holloway, Alicia N Revocable Trust x
Holloway, Kristina x
Holloway, Scott W Revocable Trust x
Horwitz, Wayne as Trustee for Howard H. and Joyce
Living Trust x
Jacob, Steven x
Janet B. Molchan Trust DTD 05/19/94 x
Lavender, Madeline x
Lavender, Martin x
Margaret B. Gwinn Trust x
McIlvaine, Louise x
Molchan, Susan and Thomas Whiteman x
Moss, Burt and Susan x
Nickens, Mary Ellen (Francis J. Mahoney, JR as PR) x
Richardson, Mildred x
Robert A. Uchin Revocable Trust x
Robert G. Walsh Family Trust #1 x
Robert G. Walsh Family Trust #2 x
Robert G. Walsh Family Trust #3 x
Robert G. Walsh Family Trust #4 x
Rosen, Lynn x
Rosen, Sam and Edith x
Rowlette, Lucille (Laurel Bonhage, daughter) x
SPJ Investment, Ltd. x
Walsh Family Trust #1 x
Walsh Family Trust #2 x
Walsh Family Trust #3 x
Walsh, James R. x
Walsh, Kathleen x
West, Bette x
West, Richard x
White, Sandra M. (Dydo) x
Wills, Eileen x
Wills, Evelyn x
Wills, Rebekah x
Wills, Richard x
Wallick, Cindy x
Totals 31 11 7 5 4 0 58