In situ secondary organic aerosol formation from ambient …€¦ · · 2016-03-08MBO...
28
Atmos. Chem. Phys., 16, 2943–2970, 2016 www.atmos-chem-phys.net/16/2943/2016/ doi:10.5194/acp-16-2943-2016 © Author(s) 2016. CC Attribution 3.0 License. In situ secondary organic aerosol formation from ambient pine forest air using an oxidation flow reactor Brett B. Palm 1,2 , Pedro Campuzano-Jost 1,2 , Amber M. Ortega 1,3 , Douglas A. Day 1,2 , Lisa Kaser 4,5 , Werner Jud 5 , Thomas Karl 6 , Armin Hansel 5 , James F. Hunter 7 , Eben S. Cross 7 , Jesse H. Kroll 7,8 , Zhe Peng 1,2 , William H. Brune 9 , and Jose L. Jimenez 1,2 1 Cooperative Institute for Research in Environmental Sciences, University of Colorado, Boulder, CO, USA 2 Department of Chemistry and Biochemistry, University of Colorado, Boulder, CO, USA 3 Department of Atmospheric and Oceanic Science, University of Colorado, Boulder, CO, USA 4 National Center for Atmospheric Research, Boulder, CO, USA 5 Institute of Ion Physics and Applied Physics, University of Innsbruck, Innsbruck, Austria 6 Institute of Meteorology and Geophysics, University of Innsbruck, Innsbruck, Austria 7 Department of Civil and Environmental Engineering, Massachusetts Institute of Technology, Cambridge, MA, USA 8 Department of Chemical Engineering, Massachusetts Institute of Technology, Cambridge, MA, USA 9 Department of Meteorology, Pennsylvania State University, State College, PA, USA Correspondence to: Jose L. Jimenez ([email protected]) Received: 6 October 2015 – Published in Atmos. Chem. Phys. Discuss.: 4 November 2015 Revised: 25 February 2016 – Accepted: 26 February 2016 – Published: 8 March 2016 Abstract. An oxidation flow reactor (OFR) is a vessel inside which the concentration of a chosen oxidant can be increased for the purpose of studying SOA formation and aging by that oxidant. During the BEACHON-RoMBAS (Bio-hydro- atmosphere interactions of Energy, Aerosols, Carbon, H 2 O, Organics & Nitrogen–Rocky Mountain Biogenic Aerosol Study) field campaign, ambient pine forest air was oxidized by OH radicals in an OFR to measure the amount of SOA that could be formed from the real mix of ambient SOA precursor gases, and how that amount changed with time as precursors changed. High OH concentrations and short residence times allowed for semicontinuous cycling through a large range of OH exposures ranging from hours to weeks of equiva- lent (eq.) atmospheric aging. A simple model is derived and used to account for the relative timescales of condensation of low-volatility organic compounds (LVOCs) onto particles; condensational loss to the walls; and further reaction to pro- duce volatile, non-condensing fragmentation products. More SOA production was observed in the OFR at nighttime (aver- age 3 μg m -3 when LVOC fate corrected) compared to day- time (average 0.9 μg m -3 when LVOC fate corrected), with maximum formation observed at 0.4–1.5 eq. days of pho- tochemical aging. SOA formation followed a similar diur- nal pattern to monoterpenes, sesquiterpenes, and toluene+p- cymene concentrations, including a substantial increase just after sunrise at 07:00 local time. Higher photochemical ag- ing (> 10 eq. days) led to a decrease in new SOA formation and a loss of preexisting OA due to heterogeneous oxidation followed by fragmentation and volatilization. When compar- ing two different commonly used methods of OH produc- tion in OFRs (OFR185 and OFR254-70), similar amounts of SOA formation were observed. We recommend the OFR185 mode for future forest studies. Concurrent gas-phase mea- surements of air after OH oxidation illustrate the decay of primary VOCs, production of small oxidized organic com- pounds, and net production at lower ages followed by net consumption of terpenoid oxidation products as photochem- ical age increased. New particle formation was observed in the reactor after oxidation, especially during times when pre- cursor gas concentrations and SOA formation were largest. Approximately 4.4 times more SOA was formed in the reac- tor from OH oxidation than could be explained by the VOCs measured in ambient air. To our knowledge this is the first time that this has been shown when comparing VOC con- centrations with SOA formation measured at the same time, rather than comparing measurements made at different times. Published by Copernicus Publications on behalf of the European Geosciences Union.
Transcript of In situ secondary organic aerosol formation from ambient …€¦ · · 2016-03-08MBO...
Atmos. Chem. Phys., 16, 2943–2970, 2016
www.atmos-chem-phys.net/16/2943/2016/
doi:10.5194/acp-16-2943-2016
© Author(s) 2016. CC Attribution 3.0 License.
In situ secondary organic aerosol formation from ambient pine
forest air using an oxidation flow reactor
Brett B. Palm1,2, Pedro Campuzano-Jost1,2, Amber M. Ortega1,3, Douglas A. Day1,2, Lisa Kaser4,5, Werner Jud5,
Thomas Karl6, Armin Hansel5, James F. Hunter7, Eben S. Cross7, Jesse H. Kroll7,8, Zhe Peng1,2, William H. Brune9,
and Jose L. Jimenez1,2
1Cooperative Institute for Research in Environmental Sciences, University of Colorado, Boulder, CO, USA2Department of Chemistry and Biochemistry, University of Colorado, Boulder, CO, USA3Department of Atmospheric and Oceanic Science, University of Colorado, Boulder, CO, USA4National Center for Atmospheric Research, Boulder, CO, USA5Institute of Ion Physics and Applied Physics, University of Innsbruck, Innsbruck, Austria6Institute of Meteorology and Geophysics, University of Innsbruck, Innsbruck, Austria7Department of Civil and Environmental Engineering, Massachusetts Institute of Technology, Cambridge, MA, USA8Department of Chemical Engineering, Massachusetts Institute of Technology, Cambridge, MA, USA9Department of Meteorology, Pennsylvania State University, State College, PA, USA
Correspondence to: Jose L. Jimenez ([email protected])
Received: 6 October 2015 – Published in Atmos. Chem. Phys. Discuss.: 4 November 2015
Revised: 25 February 2016 – Accepted: 26 February 2016 – Published: 8 March 2016
Abstract. An oxidation flow reactor (OFR) is a vessel inside
which the concentration of a chosen oxidant can be increased
for the purpose of studying SOA formation and aging by
that oxidant. During the BEACHON-RoMBAS (Bio-hydro-
atmosphere interactions of Energy, Aerosols, Carbon, H2O,
Organics & Nitrogen–Rocky Mountain Biogenic Aerosol
Study) field campaign, ambient pine forest air was oxidized
by OH radicals in an OFR to measure the amount of SOA that
could be formed from the real mix of ambient SOA precursor
gases, and how that amount changed with time as precursors
changed. High OH concentrations and short residence times
allowed for semicontinuous cycling through a large range
of OH exposures ranging from hours to weeks of equiva-
lent (eq.) atmospheric aging. A simple model is derived and
used to account for the relative timescales of condensation
of low-volatility organic compounds (LVOCs) onto particles;
condensational loss to the walls; and further reaction to pro-
duce volatile, non-condensing fragmentation products. More
SOA production was observed in the OFR at nighttime (aver-
age 3 µg m−3 when LVOC fate corrected) compared to day-
time (average 0.9 µg m−3 when LVOC fate corrected), with
maximum formation observed at 0.4–1.5 eq. days of pho-
tochemical aging. SOA formation followed a similar diur-
nal pattern to monoterpenes, sesquiterpenes, and toluene+p-
cymene concentrations, including a substantial increase just
after sunrise at 07:00 local time. Higher photochemical ag-
ing (> 10 eq. days) led to a decrease in new SOA formation
and a loss of preexisting OA due to heterogeneous oxidation
followed by fragmentation and volatilization. When compar-
ing two different commonly used methods of OH produc-
tion in OFRs (OFR185 and OFR254-70), similar amounts of
SOA formation were observed. We recommend the OFR185
mode for future forest studies. Concurrent gas-phase mea-
surements of air after OH oxidation illustrate the decay of
primary VOCs, production of small oxidized organic com-
pounds, and net production at lower ages followed by net
consumption of terpenoid oxidation products as photochem-
ical age increased. New particle formation was observed in
the reactor after oxidation, especially during times when pre-
cursor gas concentrations and SOA formation were largest.
Approximately 4.4 times more SOA was formed in the reac-
tor from OH oxidation than could be explained by the VOCs
measured in ambient air. To our knowledge this is the first
time that this has been shown when comparing VOC con-
centrations with SOA formation measured at the same time,
rather than comparing measurements made at different times.
Published by Copernicus Publications on behalf of the European Geosciences Union.

2944 B. B. Palm et al.: In situ secondary organic aerosol formation from ambient pine forest air
Several recently developed instruments have quantified am-
bient semivolatile and intermediate-volatility organic com-
pounds (S/IVOCs) that were not detected by a proton transfer
reaction time-of-flight mass spectrometer (PTR-TOF-MS).
An SOA yield of 18–58 % from those compounds can ex-
plain the observed SOA formation. S/IVOCs were the only
pool of gas-phase carbon that was large enough to explain
the observed SOA formation. This work suggests that these
typically unmeasured gases play a substantial role in ambi-
ent SOA formation. Our results allow ruling out condensa-
tion sticking coefficients much lower than 1. These measure-
ments help clarify the magnitude of potential SOA forma-
tion from OH oxidation in forested environments and demon-
strate methods for interpretation of ambient OFR measure-
ments.
1 Introduction
Atmospheric aerosols play a complex and important role in
air pollution, human health, and global climate. Exposure to
fine particles has adverse effects on cardiopulmonary health
(Pope and Dockery, 2006). Aerosols affect climate forcing
by directly scattering or absorbing incoming solar radiation.
They also act as cloud condensation nuclei (CCN; acronyms
are listed in Table 1), affecting the reflectivity, lifetime, and
precipitation of clouds (IPCC, 2013). Among all radiative
forcings, the estimates for aerosols represent the largest un-
certainty (Myhre et al., 2013).
Organic aerosols (OA) make up a substantial fraction of
submicron aerosols (Murphy et al., 2006; Zhang et al., 2007;
Jimenez et al., 2009). OA is composed of thousands of dif-
ferent molecules, of which only a small fraction has been
speciated (Goldstein and Galbally, 2007). OA can be emit-
ted directly in the particle phase as primary OA (POA),
or it can be formed as secondary OA (SOA) through gas-
to-particle conversion. During gas-phase SOA formation,
an oxidant (mainly OH, O3, or NO3) reacts with organic
gases to produce either less-volatile functionalized products
(e.g., reacting to add a hydroxyl group) or more-volatile
fragmented products (e.g., breaking C–C bonds to produce
smaller molecules). If the reaction products have sufficiently
lower volatility, they can then partition into the particle phase
to form SOA (Pankow, 1994; Donahue et al., 2006). In ad-
dition to gas-phase oxidation pathways, SOA formation can
result from aqueous chemistry within aerosol water or in
cloud droplets (e.g., Lim et al., 2010; Ervens et al., 2011; Er-
vens, 2015) or heterogeneous uptake reactions (e.g., Surratt
et al., 2010). Oxidative aging of gases and particles contin-
ues until deposition occurs (or CO2 is produced). The com-
plexity of OA chemistry arises from this intricate mix of
multiphase-multigenerational reaction pathways and physic-
ochemical processes involving thousands of molecules.
Table 1. Glossary.
OFR Oxidation flow reactor
SOA Secondary organic aerosol
LVOC Low-volatility organic compound
OA Organic aerosol
VOC Volatile organic compound
S/IVOC Semivolatile and intermediate-volatility organic
compound
PTR-TOF-MS Proton transfer reaction time-of-flight mass
spectrometer
OH Hydroxyl radical
O3 Ozone
NO3 Nitrate radical
MBO 2-methyl-3-buten-2-ol
MT Monoterpenes
SQT Sesquiterpenes
OHRext External OH reactivity
OHRint Internal OH reactivity
OHexp OH exposure
eq. Equivalent
SMPS Scanning mobility particle sizer
AMS Aerodyne High-Resolution Time-of-Flight
Aerosol Mass Spectrometer
kOH Rate constant for reaction with OH
kO3Rate constant for reaction with O3
TD-EIMS Thermal desorption electron impact mass
spectrometer
C∗ Effective saturation vapor concentration
τaer Lifetime of LVOCs (or H2SO4) for
condensation onto aerosols
τwall Lifetime of LVOCs (or H2SO4) for loss to
OFR walls
τOH Lifetime of LVOCs for reaction with OH
τtotal Total lifetime for loss of LVOCs (or H2SO4)
CS Condensational sink
D Gas diffusion coefficient
r Particle radius
N(r) Particle number size distribution
α Sticking coefficient
Kn Knudsen number
λg Mean free path of gas molecules
A/V Surface-area-to-volume ratio of OFR
ke Coefficient of eddy diffusion
Fx Fraction of LVOCs (or H2SO4) lost to
pathway x
SO4 Sulfate aerosol
Much progress has been made in the past decade towards
identifying and quantifying the sources, formation, and ag-
ing mechanisms of SOA. Aerosol models using traditional
(pre-2007) aerosol yields for volatile organic compounds
(VOCs) from chamber studies generally underpredict SOA
mass by a factor of 10 in urban areas (Volkamer et al.,
2006; Hodzic et al., 2010; Hayes et al., 2015). More re-
cent models are able to better predict SOA mass in urban
areas by using higher VOC yields and adding previously ig-
nored semivolatile and intermediate-volatility organic com-
pounds (S/IVOCs; Hodzic et al., 2010; Hayes et al., 2015).
Atmos. Chem. Phys., 16, 2943–2970, 2016 www.atmos-chem-phys.net/16/2943/2016/

B. B. Palm et al.: In situ secondary organic aerosol formation from ambient pine forest air 2945
Model comparisons for biogenically dominated areas have
not shown such systematic underpredictions even when us-
ing older models (e.g., Tunved et al., 2006; Chen et al., 2009;
Hodzic et al., 2009; Slowik et al., 2010). Recent measure-
ments of the oxidation of biomass burning emissions, vehicle
exhaust, and urban air have also found S/IVOCs to be impor-
tant contributors to SOA formation (Grieshop et al., 2009;
Miracolo et al., 2010; Zhao et al., 2014), building on the ideas
of Robinson et al. (2007). However, model parameterizations
of SOA formation from S/IVOCs are based on large extrapo-
lations and are still uncertain. The recent AeroCom intercom-
parison of 31 global OA models showed large variability be-
tween models and low temporal correlations between mod-
els and measurements (Tsigaridis et al., 2014). Their work
suggests that current model parameterizations of SOA for-
mation, transport, and removal processes are inadequate.
SOA formation has traditionally been studied in large en-
vironmental “smog” chambers. These chamber experiments
have provided the SOA yields for models, but recent evi-
dence shows that chamber experiments are affected by large
losses of semivolatile gases to chamber walls (Matsunaga
and Ziemann, 2010; Zhang et al., 2014; Krechmer et al.,
2015) in addition to well-known particle wall losses (Pierce
et al., 2008). This is especially true at long (> 1 day) res-
idence times, making it difficult to study SOA formation
and aging on longer timescales. Also, while chamber experi-
ments have been performed using emissions from mesocosm
(e.g., whole tree) systems in the laboratory (e.g., Wyche et
al., 2014), it is difficult to perform field experiments with
ambient air in chambers (Tanaka et al., 2003). To explore
the sources of SOA on a rapid timescale and with a wide
range of oxidant exposures, a variety of oxidation flow reac-
tors (OFRs) have been developed (Kang et al., 2007; George
et al., 2008; Smith et al., 2009; Keller and Burtscher, 2012).
OFRs employ higher oxidant concentrations than chambers
while having a short residence time with reduced wall con-
tact. This allows hours to months of equivalent (eq.) atmo-
spheric aging, and the same experimental system can be used
in both laboratory and field experiments.
Previous experiments have shown SOA yields from var-
ious precursor gases oxidized in an OFR to be similar to
yields from large environmental chambers (Kang et al., 2007,
2011; Lambe et al., 2011b, 2015). OFRs have also been used
to investigate SOA formation from pollution source emis-
sions containing complex mixtures of precursors such as con-
trolled biomass burning (Ortega et al., 2013; Bruns et al.,
2015) and vehicular emissions in a tunnel (Tkacik et al.,
2014). Ortega et al. (2015) pioneered the use of an OFR to
study SOA formation from ambient air in an urban study in
the Los Angeles area. Bruns et al. (2015) found that, for a
wood combustion system, the amount of SOA formed in an
OFR compared to a large chamber agreed reasonably well.
Tkacik et al. (2014) and Ortega et al. (2013) showed sub-
stantially more SOA formation than could be explained from
speciated VOCs. Despite relying on SOA yields measured
in large chambers, which can be affected by the aforemen-
tioned wall losses of semivolatile gases, these results suggest
that S/IVOCs contribute to SOA formation in biomass burn-
ing plumes and vehicle exhaust.
In this study, we used an OFR to expose ambient air to
variable levels of OH in a ponderosa pine forest during the
BEACHON-RoMBAS (Bio-hydro-atmosphere interactions
of Energy, Aerosols, Carbon, H2O, Organics & Nitrogen–
Rocky Mountain Biogenic Aerosol Study) campaign. We ex-
tensively characterized both the gas and particle phase to
investigate the formation and aging of SOA. Changes in
aerosol formation with gas precursor concentrations, time of
day, and OH exposure were explored. The fate of condens-
able organic gases in the OFR was modeled. This model was
used to estimate how much SOA formation was missed in
the OFR due to gas-phase wall losses, excessive OH reac-
tion that led to gas-phase fragmentation prior to condensa-
tion, and inadequate time/particle surface area for condensa-
tion. The SOA mass produced via oxidation was compared
to the amount of SOA predicted based on literature yields of
measured VOCs. The role of S/IVOCs in SOA formation in
a forest was also explored. These results are discussed in the
context of improving our knowledge of SOA sources and for-
mation processes in a biogenically dominated environment.
2 Experimental methods
2.1 BEACHON-RoMBAS campaign
The BEACHON-RoMBAS field campaign (http:
//cires.colorado.edu/jimenez-group/wiki/index.php/
BEACHON-RoMBAS) took place at the Manitou Experi-
mental Forest Observatory near Woodland Park, Colorado,
in July–August 2011 (39.10◦ N, 105.10◦W; 2370 m ele-
vation). It was a collaboration of 27 institutions from the
United States and Europe, focused on understanding primary
and secondary biogenic aerosol emissions, formation, and
processing. An overview of atmospheric chemistry research
at the Manitou Experimental Forest Observatory, including
the BEACHON-RoMBAS campaign, has been previously
published (Ortega et al., 2014).
The sampling site was located in a ponderosa pine forest
in a mountain valley. VOC concentrations were character-
ized by high 2-methyl-3-buten-2-ol (MBO) during the day-
time and monoterpenes (MT) during the nighttime. VOCs
at this site have been described in detail for previous cam-
paigns during July–September 2008 (Kim et al., 2010) and
August–September 2010 (Kaser et al., 2013a, b), while Fry
et al. (2013) discussed diurnal cycles of select biogenic and
anthropogenic VOCs during this campaign. The diurnal cy-
cle of the concentration of MBO+isoprene (detected as the
same product ion in the proton transfer reaction time-of-flight
mass spectrometer: PTR-TOF-MS) measured at an above-
canopy 25 m inlet ranged from about 1.5 ppb during the day
www.atmos-chem-phys.net/16/2943/2016/ Atmos. Chem. Phys., 16, 2943–2970, 2016

2946 B. B. Palm et al.: In situ secondary organic aerosol formation from ambient pine forest air
to 0.3 ppb at night, while MT concentrations were on average
0.1 ppb during the day and 0.5 ppb at night. The relative ratio
of isoprene / (MBO+isoprene) at this field site was estimated
using a combination of GC-MS, PTR-TOF-MS, and whole
air sample measurements during summer 2010 (Kaser et al.,
2013a) and using NO+ ionization mass spectrometry dur-
ing the BEACHON-RoMBAS campaign (Karl et al., 2012)
to be approximately 20 %. Isoprene concentrations are cal-
culated in this study using that approximation, which gives
values typically < 300 ppt. While largely dominated by bio-
genic emissions, the site receives some airflow from the front
range urban areas (Denver metropolitan area and Colorado
Springs) on most days, as evidenced by moderate increases
in NOx , CO, and anthropogenic VOCs during late afternoon
and into the evening (Fry et al., 2013; Ortega et al., 2014;
Chan et al., 2016).
2.2 Oxidation flow reactor
The Potential Aerosol Mass (PAM) oxidation flow reactor
(hereafter flow reactor or OFR) is a cylindrical tube 45.7 cm
long with a 19.7 cm ID and a volume of approximately 13 L,
previously described elsewhere (Kang et al., 2007, 2011;
Lambe et al., 2011a; Ortega et al., 2013, 2015). Ambient air
was sampled through the reactor with a residence time of
2–4 min (3.5–6.5 L min−1 total flow rate), achieving oxidant
exposures of hours to months of eq. atmospheric aging. The
14 cm diameter inlet plate was removed from the intake end
of the OFR to reduce possible losses of semivolatile SOA
precursors to the inlet plate inferred in a previous study (Or-
tega et al., 2013) and to reduce the width of the residence
time distribution in the reactor (Ortega et al., 2015). Air was
sampled into the reactor through this 14 cm diameter open-
ing, which was covered with a coarse-grid mesh screen to
reduce turbulence in the reactor and prevent insects and de-
bris from entering the reactor. The mesh was coated with an
inert silicon coating (Sulfinert by SilcoTek, Bellefonte, PA)
to minimize gas and particle losses. OH radicals in the OFR
were produced inside the reactor through one of two meth-
ods: OH production from photolysis of ambient H2O, O2,
and concurrently produced O3 using 185 and 254 nm light
(referred to as the OFR185 method), or OH production from
photolysis of injected (externally produced) O3 using 254 nm
light (referred to as the OFR254 method; Peng et al., 2015a).
O3 and NO3 oxidation were also investigated and will be the
subject of a future manuscript.
For both methods, UV light was produced using two low-
pressure mercury lamps (BHK, Inc., model no. 82-9304-03)
mounted inside and on the upper part of the flow reactor.
The lamps have discrete emission wavelengths of 185 and
254 nm. The following reactions produce the OH radicals:
H2O+ hν (185 nm) → OH+H, (R1)
O2+ hν (185 nm) → 2O(3P), (R2)
O2+O(3P)→ O3, (R3)
O3+ hν (254 nm) → O2+O(1D), (R4)
O(1D)+H2O→ 2OH. (R5)
In the OFR185 method, OH was produced by H2O photoly-
sis (Reaction R1) and also by O3 photolysis (Reactions R4
and R5), as O3 was formed in the reactor from O2 pho-
tolysis (Reactions R2 and R3). In the OFR254 method, the
mercury lamps were mounted inside Teflon-coated quartz
sheaths, which blocked transmission of 185 nm light into the
OFR, and only Reactions (R4) and (R5) produced OH by
photolysis of injected O3. Following the terminology intro-
duced by Peng et al. (2015a), the method used in this work
can be referred to as OFR254-70, signifying that typically
70 ppm of O3 was injected when using the OFR254 method.
Note that both wavelengths (185 and 254 nm) may initiate
chemistry not normally occurring in the troposphere, and
O(3P) and O(1D) are also present in the reactor at elevated
concentrations. However, under the OFR conditions of our
study neither of those non-OH reactants is a competitive re-
action pathway (Peng et al., 2015b). O3 oxidation, on the
other hand, can be competitive in the OH oxidation exper-
iments under certain conditions. According to Fig. 5 of Peng
et al. (2015b), O3 in the OFR185 method during this study
likely contributed only a minor (< 20 %) role in the oxidation
of a few biogenic VOCs with the largest kO3/kOH ratios (e.g.,
β-caryophyllene, α-terpinene, α-humulene), and only at the
lowest OH exposures (OHexp) equivalent to several hours of
aging. With the OFR254-70 method, however, the ratio of O3
exposure to OHexp was as high as 106 for the lowest OHexp
in this study. Under these conditions, O3 may have played
a substantial role in the initial oxidation of a larger number
of species of biogenic VOCs (e.g., reacting with ∼ 100 % of
β-caryophyllene and α-terpinene, ∼ 60 % of α-pinene and
limonene, ∼ 20 % of 3-carene and β-pinene, 10 % of iso-
prene). Still, the relative importance of O3 vs. OH oxidation
in the OFR was over an order of magnitude lower than un-
der typical daily-average atmospheric conditions (Peng et al.,
2015b).
The OH exposure was stepped over a range of expo-
sures by adjusting the mercury lamp intensities using pro-
grammable computer controls. A key parameter for interpret-
ing the flow reactor aging was the total oxidant exposure,
or oxidant concentration integrated over time, experienced
by the sampled air. OHexp for the OFR185 method was esti-
mated in part based on a model-derived equation, which uses
Atmos. Chem. Phys., 16, 2943–2970, 2016 www.atmos-chem-phys.net/16/2943/2016/
B. B. Palm et al.: In situ secondary organic aerosol formation from ambient pine forest air 2947
measurements of ambient water vapor concentration, O3 pro-
duced in the reactor, and estimated external OH reactivity
(OHRext) as equation parameters (Li et al., 2015). OHRext is
the OH reactivity from ambient gases such as VOCs, CO, and
SO2, and is accounted for separately from the “internal OH
reactivity (OHRint)” from species such as HOx , H2O2, and
O3 that are greatly enhanced by this reactor. For this study,
OHexp was calculated using an estimated OHRext = 10 s−1,
based on measurements at the same field site and season dur-
ing previous campaigns (Kim et al., 2013; Nakashima et al.,
2014). To provide the best estimate of OHexp for this study,
the output OHexp from the model was divided by a factor of 2
(which is within the estimated model uncertainty of a factor
of 3) in order to bring it into better agreement with VOC de-
cay rates measured during this campaign (Sect. 3.2). OHexp
for the OFR254-70 method was calculated from a different
model-derived equation, using OHRext and a measurement
of the amount of O3 consumed as equation parameters (Peng
et al., 2015a), and was also divided by a factor of 2. For both
methods, OHexp was converted to eq. days of atmospheric ag-
ing by dividing by a 24 h average atmospheric concentration
of 1.5×10⁶ molec cm−3 OH (Mao et al., 2009). All usage of
hours/days of aging in this work refers to eq. ages calculated
in this manner.
Oxidant exposure is not the only factor that determines
aerosol chemistry. NOx concentrations have been shown to
affect oxidation products and aerosol yields in chamber stud-
ies, especially due to the competition of NO and HO2/RO2
to react with the RO2 radicals formed during oxidation (e.g.,
Ng et al., 2007; Lim and Ziemann, 2009). In all OH oxi-
dation experiments in the reactor, ambient NOx was rapidly
oxidized to HNO3 in as little as a couple of seconds at the
highest OH concentrations, while photolysis of HNO3 back
to NOx was too slow to compete with oxidation (Li et al.,
2015). Thus, the OH flow reactor experiments were assumed
to occur under RO2+HO2 conditions.
2.3 Sampling strategy and measurements
An important advantage of the OFR technique is that the ox-
idant concentration inside the reactor can be rapidly and con-
sistently controlled to achieve any desired amount of oxida-
tion from hours up to many weeks of eq. atmospheric age.
Stepping through a repeating cycle of several oxidant con-
centrations from no added OH to several weeks of eq. ag-
ing allowed continuous investigation of SOA formation as a
function of this age. The time needed to complete one cycle
was kept as short as possible (∼ 2 h), limited by the number
of steps and reactor residence time. This allows the potential
of SOA formation from OH oxidation to be studied over the
whole range of exposures as functions of time of day and the
concentration of precursors that change on that timescale.
In typical OFR185 and OFR254-70 exposure cycles dur-
ing BEACHON-RoMBAS, the UV lamps inside the reac-
tor were stepped through six 20 min long settings of vary-
ing lamp intensities for a combined cycle length of 2 h, from
both lamps off to both lamps at full intensity. Oxidant and
product concentrations in the reactor were allowed 15 min
(∼ 4–7 reactor residence times) to reach a steady state at each
light setting (mainly to allow the OFR to flush, as the lamp
UV intensity stabilizes within seconds) before being sam-
pled for the last 5 min of each cycle. Immediately after this
5 min sampling period, the lamp intensity was changed to
prepare for the next oxidant concentration in the cycle. Dur-
ing the 15 min in which the OFR was not being sampled,
ambient aerosols were sampled directly, through a thermod-
enuder (Huffman et al., 2008), and directly again, for 5 min
each. In this method, all perturbation measurements (OFR or
thermodenuder) are bracketed by unperturbed ambient mea-
surements. The ambient AMS sampling has also been de-
scribed in Fry et al. (2013).
Ambient aerosols and those after oxidation in the OFR
were measured using a TSI 3936 Scanning Mobility Parti-
cle Sizer (SMPS) and an Aerodyne High-Resolution Time-
of-Flight Aerosol Mass Spectrometer (HR-ToF-AMS, here-
after AMS; DeCarlo et al., 2006). A system of automated
valves (Aerodyne AutoValve), controlled by a custom au-
tomation program written in Labview (National Instruments,
Inc.), was used to multiplex the AMS and SMPS to alternate
between measuring ambient air and air oxidized in the OFR
(or heated by the thermodenuder). The flow rate through the
OFR and all sampling lines was kept constant at all times
by using make-up flows when not sampling from each of
the inlet lines or reactors. The same custom software was
used to control and schedule the UV lamp cycling as well as
record relative humidity (RH), temperature, and output O3
concentrations in the OFR. Sampled air was dried to < 30 %
RH upstream of the SMPS and AMS, using a Nafion mem-
brane drier (Perma Pure, LLC; MD-110-24S-4). For OHexp
calculations in the OFR, O3 was measured using a 2B Tech-
nologies Model 205 Monitor, and ambient water vapor was
measured using a Vaisala HM70 probe. A schematic of the
experimental setup is shown in Fig. 1. The SMPS consisted
of a TSI 3080 Electrostatic Classifier, a 3081 long Differen-
tial Mobility Analyzer (DMA) column, and a 3010 Conden-
sation Particle Counter (CPC). It was operated with sheath
and aerosol flow rates of 3.0 and 0.3 L min−1, respectively,
with a TSI Kr-85 neutralizer and no impactor. The SMPS
sampled the range of 14–626 nm mobility diameters, with
one 4 min scan every 5 min, and synchronized with OFR and
AMS sampling.
The AMS data used in this analysis were recorded as
2.5 min average mass spectra in “V-mode”. Instrument sensi-
tivity was calibrated every 3 days with 400 nm monodisperse,
dried, ammonium nitrate particles. The gas-phase N2 signal,
commonly referred to as the air beam, was used to track
changes in sensitivity between calibrations. The flow rate
of air into the AMS was calibrated in the field before mea-
surements began. A fluorocarbon standard was leaked into
the ionization chamber in order to provide high m/z back-
www.atmos-chem-phys.net/16/2943/2016/ Atmos. Chem. Phys., 16, 2943–2970, 2016

2948 B. B. Palm et al.: In situ secondary organic aerosol formation from ambient pine forest air
Figure 1. Simplified schematic of the experimental setup. Ambi-
ent air was alternately sampled either directly or through the oxida-
tion flow reactor (OFR). In the OFR, the concentration of OH was
increased to simulate atmospheric aging from hours up to several
weeks.
ground peaks for improved m/z calibration up to approxi-
mately m/z 300 (DeCarlo et al., 2006). Corrections were ap-
plied to account for gas-phase CO2 interference and water
fragmentation patterns using daily aerosol-free background
filters and continuous ambient CO2 measurements. AMS and
SMPS concentrations and SMPS size distributions were cor-
rected to account for diffusion losses to the walls of the in-
let sampling lines, described in Sect. S1 in the Supplement.
AMS data were processed using a collection efficiency (CE)
of 1, detailed in Sect. S2 and based on a comparison of the
AMS and SMPS measurements of ambient aerosol volume
(Fig. S2); OFR-oxidized aerosol volume and change in vol-
ume (Fig. S3); and total volume enhancement as a function
of photochemical age (Fig. S4). AMS concentrations were
also corrected for losses of small particles through the aero-
dynamic lens and to the OFR walls. Details for these cor-
rections can be found in Sect. S3. AMS data are reported at
293 K and 0.76 atm (typical ambient values at this research
site). The time series, diurnal cycles, and average size distri-
butions of ambient OA, sulfate (SO4), nitrate (NO3), and am-
monium (NH4) aerosol mass concentrations have been pre-
viously published (Ortega et al., 2014).
While both OH generation methods detailed above were
used during the campaign, the analysis in this paper will
mainly focus on the OFR185 mode for several reasons. The
analysis of SOA mass formed vs. predicted in Sect. 3.6
was done using the age range that produced the maximum
SOA formation (0.4–1.5 eq. days). However, determination
of ages below approximately 1 eq. day using the OFR254-70
method was limited by the ability to accurately measure the
amount of injected O3 that was consumed in the reactor. The
variability of the measurement of the initial concentration
of O3 inside the reactor was approximately ±2 ppm (when
reaching a total of about 70 ppm of O3) due to variations in
the mixing of injected O3 with ambient air sampled into the
OFR, especially when sampling in windy conditions. The
model used to estimate eq. age for the OFR254-70 method
estimated that 2 ppm of photolyzed O3 produced an age of
0.5 eq. days, so that was the effective lower limit of detection
of age with the OFR254-70 method under the experimen-
tal conditions used during this campaign. Measuring the de-
cay of a compound that reacts relatively quickly with OH but
does not react with O3 could allow for better OHexp quantifi-
cation at low ages for OFR254-70. Also, the OFR254 method
requires high concentrations of O3 (up to 70 ppm in this
study) to be injected in order to reach high ages. As discussed
above, O3 may play a role in the oxidation of some VOCs
in the OFR254-70 method, while the role of O3 oxidation
in OFR185 is minor. This could further complicate the inter-
pretation of the results of OH oxidation for the lower measur-
able ages (hours–days) when using OFR254-70. In addition,
the temporal data coverage of OFR185 oxidation (23 July–
4 August, 9–14 and 24–26 August) was much greater than
OFR254-70 (17–20 and 28–30 August). This short time pe-
riod of OFR254-70 measurements combined with the diffi-
culty of sampling at short eq. ages with this particular exper-
imental setup meant that there were few OFR254-70 mea-
surements relative to OFR185 measurements for the anal-
ysis in Sect. 3.6. Also, there were no concurrent measure-
ments of S/IVOC concentrations and SOA formation using
OFR254-70 available for the analysis in Sect. 3.6.2. If these
analyses had been performed on a combined data set using
both OH production methods, the results would have been
driven almost completely by OFR185 measurements. For
these reasons, the analyses were performed and conclusions
reached using only OFR185 measurements. Regardless, we
document below that both OH oxidation methods gave con-
sistent results for SOA production over the range of over-
lapping ages (∼ 1–30 eq. days) used during this campaign
(Sect. 3.4). The time series of OFR185 and OFR254-70 OA
measurements are shown compared to ambient OA, MT, and
S/IVOCs in Fig. S7.
This work focuses on the changes in OA mass due to SOA
formation and OA aging as a result of exposure of ambient air
to OH. OA enhancement is defined here as the difference be-
tween OA mass measured by the AMS after oxidation in the
OFR and the average of the two ambient OA concentrations
measured just before and after the oxidation data point. If
SOA was produced in the reactor, the OA enhancement was
positive; if oxidation led to a net loss of OA mass, then the
OA enhancement was negative. As discussed in the results
below, SOA formation in the OFR correlated with ambient
precursor gas concentrations. If the ambient concentration of
those gases was close to 0, then no SOA formation was ob-
served (e.g., Fig. 8). Therefore, any SOA formation from,
e.g., gases desorbing from the OFR walls was negligible.
Measurements of VOCs in ambient air and after OFR ox-
idation were made using a high-resolution PTR-TOF-MS
(Kaser et al., 2013a). This technique can separate and iden-
tify isobaric compounds with a mass resolution (m/1m) of
up to ∼ 4000. This allowed for tracking of the depletion of
primary biogenic species in the OFR as well as the produc-
tion of more oxygenated products. Signals from isotopes,
internal standards, and possible artifacts (e.g., saturated hy-
drocarbons that correlate with O3 concentration in the reac-
tor) were removed from the analysis. When calculating pre-
Atmos. Chem. Phys., 16, 2943–2970, 2016 www.atmos-chem-phys.net/16/2943/2016/

B. B. Palm et al.: In situ secondary organic aerosol formation from ambient pine forest air 2949
dicted depletion for α-pinene, β-pinene, 3-carene, toluene,
p-cymene, methanol, and sesquiterpenes (SQT; using longi-
folene as a representative compound) in the subsequent anal-
ysis, the following rate constants used were: kOH = 5.3×
10−11, 7.7× 10⁻¹¹, 8.7× 10⁻¹¹, 5.5× 10⁻¹², 1.5× 10⁻¹¹,
9.1× 10⁻¹³, and 4.8× 10⁻¹¹ cm3 molec−1 s−1, respectively
(Calvert et al., 2002; Atkinson and Arey, 2003; Alarcón et
al., 2014). As an approximation of previous measurements at
this site, MT are assumed to be an equal mix of α-pinene, β-
pinene, and 3-carene for this analysis (Kim et al., 2010; Or-
tega et al., 2014). Likewise, the ratio of toluene :p-cymene
used in calculations was taken from Kaser et al. (2013a)
to be 74 : 26. Similar to the multiplexing scheme described
above for particle sampling, a system of automated Teflon
valves was used to alternate between measuring ambient air
and air through the OFR, sampling from the OFR concur-
rently with the AMS+SMPS. PTR-TOF-MS measurements
from the OFR were performed during 1–4 and 24–25 August
2011 while using the OFR185 method. The analysis here
focuses on two consecutive sampling cycles from 00:00 to
04:00 MDT (local time) on 3 August 2011, when the con-
centration of MT was relatively high (0.8 ppbv) and the con-
centration of MBO+isoprene was relatively low (0.1 ppbv).
Ambient PTR-TOF-MS measurements are also used in
this work to estimate how much SOA could form in the
OFR. The continuous PTR-TOF-MS measurements during
BEACHON-RoMBAS were made from an inlet at the top
of a tower above the canopy at 25 m height, while the OFR
was located on top of an instrument trailer within the canopy
at approximately 4 m height. In-canopy gradients were ac-
counted for by comparing the PTR-TOF-MS measurements
at 25 m with measurements made through the OFR in the
absence of oxidant and with measurements from a different
nearby inlet at 1 m height. It was observed that the concentra-
tions of MT, SQT, MBO+isoprene, and toluene+p-cymene
were approximately 1.9, 5.9, 1.4, and 1.2 times higher in the
canopy than at 25 m, respectively (discussed in Sect. S4). All
analyses in this work were done using estimated in-canopy
concentrations, which were inferred by applying these empir-
ical relationships to the continuous 25 m inlet measurements.
This scaling technique has been used before, producing sim-
ilar results when applied to measurements during the sum-
mer 2010 BEACHON-ROCS (BEACHON–Rocky Mountain
Organic Carbon Study) campaign at the same field location
(Kim et al., 2013; Wolfe et al., 2014).
Ambient SO2 concentrations were measured using a
Thermo Environmental Model 43C-TLE analyzer. Data were
reported as 5 min averages from six different heights on a
tower up to 25.1 m. We used only data measured at the 5 m
height, to best match the height of the OFR on top of the
trailer. The SO2 instrument was automatically zeroed every
6 h, using scrubbed zero grade air. It was calibrated by a stan-
dard addition of 3 sccm of a 14 ppmv SO2 in N2 standard
(Scott–Marrin) into the 3 standard L min−1 sample flow.
A novel thermal-desorption electron impact mass spec-
trometer (TD-EIMS) was used to measure ambient con-
centrations of ensemble S/IVOCs with volatilities in the
range of effective saturation vapor concentrations (C∗) of
101–107 µg m−3. This method involved cryogenic collection
of organic gases, temperature-programmed desorption into
ultra-high-purity (UHP) helium, and measurement with a
high-resolution time-of-flight mass spectrometer (Cross et
al., 2013; Hunter et al., 2016). The TD-EIMS provided a time
series of the gas-phase organic mass and composition in each
volatility bin.
3 Results and discussion
3.1 OFR operation
Under typical operation, an OFR is used to study oxida-
tion dominated by a single oxidant, similar to typical large-
chamber experiments. In the case of a field application (as in
this study) the sample is a complex and time-varying mix-
ture of ambient precursors that enter the OFR. Importantly,
the OH : O3 : NO3 oxidant ratios produced within the OFR
are generally not the same as the changing ambient ratios.
Therefore SOA formation in the OFR does not, and is not
meant to, reproduce in situ ambient SOA formation at each
point in time. In other words, the OFR can be used as a tool
to determine the amount of SOA from a single oxidant that
would form upon oxidation of ambient gases (both identified
and unidentified) at any time of day.
Typical OFR operation of OH oxidation using the OFR185
method is illustrated in Fig. 2, by an example of the evolu-
tion of OA and SO4 aerosol mass concentrations as OH con-
centration was cycled through the range of eq. ages. As age
increased over the first few lamp settings, OA mass increased
due to production and condensation of low-volatility species
from the oxidation of gas-phase SOA precursors. SO4 mass
remained nearly the same as in ambient air for these lower
ages. The increase of SOA mass at lower ages compared to
SO4 is thought to be due to the different rate constants for
reaction of OH. The rates with biogenic VOCs, e.g., kOH =
5.3× 10⁻¹¹ cm3 molec−1 s−1 for α-pinene (Atkinson and
Arey, 2003), are generally much faster than the reaction of
OH with SO2, where kOH = 9.49× 10⁻¹³ cm3 molec−1 s−1
(Sander et al., 2011). As the eq. age continued to increase,
OA mass enhancement decreased, eventually resulting in net
OA loss. These high ages led to a lack of formation of SOA as
well as heterogeneous oxidation of the preexisting OA, lead-
ing to fragmentation and evaporation (Ortega et al., 2015).
The amount of SO4 aerosol production increased with eq.
age and plateaued with no further production at ages above
∼ 10 days. This behavior is consistent with theory, since SO2
has a lifetime of ∼ 8 days with respect to oxidation by OH
(Sander et al., 2011). Also, as expected, SO4 aerosol (and
www.atmos-chem-phys.net/16/2943/2016/ Atmos. Chem. Phys., 16, 2943–2970, 2016

2950 B. B. Palm et al.: In situ secondary organic aerosol formation from ambient pine forest air
Figure 2. Continuous cycling of OH oxidation using the OFR185
method, compared to concurrent ambient measurements. The saw-
tooth pattern in the OFR results from OA mass enhancement at
low–intermediate OH exposure (OHexp) and decreases at the high-
est photochemical ages. SO4 mass increased monotonically with
OHexp and at higher exposures, as expected from relatively slow
SO2+OH oxidation and lack of OH destruction of SO4.
H2SO4 gas) was not consumed by excess OHexp in the same
way as OA (and SOA precursor gases).
3.2 VOC enhancement/depletion vs. eq. age
VOCs were measured before (in ambient air) and after OH
oxidation in the OFR using a PTR-TOF-MS. This showed
which VOCs were being depleted, potentially to form SOA,
as well as which products were being formed. Also, the de-
cay of VOCs after oxidation provided a direct measurement
for validation of the model-derived age estimates. A number
of likely compounds have been identified based on measure-
ments from previous campaigns at the Manitou Experimen-
tal Forest Observatory site (Kim et al., 2010; Kaser et al.,
2013b), as listed in Table 2.
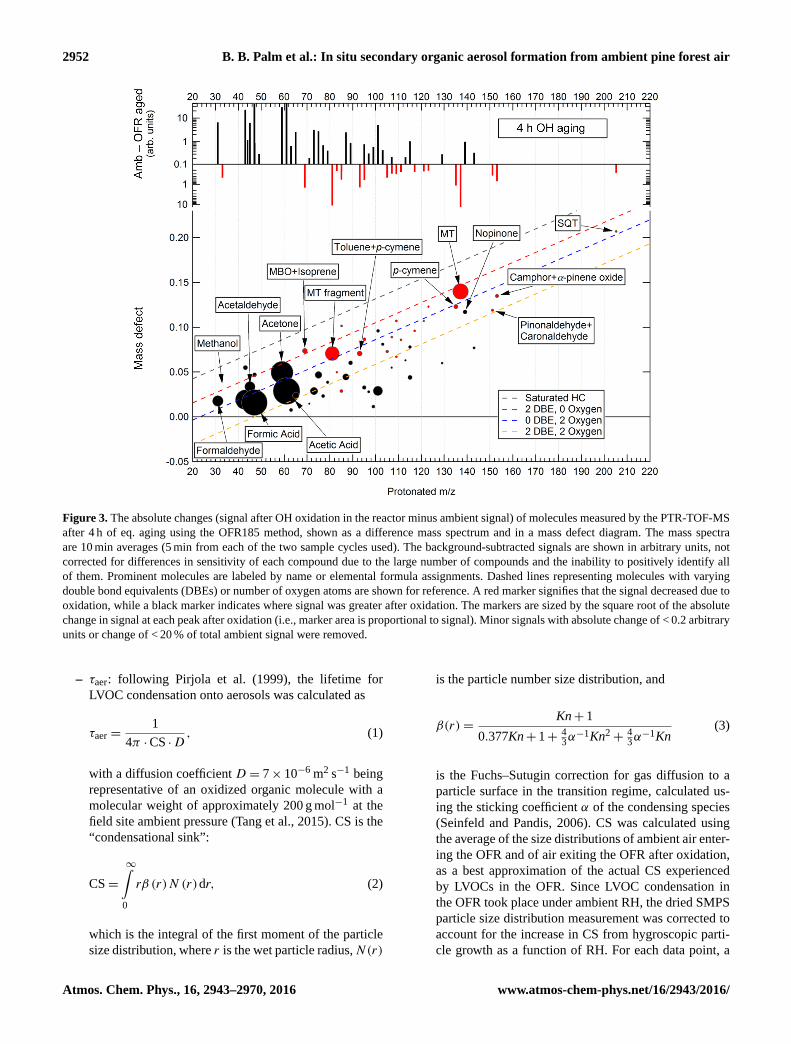
For an overview of PTR-TOF-MS measurements, the dif-
ference mass spectrum and mass defect (exact mass mi-
nus nominal mass) plots for 4 eq. h of aging during night-
time are shown in Fig. 3. The greatest absolute mag-
nitude of depletion in oxidized air compared to ambi-
ent nighttime air was observed for MT. Depletion was
also observed for toluene+p-cymene, MBO+isoprene, SQT,
pinonaldehyde+caronaldehyde, and camphor+α-pinene ox-
ide. Notably, formation of nopinone was observed after
4 eq. h of aging. OH oxidation also led to substantial produc-
tion of several relatively small oxidation product molecules,
including formaldehyde, acetaldehyde, formic acid, acetone,
and acetic acid, which have been commonly observed in sim-
ilar photooxidation experiments (e.g., Lee et al., 2006; Or-
tega et al., 2013). Many other unidentified molecules were
observed to be produced in smaller concentrations as a re-
sult of OH oxidation in the flow reactor. A similar plot is
shown for higher eq. age (7 days) in Fig. S9, for comparison
to Fig. 3. At such a high age, species such as MT, SQT, and
toluene+p-cymene were completely depleted, while many
small oxidation products increased as much as 5-fold.
In general for all degrees of oxidation, molecules with
higher positive mass defects (corresponding to more chem-
ically reduced species such as hydrocarbons) were depleted.
Conversely, molecules with lower mass defect (more oxy-
genated compounds) were formed. This trend is consistent
with what would be expected from gas-phase or hetero-
geneous OH oxidation chemistry. Also, Fig. 3 shows that
monoterpenes constituted the majority of VOCs measured by
the PTR-TOF-MS that were depleted after oxidation, while
other compounds associated with terpenoid emissions and/or
oxidation products were consumed or produced in smaller
concentrations.
The relative changes of each of the compounds discussed
above are shown as a function of OHexp in Fig. 4. As previ-
ously discussed, nopinone is an example of a compound that
increased in concentration at 4 h eq. age, indicating that it
was an oxidation product in the OFR. This signal showed
net formation at low ages (earlier than the peak of maxi-
mum SOA formation in the OFR) and eventually decreased
to net loss at high exposures, as expected due to its reactivity
with OH. Figure 4 also shows the net decay of several other
terpene-related species and the formation of smaller, more
volatile oxidation products as OHexp increased. While the
MBO+isoprene signal showed a substantial increase with in-
creasing age, this is likely due to production of an isomeric
interference, e.g., a fragment of an oxidation product.
An assessment of the reasonableness of the model-derived
OHexp (including the factor-of-2 decrease discussed in
Sect. 2.2) can be made by comparing the measured depletion
of gases vs. expected depletion using published reaction rates
with OH. This comparison is shown for an average speciated
MT mixture, toluene+p-cymene, and methanol in Fig. 4.
The MT and methanol signals decay more slowly than pre-
dicted, while the toluene+p-cymene signal decays slightly
faster. These results are consistent with the previous evalu-
ation of the model-predicted OHexp for laboratory and field
studies (Li et al., 2015). Determination of OHexp in the OFR
is limited by many factors, including model uncertainties
(Peng et al., 2015a), the true non-plug-flow residence time
distribution in the OFR, the difficulty of measuring a differ-
ence of signals using the PTR-TOF-MS in a perturbed envi-
ronment, the possibility of competing production of the mea-
sured compounds (e.g., methanol), interferences and/or false
identification of measured signal (e.g., fragments or different
species with the same elemental composition interfering with
the measured ions), and uncertainty in the relative compo-
sition of the MT and toluene+p-cymene mixtures. Despite
these uncertainties, the PTR-TOF-MS is clearly measuring
formation and decay of compounds that react with OH on
Atmos. Chem. Phys., 16, 2943–2970, 2016 www.atmos-chem-phys.net/16/2943/2016/

B. B. Palm et al.: In situ secondary organic aerosol formation from ambient pine forest air 2951
Table 2. List of prominent compounds detected by PTR-TOF-MS in the OFR. Likely compound identifications are taken from previous
measurements at the same research site, described in Kim et al. (2010) and Kaser et al. (2013b).
Protonated molecular Likely compound(s) Exact mass (m/z)
formula
CH2O-H+ Formaldehyde 31.02
CH4O-H+ Methanol 33.03
C2H4O-H+ Acetaldehyde 45.03
CH2O2-H+ Formic acid 47.01
C3H6O-H+ Acetone 59.05
C2H4O2-H+ Acetic acid 61.03
C5H8-H+ MBO(∼ 80 %)+isoprene(∼ 20 %)a 69.07
C7H8-H+ Toluene(74 %)+p-cymene(26 %)b 93.07
C10H14-H+ p-Cymene 135.12
C10H16-H+ MT 137.13, 81.07
C9H14O-H+ Nopinone 139.11
C10H14O-H+ Pinonaldehyde(-H2O),caronaldehyde(-H2O) 151.11
C10H16O-H+ Camphor+α-pinene oxide 153.13
C15H24-H+ SQT 205.20
a Karl et al. (2012), Kaser et al. (2013a).b Kaser et al. (2013a).
the timescale of several hours of photochemical age. This is
strong evidence that the OFR can be used to study a wide
range of atmospherically relevant timescales.
3.3 Fate of condensable gases in an OFR
3.3.1 Modeled low-volatility organic compound
(LVOC) fate
In order to properly interpret SOA formation as a function
of age in an OFR, the timescales of various competing pro-
cesses need to be carefully considered in the context of the
relative importance of those processes in the OFR vs. the
atmosphere. When organic gases are oxidized in the OFR,
they can form LVOCs, a term used here to describe organic
gases with volatilities that are low enough to (effectively) ir-
reversibly condense onto particles or surfaces. In the atmo-
sphere, the dominant fate of these LVOCs is to condense
onto aerosols (lifetime of ∼minutes), as dry and wet de-
position of even fast-depositing species are generally slower
sinks (lifetime of ∼ hours; Farmer and Cohen, 2008; Knote
et al., 2015; Nguyen et al., 2015). However, due to the dif-
ferent timescales, the LVOCs formed in the OFR can have
other fates besides condensation onto aerosols. These include
condensational loss to the walls of the OFR, further reaction
with OH to produce either condensable or non-condensable
gas-phase products, or exiting the reactor in the gas phase
(where they will almost entirely condense on the sampling
tube walls, due to the large surface-area-to-volume ratio). If
the LVOCs condense onto aerosols, then they are measured
by the AMS+SMPS. However, if they are subject to one of
the other three fates, then the AMS+SMPS measurements
will underestimate the amount of SOA that would form in
the atmosphere at the same level of OH exposure. Similar to
loss of gases to large Teflon chamber walls (e.g., Matsunaga
and Ziemann, 2010), these other three fates are experimental
limitations of the OFR technique that need to be corrected
in order to relate OFR measurements to real atmospheric
SOA formation processes. As mentioned above, this correc-
tion takes into account that dry deposition of such LVOCs
is not competitive with condensation onto particles in the
atmosphere (Knote et al., 2015; Nguyen et al., 2015). Note
that this section pertains to gas-phase losses, while a correc-
tion for particle losses to the OFR walls was also included
as described in Sect. S3. The need for an LVOC correction
to OFR measurements has been suggested before (Lambe et
al., 2011a, 2015), but to our knowledge this work is the first
attempt to apply one.
In this analysis, we calculate approximate lifetimes of
LVOCs for condensation onto aerosols (τaer), loss to the walls
of the OFR (τwall), and reaction with OH (τOH) as a function
of OHexp. Some semivolatile species (SVOCs) will likely
also be produced. However, we focus on irreversibly con-
densing LVOCs, both for simplicity and based on the ob-
servation that most of the OA has low volatility at this site,
according to thermal denuder measurements (Hunter et al.,
2016) and consistent with measurements at other locations
(Cappa and Jimenez, 2010; Lopez-Hilfiker et al., 2016). If
the low volatility of OA is a result of condensation of SVOC
followed by fast particle-phase reactions to produce low-
volatility species, then the distinction between LVOCs and
SVOCs would be irrelevant for this analysis. The lifetimes of
LVOCs against different processes are estimated as follows:
www.atmos-chem-phys.net/16/2943/2016/ Atmos. Chem. Phys., 16, 2943–2970, 2016
2952 B. B. Palm et al.: In situ secondary organic aerosol formation from ambient pine forest air
Figure 3. The absolute changes (signal after OH oxidation in the reactor minus ambient signal) of molecules measured by the PTR-TOF-MS
after 4 h of eq. aging using the OFR185 method, shown as a difference mass spectrum and in a mass defect diagram. The mass spectra
are 10 min averages (5 min from each of the two sample cycles used). The background-subtracted signals are shown in arbitrary units, not
corrected for differences in sensitivity of each compound due to the large number of compounds and the inability to positively identify all
of them. Prominent molecules are labeled by name or elemental formula assignments. Dashed lines representing molecules with varying
double bond equivalents (DBEs) or number of oxygen atoms are shown for reference. A red marker signifies that the signal decreased due to
oxidation, while a black marker indicates where signal was greater after oxidation. The markers are sized by the square root of the absolute
change in signal at each peak after oxidation (i.e., marker area is proportional to signal). Minor signals with absolute change of < 0.2 arbitrary
units or change of < 20 % of total ambient signal were removed.
– τaer: following Pirjola et al. (1999), the lifetime for
LVOC condensation onto aerosols was calculated as
τaer =1
4π ·CS ·D, (1)
with a diffusion coefficient D = 7× 10⁻⁶ m2 s−1 being
representative of an oxidized organic molecule with a
molecular weight of approximately 200 g mol−1 at the
field site ambient pressure (Tang et al., 2015). CS is the
“condensational sink”:
CS=
∞∫0
rβ (r)N (r)dr, (2)
which is the integral of the first moment of the particle
size distribution, where r is the wet particle radius,N(r)
is the particle number size distribution, and
β(r)=Kn+ 1
0.377Kn+ 1+ 43α−1Kn2+
43α−1Kn
(3)
is the Fuchs–Sutugin correction for gas diffusion to a
particle surface in the transition regime, calculated us-
ing the sticking coefficient α of the condensing species
(Seinfeld and Pandis, 2006). CS was calculated using
the average of the size distributions of ambient air enter-
ing the OFR and of air exiting the OFR after oxidation,
as a best approximation of the actual CS experienced
by LVOCs in the OFR. Since LVOC condensation in
the OFR took place under ambient RH, the dried SMPS
particle size distribution measurement was corrected to
account for the increase in CS from hygroscopic parti-
cle growth as a function of RH. For each data point, a
Atmos. Chem. Phys., 16, 2943–2970, 2016 www.atmos-chem-phys.net/16/2943/2016/

B. B. Palm et al.: In situ secondary organic aerosol formation from ambient pine forest air 2953
Figure 4. Relative changes in prominent PTR-TOF-MS compounds as a function of photochemical age using the OFR185 method:
(a) toluene+p-cymene and terpene-related signals compared to nighttime OA enhancement using the OFR185 method (not LVOC fate
corrected), and (b) oxidation products formed in the OFR. For comparison, dashed lines indicate theoretical depletion of an equal mix of
α-pinene, β-pinene, and 3-carene (the three major MT at this site; Kim et al., 2010; Ortega et al., 2014); a 74 : 26 mix of toluene+p-cymene
(Kaser et al., 2013a); and methanol.
growth factor (gf) was calculated from the equation
κ =∑
εiκi = (gf3− 1)(1− aw)a
−1w (4)
from Petters and Kreidenweis (2007) and Nguyen et
al. (2015), where εi is the volume fraction of aerosol
species i, κi is the hygroscopicity parameter of aerosol
species i, κ is the hygroscopicity parameter of the to-
tal aerosol, and aw is water activity. We approximate
aw as being equal to RH, between 0 and 1. Total κ
was estimated using κOA = 0.13 as previously reported
for this site and campaign (Levin et al., 2014) and
κinorganic = 0.6, using the volume mixing rule (Petters
and Kreidenweis, 2007). The volume fractions were cal-
culated from AMS measurements in ambient air or af-
ter OFR oxidation, using estimated component densi-
ties (Salcedo et al., 2006; Kuwata et al., 2012). The gf
ranged between 1 and 2.3 with an average of 1.2. It was
applied to the dry SMPS particle diameter before cal-
culating CS. The correction β(r) is a function of the
Knudsen number:
Kn=λg
r, (5)
where λg is the mean free path of the condensing gas.
Based on previous modeling and measurements, we as-
sume α = 1 for LVOCs (Kulmala and Wagner, 2001;
Julin et al., 2014; Krechmer et al., 2015). A sensitivity
study on the values of D, the impact of deviations from
α = 1, and the choice of SMPS size distribution used to
calculate CS is discussed below in Sect. 3.6.3.
www.atmos-chem-phys.net/16/2943/2016/ Atmos. Chem. Phys., 16, 2943–2970, 2016

2954 B. B. Palm et al.: In situ secondary organic aerosol formation from ambient pine forest air
– τwall: following McMurry and Grosjean (1985), we es-
timate the first-order rate of LVOC loss to the walls of
the OFR limited by eddy diffusion as
kwall =1
τwall
=A
V·
2
π·
√keD, (6)
which is the version of this equation that is valid when
α is sufficiently large (i.e., greater than ∼ 10−5). We
used the measured OFR surface-area-to-volume ratio
of A/V = 25 m−1 and a coefficient of eddy diffusion
ke = 0.0036 s−1 (much faster than the coefficient D es-
timated above), estimated by extrapolating values given
in McMurry and Grosjean (1985). The choice of ke
is included in the sensitivity analysis in Sect. 3.6.3.
Equation (6) results in an estimated wall loss rate of
0.0025 s−1 (τwall = 400 s), similar to the lifetime of
∼ 600 s estimated for this type of OFR in Lambe et
al. (2011a). In the absence of any CS and oxidant, an
upper limit of approximately 30 % of LVOCs would be
lost to the walls and the balance would exit the reac-
tor and be lost to the tubing walls. When including this
campaign’s average integrated dry particle surface area
of 63 µm2 cm−3 (with number mode at ∼ 50 nm) in the
calculation, the percentage lost to the walls decreases by
only a few percent to 26 %. If using an integrated parti-
cle surface area of 500 µm2 cm−3 that might be found in
an urban, pollution source, or lab study, the percentage
drops to 15 %.
– τOH: to estimate the loss of LVOCs to non-condensable
products due to continued reaction with OH, τOH, we
make the assumption that LVOCs will remain avail-
able to condense on aerosols or walls, or to exit
the reactor for up to five generations of OH reac-
tion. After they have reacted five times with OH, they
are deemed lost by fragmentation into small oxidized
molecules that are too volatile to condense. Further, we
assume a rate constant for reaction with OH (on the
order of that for an oxygenated molecule with 10 car-
bon atoms and no C=C double bonds) of kOH = 1×
10−11 cm3 molec−1 s−1 (Ziemann and Atkinson, 2012),
so
τOH =5
kOH · [OH]. (7)
Sensitivity studies for variations in parameters kOH and the
number of reactions with OH before LVOCs fragment to non-
condensable products are also discussed in Sect. 3.6.3.
These three lifetimes are combined to determine the total
lifetime of loss of LVOCs to these three combined pathways:
τtotal =
(1
τaer
+1
τwall
+1
τOH
)−1
. (8)
This total lifetime is compared to the average OFR residence
time τOFR (OFR volume divided by flow rate) to determine
the fraction of LVOCs that exits the OFR without reaching
one of the three other fates (and thus condenses onto sam-
pling line walls):
Fexit = e−τOFRτtotal . (9)
The fraction of LVOCs that is lost to each pathway inside the
OFR is then
Fx = (1−Fexit) ·
(kx
ktotal
), (10)
where the rate constant kx = τ−1x and x =wall, OH, or
aerosol (aer).
Figure 5c compares all of the LVOC lifetimes and frac-
tional fates as a function of age and OHexp, with a typ-
ical OFR residence time of 140 s shown for comparison.
The fractional fates are shown using high (Fig. 5a) and low
(Fig. 5b) rates of condensation to aerosol, based on typical
higher and lower aerosol surface areas during this partic-
ular campaign. As discussed below (Sect. 3.5), OH oxida-
tion leads to a substantial increase in the number of small
particles when gas-phase precursors are available. This in
turn increases the surface area available for condensation of
LVOCs, and therefore τaer depends on the amount of SOA
formed from OH oxidation in the OFR in addition to the
ambient particle surface area. During times of low SOA for-
mation (< 0.3 µg m−3), total dry surface area concentrations
after oxidation are similar to ambient concentrations in the
range of 30–100 µm2 cm−3, and τaer is estimated to be ap-
proximately 400 s or longer. However, during times with
> 1.5 µg m−3 SOA formation, total dry surface area concen-
trations increase to 100–400 µm2 cm−3 or larger and τaer be-
comes < 100 s.
For an eq. age of 0.1 day, as little as 20 % of the LVOCs
formed in the OFR are predicted to condense onto aerosols,
with the rest being lost to the walls in or after the OFR. How-
ever, the majority of LVOCs are likely not produced until
higher OHexp, concurrent with the highest SOA production.
As eq. age increases into the 0.2–3 day range, condensation
onto aerosols can account for as much as 75 % of LVOC fate,
provided there is enough SOA formation to sufficiently in-
crease the total particle surface area. In this case, shown in
Fig. 5a, the remaining 25 % of LVOCs are approximately
equally split between loss to the walls, exiting the OFR, and
reacting with OH more than five times. However if sufficient
particle surface area is not formed, as in Fig. 5b, then still
only 20 % of LVOCs will condense onto aerosols.
For the conditions analyzed here from the BEACHON-
RoMBAS campaign, these calculations suggest that, when
there were enough gas-phase precursors to produce
> 1.5 µg m−3 SOA, it is likely that the majority of this aerosol
(up to ∼ 75 %) would be produced and measured in the OFR
despite the perturbed timescales. When there were relatively
few gas-phase precursors and little SOA was formed, it is
likely that a majority of the LVOCs were not able to condense
Atmos. Chem. Phys., 16, 2943–2970, 2016 www.atmos-chem-phys.net/16/2943/2016/

B. B. Palm et al.: In situ secondary organic aerosol formation from ambient pine forest air 2955
Figure 5. Fractional fates of loss of LVOCs to OFR walls, condensation to aerosols, reaction with OH to produce volatile products, or exiting
the OFR to be lost on sampling line walls as a function of photochemical age for (a) high-CS and (b) low-CS cases; (c) LVOC lifetimes
for each of these pathways. Lifetime for condensation to aerosols is shown for all data points (colored by OA enhancement after oxidation)
using CS calculated from SMPS measurements.
into SOA during the reactor residence time. However, if there
were few precursors to begin with, the absolute amount of
potential SOA mass that would not have time to condense
would still be relatively small, limiting the effect of this cor-
rection on the objectives of this study.
Another important conclusion from this analysis is that
for high eq. ages > 10 days, a very small fraction of the
LVOCs formed (< 10 %) will condense to form new SOA.
The remainder will react many times with OH before having
a chance to condense, likely leading to smaller fragmenta-
tion products that are too volatile to condense into SOA. This
is, of course, different from what occurs in the atmosphere,
where LVOCs would typically have sufficient time for con-
densation to aerosols under most conditions. Since this rapid
oxidation will remove any semivolatile vapors from the gas
phase, semivolatile OA molecules will begin to evaporate
to reestablish equilibrium partitioning. However, measure-
ments of evaporation kinetics for ambient and lab-generated
SOA suggest that evaporation is too slow to account for
the changes measured during the short OFR residence time
(Vaden et al., 2011). Furthermore, thermodenuder measure-
ments have shown that only a small fraction (∼ 20 %) of am-
bient OA would be susceptible to evaporation due to removal
of the gas-phase molecules (Cappa and Jimenez, 2010; Or-
tega et al., 2015). Therefore, heterogeneous oxidation of the
preexisting OA by OH likely dominates the measured OA
depletion at very high eq. ages (DeCarlo et al., 2008; Ortega
et al., 2015).
3.3.2 Model validation: sulfuric acid (H2SO4)
condensation
In addition to LVOCs, H2SO4 can also be produced in the
OFR from OH oxidation of SO2. H2SO4 molecules can also
condense onto OFR or sampling line walls (but not be lost
www.atmos-chem-phys.net/16/2943/2016/ Atmos. Chem. Phys., 16, 2943–2970, 2016

2956 B. B. Palm et al.: In situ secondary organic aerosol formation from ambient pine forest air
Figure 6. Measured vs. predicted SO4 formation after OH oxidation
in an OFR. The data points are colored by the fraction of H2SO4
predicted to condense on aerosols, calculated using α = 0.65 and
the average of the SMPS size distributions measured before and
after oxidation. Data are shown with the LVOC fate correction ap-
plied, along with linear fits to the corrected (red) and uncorrected
(black) data. Ambient SO2 concentrations < 0.2 ppb have been ex-
cluded from this analysis.
to further reaction with OH). These limitations of the OFR
technique need to be corrected in order to relate OFR mea-
surements to real atmospheric processes. H2SO4 formation
is an analogous yet much simpler system compared to LVOC
formation, so it can be used to validate the LVOC fate model.
If the H2SO4 condenses onto aerosols, it will be measured
as SO4 aerosol by the AMS. SO4 aerosol formation in the
OFR was predicted by using estimated OHexp to calculate
how much ambient SO2 would be oxidized into H2SO4. The
LVOC fate model was then used to determine Faer, Fwall,
and Fexit for H2SO4, while FOH was set equal to 0 since
gas-phase H2SO4 will not continue to react with OH to pro-
duce volatile fragments. We used D = 1× 10⁻⁵ m2 s−1 for
an H2SO4 molecule hydrated by H2O molecules in the gas
phase at the relevant ambient pressure and humidity (Han-
son and Eisele, 2000) and the best-fit value of α = 0.65 from
Pöschl et al. (1998). An additional minor correction was ap-
plied to account for the fact that the SO2+OH reaction is
relatively slow, so the effective τOFR for H2SO4 molecules
in the reactor can be less than the full OFR residence time
depending on OHexp. Using the model results, the fraction of
H2SO4 that does not condense onto aerosol was corrected for
by dividing the newly produced SO4 mass measured with the
AMS by Faer.
The measured vs. predicted SO4 enhancement after OH
oxidation in the OFR using the OFR185 method is shown
in Fig. 6. The AMS measured 61 % of the predicted SO4 en-
hancement. After applying the correction for H2SO4 wall and
sampling line losses as described in the previous paragraph,
the measured and predicted SO4 enhancements agreed well,
with a slope of 0.81, and R2 slightly increased from 0.80 to
0.85. To illustrate the sensitivities of this model to key uncer-
tain parameters, the effects of using the range of α = 0.43–1
given in Pöschl et al. (1998) and using the size distributions
before or after oxidation in the OFR (as lower and upper
bounds of CS) are shown in Fig. S10. Generally, the amount
of SO4 formed after applying the H2SO4 wall and sampling
line loss correction was consistent with the expected amount
within the uncertainties. The amount of scatter introduced
by applying the correction was larger when the amount of
SO4 produced (and predicted) was close to 0, when the Faer
correction factor was less than ∼ 0.3. This suggests that the
LVOC fate model becomes more uncertain when the correc-
tion factors are large and Faer is close to 0. However, this
analysis demonstrates that a correction can be successfully
applied for H2SO4 condensation, and that a similar correc-
tion should also be applied for LVOC condensation to accu-
rately interpret the results of SOA formation in an OFR.
In the subsequent analyses, SOA formation is presented
both applying and without applying a correction to account
for incomplete LVOC condensation to aerosol in the reac-
tor. The correction, hereafter referred to as the “LVOC fate
correction”, is applied by dividing the amount of SOA mass
formed by Faer. The correction is only applied for data with
eq. age < 5 days. At higher exposures, it becomes unfeasible
to apply the correction, because dividing small SOA mass
formation by small fractions of condensation on aerosol re-
sults in large uncertainties. Instead, only uncorrected data are
shown for eq. age > 5 days, and they are interpreted as being
dominated by heterogeneous oxidation.
3.4 SOA mass enhancement vs. OHexp
Both the concentrations and relative fractions of ambient
SOA precursor gases changed between day and night. They
were dominated by MBO+isoprene (under ambient OH
chemistry) during the day and by MT+SQT (under ambient
O3/NO3 chemistry) at night (Fry et al., 2013). SOA will be
formed in the OFR from these changing VOC mixtures and
any other gases present in the ambient air that enters the re-
actor, so it might be expected that different amounts of SOA
production would be observed during daytime vs. nighttime.
Figure 7 shows daytime and nighttime OA enhancement as a
function of eq. age and OHexp. During all times of the day,
OA enhancement was largest in the range of 0.4–1.5 eq. days
of photochemical aging, hereafter referred to as the age range
of maximum OA enhancement. The diurnal profile of the OA
enhancement in this range (inset of Fig. 7) shows that the
maximum OA enhancement follows a pattern that is more
nuanced than strictly daytime vs. nighttime, with a peak of
SOA production in the early morning. Net loss of OA was ob-
served above 10 eq. days of aging, consistent with the LVOC
Atmos. Chem. Phys., 16, 2943–2970, 2016 www.atmos-chem-phys.net/16/2943/2016/

B. B. Palm et al.: In situ secondary organic aerosol formation from ambient pine forest air 2957
fate model and the interpretation that heterogeneous oxida-
tion dominates at high eq. ages. This is also consistent with
previous studies of heterogeneous OH oxidation of OA in a
flow tube (George et al., 2008) and with results with the OFR
in the Los Angeles urban area (Ortega et al., 2015).
As shown in Fig. 7, OA enhancement shows a strong dif-
ference between daytime and nighttime. However, SOA for-
mation potential in the OFR should not be a function of time
of day itself. Rather, this is thought to be a coincidental de-
pendence based on the SOA precursor gas concentrations
that change in a diurnal manner. In other words, this OH ox-
idation in the OFR is not meant to reproduce true ambient
nighttime chemistry; rather it allows us to measure SOA for-
mation from OH oxidation of the true mix of ambient gases
as it evolves with time of day, including nighttime. In fact,
the lack of ambient nighttime OH oxidation may help ex-
plain the increased SOA formation potential when nighttime
air is oxidized by OH in the OFR.
These measurements were made in a pine forest dominated
by MT (Ortega et al., 2014). As an alternative to separating
by time of day, the data are separated by ambient MT con-
centrations in Fig. 8. The magnitude of SOA formation in-
creased with ambient MT concentrations, ranging from no
formation up to greater than 6 µg m−3 OA enhancement (up
to 3 µg m−3 enhancement without the LVOC fate correction).
For the range of ages with maximum OA enhancement (0.4–
1.5 eq. days), a correlation is observed between OA enhance-
ment and MT concentrations (R2= 0.56). Of course, MT
may not be the only important precursors driving this cor-
relation. Other gases that are correlated with MT, e.g., SQT
(R2= 0.70 with MT, shown in Fig. S11) or MT reaction
products, may also contribute to the observed correlations.
Although MT emissions are strongest during daytime due to
their positive temperature dependence, their concentrations
are higher at night due to the shallower nighttime boundary
layer and reduced oxidation rate (Kim et al., 2010).
We observed much less SOA formation during the day-
time, when concentrations of MBO+isoprene peaked but
MT concentrations were lower. We note that SOA forma-
tion mechanisms that involve heterogeneous uptake followed
by multiphase reactions are not efficiently simulated by the
OFR, as their timescales are not shortened proportionally to
increased OH concentrations (Hu et al., 2016). This includes
the isoprene epoxydiol (IEPOX) pathway from isoprene
(Paulot et al., 2009) and the similar pathway proposed for
MBO (Zhang et al., 2012). While SOA formation from iso-
prene in an OFR has been demonstrated (Lambe et al., 2015),
the total SOA formation potential from MBO+isoprene may
be underestimated in our study.
OA enhancement from the OFR185 and OFR254-70
modes of operation are compared in Fig. 7. Because these
were performed with the same physical reactor, we could
only perform one of them at a time (see Fig. S7). Since ambi-
ent MT concentrations changed over the course of the cam-
paign and they correlated with the amount of SOA formed
in the reactor, this effect needed to be corrected before the
results of the two reactor modes could be compared. The
positive OA enhancement for the OFR254-70 data was mul-
tiplied by the ratio of average MT concentrations between
the OFR185 and OFR254-70 periods (a factor of 1.8). From
Fig. 7, we conclude that there were no major differences
in the amount of SOA formation between the OFR185 and
OFR254-70 methods over the range of ages measured in
this campaign. Minor differences in SOA formation between
the two methods are likely a result of limits on the ability
to determine the proper eq. age (especially for low ages in
OFR254-70 as discussed in Sect. 2.3) or due to real changes
in ambient SOA precursor gases, since the measurements us-
ing each method were not simultaneous. Additional compar-
isons of both methods sampling the same air, carefully de-
signed and controlled to more accurately determine low ages
in OFR254-70, would be useful to further explore this issue.
Since the OFR185 mode is experimentally simpler and does
not require addition of O3 (with associated issues of mixing,
dilution, possible contamination, etc.), and since the OFR185
mode more faithfully simulates OH chemistry due to reduced
O3 concentrations (Peng et al., 2015b), we recommend the
OFR185 mode of operation for future OFR studies of OH
oxidation in forested areas.
3.5 Condensation vs. nucleation in the OFR
When gas-phase molecules are oxidized and achieve a low
enough volatility, they can condense onto existing particles
(or other surfaces) or nucleate/grow new particles. The dif-
ference can be important experimentally because nucleation
may produce some particles too small for the size range of
the AMS, and it also increases surface area more efficiently
than condensation to preexisting particles. Changes in the
size distributions measured by the SMPS are used here to
investigate the relative importance of these processes.
Particle volume size distributions of air oxidized over the
full range of eq. photochemical ages in the flow reactor are
shown in Fig. 9, during a period with relatively large OA en-
hancement in order to clearly demonstrate the behavior. OH
oxidation in the reactor resulted in substantial new particle
formation and growth, as well as growth of the preexisting
ambient particles. The maximum enhancement in both parti-
cle modes occurred at an eq. age of ∼ 1 day, consistent with
AMS measurements of total mass enhancement. At higher
ages, the new particle mode decreased in magnitude and di-
ameter and eventually was not present at the highest ages.
This is consistent with the results of the LVOC fate model,
where at high eq. ages organic gases are rapidly oxidized
into smaller volatile products that do not condense. The accu-
mulation mode was also depleted at higher eq. ages, consis-
tent with heterogeneous oxidation leading to fragmentation
and evaporation of OA. The observed nucleation at lower eq.
ages likely results from some combination of H2SO4 and ex-
www.atmos-chem-phys.net/16/2943/2016/ Atmos. Chem. Phys., 16, 2943–2970, 2016

2958 B. B. Palm et al.: In situ secondary organic aerosol formation from ambient pine forest air
Figure 7. Comparison of absolute OA enhancement from OH oxidation using the OFR185 and OFR254-70 methods, binned by photochem-
ical age and separated into daytime (08:00–20:00 LT) and nighttime (20:00–08:00 LT) to reflect the changes in ambient SOA precursors
between day and night. Data are shown with (right axis, open symbols, and dashed lines) and without (left axis, closed symbols, and solid
lines) the LVOC fate correction described in Sect. 3.3. Inset: the maximum OA enhancement (all data 0.4–1.5 days eq. age) as a function
of time of day, with (dashed) and without (solid) the LVOC fate correction. OFR254-70 measurements with positive OA enhancement were
multiplied by the ratio of ambient MT concentrations measured during OFR185 vs. OFR254-70 sampling periods (ratio= 1.8). Negative OA
enhancements were not normalized in this way since the amount of mass lost due to heterogeneous oxidation would not necessarily correlate
with ambient MT concentrations.
tremely low volatility organic compounds (ELVOCs; Kirkby
et al., 2011; Ehn et al., 2014).
For the data shown in Fig. 9, a larger fraction of SOA
molecules condensed onto the freshly nucleated particle
mode than onto the preexisting particles. This behavior likely
depends on the availability and position of the CS in the size
distribution. With the small aerosol concentrations during
this campaign, the CS from the new small particles some-
times competed with the CS from ambient particles. During
periods when the CS entering the OFR in ambient air was
larger, it reduced the condensation of SOA onto new parti-
cles, consistent with the lower importance of this mode for
an OFR study in the Los Angeles area (Ortega et al., 2015).
These results support the possibility of using flow reactors to
study the potential for new particle formation and growth in
different ambient air masses and sources (Ezell et al., 2014;
Chen et al., 2015).
3.6 Sources of SOA in ambient air
3.6.1 SOA mass formed vs. mass predicted from VOCs
Many previous studies have measured the yields of SOA
from oxidation of VOCs in chambers. Those experiments
were generally performed under controlled conditions, with
detailed information about the type and amount of VOCs
available to form SOA at the beginning of the experiment.
In this study, we also measured the yield of SOA from oxida-
tion of organic gases, but in this case we started with a com-
plex mixture of ambient organic gases, with some species not
being directly measured or speciated. Therefore, the method
Atmos. Chem. Phys., 16, 2943–2970, 2016 www.atmos-chem-phys.net/16/2943/2016/
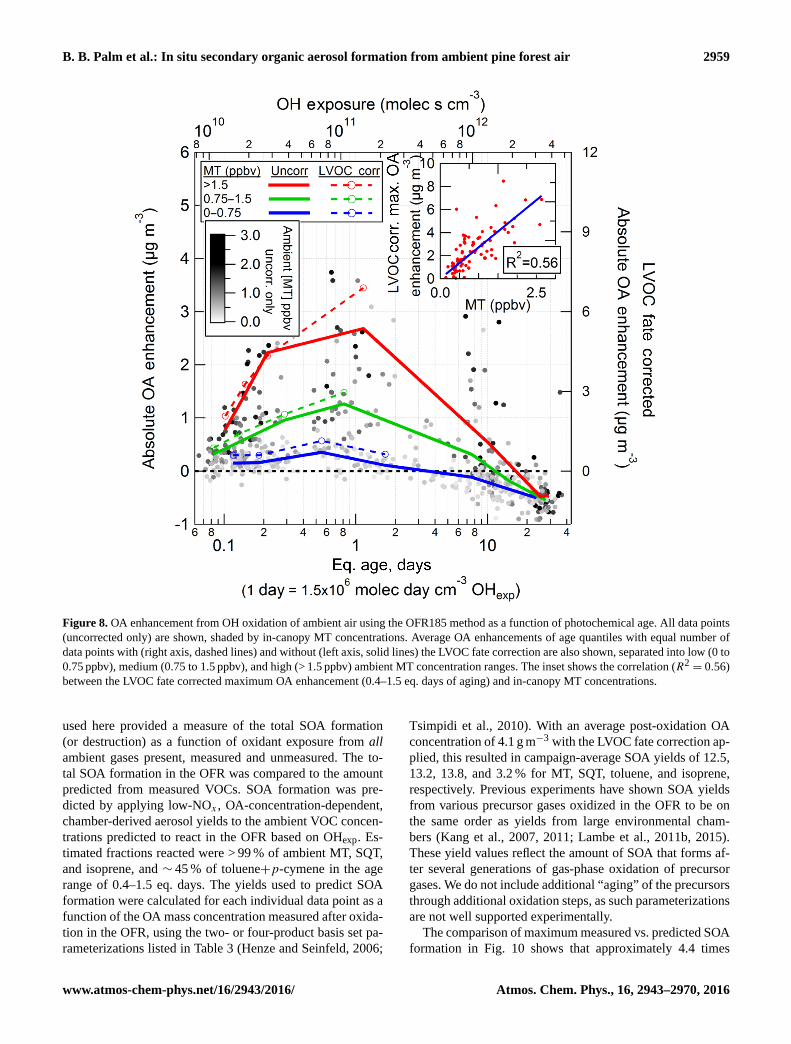
B. B. Palm et al.: In situ secondary organic aerosol formation from ambient pine forest air 2959
Figure 8. OA enhancement from OH oxidation of ambient air using the OFR185 method as a function of photochemical age. All data points
(uncorrected only) are shown, shaded by in-canopy MT concentrations. Average OA enhancements of age quantiles with equal number of
data points with (right axis, dashed lines) and without (left axis, solid lines) the LVOC fate correction are also shown, separated into low (0 to
0.75 ppbv), medium (0.75 to 1.5 ppbv), and high (> 1.5 ppbv) ambient MT concentration ranges. The inset shows the correlation (R2= 0.56)
between the LVOC fate corrected maximum OA enhancement (0.4–1.5 eq. days of aging) and in-canopy MT concentrations.
used here provided a measure of the total SOA formation
(or destruction) as a function of oxidant exposure from all
ambient gases present, measured and unmeasured. The to-
tal SOA formation in the OFR was compared to the amount
predicted from measured VOCs. SOA formation was pre-
dicted by applying low-NOx , OA-concentration-dependent,
chamber-derived aerosol yields to the ambient VOC concen-
trations predicted to react in the OFR based on OHexp. Es-
timated fractions reacted were > 99 % of ambient MT, SQT,
and isoprene, and ∼ 45 % of toluene+p-cymene in the age
range of 0.4–1.5 eq. days. The yields used to predict SOA
formation were calculated for each individual data point as a
function of the OA mass concentration measured after oxida-
tion in the OFR, using the two- or four-product basis set pa-
rameterizations listed in Table 3 (Henze and Seinfeld, 2006;
Tsimpidi et al., 2010). With an average post-oxidation OA
concentration of 4.1 g m−3 with the LVOC fate correction ap-
plied, this resulted in campaign-average SOA yields of 12.5,
13.2, 13.8, and 3.2 % for MT, SQT, toluene, and isoprene,
respectively. Previous experiments have shown SOA yields
from various precursor gases oxidized in the OFR to be on
the same order as yields from large environmental cham-
bers (Kang et al., 2007, 2011; Lambe et al., 2011b, 2015).
These yield values reflect the amount of SOA that forms af-
ter several generations of gas-phase oxidation of precursor
gases. We do not include additional “aging” of the precursors
through additional oxidation steps, as such parameterizations
are not well supported experimentally.
The comparison of maximum measured vs. predicted SOA
formation in Fig. 10 shows that approximately 4.4 times
www.atmos-chem-phys.net/16/2943/2016/ Atmos. Chem. Phys., 16, 2943–2970, 2016
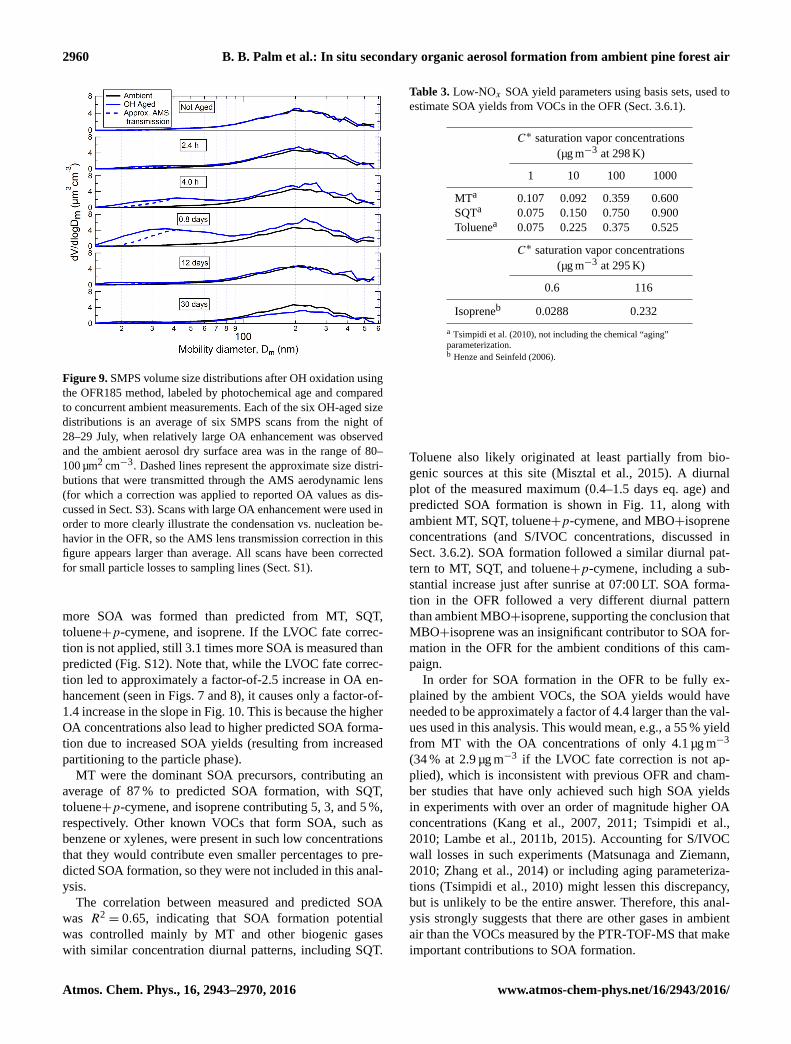
2960 B. B. Palm et al.: In situ secondary organic aerosol formation from ambient pine forest air
Figure 9. SMPS volume size distributions after OH oxidation using
the OFR185 method, labeled by photochemical age and compared
to concurrent ambient measurements. Each of the six OH-aged size
distributions is an average of six SMPS scans from the night of
28–29 July, when relatively large OA enhancement was observed
and the ambient aerosol dry surface area was in the range of 80–
100 µm2 cm−3. Dashed lines represent the approximate size distri-
butions that were transmitted through the AMS aerodynamic lens
(for which a correction was applied to reported OA values as dis-
cussed in Sect. S3). Scans with large OA enhancement were used in
order to more clearly illustrate the condensation vs. nucleation be-
havior in the OFR, so the AMS lens transmission correction in this
figure appears larger than average. All scans have been corrected
for small particle losses to sampling lines (Sect. S1).
more SOA was formed than predicted from MT, SQT,
toluene+p-cymene, and isoprene. If the LVOC fate correc-
tion is not applied, still 3.1 times more SOA is measured than
predicted (Fig. S12). Note that, while the LVOC fate correc-
tion led to approximately a factor-of-2.5 increase in OA en-
hancement (seen in Figs. 7 and 8), it causes only a factor-of-
1.4 increase in the slope in Fig. 10. This is because the higher
OA concentrations also lead to higher predicted SOA forma-
tion due to increased SOA yields (resulting from increased
partitioning to the particle phase).
MT were the dominant SOA precursors, contributing an
average of 87 % to predicted SOA formation, with SQT,
toluene+p-cymene, and isoprene contributing 5, 3, and 5 %,
respectively. Other known VOCs that form SOA, such as
benzene or xylenes, were present in such low concentrations
that they would contribute even smaller percentages to pre-
dicted SOA formation, so they were not included in this anal-
ysis.
The correlation between measured and predicted SOA
was R2= 0.65, indicating that SOA formation potential
was controlled mainly by MT and other biogenic gases
with similar concentration diurnal patterns, including SQT.
Table 3. Low-NOx SOA yield parameters using basis sets, used to
estimate SOA yields from VOCs in the OFR (Sect. 3.6.1).
C∗ saturation vapor concentrations
(µg m−3 at 298 K)
1 10 100 1000
MTa 0.107 0.092 0.359 0.600
SQTa 0.075 0.150 0.750 0.900
Toluenea 0.075 0.225 0.375 0.525
C∗ saturation vapor concentrations
(µg m−3 at 295 K)
0.6 116
Isopreneb 0.0288 0.232
a Tsimpidi et al. (2010), not including the chemical “aging”
parameterization.b Henze and Seinfeld (2006).
Toluene also likely originated at least partially from bio-
genic sources at this site (Misztal et al., 2015). A diurnal
plot of the measured maximum (0.4–1.5 days eq. age) and
predicted SOA formation is shown in Fig. 11, along with
ambient MT, SQT, toluene+p-cymene, and MBO+isoprene
concentrations (and S/IVOC concentrations, discussed in
Sect. 3.6.2). SOA formation followed a similar diurnal pat-
tern to MT, SQT, and toluene+p-cymene, including a sub-
stantial increase just after sunrise at 07:00 LT. SOA forma-
tion in the OFR followed a very different diurnal pattern
than ambient MBO+isoprene, supporting the conclusion that
MBO+isoprene was an insignificant contributor to SOA for-
mation in the OFR for the ambient conditions of this cam-
paign.
In order for SOA formation in the OFR to be fully ex-
plained by the ambient VOCs, the SOA yields would have
needed to be approximately a factor of 4.4 larger than the val-
ues used in this analysis. This would mean, e.g., a 55 % yield
from MT with the OA concentrations of only 4.1 µg m−3
(34 % at 2.9 µg m−3 if the LVOC fate correction is not ap-
plied), which is inconsistent with previous OFR and cham-
ber studies that have only achieved such high SOA yields
in experiments with over an order of magnitude higher OA
concentrations (Kang et al., 2007, 2011; Tsimpidi et al.,
2010; Lambe et al., 2011b, 2015). Accounting for S/IVOC
wall losses in such experiments (Matsunaga and Ziemann,
2010; Zhang et al., 2014) or including aging parameteriza-
tions (Tsimpidi et al., 2010) might lessen this discrepancy,
but is unlikely to be the entire answer. Therefore, this anal-
ysis strongly suggests that there are other gases in ambient
air than the VOCs measured by the PTR-TOF-MS that make
important contributions to SOA formation.
Atmos. Chem. Phys., 16, 2943–2970, 2016 www.atmos-chem-phys.net/16/2943/2016/

B. B. Palm et al.: In situ secondary organic aerosol formation from ambient pine forest air 2961
Figure 10. Measured vs. predicted SOA formation from OH oxi-
dation of ambient air in an OFR using the OFR185 method. Only
the range of photochemical ages with the highest SOA formation
(0.4–1.5 eq. days) was used, and the LVOC fate correction was ap-
plied. Predicted SOA formation was calculated by applying OA
concentration-dependent yields (average of 12.5, 13.2, 13.8, and
3.2 % for MT, SQT, toluene+p-cymene, and isoprene, respectively,
with average OA concentration of 4.1 µg m−3) to VOCs reacted in
the OFR (Henze and Seinfeld, 2006; Tsimpidi et al., 2010). The
amount of reacted VOCs was estimated using OHexp and ambient
VOC concentrations. If a nonzero y intercept is allowed, the regres-
sion line becomes y = 5.0x− 0.5.
3.6.2 SOA mass formed vs. predicted from S/IVOCs
While the lowest-volatility organic matter (i.e., OA) is mea-
sured by the AMS and the highest-volatility range (VOCs
and some IVOCs) is sampled by the PTR-TOF-MS, there
is a substantial range of S/IVOCs between them. The gases
that enter the OFR as S/IVOCs are the most likely source of
SOA formation contributing to the factor-of-4.4 discrepancy
in Sect. 3.6.1. During the BEACHON-RoMBAS campaign,
measurements were made using the TD-EIMS instrument to
quantify the bulk (volatility-resolved) ambient S/IVOC mass
(Hunter et al., 2016). Other techniques at the site identi-
fied and quantified various subsets of the S/IVOCs (Yatavelli
et al., 2014; Chan et al., 2016). All of the measurements
are compiled in Hunter et al. (2016) to determine the total
average organic volatility distribution during the campaign,
which shows that S/IVOCs were the only pool of gas-phase
species that could possibly produce as much SOA mass as
observed in our study.
The average bulk S/IVOC mass concentrations measured
with the TD-EIMS are shown as a function of log(C∗) in
Figure 11. Top: diurnal maximum measured OA enhancement (all
data from 0.4 to 1.5 eq. days of aging, LVOC fate corrected) in the
OFR from OH oxidation using the OFR185 method, and predicted
OA formation from measured VOCs (×4.4). Bottom: ambient MT,
SQT (×5), toluene+p-cymene (×5), MBO+isoprene, and S/IVOC
mass concentrations vs. time of day.
the inset of Fig. 12. In Hunter et al. (2016), this mass was
interpreted as being an approximate lower limit to S/IVOC
mass, assuming that the S/IVOCs measured by Yatavelli et
al. (2014), by Chan et al. (2016), and by the PTR-TOF-MS
were subsets of the TD-EIMS measurement. The upper limit
is to assume that each instrument measured a different set
of S/IVOCs with no overlap and would be ∼ 3.2 times larger
than the mass shown in the inset of Fig. 12. With the substan-
tial temporal overlap between OFR185 operation and TD-
EIMS measurements, it is feasible to perform a point-by-
point analysis using the full TD-EIMS time series (shown in
Fig. S7) to determine what the SOA yield of the lower-limit
S/IVOC mass would need to be in order to fully explain the
amount of SOA formed from OH oxidation in the OFR.
Ideally, the total mass of S/IVOCs at each data point that
would be converted into SOA by oxidation would be deter-
mined by multiplying the mass in each volatility bin by the
SOA yields of each bin. Since experimental measurements
of the aerosol yields of such gases are generally not available
and the ambient mixture of S/IVOCs was not fully speciated,
we instead proceed under the assumption that all of the SOA
formation that was not due to the previously discussed PTR-
TOF-MS-measured VOCs came instead from the mass mea-
sured in the C∗ = 101–107 µg m−3 volatility bins, with one
correction. Since SQT are typically in the C∗ = 105 µg m−3
range, we subtracted the SQT mass measured by the PTR-
TOF-MS from the bulk S/IVOC mass (a subtraction of 6 %
of the total TD-EIMS measurement), to avoid double count-
ing due to this expected measurement overlap. While MT are
in the C∗ = 107 µg m−3 volatility bin, that bin is at the up-
www.atmos-chem-phys.net/16/2943/2016/ Atmos. Chem. Phys., 16, 2943–2970, 2016

2962 B. B. Palm et al.: In situ secondary organic aerosol formation from ambient pine forest air
Figure 12. Measured vs. predicted SOA formation from OH oxida-
tion of ambient air in an OFR using the OFR185 method. Only the
range of photochemical ages with the highest SOA formation (0.4–
1.5 eq. days) was used, and the LVOC fate correction was applied.
Predicted SOA formation is estimated using VOCs (described in
Sect. 3.6.1) including and without including an empirical 58 % SOA
yield from S/IVOCs measured by the TD-EIMS (a lower limit of to-
tal S/IVOCs). Inset: average S/IVOC concentrations as a function of
the log of the saturation vapor concentration C∗. This comparison
includes all data for which S/IVOCs and SOA formation in the OFR
were concurrently measured (26, 28–29 July; 9–10, 12–13 August).
For some data points, PTR-TOF-MS data were not available, so the
VOC contribution was estimated using the linear fit in Fig. 10.
per volatility limit of the TD-EIMS measurement capability.
Some gases in that bin were sampled, but MT were expected
to be too volatile to be measured (Hunter et al., 2016). This
was supported by the fact that the campaign-average mass
in the C∗ = 107 µg m−3 bin was only 0.43 µg m−3, which
would correspond to only approximately 0.1 ppbv MT, if
there were no other gases in that bin. The campaign-average
in-canopy MT concentration measured by the PTR-TOF-MS
was approximately 0.8 ppbv.
For the lower-limit S/IVOC mass case, the average SOA
yield of the total S/IVOCs was determined by finding the
yield value that made the slope of SOA measured vs. pre-
dicted from VOCs+S/IVOCs equal to 1. As shown in Fig. 12,
an average SOA yield of 58 % for the bulk S/IVOC mass was
required in order to bring the measured vs. predicted SOA
formation into optimal agreement in this time series analy-
sis. The correlation between measured and predicted SOA
formation was R2= 0.66. Attempts were made to optimize
the correlation between measured and predicted SOA forma-
tion by applying arbitrary C∗-dependent yields, but this did
not result in significantly better correlations. Since speciated
S/IVOC measurements as well as yields for each volatility
bin (which may have varied with diurnal changes in the com-
position of each bin) were not available, we concluded that
further detailed interpretation of SOA production from the
measured S/IVOCs would be under-constrained
As mentioned above, this average SOA yield for S/IVOCs
of 58 % was estimated by assuming the lower-limit case
where the total ambient S/IVOC mass was sampled by the
TD-EIMS. The upper-limit mass case in Hunter et al. (2016)
assumed that the several instruments that measured S/IVOCs
were measuring different subsets of total S/IVOCs, so the
measurements needed to be summed in order to determine
the total mass concentration. Due to limited temporal overlap
between all instruments, the analysis in Hunter et al. (2016)
was performed on campaign-average measurements. For this
reason, the average SOA yield of S/IVOCs for the upper-limit
case is also done using the campaign-average values instead
of the time series analysis that was possible for the lower-
limit case. The average upper- and lower-limit S/IVOC mass
concentrations were 10 and 3.1 µg m−3. To estimate the SOA
yield of S/IVOCs in the upper-limit case, the TD-EIMS time
series data were multiplied by 3.2, so that they reflected a
campaign average of 10 µg m−3. Using this upper-limit mass
time series, an average SOA yield for S/IVOCs of 18 % was
needed to bring measured vs. predicted SOA formation in the
OFR into agreement. This makes the assumption that the ra-
tio of S/IVOC mass measured by each technique was always
constant.
While measurements of SOA yields for speciated
S/IVOCs are limited, especially for the relatively low OA
concentrations in this study, previous work suggests that
this range of 18–58 % yield is reasonable. A yield of 51 %
was measured for n-heptadecane (C∗ = 104 µg m−3) with
OA= 15.4 µg m−3 under high-NOx conditions (Presto et al.,
2010). Yields can be even higher from cyclic compounds
(Lim and Ziemann, 2009; Tkacik et al., 2012) and under low-
NOx conditions (Ng et al., 2007; Lane et al., 2008). SOA
yields from several other IVOCs (naphthalene and alkyl-
napthalenes) under low-NOx conditions were determined to
be 58–73 % with OA concentrations of 10–40 µg m−3 (Chan
et al., 2009).
This analysis suggests that OH oxidation of organic gases
in a parcel of ambient pine forest air can potentially pro-
duce approximately 3.4 times more SOA from S/IVOC gases
than from VOCs. This does not provide information about
the sources of the lower-volatility organic gases in this par-
cel. They may be directly emitted, formed as oxidation prod-
ucts of VOCs that were emitted upwind of this parcel, or
some combination of these two options. Ambient MT and
S/IVOC concentrations measured by the TD-EIMS exhibit
a modest correlation (R2= 0.43, shown in Fig. S13), sug-
gesting that the S/IVOCs may at least partially come from
a biogenic source related to the emission of MT. For exam-
ple, O3 and NO3 may react with the C=C-containing MT
and SQT emissions during nighttime, leading to a buildup of
Atmos. Chem. Phys., 16, 2943–2970, 2016 www.atmos-chem-phys.net/16/2943/2016/

B. B. Palm et al.: In situ secondary organic aerosol formation from ambient pine forest air 2963
oxidation product S/IVOCs that lack C=C double bonds and
would generally not react further with O3 and NO3 (Atkin-
son, 1997). If this occurs, then OFR oxidation is merely start-
ing with precursors that are partway through the aging pro-
cess from VOC emission to SOA formation. Variations in the
ratio of measured to predicted SOA formation in Figs. 10 and
12 could be due partly to variations in the ratio of the concen-
trations of S/IVOCs to VOCs due to changes in the meteoro-
logical or chemical conditions of the atmosphere, or from pe-
riodic changes in the biogenic and/or anthropogenic sources
of S/IVOCs. However, as shown in Fig. 11, the diurnal pro-
file of S/IVOC concentrations showed a relatively smaller
increase in concentrations at night compared to MT or mea-
sured SOA formation. Since emissions generally change with
time of day, it would not be unreasonable to expect the spe-
ciation and SOA formation potential of ambient S/IVOCs to
also change with time of day. Until the S/IVOCs in a data
set such as this can be better speciated and quantified, these
conclusions remain speculative.
3.6.3 Sensitivity to LVOC fate model parameters
The LVOC fate correction in this analysis led to a relatively
large factor-of-2.5 increase in OA enhancement and factor-
of-1.4 increase in measured vs. predicted SOA formation.
As the values of several of the model parameters are not
well constrained, in this section we investigate the sensitiv-
ity of the LVOC fate correction to these parameters. Fig-
ure 13 shows the sensitivity of the slope of measured vs.
predicted SOA formation from VOCs, as well as how that
affected the range of SOA yields needed from S/IVOCs in
order to explain the total SOA formation in the OFR. Sensi-
tivity was tested for the following parameters: kOH; the num-
ber of reactions with OH before LVOCs are lost to volatile,
non-condensable products; the SMPS size distribution used
to calculate CS; α; ke; and D.
The least-well-defined parameters in the model were likely
kOH and the number of reactions with OH, especially since
the analysis of H2SO4 condensation in Sect. 3.3.2 did not use
them. However, the LVOC fate correction was relatively in-
sensitive to these parameters, specifically for values of kOH
less than 3× 10⁻¹¹ cm3 molec−1 s−1 or when assuming 2+
reactions with OH. If we assume LVOCs always remain
available to condense and never fragment, the slope reaches
a lower asymptote of 4.1. The model also showed a relatively
low sensitivity to ke andD over several orders of magnitude.
The slope of measured vs. predicted SOA formation was
more sensitive to the choice of CS and α. The slope is mainly
sensitive to CS when approaching the ambient (smaller)
value. Since using the average value of CS worked well for
the H2SO4 analysis (and the ambient CS gave poor results
there), it is likely that the average CS is at least close enough
to the proper value as not to cause systematic biases. Using
values of α less than 1 led to a rapid increase in the magnitude
of the LVOC fate correction. Values less than approximately
Figure 13. Sensitivity of the slope of measured vs. predicted SOA
formation from VOCs, and of the range of SOA yields estimated
for bulk S/IVOCs (same curves, different y axes), to parameters in
the LVOC fate model. The change in slope and yields is calculated
by changing only one parameter at a time while keeping the rest
at the following base case values: five reactions with OH, kOH =
1× 10⁻¹¹ cm3 molec−1 s−1, average of CS measured in ambient
air and after OFR oxidation, α = 1, ke = 0.0036 s−1, and D = 7×
10−6 m2 s−1.
α = 0.1 would require the SOA yield from S/IVOCs to ap-
proach 100 % as a lower limit, which is unlikely to be the
case. In other words, if the sticking coefficient were very low
(e.g., α < 0.1), it would be impossible to explain the amount
of SOA formed from the carbon present in the gas phase. This
suggests that α = 1 or close to 1 is a good approximation for
the conditions in the OFR in this campaign and allows us to
rule out values much lower than 1.
It is noteworthy that none of the changes to these four pa-
rameters led to a substantial decrease in the slope of mea-
sured vs. predicted SOA formation. The parameters that can
lead to a considerable increase in Faer are the CS and resi-
dence time of the OFR (i.e., time allowed for condensation
onto particles, which is controlled by flow rate). However,
these values were among the best-constrained parameters,
since we had direct measurements of both during the cam-
paign. This suggests that, while the LVOC fate correction
was relatively large, it was unlikely to be much smaller.
www.atmos-chem-phys.net/16/2943/2016/ Atmos. Chem. Phys., 16, 2943–2970, 2016

2964 B. B. Palm et al.: In situ secondary organic aerosol formation from ambient pine forest air
4 Conclusions
During the BEACHON-RoMBAS campaign, ambient air
was oxidized by OH in an OFR to study in situ SOA for-
mation from the ambient mixture of SOA precursors as they
exist in a forest environment. SOA formation was measured
semicontinuously, and the changes in both gas and particle
phases were documented as a function of photochemical age.
The amount of SOA formation increased with age to a maxi-
mum at 0.4–1.5 days of eq. photochemical aging, coinciding
with depletion of known SOA precursors measured with the
PTR-TOF-MS. SOA formation in the OFR correlated with
MT concentrations, both of which were typically larger dur-
ing nighttime. Net SOA loss was observed at > 10 days eq.
age, consistent with heterogeneous oxidation processes be-
ing important only for the longest-lived aerosol (e.g., free-
tropospheric aerosol). Similar amounts of SOA formation
were observed from both the OFR185 and OFR254-70 meth-
ods for the overlapping range of eq. ages (∼ 1–30 days).
Comparison at shorter ages was not possible because the
OFR254-70 method, especially as it was employed during
this campaign, was not suitable for measuring < 1 eq. day of
OH aging. Condensation onto preexisting ambient particles
and nucleation and growth of small particles were both ob-
served.
A modeling analysis of the fate of LVOCs in the OFR was
presented. The validity of this model was evaluated using the
simpler process of SO2 gas conversion to SO4 aerosol. The
fraction of LVOCs that condense onto aerosols versus the
other fates of LVOCs – including condensing on the reac-
tor walls, exiting the reactor to condense on sampling lines,
or reacting with OH to produce volatile fragmentation prod-
ucts – depends strongly on the aerosol surface area available
for condensation. Our measurements rule out sticking coef-
ficients much lower than 1. For ambient experiments in ru-
ral areas with low CS, for laboratory experiments without
seed aerosol, or when sampling with a relatively short resi-
dence time, a large correction may be required. Addition of
an aerosol seed to sample air with low aerosol CS (such as
this study) would reduce the uncertainties associated with the
LVOC fate correction. In urban areas or in laboratory stud-
ies with large seed aerosol surface area, the correction can be
much smaller (< 20 %). In either case, the relative timescales
of key processes in the OFR need to be carefully considered
in order to properly interpret the results of measured SOA
formation.
The amount of SOA that could be produced from OH ox-
idation of the major VOC species measured at this site (MT,
SQT, toluene+p-cymene, and isoprene) was insufficient to
explain the measured SOA formation in the reactor by a fac-
tor of 4.4. To our knowledge, this is the first time this has
been demonstrated by comparing simultaneous VOC mea-
surements with in situ SOA formation, particularly in a bio-
genic environment. A discrepancy this large is unlikely to
be completely explained by incorrect yields for the speci-
ated VOCs or by experimental uncertainties. The correlation
between measured and predicted SOA formation suggests
that the unidentified SOA precursors were of biogenic ori-
gin with a similar diurnal pattern to MT, SQT, and toluene
+p-cymene. Novel TD-EIMS measurements quantified the
reservoir of S/IVOCs, which are not measured efficiently by
a PTR-TOF-MS and represent the only pool of gas-phase car-
bon at the site that could possibly explain the observed SOA.
An SOA yield of 18–58 % for the total mass of S/IVOCs
measured was required to account for all of the SOA for-
mation from OH oxidation in the OFR. This research points
to a need to improve our understanding and measurement ca-
pabilities of S/IVOCs.
We have demonstrated how an OFR can be used in com-
bination with a variety of aerosol and gas instruments to pro-
vide information about the net SOA formation potential of
forest air. The OFR technique allows investigating the quan-
tity and variability of SOA precursor gases that are present in
ambient air. These results could be used to inform the treat-
ment of S/IVOCs, such as VOC oxidation products, in SOA
models. Future OFR experiments could be designed with ad-
ditional specialized instrumentation to determine the molec-
ular identities of S/IVOCs and investigate their specific SOA
yields.
The Supplement related to this article is available online
at doi:10.5194/acp-16-2943-2016-supplement.
Acknowledgements. We thank US NSF grants AGS-1243354
and AGS-1360834, NOAA grants NA13OAR4310063 and
NA10OAR4310106, U.S. DOE ASR Program (Office of Science,
BER, DE-SC0011105), Austrian Science Fund (FWF) project
number L518-N20, and the US EPA (STAR 83587701-0) for partial
support for this research. Brett B. Palm acknowledges support
from a CIRES Graduate Student Research Fellowship and a US
EPA STAR Graduate Fellowship (FP-91761701-0). Lisa Kaser
acknowledges support from a DOC-fFORTE Fellowship of the
Austrian Academy of Science. This work has not been formally
reviewed by the US EPA. The views expressed are solely those
of the authors, and the US EPA does not endorse any products or
commercial services mentioned in this work. Amber M. Ortega
acknowledges a fellowship from the DOE SCGP Fellowship
Program (ORAU, ORISE). We are grateful to Alex Guenther and
Jim Smith of NCAR for co-organizing the BEACHON-RoMBAS
field campaign, to Andrew Turnipseed for SO2 measurements, and
to the USFS Manitou Experimental Forest Observatory for site
support.
Edited by: R. Holzinger
Atmos. Chem. Phys., 16, 2943–2970, 2016 www.atmos-chem-phys.net/16/2943/2016/

B. B. Palm et al.: In situ secondary organic aerosol formation from ambient pine forest air 2965
References
Alarcón, P., Bohn, B., Zetzsch, C., Rayez, M.-T., and Rayez, J.-C.:
Reversible addition of the OH radical to p-cymene in the gas
phase: multiple adduct formation. Part 2, Phys. Chem. Chem.
Phys., 16, 17315–17326, doi:10.1039/c4cp02073a, 2014.
Atkinson, R.: Gas-Phase Tropospheric Chemistry of Volatile Or-
ganic Compounds: 1. Alkanes and Alkenes, J. Phys. Chem. Ref.
Data, 26, 215–290, doi:10.1063/1.556012, 1997.
Atkinson, R. and Arey, J.: Gas-phase tropospheric chemistry of bio-
genic volatile organic compounds: a review, Atmos. Environ., 37,
197–219, doi:10.1016/S1352-2310(03)00391-1, 2003.
Bruns, E. A., El Haddad, I., Keller, A., Klein, F., Kumar, N. K.,
Pieber, S. M., Corbin, J. C., Slowik, J. G., Brune, W. H., Bal-
tensperger, U., and Prévôt, A. S. H.: Inter-comparison of lab-
oratory smog chamber and flow reactor systems on organic
aerosol yield and composition, Atmos. Meas. Tech., 8, 2315–
2332, doi:10.5194/amt-8-2315-2015, 2015.
Calvert, J. G., Atkinson, R., Becker, K. H., Kamens, R. M., Seinfeld,
J. H., Wallington, T. H., and Yarwood, G.: The Mechanisms of
Atmospheric Oxidation of the Aromatic Hydrocarbons, Oxford
University Press, New York, USA, 2002.
Cappa, C. D. and Jimenez, J. L.: Quantitative estimates of the
volatility of ambient organic aerosol, Atmos. Chem. Phys., 10,
5409–5424, doi:10.5194/acp-10-5409-2010, 2010.
Chan, A. W. H., Kautzman, K. E., Chhabra, P. S., Surratt, J. D.,
Chan, M. N., Crounse, J. D., Kürten, A., Wennberg, P. O.,
Flagan, R. C., and Seinfeld, J. H.: Secondary organic aerosol
formation from photooxidation of naphthalene and alkylnaph-
thalenes: implications for oxidation of intermediate volatility or-
ganic compounds (IVOCs), Atmos. Chem. Phys., 9, 3049–3060,
doi:10.5194/acp-9-3049-2009, 2009.
Chan, A. W. H., Kreisberg, N. M., Hohaus, T., Campuzano-Jost, P.,
Zhao, Y., Day, D. A., Kaser, L., Karl, T., Hansel, A., Teng, A. P.,
Ruehl, C. R., Sueper, D. T., Jayne, J. T., Worsnop, D. R., Jimenez,
J. L., Hering, S. V., and Goldstein, A. H.: Speciated measure-
ments of semivolatile and intermediate volatility organic com-
pounds (S/IVOCs) in a pine forest during BEACHON-RoMBAS
2011, Atmos. Chem. Phys., 16, 1187–1205, doi:10.5194/acp-16-
1187-2016, 2016.
Chen, H., Ezell, M. J., Arquero, K. D., Varner, M. E., Dawson,
M. L., Gerber, R. B., and Finlayson-Pitts, B. J.: New parti-
cle formation and growth from methanesulfonic acid, trimethy-
lamine and water, Phys. Chem. Chem. Phys., 17, 13699–13709,
doi:10.1039/C5CP00838G, 2015.
Chen, Q., Farmer, D. K., Schneider, J., Zorn, S. R., Heald, C. L.,
Karl, T. G., Guenther, A., Allan, J. D., Robinson, N., Coe, H.,
Kimmel, J. R., Pauliquevis, T., Borrmann, S., Pöschl, U., An-
dreae, M. O., Artaxo, P., Jimenez, J. L., and Martin, S. T.: Mass
spectral characterization of submicron biogenic organic parti-
cles in the Amazon Basin, Geophys. Res. Lett., 36, L20806,
doi:10.1029/2009GL039880, 2009.
Cross, E. S., Hunter, J. F., Carrasquillo, A. J., Franklin, J. P.,
Herndon, S. C., Jayne, J. T., Worsnop, D. R., Miake-Lye,
R. C., and Kroll, J. H.: Online measurements of the emis-
sions of intermediate-volatility and semi-volatile organic com-
pounds from aircraft, Atmos. Chem. Phys., 13, 7845–7858,
doi:10.5194/acp-13-7845-2013, 2013.
DeCarlo, P. F., Kimmel, J. R., Trimborn, A., Northway, M. J., Jayne,
J. T., Aiken, A. C., Gonin, M., Fuhrer, K., Horvath, T., Docherty,
K. S., Worsnop, D. R., and Jimenez, J. L.: Field-Deployable,
High-Resolution, Time-of-Flight Aerosol Mass Spectrometer,
Anal. Chem., 78, 8281–8289, doi:10.1021/ac061249n, 2006.
DeCarlo, P. F., Dunlea, E. J., Kimmel, J. R., Aiken, A. C., Sueper,
D., Crounse, J., Wennberg, P. O., Emmons, L., Shinozuka, Y.,
Clarke, A., Zhou, J., Tomlinson, J., Collins, D. R., Knapp, D.,
Weinheimer, A. J., Montzka, D. D., Campos, T., and Jimenez, J.
L.: Fast airborne aerosol size and chemistry measurements above
Mexico City and Central Mexico during the MILAGRO cam-
paign, Atmos. Chem. Phys., 8, 4027–4048, doi:10.5194/acp-8-
4027-2008, 2008.
Donahue, N. M., Robinson, A. L., Stanier, C. O., and Pandis,
S. N.: Coupled Partitioning, Dilution, and Chemical Aging of
Semivolatile Organics, Environ. Sci. Technol., 40, 2635–2643,
doi:10.1021/es052297c, 2006.
Ehn, M., Thornton, J. A., Kleist, E., Sipilä, M., Junninen, H., Pulli-
nen, I., Springer, M., Rubach, F., Tillmann, R., Lee, B., Lopez-
Hilfiker, F., Andres, S., Acir, I.-H., Rissanen, M., Jokinen, T.,
Schobesberger, S., Kangasluoma, J., Kontkanen, J., Nieminen,
T., Kurtén, T., Nielsen, L. B., Jørgensen, S., Kjaergaard, H. G.,
Canagaratna, M., Maso, M. D., Berndt, T., Petäjä, T., Wahner,
A., Kerminen, V.-M., Kulmala, M., Worsnop, D. R., Wildt, J.,
and Mentel, T. F.: A large source of low-volatility secondary or-
ganic aerosol, Nature, 506, 476–479, doi:10.1038/nature13032,
2014.
Ervens, B.: Modeling the Processing of Aerosol and Trace
Gases in Clouds and Fogs, Chem. Rev., 115, 4157–4198,
doi:10.1021/cr5005887, 2015.
Ervens, B., Turpin, B. J., and Weber, R. J.: Secondary or-
ganic aerosol formation in cloud droplets and aqueous parti-
cles (aqSOA): a review of laboratory, field and model stud-
ies, Atmos. Chem. Phys., 11, 11069–11102, doi:10.5194/acp-11-
11069-2011, 2011.
Ezell, M. J., Chen, H., Arquero, K. D., and Finlayson-
Pitts, B. J.: Aerosol fast flow reactor for laboratory stud-
ies of new particle formation, J. Aerosol Sci., 78, 30–40,
doi:10.1016/j.jaerosci.2014.08.009, 2014.
Farmer, D. K. and Cohen, R. C.: Observations of HNO3, 6AN,
6PN and NO2 fluxes: evidence for rapid HOx chemistry within
a pine forest canopy, Atmos. Chem. Phys., 8, 3899–3917,
doi:10.5194/acp-8-3899-2008, 2008.
Fry, J. L., Draper, D. C., Zarzana, K. J., Campuzano-Jost, P., Day,
D. A., Jimenez, J. L., Brown, S. S., Cohen, R. C., Kaser, L.,
Hansel, A., Cappellin, L., Karl, T., Hodzic Roux, A., Turnipseed,
A., Cantrell, C., Lefer, B. L., and Grossberg, N.: Observations of
gas- and aerosol-phase organic nitrates at BEACHON-RoMBAS
2011, Atmos. Chem. Phys., 13, 8585–8605, doi:10.5194/acp-13-
8585-2013, 2013.
George, I. J., Slowik, J., and Abbatt, J. P. D.: Chemical ag-
ing of ambient organic aerosol from heterogeneous reaction
with hydroxyl radicals, Geophys. Res. Lett., 35, L13811,
doi:10.1029/2008GL033884, 2008.
Goldstein, A. H. and Galbally, I. E.: Known and Unexplored Or-
ganic Constituents in the Earth’s Atmosphere, Environ. Sci.
Technol., 41, 1514–1521, doi:10.1021/es072476p, 2007.
Grieshop, A. P., Logue, J. M., Donahue, N. M., and Robinson, A.
L.: Laboratory investigation of photochemical oxidation of or-
ganic aerosol from wood fires 1: measurement and simulation of
www.atmos-chem-phys.net/16/2943/2016/ Atmos. Chem. Phys., 16, 2943–2970, 2016

2966 B. B. Palm et al.: In situ secondary organic aerosol formation from ambient pine forest air
organic aerosol evolution, Atmos. Chem. Phys., 9, 1263–1277,
doi:10.5194/acp-9-1263-2009, 2009.
Hanson, D. R. and Eisele, F.: Diffusion of H2SO4 in Humidified
Nitrogen: Hydrated H2SO4, J. Phys. Chem. A, 104, 1715–1719,
doi:10.1021/jp993622j, 2000.
Hayes, P. L., Carlton, A. G., Baker, K. R., Ahmadov, R., Washen-
felder, R. A., Alvarez, S., Rappenglück, B., Gilman, J. B., Kuster,
W. C., de Gouw, J. A., Zotter, P., Prévôt, A. S. H., Szidat, S.,
Kleindienst, T. E., Offenberg, J. H., Ma, P. K., and Jimenez, J. L.:
Modeling the formation and aging of secondary organic aerosols
in Los Angeles during CalNex 2010, Atmos. Chem. Phys., 15,
5773–5801, doi:10.5194/acp-15-5773-2015, 2015.
Henze, D. K. and Seinfeld, J. H.: Global secondary organic aerosol
from isoprene oxidation, Geophys. Res. Lett., 33, L09812,
doi:10.1029/2006GL025976, 2006.
Hodzic, A., Jimenez, J. L., Madronich, S., Aiken, A. C., Bessag-
net, B., Curci, G., Fast, J., Lamarque, J.-F., Onasch, T. B., Roux,
G., Schauer, J. J., Stone, E. A., and Ulbrich, I. M.: Modeling or-
ganic aerosols during MILAGRO: importance of biogenic sec-
ondary organic aerosols, Atmos. Chem. Phys., 9, 6949–6981,
doi:10.5194/acp-9-6949-2009, 2009.
Hodzic, A., Jimenez, J. L., Madronich, S., Canagaratna, M. R., De-
Carlo, P. F., Kleinman, L., and Fast, J.: Modeling organic aerosols
in a megacity: potential contribution of semi-volatile and inter-
mediate volatility primary organic compounds to secondary or-
ganic aerosol formation, Atmos. Chem. Phys., 10, 5491–5514,
doi:10.5194/acp-10-5491-2010, 2010.
Hu, W. W., Palm, B. B., Day, D. A., Campuzano-Jost, P., Krech-
mer, J. E., Peng, Z., de Sá, S. S., Martin, S. T., Alexander, M.
L., Baumann, K., Hacker, L., Kiendler-Scharr, A., Koss, A., de
Gouw, J. A., Goldstein, A. H., Seco, R., Canonaco, F., Prévôt, A.
S. H., Brune, W. H., and Jimenez, J. L.: Long Lifetime of Am-
bient Isoprene Epoxydiols-Derived Secondary Organic Aerosol
(IEPOX-SOA) Against OH Oxidation and Evaporation, in prepa-
ration, 2016.
Huffman, J. A., Ziemann, P. J., Jayne, J. T., Worsnop, D. R., and
Jimenez, J. L.: Development and Characterization of a Fast-
Stepping/Scanning Thermodenuder for Chemically-Resolved
Aerosol Volatility Measurements, Aerosol Sci. Technol., 42,
395–407, doi:10.1080/02786820802104981, 2008.
Hunter, J. F., Day, D. A., Yatavelli, R. N., Chan, A., Kaser, L., Cap-
pellin, L., Hayes, P. L., Palm, B. B., Cross, E. B., Carrasquillo,
A., Campuzano-Jost, P., Stark, H., Zhao, Y., Hohaus, T., Smith, J.
N., Hansel, A., Karl, T., Goldstein, A. H., Guenther, A., Worsnop,
D. R., Thornton, J. A., Heald, C. L., Jimenez, J. L., and Kroll, J.
H.: Comprehensive characterization of atmospheric organic car-
bon at a forested site, submitted, 2016.
IPCC: Climate Change 2013: The Physical Science Basis. Contri-
bution of Working Group I to the Fifth Assessment Report of the
Intergovernmental Panel on Climate Change, edited by: Stocker,
T. F., Qin, D., Plattner, G., Tignor, M., Allen, S. K., Bex, V., and
Midgley, P. M., Cambridge University Press, Cambridge, UK,
New York, NY, USA, 2013.
Jimenez, J. L., Canagaratna, M. R., Donahue, N. M., Prevot, A. S.
H., Zhang, Q., Kroll, J. H., DeCarlo, P. F., Allan, J. D., Coe,
H., Ng, N. L., Aiken, A. C., Docherty, K. S., Ulbrich, I. M.,
Grieshop, A. P., Robinson, A. L., Duplissy, J., Smith, J. D., Wil-
son, K. R., Lanz, V. A., Hueglin, C., Sun, Y. L., Tian, J., Laak-
sonen, A., Raatikainen, T., Rautiainen, J., Vaattovaara, P., Ehn,
M., Kulmala, M., Tomlinson, J. M., Collins, D. R., Cubison, M.
J., Dunlea, J., Huffman, J. A., Onasch, T. B., Alfarra, M. R.,
Williams, P. I., Bower, K., Kondo, Y., Schneider, J., Drewnick,
F., Borrmann, S., Weimer, S., Demerjian, K., Salcedo, D., Cot-
trell, L., Griffin, R., Takami, A., Miyoshi, T., Hatakeyama, S.,
Shimono, A., Sun, J. Y., Zhang, Y. M., Dzepina, K., Kimmel,
J. R., Sueper, D., Jayne, J. T., Herndon, S. C., Trimborn, A.
M., Williams, L. R., Wood, E. C., Middlebrook, A. M., Kolb,
C. E., Baltensperger, U., and Worsnop, D. R.: Evolution of Or-
ganic Aerosols in the Atmosphere, Science, 326, 1525–1529,
doi:10.1126/science.1180353, 2009.
Julin, J., Winkler, P. M. P., Donahue, N. M., Wagner, P. E., and
Riipinen, I.: Near-unity mass accommodation coefficient of or-
ganic molecules of varying structure, Environ. Sci. Technol., 48,
12083–12089, doi:10.1021/es501816h, 2014.
Kang, E., Root, M. J., Toohey, D. W., and Brune, W. H.: Introduc-
ing the concept of Potential Aerosol Mass (PAM), Atmos. Chem.
Phys., 7, 5727–5744, doi:10.5194/acp-7-5727-2007, 2007.
Kang, E., Toohey, D. W., and Brune, W. H.: Dependence of SOA
oxidation on organic aerosol mass concentration and OH expo-
sure: experimental PAM chamber studies, Atmos. Chem. Phys.,
11, 1837–1852, doi:10.5194/acp-11-1837-2011, 2011.
Karl, T., Hansel, A., Cappellin, L., Kaser, L., Herdlinger-Blatt,
I., and Jud, W.: Selective measurements of isoprene and 2-
methyl-3-buten-2-ol based on NO−1+ ionization mass spectrom-
etry, Atmos. Chem. Phys., 12, 11877–11884, doi:10.5194/acp-
12-11877-2012, 2012.
Kaser, L., Karl, T., Schnitzhofer, R., Graus, M., Herdlinger-Blatt,
I. S., DiGangi, J. P., Sive, B., Turnipseed, A., Hornbrook, R. S.,
Zheng, W., Flocke, F. M., Guenther, A., Keutsch, F. N., Apel, E.,
and Hansel, A.: Comparison of different real time VOC measure-
ment techniques in a ponderosa pine forest, Atmos. Chem. Phys.,
13, 2893–2906, doi:10.5194/acp-13-2893-2013, 2013a.
Kaser, L., Karl, T., Guenther, A., Graus, M., Schnitzhofer, R.,
Turnipseed, A., Fischer, L., Harley, P., Madronich, M., Gochis,
D., Keutsch, F. N., and Hansel, A.: Undisturbed and disturbed
above canopy ponderosa pine emissions: PTR-TOF-MS mea-
surements and MEGAN 2.1 model results, Atmos. Chem. Phys.,
13, 11935–11947, doi:10.5194/acp-13-11935-2013, 2013b.
Keller, A. and Burtscher, H.: A continuous photo-oxidation flow
reactor for a defined measurement of the SOA formation po-
tential of wood burning emissions, J. Aerosol Sci., 49, 9–20,
doi:10.1016/j.jaerosci.2012.02.007, 2012.
Kim, S., Karl, T., Guenther, A., Tyndall, G., Orlando, J., Harley,
P., Rasmussen, R., and Apel, E.: Emissions and ambient distri-
butions of Biogenic Volatile Organic Compounds (BVOC) in a
ponderosa pine ecosystem: interpretation of PTR-MS mass spec-
tra, Atmos. Chem. Phys., 10, 1759–1771, doi:10.5194/acp-10-
1759-2010, 2010.
Kim, S., Wolfe, G. M., Mauldin, L., Cantrell, C., Guenther, A., Karl,
T., Turnipseed, A., Greenberg, J., Hall, S. R., Ullmann, K., Apel,
E., Hornbrook, R., Kajii, Y., Nakashima, Y., Keutsch, F. N., Di-
Gangi, J. P., Henry, S. B., Kaser, L., Schnitzhofer, R., Graus,
M., Hansel, A., Zheng, W., and Flocke, F. F.: Evaluation of HOxsources and cycling using measurement-constrained model cal-
culations in a 2-methyl-3-butene-2-ol (MBO) and monoterpene
(MT) dominated ecosystem, Atmos. Chem. Phys., 13, 2031–
2044, doi:10.5194/acp-13-2031-2013, 2013.
Atmos. Chem. Phys., 16, 2943–2970, 2016 www.atmos-chem-phys.net/16/2943/2016/

B. B. Palm et al.: In situ secondary organic aerosol formation from ambient pine forest air 2967
Kirkby, J., Curtius, J., Almeida, J., Dunne, E., Duplissy, J., Ehrhart,
S., Franchin, A., Gagné, S., Ickes, L., Kürten, A., Kupc, A., Met-
zger, A., Riccobono, F., Rondo, L., Schobesberger, S., Tsagko-
georgas, G., Wimmer, D., Amorim, A., Bianchi, F., Breitenlech-
ner, M., David, A., Dommen, J., Downard, A., Ehn, M., Fla-
gan, R. C., Haider, S., Hansel, A., Hauser, D., Jud, W., Junni-
nen, H., Kreissl, F., Kvashin, A., Laaksonen, A., Lehtipalo, K.,
Lima, J., Lovejoy, E. R., Makhmutov, V., Mathot, S., Mikkilä, J.,
Minginette, P., Mogo, S., Nieminen, T., Onnela, A., Pereira, P.,
Petäjä, T., Schnitzhofer, R., Seinfeld, J. H., Sipilä, M., Stozhkov,
Y., Stratmann, F., Tomé, A., Vanhanen, J., Viisanen, Y., Vrtala,
A., Wagner, P. E., Walther, H., Weingartner, E., Wex, H., Win-
kler, P. M., Carslaw, K. S., Worsnop, D. R., Baltensperger, U.,
and Kulmala, M.: Role of sulphuric acid, ammonia and galac-
tic cosmic rays in atmospheric aerosol nucleation, Nature, 476,
429–433, doi:10.1038/nature10343, 2011.
Knote, C., Hodzic, A., and Jimenez, J. L.: The effect of dry and wet
deposition of condensable vapors on secondary organic aerosols
concentrations over the continental US, Atmos. Chem. Phys., 15,
1–18, doi:10.5194/acp-15-1-2015, 2015.
Krechmer, J. E., Coggon, M. M., Massoli, P., Nguyen, T. B.,
Crounse, J. D., Hu, W., Day, D. A., Tyndall, G. S., Henze, D.
K., Rivera-Rios, J. C., Nowak, J. B., Kimmel, J. R., Mauldin,
R. L., Stark, H., Jayne, J. T., Sipilä, M., Junninen, H., Clair,
J. M. St., Zhang, X., Feiner, P. A., Zhang, L., Miller, D. O.,
Brune, W. H., Keutsch, F. N., Wennberg, P. O., Seinfeld, J.
H., Worsnop, D. R., Jimenez, J. L., and Canagaratna, M. R.:
Formation of Low Volatility Organic Compounds and Sec-
ondary Organic Aerosol from Isoprene Hydroxyhydroperoxide
Low-NO Oxidation, Environ. Sci. Technol., 49, 10330–10339,
doi:10.1021/acs.est.5b02031, 2015.
Kulmala, M. and Wagner, P. E.: Mass accommodation and uptake
coefficients – a quantitative comparison, J. Aerosol Sci., 32, 833–
841, doi:10.1016/S0021-8502(00)00116-6, 2001.
Kuwata, M., Zorn, S. R., and Martin, S. T.: Using elemental ra-
tios to predict the density of organic material composed of car-
bon, hydrogen, and oxygen., Environ. Sci. Technol., 46, 787–94,
doi:10.1021/es202525q, 2012.
Lambe, A. T., Ahern, A. T., Williams, L. R., Slowik, J. G., Wong,
J. P. S., Abbatt, J. P. D., Brune, W. H., Ng, N. L., Wright, J. P.,
Croasdale, D. R., Worsnop, D. R., Davidovits, P., and Onasch, T.
B.: Characterization of aerosol photooxidation flow reactors: het-
erogeneous oxidation, secondary organic aerosol formation and
cloud condensation nuclei activity measurements, Atmos. Meas.
Tech., 4, 445–461, doi:10.5194/amt-4-445-2011, 2011a.
Lambe, A. T., Onasch, T. B., Massoli, P., Croasdale, D. R., Wright,
J. P., Ahern, A. T., Williams, L. R., Worsnop, D. R., Brune, W. H.,
and Davidovits, P.: Laboratory studies of the chemical composi-
tion and cloud condensation nuclei (CCN) activity of secondary
organic aerosol (SOA) and oxidized primary organic aerosol
(OPOA), Atmos. Chem. Phys., 11, 8913–8928, doi:10.5194/acp-
11-8913-2011, 2011b.
Lambe, A. T., Chhabra, P. S., Onasch, T. B., Brune, W. H., Hunter,
J. F., Kroll, J. H., Cummings, M. J., Brogan, J. F., Parmar, Y.,
Worsnop, D. R., Kolb, C. E., and Davidovits, P.: Effect of oxidant
concentration, exposure time, and seed particles on secondary
organic aerosol chemical composition and yield, Atmos. Chem.
Phys., 15, 3063–3075, doi:10.5194/acp-15-3063-2015, 2015.
Lane, T. E., Donahue, N. M., and Pandis, S. N.: Effect of NOxon secondary organic aerosol concentrations, Environ. Sci. Tech-
nol., 42, 6022–6027, doi:10.1021/Es703225a, 2008.
Lee, A., Goldstein, A. H., Kroll, J. H., Ng, N. L., Varut-
bangkul, V., Flagan, R. C., and Seinfeld, J. H.: Gas-phase
products and secondary aerosol yields from the photooxida-
tion of 16 different terpenes, J. Geophys. Res., 111, D17305,
doi:10.1029/2006JD007050, 2006.
Levin, E. J. T., Prenni, A. J., Palm, B. B., Day, D. A., Campuzano-
Jost, P., Winkler, P. M., Kreidenweis, S. M., DeMott, P. J.,
Jimenez, J. L., and Smith, J. N.: Size-resolved aerosol composi-
tion and its link to hygroscopicity at a forested site in Colorado,
Atmos. Chem. Phys., 14, 2657–2667, doi:10.5194/acp-14-2657-
2014, 2014.
Li, R., Palm, B. B., Ortega, A. M., Hlywiak, J., Hu, W., Peng,
Z., Day, D. A., Knote, C., Brune, W. H., de Gouw, J. A., and
Jimenez, J. L.: Modeling the Radical Chemistry in an Oxidation
Flow Reactor: Radical Formation and Recycling, Sensitivities,
and the OH Exposure Estimation Equation, J. Phys. Chem. A,
119, 4418–4432, doi:10.1021/jp509534k, 2015.
Lim, Y. B. and Ziemann, P. J.: Effects of Molecular Structure on
Aerosol Yields from OH Radical-Initiated Reactions of Linear,
Branched, and Cyclic Alkanes in the Presence of NOx , Environ.
Sci. Technol., 43, 2328–2334, doi:10.1021/es803389s, 2009.
Lim, Y. B., Tan, Y., Perri, M. J., Seitzinger, S. P., and Turpin,
B. J.: Aqueous chemistry and its role in secondary organic
aerosol (SOA) formation, Atmos. Chem. Phys., 10, 10521–
10539, doi:10.5194/acp-10-10521-2010, 2010.
Lopez-Hilfiker, F. D., Mohr, C., D’Ambro, E. L., Lutz, A., Riedel,
T. P., Gaston, C. J., Iyer, S., Zhang, Z., Gold, A., Surratt, J.
D., Lee, B. H., Kurten, T., Hu, W. W., Jimenez, J., Hallquist,
M. and Thornton, J. A.: Molecular Composition and Volatility
of Organic Aerosol in the Southeastern U.S.: Implications for
IEPOX Derived SOA, Environ. Sci. Technol., 50, 2200–2209,
doi:10.1021/acs.est.5b04769, 2016.
Mao, J., Ren, X., Brune, W. H., Olson, J. R., Crawford, J. H., Fried,
A., Huey, L. G., Cohen, R. C., Heikes, B., Singh, H. B., Blake,
D. R., Sachse, G. W., Diskin, G. S., Hall, S. R., and Shetter, R.
E.: Airborne measurement of OH reactivity during INTEX-B,
Atmos. Chem. Phys., 9, 163–173, doi:10.5194/acp-9-163-2009,
2009.
Matsunaga, A. and Ziemann, P. J.: Gas-Wall Partitioning of Organic
Compounds in a Teflon Film Chamber and Potential Effects on
Reaction Product and Aerosol Yield Measurements, Aerosol Sci.
Technol., 44, 881–892, doi:10.1080/02786826.2010.501044,
2010.
McMurry, P. H. and Grosjean, D.: Gas and aerosol wall losses in
Teflon film smog chambers, Environ. Sci. Technol., 19, 1176–
1182, doi:10.1021/es00142a006, 1985.
Miracolo, M. A., Presto, A. A., Lambe, A. T., Hennigan, C. J., Don-
ahue, N. M., Kroll, J. H., Worsnop, D. R., and Robinson, A.
L.: Photo-Oxidation of Low-Volatility Organics Found in Mo-
tor Vehicle Emissions: Production and Chemical Evolution of
Organic Aerosol Mass, Environ. Sci. Technol., 44, 1638–1643,
doi:10.1021/es902635c, 2010.
Misztal, P. K., Hewitt, C. N., Wildt, J., Blande, J. D., Eller, A. S. D.,
Fares, S., Gentner, D. R., Gilman, J. B., Graus, M., Greenberg, J.,
Guenther, A. B., Hansel, A., Harley, P., Huang, M., Jardine, K.,
Karl, T., Kaser, L., Keutsch, F. N., Kiendler-Scharr, A., Kleist,
www.atmos-chem-phys.net/16/2943/2016/ Atmos. Chem. Phys., 16, 2943–2970, 2016

2968 B. B. Palm et al.: In situ secondary organic aerosol formation from ambient pine forest air
E., Lerner, B. M., Li, T., Mak, J., Nölscher, A. C., Schnitzhofer,
R., Sinha, V., Thornton, B., Warneke, C., Wegener, F., Werner,
C., Williams, J., Worton, D. R., Yassaa, N., and Goldstein, A. H.:
Atmospheric benzenoid emissions from plants rival those from
fossil fuels, Sci. Rep., 5, 12064, doi:10.1038/srep12064, 2015.
Murphy, D. M., Cziczo, D. J., Froyd, K. D., Hudson, P. K., Matthew,
B. M., Middlebrook, A. M., Peltier, R. E., Sullivan, A., Thom-
son, D. S., and Weber, R. J.: Single-particle mass spectrometry
of tropospheric aerosol particles, J. Geophys. Res., 111, D23S32,
doi:10.1029/2006jd007340, 2006.
Myhre, G., Shindell, D., Bréon, F.-M., Collins, W., Fuglestvedt,
J., Huang, J., Koch, D., Lamarque, J.-F., Lee, D., Mendoza,
B., Nakajima, T., Robock, A., Stephens, G., Takemura, T., and
Zhang, H.: Anthropogenic and Natural Radiative Forcing, in Cli-
mate Change 2013: The Physical Science Basis, Contribution of
Working Group I to the Fifth Assessment Report of the Intergov-
ernmental Panel on Climate Change, edited by: Stocker, T. F.,
Qin, D., Plattner, G.-K., Tignor, M., Allen, S. K., Boschung, J.,
Nauels, A., Xia, Y., Bex, V., and Midgley, P. M., Cambridge Uni-
versity Press, Cambridge, UK, New York, NY, USA, 659–740,
2013.
Nakashima, Y., Kato, S., Greenberg, J., Harley, P., Karl, T.,
Turnipseed, A., Apel, E., Guenther, A., Smith, J., and Ka-
jii, Y.: Total OH reactivity measurements in ambient air in
a southern Rocky mountain ponderosa pine forest during
BEACHON-SRM08 summer campaign, Atmos. Environ., 85, 1–
8, doi:10.1016/j.atmosenv.2013.11.042, 2014.
Ng, N. L., Chhabra, P. S., Chan, A. W. H., Surratt, J. D., Kroll, J.
H., Kwan, A. J., McCabe, D. C., Wennberg, P. O., Sorooshian,
A., Murphy, S. M., Dalleska, N. F., Flagan, R. C., and Seinfeld,
J. H.: Effect of NOx level on secondary organic aerosol (SOA)
formation from the photooxidation of terpenes, Atmos. Chem.
Phys., 7, 5159–5174, doi:10.5194/acp-7-5159-2007, 2007.
Nguyen, T. B., Crounse, J. D., Teng, A. P., St. Clair, J. M., Paulot, F.,
Wolfe, G. M., and Wennberg, P. O.: Rapid deposition of oxidized
biogenic compounds to a temperate forest, P. Natl. Acad. Sci.
USA, 112, E392–E401, doi:10.1073/pnas.1418702112, 2015.
Ortega, A. M., Day, D. A., Cubison, M. J., Brune, W. H., Bon,
D., de Gouw, J. A., and Jimenez, J. L.: Secondary organic
aerosol formation and primary organic aerosol oxidation from
biomass-burning smoke in a flow reactor during FLAME-3,
Atmos. Chem. Phys., 13, 11551–11571, doi:10.5194/acp-13-
11551-2013, 2013.
Ortega, A. M., Hayes, P. L., Peng, Z., Palm, B. B., Hu, W., Day, D.
A., Li, R., Cubison, M. J., Brune, W. H., Graus, M., Warneke, C.,
Gilman, J. B., Kuster, W. C., de Gouw, J. A., and Jimenez, J. L.:
Real-time measurements of secondary organic aerosol formation
and aging from ambient air in an oxidation flow reactor in the Los
Angeles area, Atmos. Chem. Phys. Discuss., 15, 21907–21958,
doi:10.5194/acpd-15-21907-2015, 2015.
Ortega, J., Turnipseed, A., Guenther, A. B., Karl, T. G., Day, D. A.,
Gochis, D., Huffman, J. A., Prenni, A. J., Levin, E. J. T., Krei-
denweis, S. M., DeMott, P. J., Tobo, Y., Patton, E. G., Hodzic, A.,
Cui, Y. Y., Harley, P. C., Hornbrook, R. S., Apel, E. C., Monson,
R. K., Eller, A. S. D., Greenberg, J. P., Barth, M. C., Campuzano-
Jost, P., Palm, B. B., Jimenez, J. L., Aiken, A. C., Dubey, M. K.,
Geron, C., Offenberg, J., Ryan, M. G., Fornwalt, P. J., Pryor, S.
C., Keutsch, F. N., DiGangi, J. P., Chan, A. W. H., Goldstein, A.
H., Wolfe, G. M., Kim, S., Kaser, L., Schnitzhofer, R., Hansel,
A., Cantrell, C. A., Mauldin, R. L., and Smith, J. N.: Overview
of the Manitou Experimental Forest Observatory: site description
and selected science results from 2008 to 2013, Atmos. Chem.
Phys., 14, 6345–6367, doi:10.5194/acp-14-6345-2014, 2014.
Pankow, J. F.: An Absorption-Model of Gas-Particle Partitioning
of Organic-Compounds in the Atmosphere, Atmos. Environ., 28,
185–188, doi:10.1016/1352-2310(94)90093-0, 1994.
Paulot, F., Crounse, J. D., Kjaergaard, H. G., Kürten, A., St. Clair,
J. M., Seinfeld, J. H., and Wennberg, P. O.: Unexpected Epoxide
Formation in the Gas-Phase Photooxidation of Isoprene, Science,
325, 730–733, doi:10.1126/science.1172910, 2009.
Peng, Z., Day, D. A., Stark, H., Li, R., Lee-Taylor, J., Palm, B. B.,
Brune, W. H., and Jimenez, J. L.: HOx radical chemistry in oxi-
dation flow reactors with low-pressure mercury lamps systemati-
cally examined by modeling, Atmos. Meas. Tech., 8, 4863–4890,
doi:10.5194/amt-8-4863-2015, 2015a.
Peng, Z., Day, D. A., Ortega, A. M., Palm, B. B., Hu, W. W., Stark,
H., Li, R., Tsigaridis, K., Brune, W. H., and Jimenez, J. L.: Non-
OH chemistry in oxidation flow reactors for the study of atmo-
spheric chemistry systematically examined by modeling, Atmos.
Chem. Phys. Discuss., 15, 23543–23586, doi:10.5194/acpd-15-
23543-2015, 2015b.
Petters, M. D. and Kreidenweis, S. M.: A single parameter repre-
sentation of hygroscopic growth and cloud condensation nucleus
activity, Atmos. Chem. Phys., 7, 1961–1971, doi:10.5194/acp-7-
1961-2007, 2007.
Pierce, J. R., Engelhart, G. J., Hildebrandt, L., Weitkamp, E. A.,
Pathak, R. K., Donahue, N. M., Robinson, A. L., Adams, P. J.,
and Pandis, S. N.: Constraining Particle Evolution from Wall
Losses, Coagulation, and Condensation-Evaporation in Smog-
Chamber Experiments: Optimal Estimation Based on Size Dis-
tribution Measurements, Aerosol Sci. Technol., 42, 1001–1015,
doi:10.1080/02786820802389251, 2008.
Pirjola, L., Kulmala, M., Wilck, M., Bischoff, A., Stratmann, F.,
and Otto, E.: Formation Of Sulphuric Acid Aerosols And Cloud
Condensation Nuclei: An Expression For Significant Nucle-
ation And Model Comparison, J. Aerosol Sci., 30, 1079–1094,
doi:10.1016/S0021-8502(98)00776-9, 1999.
Pope, C. A. and Dockery, D. W.: Health Effects of Fine Particulate
Air Pollution: Lines that Connect, J. Air Waste Manage. Assoc.,
56, 709–742, doi:10.1080/10473289.2006.10464485, 2006.
Pöschl, U., Canagaratna, M., Jayne, J. T., Molina, L. T., Worsnop,
D. R., Kolb, C. E., and Molina, M. J.: Mass Accommodation Co-
efficient of H2SO4 Vapor on Aqueous Sulfuric Acid Surfaces and
Gaseous Diffusion Coefficient of H2SO4 in N2/H2O, J. Phys.
Chem. A, 102, 10082–10089, doi:10.1021/jp982809s, 1998.
Presto, A. A., Miracolo, M. A., Donahue, N. M., and Robinson,
A. L.: Secondary Organic Aerosol Formation from High-NOxPhoto-Oxidation of Low Volatility Precursors: N-Alkanes, Envi-
ron. Sci. Technol., 44, 2029–2034, doi:10.1021/es903712r, 2010.
Robinson, A. L., Donahue, N. M., Shrivastava, M. K., Weitkamp,
E. A., Sage, A. M., Grieshop, A. P., Lane, T. E., Pierce, J. R.,
and Pandis, S. N.: Rethinking Organic Aerosols: Semivolatile
Emissions and Photochemical Aging, Science, 315, 1259–1262,
doi:10.1126/science.1133061, 2007.
Salcedo, D., Onasch, T. B., Dzepina, K., Canagaratna, M. R.,
Zhang, Q., Huffman, J. A., DeCarlo, P. F., Jayne, J. T., Mor-
timer, P., Worsnop, D. R., Kolb, C. E., Johnson, K. S., Zuberi,
B., Marr, L. C., Volkamer, R., Molina, L. T., Molina, M. J., Car-
Atmos. Chem. Phys., 16, 2943–2970, 2016 www.atmos-chem-phys.net/16/2943/2016/
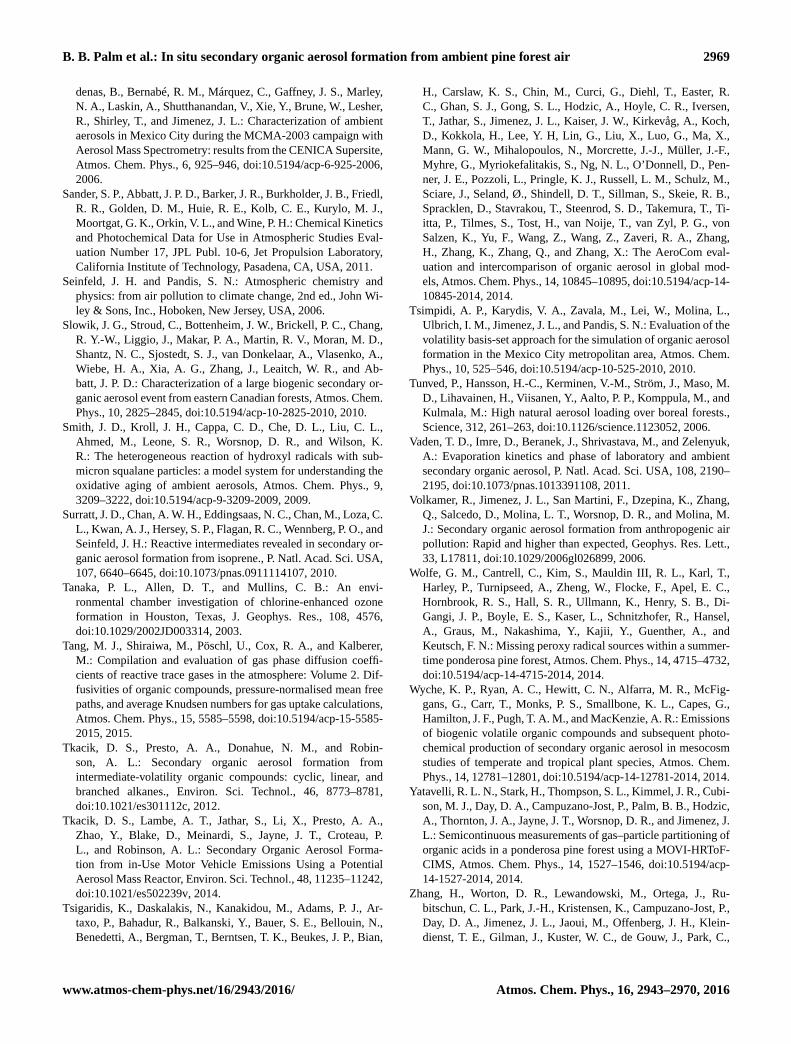
B. B. Palm et al.: In situ secondary organic aerosol formation from ambient pine forest air 2969
denas, B., Bernabé, R. M., Márquez, C., Gaffney, J. S., Marley,
N. A., Laskin, A., Shutthanandan, V., Xie, Y., Brune, W., Lesher,
R., Shirley, T., and Jimenez, J. L.: Characterization of ambient
aerosols in Mexico City during the MCMA-2003 campaign with
Aerosol Mass Spectrometry: results from the CENICA Supersite,
Atmos. Chem. Phys., 6, 925–946, doi:10.5194/acp-6-925-2006,
2006.
Sander, S. P., Abbatt, J. P. D., Barker, J. R., Burkholder, J. B., Friedl,
R. R., Golden, D. M., Huie, R. E., Kolb, C. E., Kurylo, M. J.,
Moortgat, G. K., Orkin, V. L., and Wine, P. H.: Chemical Kinetics
and Photochemical Data for Use in Atmospheric Studies Eval-
uation Number 17, JPL Publ. 10-6, Jet Propulsion Laboratory,
California Institute of Technology, Pasadena, CA, USA, 2011.
Seinfeld, J. H. and Pandis, S. N.: Atmospheric chemistry and
physics: from air pollution to climate change, 2nd ed., John Wi-
ley & Sons, Inc., Hoboken, New Jersey, USA, 2006.
Slowik, J. G., Stroud, C., Bottenheim, J. W., Brickell, P. C., Chang,
R. Y.-W., Liggio, J., Makar, P. A., Martin, R. V., Moran, M. D.,
Shantz, N. C., Sjostedt, S. J., van Donkelaar, A., Vlasenko, A.,
Wiebe, H. A., Xia, A. G., Zhang, J., Leaitch, W. R., and Ab-
batt, J. P. D.: Characterization of a large biogenic secondary or-
ganic aerosol event from eastern Canadian forests, Atmos. Chem.
Phys., 10, 2825–2845, doi:10.5194/acp-10-2825-2010, 2010.
Smith, J. D., Kroll, J. H., Cappa, C. D., Che, D. L., Liu, C. L.,
Ahmed, M., Leone, S. R., Worsnop, D. R., and Wilson, K.
R.: The heterogeneous reaction of hydroxyl radicals with sub-
micron squalane particles: a model system for understanding the
oxidative aging of ambient aerosols, Atmos. Chem. Phys., 9,
3209–3222, doi:10.5194/acp-9-3209-2009, 2009.
Surratt, J. D., Chan, A. W. H., Eddingsaas, N. C., Chan, M., Loza, C.
L., Kwan, A. J., Hersey, S. P., Flagan, R. C., Wennberg, P. O., and
Seinfeld, J. H.: Reactive intermediates revealed in secondary or-
ganic aerosol formation from isoprene., P. Natl. Acad. Sci. USA,
107, 6640–6645, doi:10.1073/pnas.0911114107, 2010.
Tanaka, P. L., Allen, D. T., and Mullins, C. B.: An envi-
ronmental chamber investigation of chlorine-enhanced ozone
formation in Houston, Texas, J. Geophys. Res., 108, 4576,
doi:10.1029/2002JD003314, 2003.
Tang, M. J., Shiraiwa, M., Pöschl, U., Cox, R. A., and Kalberer,
M.: Compilation and evaluation of gas phase diffusion coeffi-
cients of reactive trace gases in the atmosphere: Volume 2. Dif-
fusivities of organic compounds, pressure-normalised mean free
paths, and average Knudsen numbers for gas uptake calculations,
Atmos. Chem. Phys., 15, 5585–5598, doi:10.5194/acp-15-5585-
2015, 2015.
Tkacik, D. S., Presto, A. A., Donahue, N. M., and Robin-
son, A. L.: Secondary organic aerosol formation from
intermediate-volatility organic compounds: cyclic, linear, and
branched alkanes., Environ. Sci. Technol., 46, 8773–8781,
doi:10.1021/es301112c, 2012.
Tkacik, D. S., Lambe, A. T., Jathar, S., Li, X., Presto, A. A.,
Zhao, Y., Blake, D., Meinardi, S., Jayne, J. T., Croteau, P.
L., and Robinson, A. L.: Secondary Organic Aerosol Forma-
tion from in-Use Motor Vehicle Emissions Using a Potential
Aerosol Mass Reactor, Environ. Sci. Technol., 48, 11235–11242,
doi:10.1021/es502239v, 2014.
Tsigaridis, K., Daskalakis, N., Kanakidou, M., Adams, P. J., Ar-
taxo, P., Bahadur, R., Balkanski, Y., Bauer, S. E., Bellouin, N.,
Benedetti, A., Bergman, T., Berntsen, T. K., Beukes, J. P., Bian,
H., Carslaw, K. S., Chin, M., Curci, G., Diehl, T., Easter, R.
C., Ghan, S. J., Gong, S. L., Hodzic, A., Hoyle, C. R., Iversen,
T., Jathar, S., Jimenez, J. L., Kaiser, J. W., Kirkevåg, A., Koch,
D., Kokkola, H., Lee, Y. H, Lin, G., Liu, X., Luo, G., Ma, X.,
Mann, G. W., Mihalopoulos, N., Morcrette, J.-J., Müller, J.-F.,
Myhre, G., Myriokefalitakis, S., Ng, N. L., O’Donnell, D., Pen-
ner, J. E., Pozzoli, L., Pringle, K. J., Russell, L. M., Schulz, M.,
Sciare, J., Seland, Ø., Shindell, D. T., Sillman, S., Skeie, R. B.,
Spracklen, D., Stavrakou, T., Steenrod, S. D., Takemura, T., Ti-
itta, P., Tilmes, S., Tost, H., van Noije, T., van Zyl, P. G., von
Salzen, K., Yu, F., Wang, Z., Wang, Z., Zaveri, R. A., Zhang,
H., Zhang, K., Zhang, Q., and Zhang, X.: The AeroCom eval-
uation and intercomparison of organic aerosol in global mod-
els, Atmos. Chem. Phys., 14, 10845–10895, doi:10.5194/acp-14-
10845-2014, 2014.
Tsimpidi, A. P., Karydis, V. A., Zavala, M., Lei, W., Molina, L.,
Ulbrich, I. M., Jimenez, J. L., and Pandis, S. N.: Evaluation of the
volatility basis-set approach for the simulation of organic aerosol
formation in the Mexico City metropolitan area, Atmos. Chem.
Phys., 10, 525–546, doi:10.5194/acp-10-525-2010, 2010.
Tunved, P., Hansson, H.-C., Kerminen, V.-M., Ström, J., Maso, M.
D., Lihavainen, H., Viisanen, Y., Aalto, P. P., Komppula, M., and
Kulmala, M.: High natural aerosol loading over boreal forests.,
Science, 312, 261–263, doi:10.1126/science.1123052, 2006.
Vaden, T. D., Imre, D., Beranek, J., Shrivastava, M., and Zelenyuk,
A.: Evaporation kinetics and phase of laboratory and ambient
secondary organic aerosol, P. Natl. Acad. Sci. USA, 108, 2190–
2195, doi:10.1073/pnas.1013391108, 2011.
Volkamer, R., Jimenez, J. L., San Martini, F., Dzepina, K., Zhang,
Q., Salcedo, D., Molina, L. T., Worsnop, D. R., and Molina, M.
J.: Secondary organic aerosol formation from anthropogenic air
pollution: Rapid and higher than expected, Geophys. Res. Lett.,
33, L17811, doi:10.1029/2006gl026899, 2006.
Wolfe, G. M., Cantrell, C., Kim, S., Mauldin III, R. L., Karl, T.,
Harley, P., Turnipseed, A., Zheng, W., Flocke, F., Apel, E. C.,
Hornbrook, R. S., Hall, S. R., Ullmann, K., Henry, S. B., Di-
Gangi, J. P., Boyle, E. S., Kaser, L., Schnitzhofer, R., Hansel,
A., Graus, M., Nakashima, Y., Kajii, Y., Guenther, A., and
Keutsch, F. N.: Missing peroxy radical sources within a summer-
time ponderosa pine forest, Atmos. Chem. Phys., 14, 4715–4732,
doi:10.5194/acp-14-4715-2014, 2014.
Wyche, K. P., Ryan, A. C., Hewitt, C. N., Alfarra, M. R., McFig-
gans, G., Carr, T., Monks, P. S., Smallbone, K. L., Capes, G.,
Hamilton, J. F., Pugh, T. A. M., and MacKenzie, A. R.: Emissions
of biogenic volatile organic compounds and subsequent photo-
chemical production of secondary organic aerosol in mesocosm
studies of temperate and tropical plant species, Atmos. Chem.
Phys., 14, 12781–12801, doi:10.5194/acp-14-12781-2014, 2014.
Yatavelli, R. L. N., Stark, H., Thompson, S. L., Kimmel, J. R., Cubi-
son, M. J., Day, D. A., Campuzano-Jost, P., Palm, B. B., Hodzic,
A., Thornton, J. A., Jayne, J. T., Worsnop, D. R., and Jimenez, J.
L.: Semicontinuous measurements of gas–particle partitioning of
organic acids in a ponderosa pine forest using a MOVI-HRToF-
CIMS, Atmos. Chem. Phys., 14, 1527–1546, doi:10.5194/acp-
14-1527-2014, 2014.
Zhang, H., Worton, D. R., Lewandowski, M., Ortega, J., Ru-
bitschun, C. L., Park, J.-H., Kristensen, K., Campuzano-Jost, P.,
Day, D. A., Jimenez, J. L., Jaoui, M., Offenberg, J. H., Klein-
dienst, T. E., Gilman, J., Kuster, W. C., de Gouw, J., Park, C.,
www.atmos-chem-phys.net/16/2943/2016/ Atmos. Chem. Phys., 16, 2943–2970, 2016

2970 B. B. Palm et al.: In situ secondary organic aerosol formation from ambient pine forest air
Schade, G. W., Frossard, A. A., Russell, L., Kaser, L., Jud,
W., Hansel, A., Cappellin, L., Karl, T., Glasius, M., Guenther,
A., Goldstein, A. H., Seinfeld, J. H., Gold, A., Kamens, R.
M., and Surratt, J. D.: Organosulfates as Tracers for Secondary
Organic Aerosol (SOA) Formation from 2-Methyl-3-Buten-2-ol
(MBO) in the Atmosphere, Environ. Sci. Technol., 46, 9437–
9446, doi:10.1021/es301648z, 2012.
Zhang, Q., Jimenez, J. L., Canagaratna, M. R., Allan, J. D., Coe,
H., Ulbrich, I., Alfarra, M. R., Takami, A., Middlebrook, A.
M., Sun, Y. L., Dzepina, K., Dunlea, E., Docherty, K., De-
Carlo, P. F., Salcedo, D., Onasch, T., Jayne, J. T., Miyoshi,
T., Shimono, A., Hatakeyama, S., Takegawa, N., Kondo, Y.,
Schneider, J., Drewnick, F., Borrmann, S., Weimer, S., Demer-
jian, K., Williams, P., Bower, K., Bahreini, R., Cottrell, L.,
Griffin, R. J., Rautiainen, J., Sun, J. Y., Zhang, Y. M., and
Worsnop, D. R.: Ubiquity and dominance of oxygenated species
in organic aerosols in anthropogenically-influenced Northern
Hemisphere midlatitudes, Geophys. Res. Lett., 34, L13801,
doi:10.1029/2007GL029979, 2007.
Zhang, X., Cappa, C. D., Jathar, S. H., McVay, R. C., Ensberg,
J. J., Kleeman, M. J., and Seinfeld, J. H.: Influence of va-
por wall loss in laboratory chambers on yields of secondary
organic aerosol., P. Natl. Acad. Sci. USA, 111, 5802–5807,
doi:10.1073/pnas.1404727111, 2014.
Zhao, Y., Hennigan, C. J., May, A. A., Tkacik, D. S., de Gouw, J.
A., Gilman, J. B., Kuster, W. C., Borbon, A., and Robinson, A.
L.: Intermediate-volatility organic compounds: a large source of
secondary organic aerosol., Environ. Sci. Technol., 48, 13743–
50, doi:10.1021/es5035188, 2014.
Ziemann, P. J. and Atkinson, R.: Kinetics, products, and mecha-
nisms of secondary organic aerosol formation, Chem. Soc. Rev.,
41, 6582, doi:10.1039/c2cs35122f, 2012.
Atmos. Chem. Phys., 16, 2943–2970, 2016 www.atmos-chem-phys.net/16/2943/2016/