In situ recovery of bio-based carboxylic acids
17
In situ recovery of bio-based carboxylic acids Journal: Green Chemistry Manuscript ID GC-ART-12-2017-003747.R2 Article Type: Paper Date Submitted by the Author: 15-Mar-2018 Complete List of Authors: Saboe, Patrick; National Renewable Energy Laboratory, National Bioenergy Center Manker, Lorenz; National Renewable Energy Laboratory,, National Bioenergy Center Michener, William; National Renewable Energy Laboratory, National Bioenergy Center Peterson, Darren; National Renewable Energy Laboratory, National Bioenergy Center Brandner, David; National Renewable Energy Laboratory,, National Bioenergy Center Deutch, Steve; National Renewable Energy Laboratory, National Bioenergy Center Kumar, Manish; The Pennsylvania State University , Chemical Engineering; Pennsylvania State University, Cywar, Robin; Colorado State University Department of Chemistry, Chemistry Beckham, Gregg; National Renewable Energy Laboratory, National Bioenergy Center Karp, Eric; National Renewable Energy Laboratory, National Bioenergy Center Green Chemistry
Transcript of In situ recovery of bio-based carboxylic acids
In situ recovery of bio-based carboxylic acids
Journal: Green Chemistry
Manuscript ID GC-ART-12-2017-003747.R2
Article Type: Paper
Date Submitted by the Author: 15-Mar-2018
Complete List of Authors: Saboe, Patrick; National Renewable Energy Laboratory, National Bioenergy Center Manker, Lorenz; National Renewable Energy Laboratory,, National Bioenergy Center Michener, William; National Renewable Energy Laboratory, National Bioenergy Center Peterson, Darren; National Renewable Energy Laboratory, National Bioenergy Center Brandner, David; National Renewable Energy Laboratory,, National Bioenergy Center Deutch, Steve; National Renewable Energy Laboratory, National Bioenergy
Center Kumar, Manish; The Pennsylvania State University , Chemical Engineering; Pennsylvania State University, Cywar, Robin; Colorado State University Department of Chemistry, Chemistry Beckham, Gregg; National Renewable Energy Laboratory, National Bioenergy Center Karp, Eric; National Renewable Energy Laboratory, National Bioenergy Center
Green Chemistry
1
In situ recovery of bio-based carboxylic acids†
Patrick O. Saboe1,*, Lorenz P. Manker1,*, William E. Michener1, Darren J. Peterson1, David
G. Brandner1, Stephen P. Deutch1, Manish Kumar2, Robin M. Cywar1, Gregg T. Beckham1,
and Eric M. Karp1,#
The economics of chemical and biological processes are often dominated by the expense of downstream product separations from dilute product streams. Continuous separation techniques, such as in situ product recovery (ISPR), are attractive in that they can concentrate products from a reactor and minimize solvent loss, thereby increasing purity and sustainability of the process. In bioprocesses, ISPR can have an additional advantage of increasing productivity by alleviating product inhibition on the microorganism. In this work, we developed a liquid-liquid extraction (LLE)-based ISPR system integrated with downstream distillation to selectively purify free carboxylic acids, which were selected as exemplary bioproducts due to their ability to be produced at industrially relevant titers and productivities. Equilibrium constants for the extraction of carboxylic acids into a phosphine-oxide based organic phase were experimentally determined. Complete recovery of acids from the extractant and recyclability of the organic phase was demonstrated through multiple extraction-distillation cycles. Using these data, an equilibrium model was developed to predict the acid loading in the organic phase as a function of the extraction equilibrium constant, initial aqueous acid concentration, pH, organic to aqueous volume ratio, and temperature. A distillation process model was then used to predict the energy input required to distill neat acid from an organic phase as a function of the acid loading in the organic phase feed. The heat integrated distillation train can achieve neat recovery of acetic acid with an energy input of 2.6 MJ/kg of acetic acid. This LLE-based ISPR system integrated with downstream distillation has an estimated carbon footprint of less than 0.36 kg CO2/kg of acetic acid, and provides a green approach to enable both new industrial bioprocesses, and process intensification of existing industrial operations by 1) increasing the productivity and titer of the bioprocess via decreasing end-product inhibition and 2) minimizing downstream separations energy input to less than 20% of the heating value of the product and generating no waste products.
Keywords: In situ product recovery (ISPR), bio-based carboxylic acids, continuous bioprocessing,
separations, fermentation, dewatering
Introduction The production of bio-based chemicals in native or engineered microbes from sugars or other renewable carbon feedstocks holds significant promise to enable the global bioeconomy. In many microbial production processes, separation of the target intermediate from dilute aqueous streams, such as those encountered in bioreactors, is often the most expensive and environmentally burdensome set of unit operations.1, 2 Thus, the development of more efficient, cost effective approaches to isolate target intermediates from dilute aqueous streams is sorely needed. Carboxylic acids are a predominant class of bio-based intermediates readily derivable from sugars, and are often the most expensive bio-based intermediates to recover (several reviews are available on bio-based carboxylic acids3-7). At present, industrial operations exist for the microbial production of organic acids such as citric acid, lactic acid, acetic acid, and succinic acid.8 In the industrial production of citric acid, the downstream recovery process accounts for 30-40% of the production cost.9 Carboxylic acid separations operations are accomplished in a batch mode centering on simulated moving bed (SMB) chromatography, in which acid is separated from a concentrated broth by resin adsorption and solvent elution. Most of the elution solvent is recovered within the process, however, evaporative operations are required to concentrate the broth before
1. National Bioenergy Center, National Renewable Energy Laboratory, Golden CO 80401
2. Department of Chemical Engineering, The Pennsylvania State University, University Park PA 16802
*Contributed equally # Corresponding author: [email protected] † Electronic supplementary information (ESI) available.
Page 1 of 16 Green Chemistry
2
the SMB unit and an E-Factor of 4.0 is generated from the SMB process if wastewater is accounted for.16 Process intensification of carboxylic acid separations through in situ product recovery (ISPR) may reduce industrial operational costs10 and environmental impact. In situ recovery systems exhibit improved sustainability characteristics in applications including continuous flow reactors,11 biofuel fermentation,12 and waste utilization.13 For example, the Environmental (E)-factor (kg of waste/kg product) was reduced by a factor of 96.4% when in situ processes was implemented for the recovery of oleuropein from olive leaf extract, a typical agricultural waste product with valorization potential.13 An operational energy savings of 50% was predicted for acetone-butanol-ethanol (ABE) production from fermentation using an in situ two stage gas stripper.14 A 19% reduction in carbon footprint and a 91% reduction in E-factor was achieved through in situ solvent recovery from a continuous flow reaction.11 In that system, the solvent was recovery by a nanofiltration, which also concentrated the product by a factor of eleven.11 These results are imperative in the green design of pharmaceutical processes, in which up to 90 % of the total mass processed is the solvent.11 Thus, there is motivation for the development of in situ technologies to reduce waste and energy input of batch mode carboxylic acid separations. Continuous product removal from biological cultivation through ISPR provides two major bioprocess benefits over batch processing: 1) increased microorganism productivity and yield due to a decrease in product inhibition,17 and 2) regulation of bioreactor pH without equimolar addition of base.18 ISPR systems that recover acids include a bioreactor, which can be fixed bed systems, coupled with 1) nanofiltration,19 2) anion exchange chromatography,20 or 3) liquid-liquid extraction (LLE).21 LLE-based ISPR is implemented by using hollow fiber membrane contactors and has been demonstrated for use in the carboxylate platform to increase bioreactor productivity.18, 22 LLE-based separations are useful in that free acids are simultaneously separated from water and concentrated in an organic phase.21 Although ISPR systems have been described in the literature for several decades,23 little attention has been placed on integrating ISPR processes with further downstream separations to recover neat carboxylic acids from biological cultures. Selecting a downstream processing method that circumvents the need for salt-breaking and dewatering reduces separation cost and waste generation.2 Typically in LLE-based ISPR, the extracted free acids are recovered from the organic phase using an aqueous sodium hydroxide solution to back-extract the acid.24, 25 This approach increases the separation cost due to formation of sodium carboxylate salts that must subsequently undergo a salt-breaking step to generate the free acid2 through processes such as electrolysis,26 ion exchange,20 or acidification by addition of a mineral acid.21 Salt-breaking processes can be avoided by back extraction of the acids into a hot aqueous stream. However, a dewatering step is then needed to recover neat acids. A simpler method that avoids salt-breaking and dewatering, is to directly distill the acids from the organic phase. This method has been examined for LLE-based ISPR for acetone–butanol–ethanol (ABE) production and was shown to decrease the total production cost when compared to a stand-alone distillation process.27
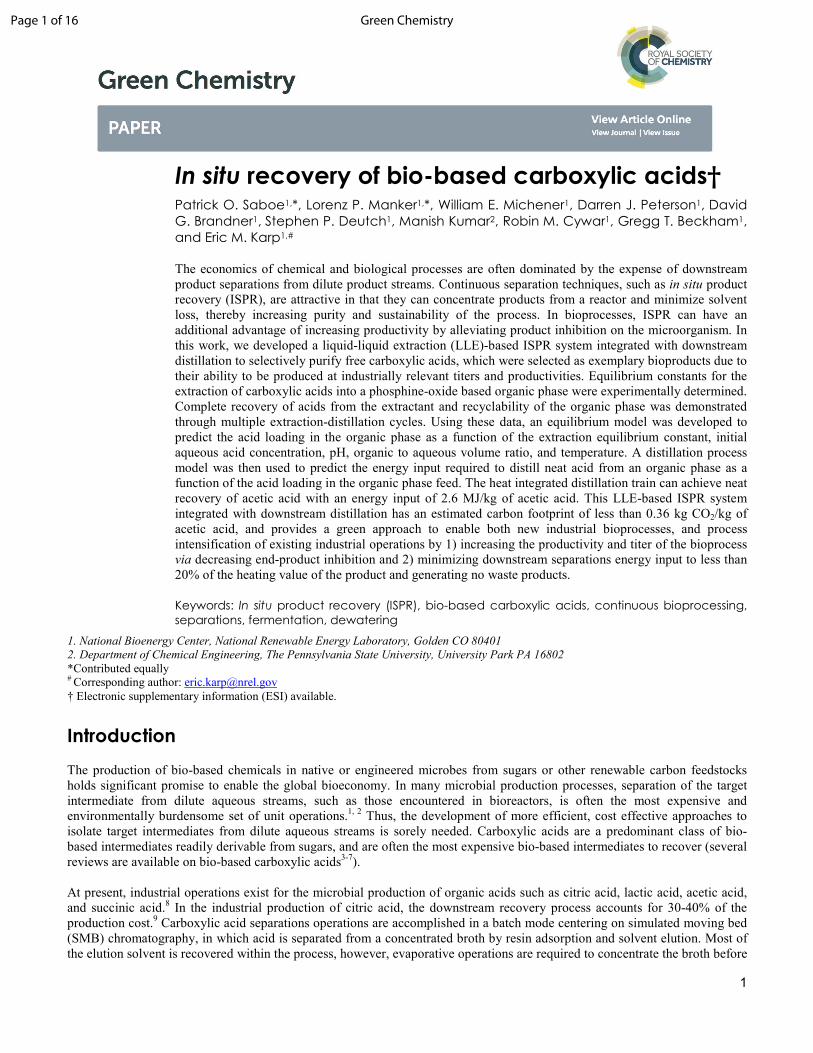
Fig. 1 Proposed distillation based in situ product recovery (ISPR) system to recover free acids. Acids present in bioreactor (1) are extracted into an organic phase through a hollow fiber membrane contactor (2). The bioreactor media and cells are recycled (3) and the organic phase is passed into a distillation column (4) where neat free acids are vaporized (5) recovered as a distillate from the heavy organic phase (6).
Page 2 of 16Green Chemistry
3
While distillation processes have previously been used to isolate products from an organic phase, these methods have yet to be coupled with LLE-based ISPR to achieve a continuous two-step isolation of carboxylic acids from bioreactors (Fig. 1). Examples of using distillation to recover carboxylic acids from an organic phase in the literature include a method of dehydrating the organic phase to crystallize diacids,28 distillation of acetic acid from a non-volatile extractant,29 and a system for back-extracting a heavy organic phase with the volatile trimethylamine (TMA) extractant in water, which is then distilled to recover the TMA and release the free acid as a bottoms product.30, 31 However, to our knowledge, there has been no attempt to describe how to efficiently integrate distillation directly with LLE-based ISPR for neat carboxylic acid recovery. Accordingly, in this work we develop an ISPR system to extract acids, couple this process with distillation, and assess the feasibility of neat acid recovery from an overall energetics perspective. Specifically, we developed a LLE-based membrane ISPR recovery process combined with distillation for the production of carboxylate platform chemicals. Carboxylic acids, including short chain carboxylic acids (SCCAs) (acetic, propionic, butyric, and valeric acid) and a medium chain carboxylic acid (MCCA) (caproic acid) were separated from dilute aqueous solutions. These acids were extracted with several phosphine-oxide based extractant/solvent systems and the acid loading in the organic phase was determined as a function of the extraction equilibrium constant, initial aqueous acid concentration, pH, organic to aqueous volume ratio (VR), and temperature. These data were integrated into an interactive user MATLAB to easily predict organic phase acid loading for single and/or mixed acid systems.‡ A membrane contactor was implemented to show how to size the needed membrane area for integration with a biological process. We then demonstrated that acids can be recovered from the organic phase by distillation and that the extractant can be recycled within the process. An Aspen Plus simulation was developed to show how acids can be continuously, and fully recovered from the extractant. The sensitivity of energy input in distilling acetic acid was determined as a function of the acid and water concentration in the distillation feed. Overall, our process provides a potential method to purify acids with minimum energy input, and without a salt-breaking step, which may decrease industrially relevant titer targets for carboxylic acids and have economic benefits for existing bioprocesses2.
Results
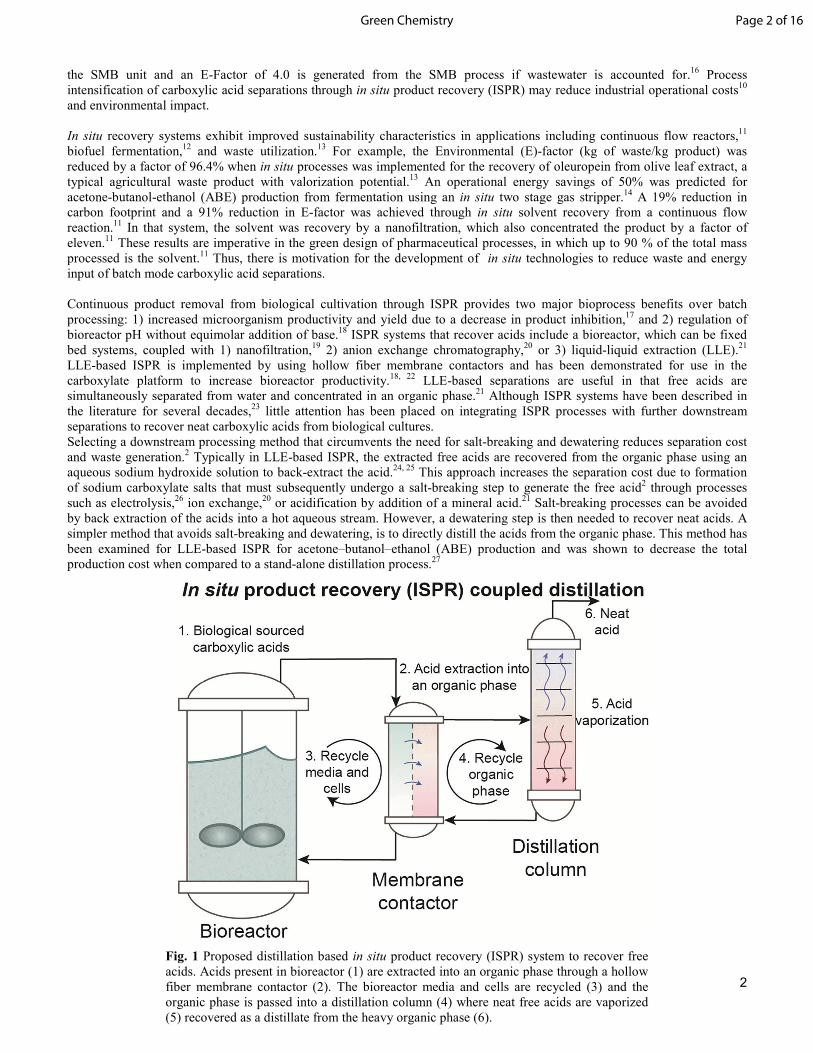
Phosphine-oxides are strong extractants. When selecting organic extractants the aim is to achieve a high equilibrium constant, KEQ,EXT (equations 1 and 2), of the target molecule for the organic phase (Fig. 2A). Amine and phosphine-oxide based extractants are commonly employed to achieve this and operate by forming either an ionic bond or a non-ionic hydrogen bond with carboxylic acids present in the aqueous phase. Ionic extractants, such as the quaternary
Fig. 2 A) Free acids distribute between an organic and aqueous phase, as quantified by the equilibrium constant (KEQ) of the extractant (B) and the partition coefficient (KD) of the solvent (C). The KEQ,EXT and KD for short chain carboxylic acids (SCCAs) (acetic, propionic, butyric, and valeric acid), and the medium chain carboxylic acid (MCCA), caproic acid, are shown for Cyanex 923 and TOA (B) and for the solvents mineral oil, propiophenone, and 2-undecanone (C).
Page 3 of 16 Green Chemistry

4
ammonium salt Aliquat 336, form an ionic bond with acids and thus require a salt-breaking step to be employed before free acids can be recovered from them.21 Non-ionic extractants form a hydrogen bond or an acid-base pair with the target acid.21, 32 Unlike ionic extractants, the bond formed between a carboxylic acid and a non-ionic extractant can be thermally broken during distillation and the acid recovered directly in the column overhead. Accordingly, the KEQ,EXT of two non-ionic extractants, trioctylamine (TOA), and Cyanex 923, a mixture of phosphine oxides (composition listed in Table S1), were measured and compared in Fig. 2B for SCCAs and caproic acid. Cyanex 923 and TOA were chosen as a model extractants in this work since they are commercially available, miscible with organic solvents, have relatively low freezing points (0°C for Cyanex 923 compared to 42°C for trioctylphosphine oxide (TOPO)) and have lower toxicity than shorter chain derivatives. 33
HA�AQ� + n ∙ EXT�ORG����,���������HA − n ∙ EXT�ORG� (1)
K��,��� = !"#���$%&'��
(!")�*�� ���$%&'��
+ (2)
In equations 1 and 2, KEQ,EXT is the equilibrium constant for complexation of free acid in the aqueous phase with an extractant in the organic phase, [HAAQ]EQ is the free acid concentration in the aqueous phase at equilibrium (mol/L), EXT,-.'��is the concentration of extractant in the organic phase at equilibrium (mol/L) which is determined from a mole balance, HA −EXT,-.'�� is the concentration of the acid-extractant complex in the organic phase at equilibrium (mol/L), and n is the stoichiometric coefficient for the extractant. The stoichiometric coefficient has been shown to be 1 for TOPO extraction of SCCAs.34 Thus, Equation 2 is used with an assumed n-value of 1 and with experimental equilibrium acid concentrations to determine KEQ,EXT of monocarboxylic acids for the extractants. The equilibrium constants (KEQ,EXT) of SCCAs and caproic acid for Cyanex 923 and TOA are shown in Fig. 2B. For Cyanex 923, the KEQ,EXT is 2.9 ± 0.1 for acetic acid, 11.6 ± 1.2 for propionic acid, 32.3 ± 7.8 for butyric acid, 147.92 ± 33.3 for valeric acid, and 276.0 ± 14 for caproic acid. For TOA, the KEQ,EXT is 0.17 ± 0.05 for acetic acid, 1.43 ± 0.96 for propionic acid, 13.61 ± 7.52 for butyric acid, 21.4 ± 8.5 for valeric acid, and 69.1 ± 32 for caproic acid. Clearly, the equilibrium constant of phosphine-oxide based extractant Cyanex 923 is higher than that of TOA making it the stronger extractant. Thus, since the driving force for extraction is higher for Cyanex 923 over TOA, Cyanex 923 is more useful in ISPR systems to prevent product accumulation and growth inhibition in a bioreactor.
Organic solvents for liquid-liquid extraction (LLE) based ISPR. In bioprocesses coupled to LLE systems the pure extractants described above are often diluted with organic solvents as a means to enhance the biocompatibility,35 and to decrease the viscosity of the organic phase.36 Although many solvents have been developed for ISPR systems, only a few of them are suited for the ISPR-coupled-distillation approach developed here (Table S2-S3), as their high volatility would result in co-distillation with the target acid from the heavy extractant (e.g.TOPO Bp = 411.2°C at 1 atm). Instead, solvents with low volatility are required to enable the acid to be recovered as a distillate. In addition, there is a parallel extraction of acid into the solvent and with the extractant. Solvents that exhibit a high partition coefficient (KD) facilitate organic loading (Fig. 2A). Thus, the partition coefficients (KD) of three high boiling solvents (mineral oil Bp = 315°C at 1 atm), propiophenone Bp = 218°C at 1 atm, 2-undecanone Bp = 231°C at 1 atm) were measured and results are shown in Fig. 2C for SCCAs and caproic acid. The KD described in Equation 3, is the ratio of the concentration of acid in the organic solvent to the concentration of undissociated acid in the aqueous phase at equilibrium, and is a measurement of the extraction efficiency of the solvent.
K/ = !"#0$%&'��
(!")�*�� (3)
In Equation 3, K/ is the partition coefficient of free acids into the solvent, [HAAQ]EQ is the free acid concentration in the aqueous phase at equilibrium (mol/L), and HA − S,-.'�� is the concentration of the acid solvated by the organic solvent at equilibrium (mol/L). The solvents measured in Fig. 2C fall into two categories; mineral oil is classified as a “Hydrocarbon solvent” while propiophenone and 2-undecanone are considered “Functional solvents.”
Page 4 of 16Green Chemistry
5
(1) Hydrocarbon solvents: These solvents contain no functional groups capable of hydrogen bonding to carboxylic acids. Instead, acids partition into these solvents based on hydrophobic interactions. Hexane, xylene, and kerosene are common hydrocarbon solvents used to dilute phosphine-oxide and amine based extractants,37, 38 but these solvents are unsuitable for recovery of carboxylic acids as overhead distillates due to their high volatility. The high boiling point alkane mixture, mineral oil, was recently used as a TOPO solvent in an ISPR system to extract MCCAs39 over SCCAs, which enhanced the chain elongation pathway in microorganisms.40 Mineral oil is stable in distillation processes and was thus chosen for ISPR-coupled-distillation. The partition coefficient (KD) of acetic, propionic, butyric, valeric, and caproic acid in mineral oil are: 0.01 ± 0.008, 0.017 ± 0.002, 0.14 ± 0.04, 1.1 ± 0.3, and 1.2 ± 0.2, respectively (Fig. 2C). Although there is low partitioning of acids, mineral oil has low toxicity and can lower the viscosity of an extractant (Fig. S1). (2) Functional solvents: These solvents contain alcohol and/or ketone functional groups (e.g. 2-octanol, oleyl alcohol, methyl isobutyl ketone) that can form a hydrogen bond with carboxylic acids and have been used in the literature as extractant diluents.41, 42 These diluents show increased partition coefficients (KD) for carboxylic acids over non-functional hydrocarbon solvents (compare Table S2 to Table S3). The low-volatile functional ketone containing solvents, propiophenone and 2-undecanone were tested for acid extraction. The KD of acetic, propionic, butyric, valeric, and caproic acid in propiophenone are 0.2 ± 0.01, 0.81, 3.0 ± 0.3, 11.8 ± 1.5, and 46.4 ± 5.9, respectively (40, 47, 15, 20 and 40-fold higher compared to their KD in mineral oil) (Fig. 2C). These diluents are inexpensive and good candidates to meet the above distillation requirements. Dilution of TOA by a functional solvents is known to increase the percent acid extracted, and is explained by increased solvation of the acid-base pair by the functional diluent through hydrogen-bonding or dipole-dipole interactions.43 Fig. S2A shows that dilution of TOA with 2-undecanone increases the amount of acid extracted. Direct comparison of TOA and TOPO diluted in 2-undecaone, supports that phosphine-oxide based extractants are stronger extractants than TOA (Fig. S2B). Parameters that influence acid loading in the organic phase. In the ISPR-coupled-distillation system it is critical that the acid concentration in the organic phase be as high as possible to mitigate the energy requirements during distillation. This effect has been long known from Sherwood plots that show the cost and energy requirements to recover purified products decrease as the concentration of those products increase in the medium that they are recovered from.44 Accordingly, there are five key drivers that determine the acid concentration in the organic phase at equilibrium � HA − EXT,-.'��): (1) the total initial acid concentration in the bioreactor (Fig. 3A), (2) the initial pH (Fig. 3B), (3) the volume ratio of the organic to aqueous phase (VR) (Fig. 3C), (4) the extractant concentration in the organic phase (Fig. S3), and (5) the solvent selected for extractant dilution (Fig. S4). These parameters are varied for SCCAs and caproic acid and a model is constructed from these results that allows calculation of the final concentration of acid loaded into an organic phase by simply knowing the pH, titer,
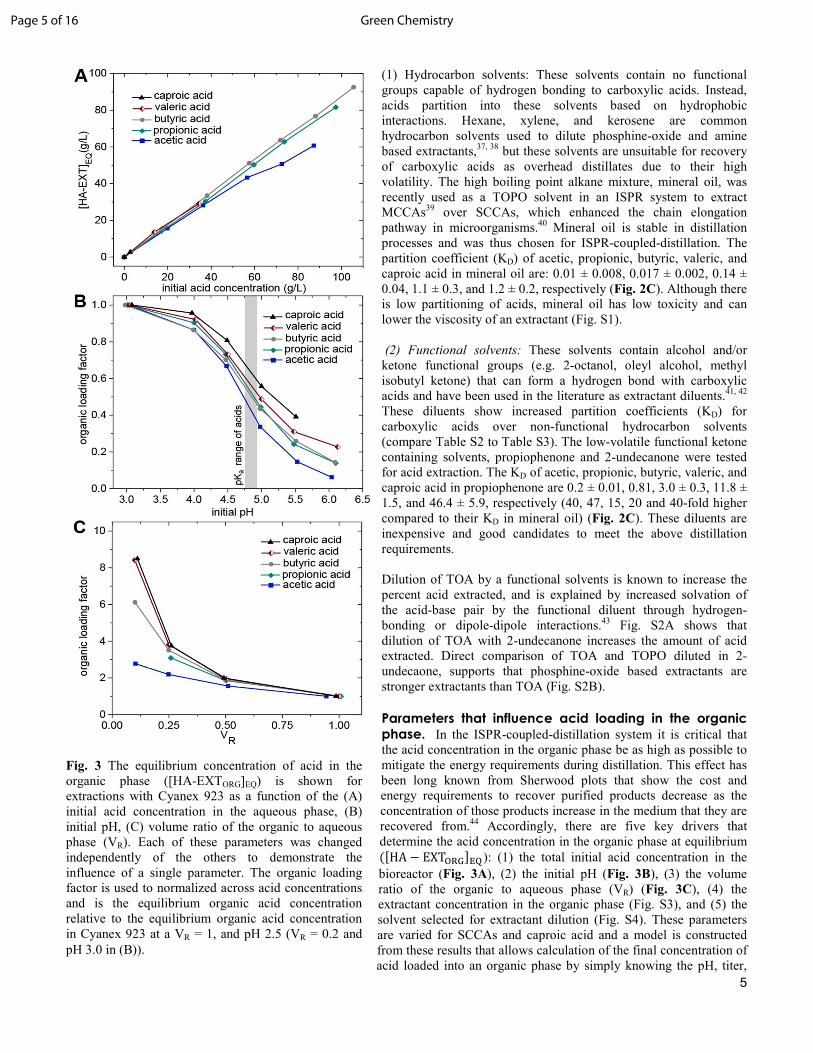
Fig. 3 The equilibrium concentration of acid in the organic phase ([HA-EXTORG]EQ) is shown for extractions with Cyanex 923 as a function of the (A) initial acid concentration in the aqueous phase, (B) initial pH, (C) volume ratio of the organic to aqueous phase (VR). Each of these parameters was changed independently of the others to demonstrate the influence of a single parameter. The organic loading factor is used to normalized across acid concentrations and is the equilibrium organic acid concentration relative to the equilibrium organic acid concentration in Cyanex 923 at a VR = 1, and pH 2.5 (VR = 0.2 and pH 3.0 in (B)).
Page 5 of 16 Green Chemistry
6
temperature and VR (equations S2, S5, S7, S9, S11-S13 and S15)
(1) The acid concentration in the organic phase is a function of total aqueous acid titer: Fig. 3A shows the equilibrium acid concentration in neat Cyanex 923 as a function of the initial total acid concentration in the aqueous phase, at an initial VR of 1, and an initial pH of ~2.5 (initial pH listed in Table S4). KEQ,EXT increases with increasing acid chain length (Fig. 2B), which results in a higher equilibrium acid concentration in the organic phase for caproic acid versus acetic acid. Note that valeric and caproic acid have limited solubility in water; 49.7 g/L and 10.8 g/L respectively. If complete extraction occurs at a 1:1 initial VR, as is the case with caproic acid, then the acids are slightly diluted in the organic phase since the extracted acid increases the organic phase volume. Fig. 3A is replotted as an equilibrium curve in Fig. S5 to show the equilibrium concentration in the organic phase relative to the equilibrium concentration in the aqueous phase. Data and results for Fig. 3A are provided in Table S4. (2) pH influence: Fig. 3B shows the influence of pH on the equilibrium acid concentration in Cyanex 923 at a constant VR = 0.2, where the equilibrium acid concentrations were normalized to a pH of 3.0. A VR = 0.2 was used in this case to prevent complete extraction of caproic acid from the aqueous phase. The amount of acid present in the salt and free acid form in the aqueous phase at a given pH can be calculated from the Henderson-Hasselbalch equation, which is derived from the pH and pKa (equation S9). Following from the Henderson-Hasselbalch equation, the free acid concentration in the aqueous phase rapidly decreases as the pH drops below the pKa, and as a result, the acid concentration in the organic phase also drops off rapidly near the pKa of the acid. Since the acids were extracted from an unbuffered aqueous phase, the final pH of the aqueous phase was higher than the initial pH. (Table S5).
(3) Volume ratio of the organic phase to aqueous phase (VR): In Fig. 3C the initial extractant and acid concentrations and pH were kept constant, and the equilibrium organic phase acid concentrations were normalized to a VR = 1. Fig. 3C shows that acids are increasingly concentrated in the organic phase as the VR decreases. Caproic acid is concentrated by a factor of 9.6 when the VR is decreased by a factor of ten, a result of the high KEQ,EXT and near complete extraction of caproic acid. SCCAs are less concentrated because of their lower KEQ,EXT values. As the VR approaches zero, the equilibrium aqueous acid concentration approaches the initial total acid concentration (Table S6), and the acid concentration in the organic phase increases exponentially (Fig. 3C).
(4) Extractant concentration in the organic phase: Phosphine-oxide based extractants, Cyanex 923 and TOPO were diluted with mineral oil, while holding constant the VR, initial acid concentration, and initial pH. Table S7-8 and Fig. S3 shows that as the percentage of phosphine-oxide decreases, the organic loading decreases for all acids. The loading capacity for all acids decreases as the loading of phosphine-oxide decreases.
(5) Solvent selection: Fig. S4 compares extraction capability when Cyanex 923 is diluted with propiophenone versus mineral oil. The use of a functionalized solvent (e.g., propiophenone) instead of a hydrocarbon solvent (e.g., mineral oil) enhances the acid concentration in the organic phase. These results indicate that the synergy with a diluent of higher KD can increase the total amount of acid extracted. To describe the influence of the above five parameters on the acid concentration in the organic phase, an equilibrium model was developed to describe the parallel extraction of free acid from the aqueous phase into the organic phase via: (1) partitioning into the solvent and (2) complexation of the free acid with phosphine-oxides. Four equilibrium expressions (equations S2, S5, S9, and S11) were combined with component mole balances on carboxylic acid, and extractant, and charge balance (Equations S12, S13, and S14) to yield a system of seven independent equations. Using this model, equilibrium concentrations can be predicted as a function of: bioreactor pH and titer, extractant concentration in the organic solvent, solvent selection, temperature (Fig. S6, equation S7), and the VR. Using experimentally determined values for KEQ,EXT, outputs from the equilibrium model were plotted alongside experimental data (Fig. S7). Continuous extraction with membrane contactors. Post-processing of fermentation broth through direct contact between the broth and the extractant in a batch process is already used in industry to separate fermentation products, including acids (e.g., citric acid).21 However, industrial operations that utilize continuous extraction systems integrated with fermentation for carboxylic acid production, to our knowledge, are not in operation. Still, there are clear benefits to development of such an ISPR system, particularly for carboxylic acid production, because overall process economic advantages are gained from autoregulation of pH,18 decreased product inhibition which may increase overall productivity, and decreased working volumes.17 Furthermore, continuous extraction is easily synchronized with continuous downstream distillation to avoid expenses associated with a salt-breaking step during neat product recovery. The following section focuses on how membrane contactors should be operated (reviewed in Schlosser et al. (2005))45 and sized to synchronize with bioreactors and distillation unit operations.
Page 6 of 16Green Chemistry
7
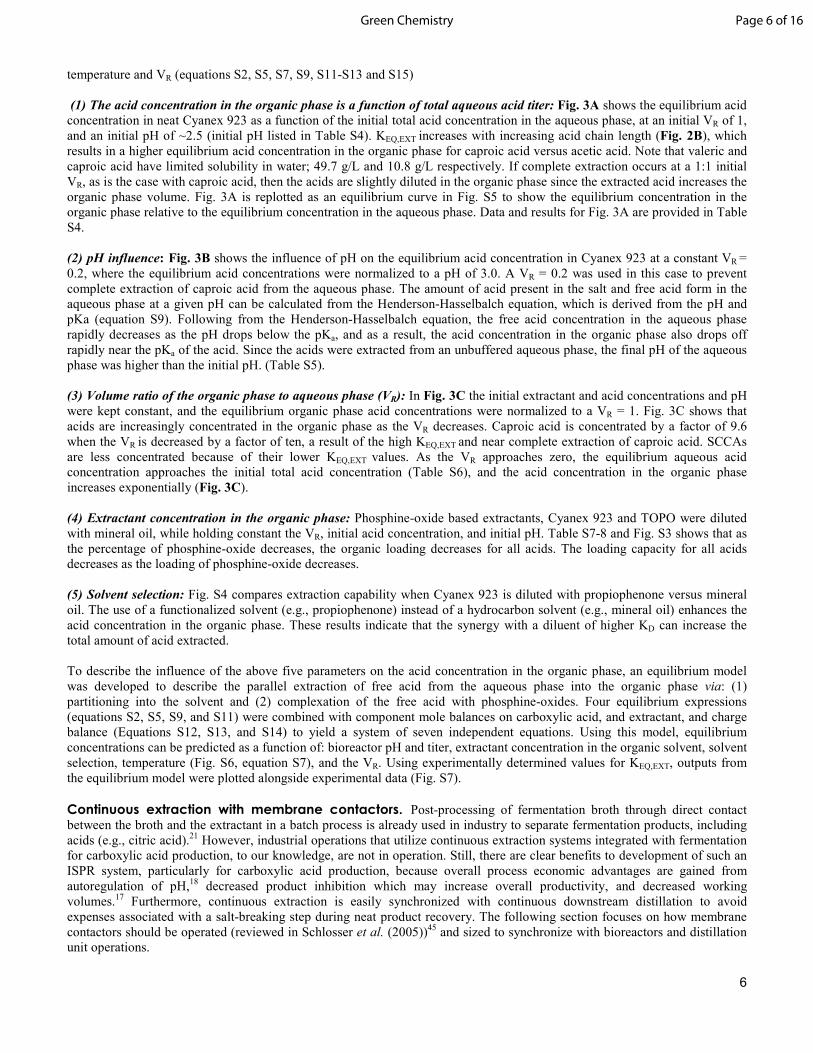
Fig. 4 A) The acid concentration the organic phase approaches its equilibrium value as the residence time of Cyanex 923 and the mock broths (inlet pH of 5.5) in the membrane contactor are increased. B) The average flux of acid extracted into Cyanex 923 is shown at pH 2.5 and pH 5.5 at a residence time of 15 minutes. The extraction flux increases with acid chain length and with decreasing pH.
Mock bioreactor solutions (pH 2.5 and 5.5 with 5 g/L of each acetic, propionic, butyric, and caproic acid), were flowed through a hollow fiber unit (Liqui-Cel 2.5 x 8, a polypropylene membrane with 1.4 m2 membrane area) on the shell side to contact Cyanex 923, which wetted the membrane from the tube side (see Fig. S8A for a photo of the membrane equipment). The residence time ratio of the Cyanex 923 to mock broth was held constant at 1.0 (corresponding to a volumetric flow ratio of 0.3) for these experiments. In Fig. 4A, the aqueous feed was pH 5.5 (this pH was chosen since many bacterial strains that produce volatile fatty acids (VFAs) are stable at this pH4, and as the residence time of the liquid in the contactor was increased, the outlet concentration of acid in Cyanex 923 approached its equilibrium (EQ) concentration. Additionally, the pH of the aqueous stream increased across the contactor from pH 5.5 (inlet pH) to 7.0 (outlet pH) at a residence time of 15 minutes as shown in Fig. S8, indicating that the pH of the bioreactor broth may be autoregulated by the online contacting unit that is optimized for both membrane area and residence times. The flux of acids through a hollow fiber membrane is shown for a residence time of 15 minutes at an initial pH of 2.5 and 5.5 (Fig. 4B). Acid flux increases with decreasing pH, a result of the higher aqueous free acid concentration at low pH and thus increased driving force.
To prevent accumulation of acid products in the bioreactor, the rate of extraction through the contactor needs to be equal to or greater than the rate of production of acid in the bioreactor. For example, a productivity of 1.1 g/hr L of acetic acid has been reported though industrial fermentation using Acetobacter at low pH (1.9-2.3).4 If the reactor vessel is specified as 1 m3, and if this system had an acetic acid flux of 0.5 g/hr m2 through a hollow fiber membrane unit, then the membrane contacting unit size for this operation could be estimated by Equation 4.
23456789:98; ∗ => = ?@ ∗ A345678BC6D (4)
In equation 4, productivity is defined as the rate of product formation per fermentation volume, VF is the volume of the bioreactor broth, Am is the membrane area, and the product flux is defined as the rate of product extraction per membrane area. In the above example, a membrane area of 2,200 m2 or greater is required to achieve extraction rates in excess of the microorganism’s productivity. Hollow fiber contactors have a high surface area to volume ratio, and can be used to meet surface area requirement. For example, the 8 x 20 Liqui-Cel contactor has a surface area of 53 m2 per module. 42 of these modules is required for a total membrane area in excess of 2,200 m2. If the fermenter is 1 m3, then the total volume of broth within the 42 industrial 8 x 20 Liqui-Cel contactors is approximately 22 vol% of the total fermentation broth. Note that the acid flux should be determined for a given system before sizing the contactor, since the flux is a function of the mass transfer coefficient,46 free acid concentration, and KEQ,EXT of the acid for the organic phase.47, 48
Recovery of free acids as a distillate. Distillation of the organic phase provides a simple method to recover neat free acids from the organic phase, and provides an operational advantage over conventional back-stripping recovery methods. For example, reported ISPR systems commonly back-strip acids from the organic phase using a sodium hydroxide solution.18, 49 This creates the sodium salt of the acid in an aqueous solution and in order to achieve pure, free acid products several
Page 7 of 16 Green Chemistry
8
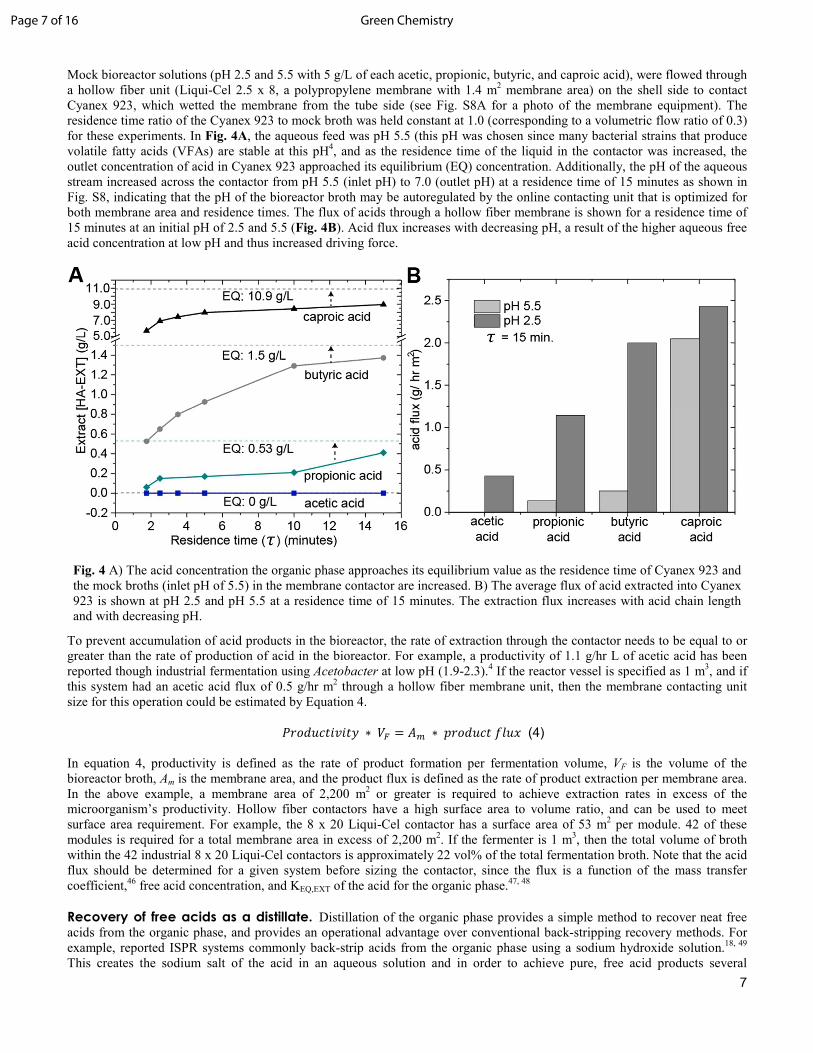
Fig. 5 At 20 mmHg, acetic acid, butyric acid and caproic acid were distilled from extractant/diluent mixtures A) Liquid and vapor temperature during batch distillation of acetic acid, butyric acid and caproic acid from 50 wt% Cyanex 923/50 wt% mineral oil. B) The average liquid temperature during fractions is shown. Increasing temperatures are seen for increasing amounts of extractant in mineral oil.
operations are still required post-stripping: acidification of carboxylates, dewatering, and possible separation of a mixed acid stream via distillation or using a chromatographic method. Direct distillation of the organic phase is a two-step process for achieving high-purity, neat acid distillates from a loaded organic phase. In this section, the feasibility of recovering SCCAs and caproic acid from various high boiling extractants via vacuum-distillation and the ability to recycle the stripped-extractant for subsequent extraction-distillation cycles is tested. A spinning band distillation column with 25 theoretical stages (Fig. S8B) was used to recover acids from four different extractants, each loaded with 100 g/L of acetic, butyric, and caproic acid (300 g/L total acid content). Vacuum distillation was utilized (20 mm Hg) to lower the liquid boiling points during distillation and prevent auto-oxidation of the organic phase.50 If water was present in the extractant, it was distilled at 50 mmHg prior to the distillation of the acids.
Liquid and vapor temperature profiles during batch distillation of acetic, butyric, and caproic acid from a 50 wt% Cyanex 923 in mineral oil organic phase are plotted in Fig. 5A. Table 1 lists the compositions of the three distillate fractions that were collected in the time spans highlighted gray on Fig. 5A, and the overall recovery of the acids from each of the four extractant/diluent systems. Fig. 5B plots the average liquid temperature of the extractant mixtures during collection of each of the distillate fractions (vapor temperature profiles were constant between extractants and were therefore not plotted).
Table 1: Distillate fraction compositions
extractant/
solvent
acid %
recovery
acetic
acid
fraction
butyric
acid
fraction
caproic
acid
fraction
TOA
acetic acid 100 84.5 9.2 2.5 butyric acid 100 6.7 88.5 5.2 caproic acid 91.6 0.0 2.7 96.9
Cyanex 923 acetic acid 100 80.9 15.9 4.0 butyric acid 100 11.5 65.9 6.8 caproic acid 71.2 0.0 13.2 91.1
50 % Cyanex 923 in
mineral oil
acetic acid 100 89.0 8.0 2.3 butyric acid 100 6.7 82 7.4 caproic acid 84.7 0.0 3.0 94.1
4% TOPO in mineral oil
acetic acid 100 88.1 8.8 2.6 butyric acid 100 8.7 87.1 2.6 caproic acid 88.7 0.0 0.0 94.3
*Fractions contain water to complete the material balance
Page 8 of 16Green Chemistry

9
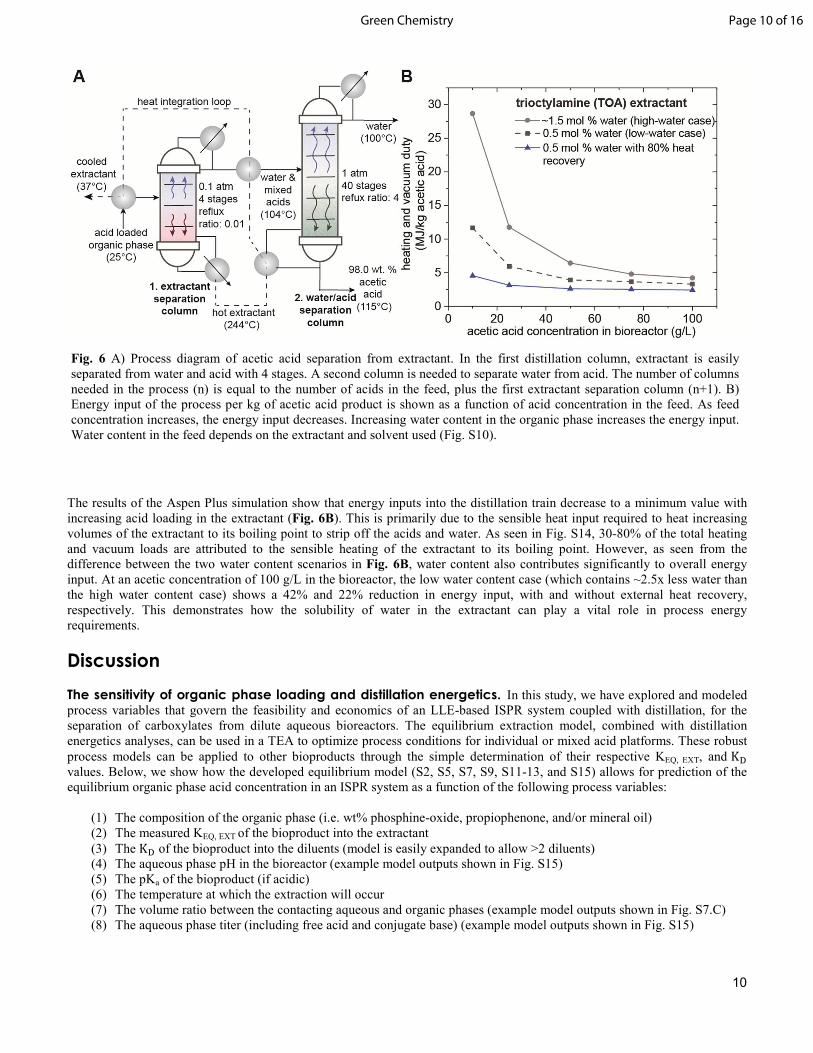
As seen from Table 1, 100% of acetic and butyric acids were recovered from each of the extractants by distillation. However, due to hold-up in the column and the high boiling point of the extractants (above the recommended equipment limits), caproic acid recovery was limited to 91.6 wt% for TOA and 71.2 wt% for Cyanex 923. Complete recovery of caproic acid is expected with further heating. Table 1 also demonstrates that acids were distilled with high purity. Acid purity could be further enhanced by using a higher reflux ratio or through continuous distillation processing to isolate individual acids. Fig. 5B demonstrates that dilution of the phosphine-oxide extractants can have a large impact on liquid boiling points, and therefore, on the heat input required to strip the acids. Balancing the extraction efficiency and liquid boiling point (both determined by concentration of phosphine-oxide) of the extractant may be a point of optimization in a TEA. Lastly, the extraction efficiencies and distillation recoveries were stable over the three extraction-distillation-extraction cycles, demonstrating the recyclability of Cyanex 923 (Table S9). From these results, distillation of acids from the organic phase of a phosphine-oxide based ISPR extraction loop appears to a feasible method for production of high-purity, renewable, carboxylic acids. Now that it is known that recovery of carboxylic acids and regeneration of the extractant by distillation is feasible, the energetics of the process is examined below. Economic drivers of acid distillation. Heating and cooling loads required to produce pure product by distillation of the organic phase will impact the process economics and contribute to setting the lower limits of productivity and steady state free acid titer required for an industrially relevant ISPR based bioprocess. Therefore, it is important to develop an understanding of how design variables in a process impact the energetics of the distillation train. In general, separation costs increase with decreasing product concentration in a product stream.44 Furthermore, distillation of any non-product solvent such as water, during the distillation operation can add a substantial energy requirement to the process.51 Following this reasoning, two parameters that significantly influence the operational costs of the ISPR-coupled-distillation systems are, (1) acid product concentration in the organic phase and (2) water concentration in the organic phase. An Aspen Plus simulation for the distillation of acetic acid from TOA (the thermodynamic parameters for phosphine-oxides are not available in the Aspen Plus database) was developed to determine how energy input on a per kg distillate product basis, varied with acid and water concentrations in the extractant feed. A basic process flow diagram is shown in Fig. 6A. The composition of the extractant feed to the distillation train was determined using the extraction equilibrium model for acetic acid into TOA. Using the equilibrium model, the concentration of acetic acid in the organic phase was determined for fermentations containing 10, 25, 50, 75, and 100 g/L of acetic acid at a pH of 3 and a 0.1 volume ratio of TOA to aqueous acetic acid broth in the membrane contactor. The water content in the extractant was then determined using experimental Karl-Fischer data for extractions into Cyanex 923 and into TOA at various loadings of acetic acid (Fig. S10). These two water content scenarios were examined to gain insight into the effect of water on distillation energy input. The total flow rate of the feed was varied at each composition to achieve a 100 kg of acetic acid per hour feed rate to the distillation train. A heat exchange network (HEN) was incorporated into the simulation to utilize the high-grade heat from the regenerated extractant stream (see Fig. S11 and ESI materials and methods for a detailed explanation of the simulation and heat exchanger network). The combined heating and vacuum pump duties for the distillation train is plotted as a function of acetic acid concentration in the bioreactor (pH 3) in Fig. 6B for the two different water content scenarios mentioned above. In the high-water content case (mimicking the water content of Cyanex 923), close to 100% of sensible heat used to heat the high boiling extractant is recovered internally within the distillation train (Fig. S11). In the low water content scenario (mimicking that of TOA), only 40-60% of the sensible heat can be recovered internally (due to lower latent heating duties from water). The lower curve in Fig. 6B demonstrates heating and vacuum duties assuming that 80% of the remaining sensible heat from the extractant can be recovered elsewhere in the process (e.g. heating the bioreactor). At aqueous concentration of 50 g/L, a heat and vacuum pump duty of 2.6 MJ/kg is needed (for reference the heat of combustion of acid acetic is 14.6 MJ/kg). Condensing and cooling duties as a function of acetic acid concentration and water content are plotted in Fig. S13.
Page 9 of 16 Green Chemistry
10
The results of the Aspen Plus simulation show that energy inputs into the distillation train decrease to a minimum value with increasing acid loading in the extractant (Fig. 6B). This is primarily due to the sensible heat input required to heat increasing volumes of the extractant to its boiling point to strip off the acids and water. As seen in Fig. S14, 30-80% of the total heating and vacuum loads are attributed to the sensible heating of the extractant to its boiling point. However, as seen from the difference between the two water content scenarios in Fig. 6B, water content also contributes significantly to overall energy input. At an acetic concentration of 100 g/L in the bioreactor, the low water content case (which contains ~2.5x less water than the high water content case) shows a 42% and 22% reduction in energy input, with and without external heat recovery, respectively. This demonstrates how the solubility of water in the extractant can play a vital role in process energy requirements.
Discussion The sensitivity of organic phase loading and distillation energetics. In this study, we have explored and modeled process variables that govern the feasibility and economics of an LLE-based ISPR system coupled with distillation, for the separation of carboxylates from dilute aqueous bioreactors. The equilibrium extraction model, combined with distillation energetics analyses, can be used in a TEA to optimize process conditions for individual or mixed acid platforms. These robust process models can be applied to other bioproducts through the simple determination of their respective KEQ, EXT, and K/ values. Below, we show how the developed equilibrium model (S2, S5, S7, S9, S11-13, and S15) allows for prediction of the equilibrium organic phase acid concentration in an ISPR system as a function of the following process variables:
(1) The composition of the organic phase (i.e. wt% phosphine-oxide, propiophenone, and/or mineral oil) (2) The measured KEQ, EXT of the bioproduct into the extractant (3) The K/ of the bioproduct into the diluents (model is easily expanded to allow >2 diluents) (4) The aqueous phase pH in the bioreactor (example model outputs shown in Fig. S15) (5) The pKa of the bioproduct (if acidic) (6) The temperature at which the extraction will occur (7) The volume ratio between the contacting aqueous and organic phases (example model outputs shown in Fig. S7.C) (8) The aqueous phase titer (including free acid and conjugate base) (example model outputs shown in Fig. S15)
Fig. 6 A) Process diagram of acetic acid separation from extractant. In the first distillation column, extractant is easily separated from water and acid with 4 stages. A second column is needed to separate water from acid. The number of columns needed in the process (n) is equal to the number of acids in the feed, plus the first extractant separation column (n+1). B) Energy input of the process per kg of acetic acid product is shown as a function of acid concentration in the feed. As feed concentration increases, the energy input decreases. Increasing water content in the organic phase increases the energy input. Water content in the feed depends on the extractant and solvent used (Fig. S10).
Page 10 of 16Green Chemistry
11
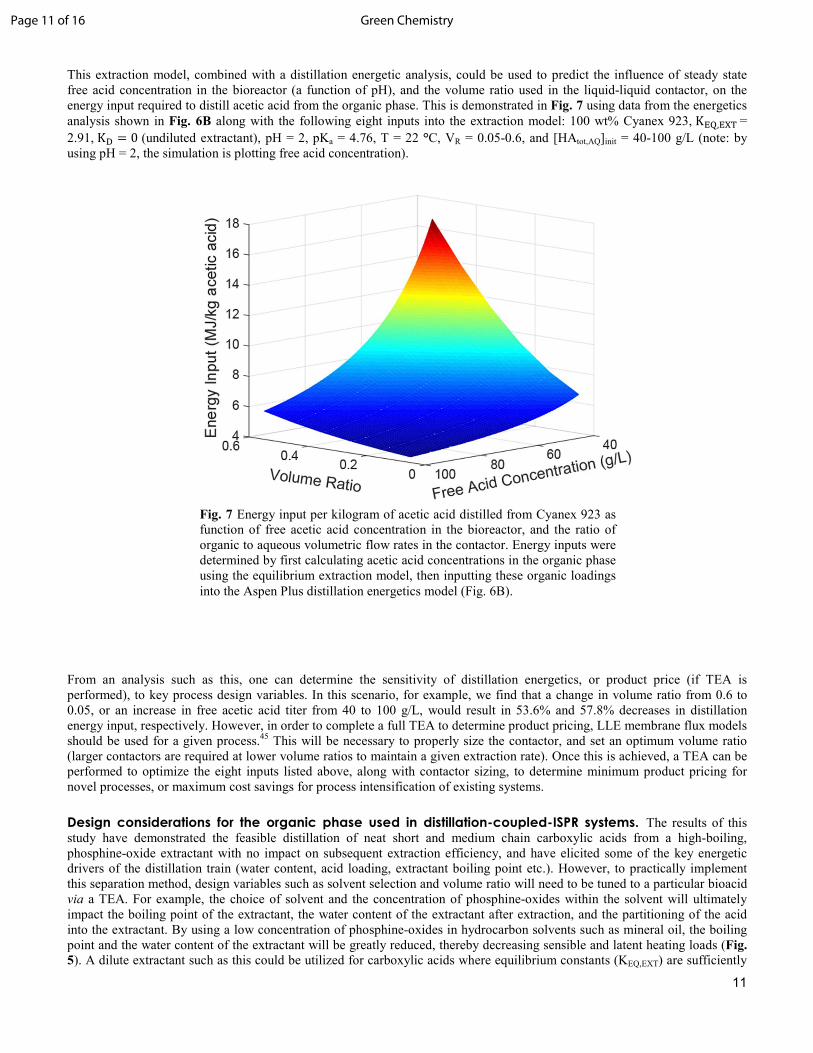
This extraction model, combined with a distillation energetic analysis, could be used to predict the influence of steady state free acid concentration in the bioreactor (a function of pH), and the volume ratio used in the liquid-liquid contactor, on the energy input required to distill acetic acid from the organic phase. This is demonstrated in Fig. 7 using data from the energetics analysis shown in Fig. 6B along with the following eight inputs into the extraction model: 100 wt% Cyanex 923, K��,��� = 2.91, K/ = 0 (undiluted extractant), pH = 2, pKa = 4.76, T = 22 °C, VR = 0.05-0.6, and [HAtot,AQ]init = 40-100 g/L (note: by using pH = 2, the simulation is plotting free acid concentration).
From an analysis such as this, one can determine the sensitivity of distillation energetics, or product price (if TEA is performed), to key process design variables. In this scenario, for example, we find that a change in volume ratio from 0.6 to 0.05, or an increase in free acetic acid titer from 40 to 100 g/L, would result in 53.6% and 57.8% decreases in distillation energy input, respectively. However, in order to complete a full TEA to determine product pricing, LLE membrane flux models should be used for a given process.45 This will be necessary to properly size the contactor, and set an optimum volume ratio (larger contactors are required at lower volume ratios to maintain a given extraction rate). Once this is achieved, a TEA can be performed to optimize the eight inputs listed above, along with contactor sizing, to determine minimum product pricing for novel processes, or maximum cost savings for process intensification of existing systems.
Design considerations for the organic phase used in distillation-coupled-ISPR systems. The results of this study have demonstrated the feasible distillation of neat short and medium chain carboxylic acids from a high-boiling, phosphine-oxide extractant with no impact on subsequent extraction efficiency, and have elicited some of the key energetic drivers of the distillation train (water content, acid loading, extractant boiling point etc.). However, to practically implement this separation method, design variables such as solvent selection and volume ratio will need to be tuned to a particular bioacid via a TEA. For example, the choice of solvent and the concentration of phosphine-oxides within the solvent will ultimately impact the boiling point of the extractant, the water content of the extractant after extraction, and the partitioning of the acid into the extractant. By using a low concentration of phosphine-oxides in hydrocarbon solvents such as mineral oil, the boiling point and the water content of the extractant will be greatly reduced, thereby decreasing sensible and latent heating loads (Fig. 5). A dilute extractant such as this could be utilized for carboxylic acids where equilibrium constants (KEQ,EXT) are sufficiently
Fig. 7 Energy input per kilogram of acetic acid distilled from Cyanex 923 as function of free acetic acid concentration in the bioreactor, and the ratio of organic to aqueous volumetric flow rates in the contactor. Energy inputs were determined by first calculating acetic acid concentrations in the organic phase using the equilibrium extraction model, then inputting these organic loadings into the Aspen Plus distillation energetics model (Fig. 6B).
Page 11 of 16 Green Chemistry

12
high (i.e. caproic, valeric and butyric acids). For these acids, the diminished phosphine-oxide content will not largely impact loading of the acid in the extractant (Fig. S3). Another option is to increase equilibrium constants for acids such as acetic and propionic acid by engineering stronger extractants. Krzyżaniak et al. (2013) synthesized nitrogen containing extractants for lactic acid separation and showed that the tailored extractants have a two-fold enhancement in distribution coefficients over TOA for lactic acid.52 Lastly, reactivity between organic phase and the carboxylic acid should be considered. For example, the use of alcohol containing diluents in a distillation-coupled-ISPR could result in unwanted ester byproducts since alcohols react with carboxylic acids to form esters when heated.53 Finally, the specific tolerance of the microbe(s) for low pH and solvents used in the bioprocess is of great importance. One solution to increase the amount of acid in the organic phase before distillation is to use robust microorganisms that have high tolerance to low pH and produce the free acid in high titers.7, 54 A low pH bioreactor condition would greatly aid in loading the organic phase (Fig. 7A). In addition, the microbe(s) need to be tolerant to the selected organic phase to prevent growth inhibition. Select organic solvent and extractant mixtures are typically tested for toxicity before use in ISPR operation. If an extractant is found to be toxic to the microbe, a non-toxic solvent is used to dilute extractant to a suitable concentration.29, 45 Other methods to minimize toxicity of an extractant include the use of membrane contactors to prevent mixing between the phases,22, 55 the use of a second extraction stage to strip leached extractant from the aqueous phase,56 and the removal of cells from the LLE process by using fixed bed fermentation.57 Cyanex 923 was found to be non-toxic to yeast (K. marxianus and P. fermentans) and fungi (R. arrhizus)33, However, the toxicity of extractants varies widely between microbes58 and it is suggested to optimize the amount of extractant in the organic phase based on both a toxicity assay and extraction efficiency. The environmental impact of carboxylic acid separation technologies. One of the motivations for in situ product recovery (ISPR) of carboxylic acids is the potential reduction of the environmental impact of current industrial separation processes. Although the carbon used in the structure of a bio-based acids can be derived from renewable feedstocks such as lignocellulose, separation processes require energy and may generate a waste product. Concerning the environmental impact of our process, we found that the optimized, heat integrated, distillation of acetic acid from trioctylamine or trioctylphosphine oxide extractants, has a carbon footprint of less than 0.36 kg CO2 per kg of acetic acid when a 50 g/L titer is achieved in the bioreactor (Fig S16), depending on the water content of the organic phase and corresponding to the vacuum and heating duty. At a titer of 10 g/L, in the low water content case, 1 kg of CO2 is produced for each kg of neat acetic acid. In comparison, the current industrial batch mode process of water evaporation coupled to SMB, releases 207 kg CO2/kg acid to concentrate an acid to from 0.5 to 55 wt % (assuming a 50 g/L initial acid titer and zero heat integration, see ESI materials and methods for details). However, the exact carbon footprint of evaporative and SMB processes requires additional information regarding the chosen evaporative technology, acid volatility, heat integration strategy, and SMB elution solvent. For comparison to other bio-derived products from standard non-ISPR separations, the energy demand of conventional ethanol distillation is 5 MJ/kg.61 The reader is referred to Sheehan et. al (2003) 62 and Murphy et al. (2015)63 for the carbon footprint of transportation, pretreatment, and fermentation of feedstocks, such as corn stover and switchgrass, for bioprocesses for which ISPR separations may have relevance. Regarding solvent losses, our coupled LLE-distillation process has zero process waste streams, and thus the E-factor is the same as the carbon footprint. Indeed, near 100% recovery of solvent is industrially viable in distillation processes, such as in oil refining and in industrial extraction systems59, 60 For example, Koch Modular Process Systems has developed a process to recover solvent from an extraction column using a raffinate stripping column and distillation.59, 60 It is worth noting that increased productivity and yield can result from ISPR separations and that membrane-based systems, such as the LLE method proposed in this work, as opposed to direct distillation of aqueous feeds, are in the literature routinely coupled to fermentation for carboxylic acid separation.12 In addition, a more rigorous Aspen Plus, economic and life cycle analysis are needed to make further conclusions about the benefits of this work in comparison to SMB and evaporative processes.
Conclusions An ISPR-coupled distillation process was developed to recover SCCAs and MCCAs from dilute aqueous feeds. The process maintains the carboxylic acid in the free acid state, which simplifies operations into two steps: extraction and distillation.. In the extraction process, heavy solvents and extractants were used to extract light acids, which enabled the recovery of acids as distillates from the organic phase. An equilibrium model was developed to determine the organic phase acid loading from LLE as a function of the extraction equilibrium constant, initial aqueous acid concentration, pH, organic to aqueous volume ratio, and temperature. An Aspen Plus process model was then developed to determine the energy input in the distillation train to water content and acid loading in the organic phase. For a bioprocess with a 50 g/L titer of acetic acid, a LLE and distillation process was designed with an estimated energy input of 2.6 MJ/kg, corresponding to 17.8 % of the heat of combustion of acetic acid and a carbon footprint of 0.36 kg CO2/kg. Compared to the base case of an industrial, non-ISPR process, the distillation coupled LLE process has a ~560-fold potential carbon footprint reduction. The extraction and distillation models can be incorporated in a TEA to determine an optimum ISPR design for production of carboxylic acids. This work provides a framework and methodology for calculating feed targets (pH, and acid concentration), sizing membrane contactors and
Page 12 of 16Green Chemistry
13
optimizing distillation processes for the continuous recovery of bio-based acids. This process could be tuned for to the recovery of other bio-based chemicals such as alcohols, phenols, esters and other carboxylic acids, including itaconic acid, succinic acid, and lactic acid.
Materials and methods
Equilibrium constant (KEQ,EXT) of Extractants
Mock fermentation broths of single acids were prepared in water (unbuffered) with acetic acid, propionic acid, butyric acid , valeric acid , or caproic acid . These mock fermentation broths were mixed with TOA or Cyanex 923 extractant at organic to aqueous volume ratios of 0.03 to 4.0 and stirred for 12 hours. After stirring, the aqueous phase was analyzed by liquid chromatography to determine the concentration of total acid. Free acid in the aqueous phase was determined through the acid dissociation equilibrium equation (Equation S9). The acid concentration in the organic phase was determined by mass balance on the system. KEQ,EXT was calculated from equation 2 using a stoichiometric n-value of 1. The reported error is the standard deviation as determined from extraction of individual acid solutions at various volume ratios and/or initial acid concentrations. Additional information on reported error is provided in the ESI.
Partition coefficient (KD) of solvents
Mock fermentation broths of single acids were prepared in water with a concentration of 30 g/L acetic (pH 2.5), 30 g/L propionic (pH 2.5), 30 g/L butyric acid (pH 2.6), 15 g/L valeric acid (pH 2.6), and 5 g/L caproic acid (pH 2.5). 10 mL of mock fermentation broths were mixed with organic solvents at organic to aqueous volume ratios of 0.1, 0.25, 1.0 and 2.0 and stirred for 12 hours. After stirring, the aqueous phase was analyzed by liquid chromatography to determine the remaining total concentration of acid. The free acid concentration was calculated using the acid dissociation equilibrium equation (Equation S9). The acid concentration in the organic phase was determined through mass balance on the system. The reported error is the standard deviation as determined from extraction of individual acid solutions at various volume ratios and/or initial acid concentrations. Additional information on reported error is provided in the ESI. pH influence 30 extractions were prepared to test the extraction efficiency of aqueous acetic, propionic, butyric, valeric, and caproic acids at 6 different pHs (3, 4, 4.5, 5, 5.5, and 6) into the extractant Cyanex 923. 24 mL of 6 g/L acid solutions were titrated to the desired pH by addition of aqueous sodium hydroxide, then diluted to 30 mL with water to bring the final acid concentration to 5 g/L. The pHs of the acid solutions were measured before and after titration and 50µL samples were taken for analysis by liquid chromatography. The 30 mL acid solutions were stirred vigorously with 5 mL of Cyanex 923 extractant in 50 mL falcon tubes for 24 hrs. The pH of the aqueous phase at equilibrium was measured and a sample of the aqueous phase was taken for analysis by liquid chromatography.
Membrane contactor operation A Liquid-Cel membrane (2.5 x 8) contactor (1.4 m2 surface area, shell volume of ~300 mL, tube side of ~100 mL) (3M, Maplewood, MN) was used for mock continuous extractions of acids (see Fig. S8 for photo of equipment). Cyanex 923 (Cytec Inc., Woodland Park, NJ) was used as the organic phase extractant. An aqueous acid solution of 5 g/L acetic, propionic, butyric and caproic acid was pumped through the contactor at a flow rate of 0.1 to 120 mL/min to give a selected residence time. The residence time of the organic and aqueous phase was constant in each experiment. See Fig. S17 for engineering drawing and equipment details. The organic phase was mixed with aqueous sodium borate (pH 9.0) for 12 hours to back extract acids for analysis.
Spinning band Distillation
A spinning band 800 Micro Distillation System (B/R Instrument Corporation, Easton, MD), equipped with a vacuum pump (Edwards, Burgess Hill, England) was used to distill monocarboxylic acid from extractants and solvents (photo in Fig. S8 Panel B). 50 mL of 100 g/L of acetic, butyric and caproic acid (300 g/L total acid content) was distilled from Cyanex 923, 50 wt% Cyanex 923 in mineral oil, 4% TOPO in mineral oil and TOA. A reflux ratio of 5 was used with the spinning band operating at 2,000 rpm. The organic phase was mixed with aqueous sodium borate (pH 9.0) for 12 hours to back extract acids for analysis.
Liquid chromatography and refractive index detection
Page 13 of 16 Green Chemistry

14
Analysis of samples was performed using an Agilent 1200 LC system (Agilent Technologies, Santa Clara, CA) equipped with a G1362A refractive index detector (RID). Each sample and standard was injected at a volume of 20 μL onto an BioRad Aminex HPX-87H column 9 μm, 7.8 x 300 mm column (BioRad, Hercules, CA) with a RID and column temperature of 55 °C. Compounds were separated utilizing an isocratic flow of 0.01 N H2SO4 in water at 0.6 mL min-1 for a total run time of 52 min. Standards were purchased from Sigma Aldrich (Sigma Aldrich, St Louis, MO). The levels of the calibration curve ranged from 0.05 g/L to 50 g/L. A minimum of 5 calibration levels were used with an r2 coefficient of 0.995 or better for each analyte and a check calibration standard (CCS) was analyzed every 10 samples to insure the integrity of the initial calibration.
Aspen Plus simulations
See electronic supplementary information (ESI)
Karl Fischer titration
Karl Fischer (KF) titrations were conducted with a 701KF Titrino unit, using CombiTitrant 5 (Merck, Kenilworth, NJ) titrant. Calibration of titrant was performed before any sample analysis, using 1% water in 1-methoxy-2-propanol standard (Merck). Samples were added directly to anhydrous methanol in the titration cell for KF moisture determination. Sample aliquot was ~0.1 g, each aliquot was weighed before titration.
Conflicts of Interest There are no conflicts of interest to declare.
Acknowledgements The research reported in this paper was sponsored by the U.S. Department of Energy (DOE), Energy Efficiency and Renewable Energy Office, Bioenergy Technologies Office (BETO) under the BETO Bioprocessing Separations Consortium via Contract No. DE-AC36-08GO28308 with the National Renewable Energy Laboratory. The authors gratefully acknowledge the support of Nichole Fitzgerald at BETO. We thank Stuart Black for guidance and expertise regarding the viscometer equipment and Davinia Salvachúa, Peter St. John, Robert Nelson, and Derek Vardon for helpful discussions. Cyanex 923 was kindly provided by the Cytec Solvay Group. The views and opinions of the authors expressed herein do not necessarily state or reflect those of the United States Government or any agency thereof. Neither the United States Government nor any agency thereof, nor any of their employees, makes any warranty, expressed or implied, or assumes any legal liability or responsibility for the accuracy, completeness, or usefulness of any information, apparatus, product, or process disclosed, or represents that its use would not infringe privately owned rights. The U.S. Government retains, by accepting the article for publication, the publisher acknowledges that the U.S. Government retains a nonexclusive, paid up, irrevocable, worldwide license to publish or reproduce the published form of this work, or allow others to do so, for U.S. Government purposes.
Notes and References ‡ MATLAB code used to generate Fig. 7, S7 and S15 is available on GitHub.com (NREL-SEPCON/LLE_Model_ISPR - https://github.com/NREL-SEPCON/LLE_Model_ISPR) 1. J. M. Woodley, M. Bisschops, A. J. Straathof and M. Ottens, J. Chem. Technol. Biotechnol., 2008, 83, 121-123. 2. M. J. Biddy, R. Davis, D. Humbird, L. Tao, N. Dowe, M. T. Guarnieri, J. G. Linger, E. M. Karp, D. Salvachúa and D.
R. Vardon, ACS Sustainable Chem. Eng., 2016, 4, 3196-3211. 3. Y. S. Jang, B. Kim, J. H. Shin, Y. J. Choi, S. Choi, C. W. Song, J. Lee, H. G. Park and S. Y. Lee, Biotechnol. Bioeng.,
2012, 109, 2437-2459. 4. A. J. Straathof, Chem. Rev., 2013, 114, 1871-1908. 5. J. Becker, A. Lange, J. Fabarius and C. Wittmann, Curr. Opin. Biotechnol., 2015, 36, 168-175. 6. D. Pleissner, D. Dietz, J. B. J. H. van Duuren, C. Wittmann, X. Yang, C. S. K. Lin and J. Venus, Biotechnological
Production of Organic Acids from Renewable Resources, Springer, 2017. 7. Y. Chen and J. Nielsen, Curr. Opin. Biotechnol., 2016, 37, 165-172. 8. J. Wang, M. Lin, M. Xu and S.-T. Yang, in Anaerobes in Biotechnology, Springer, 2016, pp. 323-361. 9. A. Straathof, Comprehensive biotechnology, 2011, 2, 811-814. 10. K. Schügerl and J. Hubbuch, Curr. Opin. Microbiol., 2005, 8, 294-300. 11. T. Fodi, C. Didaskalou, J. Kupai, G. T. Balogh, P. Huszthy and G. Szekely, ChemSusChem, 2017, 10, 3435-3444.
Page 14 of 16Green Chemistry
15
12. V. Outram, C. A. Lalander, J. G. Lee, E. T. Davies and A. P. Harvey, Biotechnol. Progr., 2017, 33, 563-579. 13. C. Didaskalou, S. Buyuktiryaki, R. Kecili, C. P. Fonte and G. Szekely, Green Chemistry, 2017, 19, 3116-3125. 14. C. Xue, G.-Q. Du, J.-X. Sun, L.-J. Chen, S.-S. Gao, M.-L. Yu, S.-T. Yang and F.-W. Bai, Biochem. Eng. J., 2014, 83,
55-61. 15. J. Wu, Q. Peng, W. Arlt and M. Minceva, J. Chromatogr. A, 2009, 1216, 8793-8805. 16. J. Wu, Dissertation, 2009. 17. W. Van Hecke, G. Kaur and H. De Wever, Biotechnol. Adv., 2014, 32, 1245-1255. 18. R. S. Nelson, D. J. Peterson, E. M. Karp, G. T. Beckham and D. Salvachúa, Fermentation, 2017, 3, 10. 19. B. Xiong, T. L. Richard and M. Kumar, J. Membr. Sci., 2015, 489, 275-283. 20. K. Zhang and S.-T. Yang, Biochem. Eng. J., 2015, 96, 38-45. 21. C. S. López-Garzón and A. J. Straathof, Biotechnol. Adv., 2014, 32, 873-904. 22. Z. Jin and S. T. Yang, Biotechnol. Progr., 1998, 14, 457-465. 23. D. Stark and U. von Stockar, in Process Integration in Biochemical Engineering, Springer, 2003, pp. 149-175. 24. Š. Schlosser, R. Kertész and J. Marták, Sep. Purif. Technol., 2005, 41, 237-266. 25. C. Urban, J. Xu, H. Sträuber, T. R. dos Santos Dantas, J. Mühlenberg, C. Härtig, L. T. Angenent and F. Harnisch,
Energy Environ. Sci., 2017, 10, 2231-2244. 26. S. J. Andersen, T. Hennebel, S. Gildemyn, M. Coma, J. Desloover, J. Berton, J. Tsukamoto, C. Stevens and K.
Rabaey, Environ. Sci. Technol., 2014, 48, 7135-7142. 27. K. Kraemer, A. Harwardt, R. Bronneberg and W. Marquardt, Comput. Chem. Eng., 2011, 35, 949-963. 28. J. H. Lee, V. Van Brunt and C. J. King, Ind. Eng. Chem. Res., 1994, 33, 1373-1379. 29. Z. Gu, B. A. Glatz and C. E. Glatz, Biotechnol. Bioeng., 1998, 57, 454-461. 30. K. L. Wasewar, V. G. Pangarkar, A. B. M. Heesink and G. F. Versteeg, Chem. Eng. Sci., 2003, 58, 3385-3393. 31. A. Keshav and K. L. Wasewar, Chem. Eng. Sci., 2010, 65, 2751-2757. 32. A. Keshav, K. L. Wasewar and S. Chand, Chem. Eng. Technol., 2008, 31, 1290-1295. 33. J. Marták, M. Rosenberg, Š. Schlosser and L. u. Krištofíková, Biotechnol. Tech., 1995, 9, 247-252. 34. M. Wisniewski and M. Pierzchalska, J. Chem. Technol. Biotechnol., 2005, 80, 1425-1430. 35. A. Freeman, J. M. Woodley and M. D. Lilly, Nat. Biotechnol., 1993, 11, 1007-1012. 36. J. A. Tamada, A. S. Kertes and C. J. King, Ind. Eng. Chem. Res., 1990, 29, 1319-1326. 37. R. Wódzki and J. Nowaczyk, Sep. Purif. Technol., 2002, 26, 207-220. 38. M. Solichien, D. O'Brien, E. Hammond and C. Glatz, Enzyme Microb. Technol., 1995, 17, 23-31. 39. L. A. Kucek, M. Nguyen and L. T. Angenent, Water Res., 2016, 93, 163-171. 40. M. T. Agler, C. M. Spirito, J. G. Usack, J. J. Werner and L. T. Angenent, Energy Environ. Sci., 2012, 5, 8189-8192. 41. M. Bilgin, C. i. d. Arısoy and S. I. s. Kırbaşlar, J. Chem. Eng. Data, 2009, 54, 3008-3013. 42. Y. M. Lee, J. S. Kang, S. Y. Nam and C. H. Choi, Sep. Sci. Technol., 2001, 36, 457-471. 43. F. Chemarin, M. Moussa, M. Chadni, B. Pollet, P. Lieben, F. Allais, I.-C. Trelea and V. Athès, Sep. Purif. Technol.,
2017, 179, 523-532. 44. K. Z. House, A. C. Baclig, M. Ranjan, E. A. van Nierop, J. Wilcox and H. J. Herzog, Proc. Natl. Acad. Sci. USA,
2011, 108, 20428-20433. 45. Š. Schlosser, R. Kertész and J. Martak, Sep. Purif. Technol., 2005, 41, 237-266. 46. C. Scheler, M. K. Popovic, E. L. Iannotti and R. K. Bajpai, Can. J. Chem. Eng., 1999, 77, 863-868. 47. A. Carlescu, A. Blaga, A.-I. Galaction, M. Turnea and D. Caşcaval, Sep. Sci. Technol., 2014, 49, 974-980. 48. M. Matsumoto, S. Uenoyama, T. Hano, M. Hirata and S. Miura, J. Chem. Technol. Biotechnol., 1996, 67, 260-264. 49. M. T. Agler, B. A. Wrenn, S. H. Zinder and L. T. Angenent, Trends Biotechnol., 2011, 29, 70-78. 50. U. I. Brimberg, J. Am. Oil Chem. Soc., 1993, 70, 249-254. 51. L. M. Vane, Biofuels, Bioprod. Biorefin., 2008, 2, 553-588. 52. A. Krzyżaniak, M. Leeman, F. Vossebeld, T. J. Visser, B. Schuur and A. B. de Haan, Sep. Purif. Technol., 2013, 111,
82-89. 53. T. Pinnarat and P. E. Savage, J. Supercrit. Fluids, 2010, 53, 53-59. 54. B. Max, J. M. Salgado, N. Rodríguez, S. Cortés, A. Converti and J. M. Domínguez, Braz. J. Microbiol., 2010, 41,
862-875. 55. J. T. Dafoe and A. J. Daugulis, Biotechnol. Lett, 2014, 36, 443-460. 56. H. Honda, Y. Toyama, H. Takahashi, T. Nakazeko and T. Kobayashi, J. Ferment. Bioeng., 1995, 79, 589-593. 57. Z. Wu and S. T. Yang, Biotechnol. Bioeng., 2003, 82, 93-102. 58. A. Keshav, P. Norge and K. L. Wasewar, Appl. Biochem. Biotechnol., 2012, 167, 197-213. 59. Koch Modular Process Systems, LLC, Liquid-Liquid Extraction Equipment and Chemical Separation Solutions,
Retrieved from https://kochmodular.com/liquid-liquid-extraction/ 60. R. A. Sheldon, Green Chemistry, 2017, 19, 18-43. 61. V. H. G. Díaz and G. O. Tost, Chemical Engineering and Processing: Process Intensification, 2016, 108, 117-124.
Page 15 of 16 Green Chemistry

16
62. J. Sheehan, A. Aden, K. Paustian, K. Killian, J. Brenner, M. Walsh and R. Nelson, Journal of Industrial Ecology, 2003, 7, 117-146.
63. C. W. Murphy and A. Kendall, Gcb Bioenergy, 2015, 7, 1019-1033.
Page 16 of 16Green Chemistry