In situ and denuder-based measurements of elemental and ...
19
Atmos. Chem. Phys., 17, 465–483, 2017 www.atmos-chem-phys.net/17/465/2017/ doi:10.5194/acp-17-465-2017 © Author(s) 2017. CC Attribution 3.0 License. In situ and denuder-based measurements of elemental and reactive gaseous mercury with analysis by laser-induced fluorescence – results from the Reno Atmospheric Mercury Intercomparison Experiment Anthony J. Hynes 1 , Stephanie Everhart 1 , Dieter Bauer 1 , James Remeika 1 , and Cheryl Tatum Ernest 1,a 1 Division of Marine and Atmospheric Chemistry, Rosenstiel School of Marine and Atmospheric Science, University of Miami, 4600 Rickenbacker Causeway, Miami, Florida 33149, USA a current address: Atmospheric Chemistry Department, Max Planck Institute for Chemistry, Hahn-Meitner-Weg 1, 55128 Mainz, Germany Correspondence to: Anthony J. Hynes ([email protected]) Received: 25 May 2016 – Published in Atmos. Chem. Phys. Discuss.: 18 July 2016 Revised: 9 November 2016 – Accepted: 25 November 2016 – Published: 10 January 2017 Abstract. The University of Miami (UM) deployed a se- quential two-photon laser-induced fluorescence (2P-LIF) in- strument for the in situ measurement of gaseous elemental mercury, Hg(0), during the Reno Atmospheric Mercury In- tercomparison Experiment (RAMIX) campaign. A number of extended sampling experiments, typically lasting 6–8 h but on one occasion extending to ∼ 24 h, were conducted, al- lowing the 2P-LIF measurements of Hg(0) concentrations to be compared with two independently operated instruments using gold amalgamation sampling coupled with cold va- por atomic fluorescence spectroscopic (CVAFS) analysis. At the highest temporal resolution, ∼ 5 min samples, the three instruments measured concentrations that agreed to within 10–25 %. Measurements of total mercury (TM) were made by using pyrolysis to convert total oxidized mercury (TOM) to Hg(0). TOM was then obtained by difference. Variabil- ity in the ambient Hg(0) concentration limited our sensitiv- ity for measurement of ambient TOM using this approach. In addition, manually sampled KCl-coated annular denuders were deployed and analyzed using thermal dissociation cou- pled with single-photon LIF detection of Hg(0). The TOM measurements obtained were normally consistent with KCl denuder measurements obtained with two Tekran speciation systems and with the manual KCl denuder measurements but with very large uncertainty. They were typically lower than measurements reported by the University of Washing- ton (UW) Detector for Oxidized Hg Species (DOHGS) sys- tem. The ability of the 2P-LIF pyrolysis system to measure TM was demonstrated during one of the manifold HgBr 2 spikes but the results did not agree well with those reported by the DOHGS system. The limitations of the RAMIX ex- periment and potential improvements that should be imple- mented in any future mercury instrument intercomparison are discussed. We suggest that instrumental artifacts make a substantial contribution to the discrepancies in the reported measurements over the course of the RAMIX campaign. This suggests that caution should be used in drawing significant implications for the atmospheric cycling of mercury from the RAMIX results. 1 Introduction The environmental and health impacts of mercury pollu- tion are well recognized with impacts on human health and broader environmental concerns (US EPA, 2000; UNEP, 2013; Mergler et al., 2007; Díez, 2009; Scheuhammer et al., 2007). There have been extensive reviews of global emis- sions, measurements and biogeochemical cycling of mercury (Mason, 2009; Streets et al., 2011; Pirrone et al., 2009; Lind- berg et al., 2007; Ebinghaus et al., 2009; Sprovieri et al., 2016; Selin, 2009). The concerns associated with the mer- cury problem have resulted in attempts to regulate and con- trol emissions at both national and international levels. The Published by Copernicus Publications on behalf of the European Geosciences Union.
Transcript of In situ and denuder-based measurements of elemental and ...

Atmos Chem Phys 17 465ndash483 2017wwwatmos-chem-physnet174652017doi105194acp-17-465-2017copy Author(s) 2017 CC Attribution 30 License
In situ and denuder-based measurements of elemental and reactivegaseous mercury with analysis by laser-induced fluorescence ndashresults from the Reno Atmospheric MercuryIntercomparison ExperimentAnthony J Hynes1 Stephanie Everhart1 Dieter Bauer1 James Remeika1 and Cheryl Tatum Ernest1a
1Division of Marine and Atmospheric Chemistry Rosenstiel School of Marine and Atmospheric ScienceUniversity of Miami 4600 Rickenbacker Causeway Miami Florida 33149 USAacurrent address Atmospheric Chemistry Department Max Planck Institute for Chemistry Hahn-Meitner-Weg 155128 Mainz Germany
Correspondence to Anthony J Hynes (ahynesrsmasmiamiedu)
Received 25 May 2016 ndash Published in Atmos Chem Phys Discuss 18 July 2016Revised 9 November 2016 ndash Accepted 25 November 2016 ndash Published 10 January 2017
Abstract The University of Miami (UM) deployed a se-quential two-photon laser-induced fluorescence (2P-LIF) in-strument for the in situ measurement of gaseous elementalmercury Hg(0) during the Reno Atmospheric Mercury In-tercomparison Experiment (RAMIX) campaign A numberof extended sampling experiments typically lasting 6ndash8 h buton one occasion extending to sim 24 h were conducted al-lowing the 2P-LIF measurements of Hg(0) concentrations tobe compared with two independently operated instrumentsusing gold amalgamation sampling coupled with cold va-por atomic fluorescence spectroscopic (CVAFS) analysis Atthe highest temporal resolution sim 5 min samples the threeinstruments measured concentrations that agreed to within10ndash25 Measurements of total mercury (TM) were madeby using pyrolysis to convert total oxidized mercury (TOM)to Hg(0) TOM was then obtained by difference Variabil-ity in the ambient Hg(0) concentration limited our sensitiv-ity for measurement of ambient TOM using this approachIn addition manually sampled KCl-coated annular denuderswere deployed and analyzed using thermal dissociation cou-pled with single-photon LIF detection of Hg(0) The TOMmeasurements obtained were normally consistent with KCldenuder measurements obtained with two Tekran speciationsystems and with the manual KCl denuder measurementsbut with very large uncertainty They were typically lowerthan measurements reported by the University of Washing-ton (UW) Detector for Oxidized Hg Species (DOHGS) sys-
tem The ability of the 2P-LIF pyrolysis system to measureTM was demonstrated during one of the manifold HgBr2spikes but the results did not agree well with those reportedby the DOHGS system The limitations of the RAMIX ex-periment and potential improvements that should be imple-mented in any future mercury instrument intercomparisonare discussed We suggest that instrumental artifacts makea substantial contribution to the discrepancies in the reportedmeasurements over the course of the RAMIX campaign Thissuggests that caution should be used in drawing significantimplications for the atmospheric cycling of mercury from theRAMIX results
1 Introduction
The environmental and health impacts of mercury pollu-tion are well recognized with impacts on human health andbroader environmental concerns (US EPA 2000 UNEP2013 Mergler et al 2007 Diacuteez 2009 Scheuhammer et al2007) There have been extensive reviews of global emis-sions measurements and biogeochemical cycling of mercury(Mason 2009 Streets et al 2011 Pirrone et al 2009 Lind-berg et al 2007 Ebinghaus et al 2009 Sprovieri et al2016 Selin 2009) The concerns associated with the mer-cury problem have resulted in attempts to regulate and con-trol emissions at both national and international levels The
Published by Copernicus Publications on behalf of the European Geosciences Union
466 A J Hynes et al Results from the RAMIX mercury intercomparison
latest attempt in the United States is incorporated in the Mer-cury and Air Toxics Standards (Houyoux and Strum 2011US EPA 2013) and international efforts by the United Na-tions Environment Program have led to the Minamata Con-vention on Mercury a global legally binding treaty on mer-cury controls (UNEP 2008 2013 2014) There is a reason-able consensus on typical background concentrations of at-mospheric mercury which are extremely low Typical con-centrations range from 12ndash14 ng mminus3 in the Northern Hemi-sphere and 09ndash12 ng mminus3 in the Southern Hemisphere andappear to be decreasing (Slemr et al 2011 Sprovieri et al2016) (1 ng mminus3 issim 3times106 atoms cmminus3 orsim 120 ppq (partsper quadrillion)) Until recently it has been accepted thatmost of the mercury found in the boundary layer is elemen-tal mercury Hg(0) (Lindberg et al 2007) Oxidized or re-active gaseous mercury (RGM) normally assumed to be inthe Hg(II) oxidation state has not been chemically identifiedand is thought to constitute a very small fraction of the to-tal mercury concentration although recent work (Gustin etal 2013 Ambrose et al 2013) challenges this view Ouroverall understanding of the atmospheric chemistry of mer-cury and the detailed elementary chemical reactions that oxi-dize Hg(0) is poor (Lin et al 2006 Hynes et al 2009 Subiret al 2011 2012) and the uncertainty of both the chem-ical identity and measurements of speciated oxidized mer-cury places few constraints on models Atmospheric mea-surements of mercury represent a significant challenge inultra-trace analytical chemistry and the issues associatedwith current techniques have been discussed by Gustin andJaffe (2010) We have developed a laser-based sensor forthe detection of Hg(0) using sequential two-photon laser-induced fluorescence (2P-LIF) (Bauer et al 2002 2014)The instrument is capable of fast in situ measurement ofHg(0) at ambient levels By incorporating pyrolysis to con-vert RGM and particulate mercury to Hg(0) it is possible tomeasure total mercury (TM ie the sum of Hg(0) plus gas-phase and particulate bound oxidized mercury) and henceto measure total oxidized mercury (TOM ie the sum ofgas-phase and particulate bound oxidized mercury) by dif-ference The Reno Atmospheric Mercury IntercomparisonExperiment (RAMIX) offered an opportunity to deploy the2P-LIF instrument as part of an informal field intercompar-ison at the University of Nevada Agricultural ExperimentStation (Gustin et al 2013 Ambrose et al 2013 Finleyet al 2013) RAMIX was an attempt to intercompare newHg measurement systems with two Tekran 253711301135systems This is the instrumentation that is currently in usefor the overwhelming majority of atmospheric Hg measure-ments Participants included the University of Washington(UW) University of Houston (UH) Desert Research Insti-tute (DRI) University of Nevada Reno (UNR) and the Uni-versity of Miami (UM) The specific goals for the projectwere to
1 compare ambient measurements of gaseous elementalmercury Hg(0) gaseous oxidized mercury (RGM) andparticulate bound mercury (PBM) by multiple groupsfor 4 weeks
2 examine the response of all systems to spikes of Hg(0)and HgBr2
3 examine the response of all systems to Hg(0) in the pres-ence of the potentially interfering compounds of ozoneand water vapor and
4 analyze the data to quantify the level of agreement andthe results of interference and calibration tests for eachmeasurement system
In practice the instrument operated by UH only measuredHg(0) for the first week of the campaign and the cavity ringdown spectroscopy (CRDS) instrument deployed by DRI didnot produce any data Hence RAMIX was primarily an in-tercomparison of the UM 2P-LIF instrument the UW De-tector for Oxidized Hg Species (DOHGS) that is based ontwo Tekran 2537 instruments and a Tekran 2537 and two253711301135 speciation systems deployed by UNR Un-der these circumstances we were not able to compare 2P-LIF measurements made at high temporal resolution withthe CRDS instrument It did allow us to compare the 2P-LIFsensor with independently operated instruments that use pre-concentration on gold coupled with analysis by cold vaporatomic fluorescence spectroscopic (CVAFS) and to exam-ine potential interference effects Our focus here is to com-pare the short-term variation in GEM on the timescale thatthe CVAFS instruments operate sim 5 min samples and ex-amine the ability of the different instruments to capture thisvariation In addition we made measurements of TM andhence TOM by difference and also employed manual de-nuder measurements to attempt to measure RGM directlyIn prior publications Gustin et al (2013) and Ambrose etal (2013) provide their interpretation of the RAMIX resultsand their conclusions have very significant implications forour understanding of atmospheric mercury chemistry In thiswork we offer a contrasting view with different conclusions
2 Experimental
21 RAMIX intercomparison
A detailed description of the RAMIX location and the lo-cal meteorology was provided by Gustin et al (2013) Theoriginal RAMIX proposal included participation from theTekran Corporation to build and test a field-deployed high-flow-sampling manifold that could be reliably spiked with10ndash100 ppq of RGM Tekran proposed to supply both RGMand Hg(0) spiking using independent generators that weretraceable to NIST standards and would be independent ofthe detection systems being evaluated However due to time
Atmos Chem Phys 17 465ndash483 2017 wwwatmos-chem-physnet174652017
A J Hynes et al Results from the RAMIX mercury intercomparison 467
constraints Tekran believed that it was unlikely that the man-ifold and ultra-trace spiking system could be manufacturedand fully tested to their standards so they declined to par-ticipate in RAMIX (E C Prestbo personal communication2015) Instead the UW group stepped in to supply and oper-ate the sampling manifold and spiking system and the detailsof its characterization are provided in Finley et al (2013)During the RAMIX campaign the 2P-LIF instrument sam-pled on 18 days typically sampling for between 4 and 6 hThe longest period of continuous sampling lasted for 26 hand occurred on 1 and 2 September Over this 18-day periodwe sampled from the RAMIX manifold and in addition atthe end of the campaign we sampled ambient air indepen-dently and also attempted to measure TOM by pyrolyzingthe sample air and measuring the difference between Hg(0)and TM We also sampled RGM using KCl-coated annulardenuders using LIF for real-time analysis
22 The 2P-LIF system
Bauer et al (2002 2003 2014) provide a description ofthe operating principles of the 2P-LIF instrument Bauer etal (2014) provide a detailed description of the 2P-LIF instru-ment deployed at RAMIX including the sampling configura-tions data processing calibration and linearity tests togetherwith examples of experimental data In summary the systemuses sequential two-photon excitation of two atomic transi-tions in Hg(0) followed by detection of blue-shifted LIF Theinstrumental configuration at RAMIX utilized an initial exci-tation of the Hg 63P1ndash61S0 transition at 2537 nm followedby excitation to the 71S0 level via the 71S0ndash63P1 transition at4078 nm Both radiative decay and collisional energy trans-fer produce population in the 61P1 level Blue-shifted fluo-rescence was then observed on the strong 61P1ndash61S0 tran-sition at 1849 nm using a solar-blind photomultiplier tube(PMT) By using a solar-blind tube that is insensitive to laserscatter at the excitation wavelengths very high sensitivity ispossible The use of narrowband excitation of two atomictransitions followed by detection of laser-induced fluores-cence at a third wavelength precludes the detection of anyspecies other than Hg(0) The 2P-LIF instrument requirescalibration so Hg(0) was also measured with a Tekran 2537Busing its internal permeation source as an absolute calibra-tion We sampled from the RAMIX manifold which was be-low ambient pressure through sim 25 ft (sim 75 m) of 025 in(635 mm diameter) in Teflon tubing No filter was placedon the sampling line to attempt to remove ambient RGM orthe HgBr2 spikes that were periodically added to the sampleflow The sampling line was not heated and was not shieldedfrom the sun The original RAMIX plan called for all instru-ments to be located close to the manifold for optimal sam-pling Unfortunately the positioning of the trailers at the ac-tual site precluded this and forced us to use a long samplingline As a result the internal pump on our Tekran was notable to draw the 15 SLPM required for sampling and an aux-
iliary pump was placed on the Tekran exhaust to boost theflow Under atmospheric conditions the 2P-LIF instrumentcannot detect RGM so in principle this does not need to beremoved from the sample gas However deposition of RGMon the sampling lines followed by heterogeneous reductionto GEM could produce measurement artifacts The limit ofdetection for Hg(0) during RAMIX was sim 30 pg mminus3 for a10 s or 100-shot average
23 Measurements of TM and TOM
We attempted to use the 2P-LIF instrument to measure TMand hence TOM by difference Although we have routinelyused this approach to convert HgCl2 and HgBr2 to Hg(0) inthe laboratory this was our first attempt to measure total oxi-dized mercury at ambient concentrations A second samplingline was attached to the RAMIX manifold and a pyrolyzerwas located directly at the manifold sampling port Thepyrolyzer consisted of an sim 06 cm od quartz tube 15 cmin length and partially filled with quartz wool WrappedNichrome wire encompassed an 8 cm section of tube that washeated until the quartz began to glow The high temperatureinside the pyrolyzer reduces both RGM and particulate mer-cury in the manifold air to Hg(0) which is then monitored by2P-LIF and gives the sum of oxidized (both gaseous and par-ticulate) and elemental mercury ie TM Directly samplingfrom the manifold and measuring ambient Hg(0) then al-lows the concentration of TOM to be calculated as the differ-ence between the two signals Both lines were continuouslysampled at 10 L minminus1 and the flow to the fluorescence cellwas switched between the pyrolyzed and unpyrolyzed sam-ple lines in typically 5 min intervals to attempt to track fluc-tuations in [Hg(0)] that would obscure the relatively smallsignal increase attributable to TOM
24 Manual denuder sampling of RGM
We conducted manual denuder sampling on seven afternoonsduring the RAMIX campaign to attempt to quantify totalRGM We sampled using both KCl-coated annular denudersand uncoated tubular denuders that were then analyzed us-ing programmable thermal dissociation (Ernest et al 2014)In both cases we monitored the Hg(0) that evolved duringRGM decomposition in real time using single-photon LIFOnly the annular denuder results are presented here The useof denuder sampling coupled with thermal dissociation hasbeen described by Landis et al (2002) and is used in theTekran model 1130 mercury speciation units deployed dur-ing RAMIX Air is pulled through a KCl-coated annular de-nuder which captures RGM but transmits elemental and par-ticulate mercury After a period of sampling typically 1 hthe denuder is flushed with zero-grade air and the denuder isheated to 500 C The RGM is thermally decomposed pro-ducing elemental mercury that desorbs from the denuder sur-face and is then captured and analyzed by a Tekran 2537 The
wwwatmos-chem-physnet174652017 Atmos Chem Phys 17 465ndash483 2017
468 A J Hynes et al Results from the RAMIX mercury intercomparison
Table 1 RAMIX manual KCl denuder sampling
Date Sample time Mid-point Sample Blank Time Spec1 Spec2 (uncorr)hours hour pg mminus3 pg mminus3 GOM PBM GOM PBM
pg mminus3 pg mminus3 pg mminus3 pg mminus3
96 15 15 1279lowast 227 1300 2007 518 2051 431500 657 320 849 60
97 2 16 1129lowast 0 1400 398 1364 943 25212 1600 485 1773 689 15
2858lowast 1800 281 1822 374 33306
910 3 153 743 1995 1400 267 105 274 42442 1600 241 183 237 23
913 4 15 128 82 1300 07 169 05 1661356 1700 376 161 252 27
914 45 14 39lowast 33 1200 349 120 239 55173 1400 57 184 263 386
1600 420 174 263 40
915 45 15 1524 153 1300 1139 391 276 39204 487 1500 806 222 177 39
1700 1108 241 86 81
916 275 16 148lowast 5 0800 197 47 148 5442 6 090026 5 1000 287 133 199 4847 4
lowast Evidence from temporal decomposition profiles (TDPs) for presence of PBM Measurements for UNR speciation system made at similar timesThe Spec2 measurements are uncorrected values Dates are indicated in mmdd format
KCl-coated annular denuders used here were manufacturedby URG Corporation and were identical to those describedby Landis et al (2002) for manual sampling They were lo-cated on top of one of the RAMIX instrument trailers a fewfeet from the entrance to the RAMIX manifold inlet The de-nuders sampled at 10 SLPM they were not heated and the in-tegrated elutriatoracceleration jet and impactorcoupler de-scribed by Landis et al (2002) and incorporated in the model1100 speciation unit were not placed on the denuder inletHence no type of particle filtering was used on the inletsThe denuders were cleaned and recoated prior to the RAMIXdeployment Prior to sampling the denuders were cleanedby heating to 500 C and then bagged and taken to the sam-pling site After a period of sampling that varied from sim 1to 4 h the denuders were capped placed in sealed plasticbags and transported to the analysis lab at the Universityof Nevada Reno On most of the sampling days a singledenuder was opened and then immediately bagged servingas a field blank On the final 2 days of sampling denuderswere sampled in pairs ie with two denuders connected in-line so that the front denuder sampled RGM and the reardenuder served as a blank and monitor of bleedthrough ofRGM The blank concentrations are typically low as shownin Table 1 however on 10 September the blank shows a very
high value that is indicative of significant contamination atsome point during the cleaning or sampling process For theanalysis a flow of helium (He) passed through the denud-ers and then into a fluorescence cell where any Hg(0) in theflow was detected by LIF The LIF was monitored by twoPMTs set to different gains to increase the dynamic range ofthe detection system Prior to the analysis a known amountof mercury was injected into the flow through a septum us-ing a transfer syringe The syringe sampled from a Tekranmodel 2505 mercury vapor primary calibration unit With-out disrupting the gas flow the denuder was then placed ina clamshell tube furnace that had been preheated to 500 CThe evolution of the Hg(0) was monitored for typically 5ndash10 min and after the LIF signal had returned to baseline asecond calibration injection was performed A frequency-doubled NdYAG-pumped dye laser was used to excite theHg(0) 63P1ndash61S0 transition at 2537 nm and resonance LIFwas observed at the same wavelength In this approach thedetection PMT detects both LIF and laser scatter hence sen-sitivity is limited by the ratio of intensity of the LIF signal tothe laser scatter Since the 63P1 level is efficiently quenchedby both O2 and N2 (Breckenridge and Unemoto 2007) thethermal analysis was performed in He buffer gas to achievegood detection sensitivity The excitation beam then passed
Atmos Chem Phys 17 465ndash483 2017 wwwatmos-chem-physnet174652017
A J Hynes et al Results from the RAMIX mercury intercomparison 469
through a reference cell that contained a steady flow of Hg(0)from a permeation source The LIF signal from the referencecell served to confirm that the laser output was stable
3 Results
31 RAMIX manifold
As noted above the RAMIX manifold had to be constructedand tested by the UW group under tight time constraintsand details of its characterization are provided in Finley etal (2013) A critique of the manifold performance has beenpresented by Prestbo (2016) and we detail some key issueshere The manifold deployed at RAMIX was a different sizethan the prototype tested in the laboratory The laboratorymanifold showed very large variation in calculated trans-mission efficiencies of Hg(0) after spiking with a perme-ation source Finley et al reported recoveries of 71ndash101 for short-term spikes The authors speculate that this was as-sociated with rapid changes in ambient Hg(0) but provideno measurements to support this The Hg(0) source used forspiking was gravimetrically calibrated by the manufacturerbut was not used at the calibration temperature requiring theoutput to be calibrated by a Tekran 2537B After the equip-ment was moved to the RAMIX site the permeation tubeoutput increased The authors also acknowledge a significantuncertainty (plusmn15 ) in the RAMIX manifold flow measure-ments that were required to calculate spike concentrationshence this is the minimum uncertainty in calculated spikeconcentrations
In fact we find that several independent measurements ofHg(0) spikes differ by as much as 30 from the value cal-culated by the manifold operators suggesting that (plusmn15 )underestimates the uncertainty Because of these considera-tions we believe the RAMIX manifold is best treated as asemi-quantitative delivery system that was not well charac-terized We do not feel it is appropriate to characterize ldquore-coveriesrdquo as Gustin et al (2013) have done because of thelarge uncertainty in Hg(0) spike concentrations Rather it ismost useful to focus on sampling periods when multiple in-dependent instruments show reasonable agreement
32 UM Tekran performance
In evaluating the first week of the UM RAMIX measure-ments it became clear that there was some nonlinearity inthe relative responses of the 2P-LIF and UM Tekran systemsand that better agreement was obtained by referencing theHg(0) concentration to the UNR Tekran Gustin et al (2013)concluded that the UNR Tekran based on the inlet configura-tion only measured Hg(0) and they suggested that the UMsystem due to the long sampling line was measuring totalgaseous mercury (TGM) We compared the manifold Hg(0)readings from the UM and UNR Tekrans over the first 260 hin which we took measurements The absolute concentration
difference relative to the UNR instrument is shown in Fig 1Hour 0 corresponds to 0900 PDT on 26 August when westarted measurements and hour 260 corresponds to midnighton 5 September Over the first 24 h the UM Tekran is off-set by sim 05 ng mminus3 and the offset jumps to sim 2 ng mminus3 athour 30 on 27 August with the difference decreasing overthe next week of measurements in an almost linear fashionOver most of this period the UW Tekran did not report Hg(0)measurements other than a small set of measurements on28 August that are offset bysim 05 ng mminus3 relative to the UNRTekran It can be seen that by hour 250 on 5 September allthree instruments had converged After this period the agree-ment between the UW UNR and UM Tekrans was good until8 September when the UM instrument became contaminatedafter a malfunction of our external permeation oven requir-ing replacement with a backup Tekran 2537A unit Both theabsolute response and the response factor ie the calibrationfactor of the UM Tekran were somewhat unstable during thisperiod and additional details are provided in the SupplementOur focus during this initial period of the intercomparisonwas on the two laser systems that were being set up In retro-spect we can acknowledge that greater attention should havebeen paid to quality assurance with the UM Tekran We con-clude that the difference between the UM and UNR instru-ments is an experimental artifact Problems with instabilityin the UM Tekran may have been associated with the use ofan external pump to supplement the internal Tekran pump orwith the fact that the UM instrument had been powered downfor almost 1 week and relocated to a site at a significantly dif-ferent ambient pressure It is also noteworthy that the initialabrupt change to a large offset followed by the offsets shownin Fig 1 occurred prior to the start of the manifold spikes ofHgBr2 and cannot be associated with the elevated levels ofHgBr2 that were introduced into the manifold on 5 Septem-ber The differences between the instruments cannot in ourview be indicative of any type of chemistry within our sam-pling lines nor can it be indicative of the UM instrumentmeasuring TGM rather than Hg(0)
33 2P-LIF measurements
The absolute Hg(0) concentrations reported for the 2P-LIFmeasurements typically use a single 10 min section of Tekranconcentration data to calibrate the 2P-LIF signal and place iton an absolute concentration scale The complete time seriesof measurements then gives a long-term comparison of the2P-LIF and Tekran instrumentation with the absolute 2P-LIFconcentrations based on the single 10 min calibration point
331 5 September
This was the first occasion on which the three indepen-dent Tekran 2537 instruments and the 2P-LIF system re-ported simultaneous measurements The 2P-LIF system sam-pled from the RAMIX manifold for approximately 65 h
wwwatmos-chem-physnet174652017 Atmos Chem Phys 17 465ndash483 2017
470 A J Hynes et al Results from the RAMIX mercury intercomparison
Figure 1 Comparison of Hg(0) readings from the UM UW andUNR Tekrans over the first 260 h of UM measurements The ab-solute concentration difference relative to the UNR instrument isshown in black for the UM Tekran and in red for the DOHGS (UW)Tekran
from sim 1030 to 1700 PDT Over the course of the sam-pling period there were two spikes of Hg(0) lasting 1 and2 h respectively The UW manifold team reported an ini-tial 1000 PDT Hg(0) spike concentration of 265 ng mminus3
dropping to 244 ng mminus3 over the course of the 1 h spikeThe 2 h spike that began at 1300 PDT was reported to besim 124 ng mminus3 dropping to 105 ng mminus3 over the course of2 h The ambient airflow in the manifold was spiked withHgBr2 for the whole of this sampling period and the re-ported level of the HgBr2 spike varied between 06 and07 ng mminus3 The levels of HgBr2 measured by the DOHGSinstrument were consistent with this but the concentrationsreported by the UNR speciation units were considerablylower and with a significant discrepancy between the twospeciation units Figure 2a shows the sequence of Hg(0) mea-surements from the UNR UW and UM Tekrans togetherwith the 5 min averages of the 2P-LIF signal The 2P-LIFinstrument began manifold measurements in the middle ofthe initial 1000 PDT Hg(0) spike and is scaled to the con-centration at this time which all three Tekrans measured assim 225 ng mminus3 The three Tekrans agree to better than 5 during both of the manifold spikes and based on a pre-spikeambient concentration of 2 ng mminus3 it suggests that the initialspike concentration was sim 205 ng mminus3 This suggests thatthe reported spike concentration was sim 25ndash30 larger thanthe actual concentration introduced into the manifold Fig-ure 2b shows an expanded concentration scale to highlightthe nominally ambient measurements There is some sugges-tion that it took some time for the spike to be completely re-moved particularly after the second spike At the completionof the second spike all the instruments drop to ambient butthe UNR instrument sees two Hg(0) ldquopulsesrdquo Interestinglythese show up with greatly reduced amplitudes in the UW
C S
Figure 2 (a) A 7 h sequence of GEM measurements from5 September that included two manifold spikes Shown are thesequence of GEM measurements from the UNR UW and UMTekrans together with the 5 min averages of the 2P-LIF signal(b) An expanded concentration scale focusing on ambient measure-ments
and UM Tekran signals and also in the 2P-LIF signal Fig-ure 3 shows the percent difference of the other instrumentsrelative to the UM Tekran and over most of the samplingperiod the agreement between all the measurements is betterthan 10 over a sim 7 h period with 5 min sampling resolu-tion This indicates that the 2P-LIF instrument is capable ofstable operation over an extended time period with any driftsbeing corrected by normalization to the reference cell Well-calibrated independently operated Tekrans should be capa-ble of agreement to better than 5 based on tests performedby the manufacturer and this level of agreement is achievedduring subsets of the sampling period It is not clear if thedeviations that are observed particularly the large deviationsseen by the UNR Tekran after the second spike are relatedto the presence of elevated levels of HgBr2 or other issuesrelated to manifold operation The fact that all the instru-ments observed these Hg(0) pulses suggests that the artifactmay be related to a process in the manifold rather than inthe UNR sampling line However the significant differencesin the magnitude of Hg(0) pulses observed by the differentinstruments are difficult to rationalize
Atmos Chem Phys 17 465ndash483 2017 wwwatmos-chem-physnet174652017
A J Hynes et al Results from the RAMIX mercury intercomparison 471
Figure 3 A 7 h measurement period from 5 September The per-cent difference of the UNR (black line) and UW (red line) Tekransand the UM 2P-LIF (green line) measurements relative to the UMTekran is shown
332 1 and 2 September
The UM and UNR systems sampled simultaneously for a22 h period offering an opportunity to compare the instru-ments over an extended sampling period This sampling alsooccurred prior to any of the manifold spikes that introducedsubstantial concentrations of HgBr2 into the manifold andsampling lines Unfortunately the UW instrument did notreport any measurements during this sampling period TheUM system sampled for 26 h and the complete dataset is de-scribed elsewhere (Bauer et al 2014) This includes a de-tailed analysis of the short-term ie 1ndash10 s variation in theHg(0) concentration and the ability of the 2P-LIF systemto capture this Here we focus on the simultaneous sam-pling period and the variability that should be resolvableby both of the Tekrans and the 2P-LIF instruments Fig-ure S1 in the Supplement shows the 24 h sampling periodwith the 2P-LIF signal calibrated by the UM Tekran con-centration at the beginning of hour 13 (ie 1300 PDT on1 September) and the corresponding measurements from theUNR Tekran Figure S2 in the Supplement shows the samedata with an expanded y axis to highlight the variation inthe ambient measurements All three instruments track eachother quite well over the first 10 h and then measure a noc-turnal increase in Hg(0) which shows greater midterm vari-ability in the concentration The 2P-LIF concentrations areapproximately 20 greater than the Tekran measurementsduring this period At hour 33 (ie 0900 PDT on 2 Septem-ber) there was a manifold spike with a reported concentra-tion of 129 ng mminus3 dropping to 119 ng mminus3 over the courseof 1 h The UNR Tekran is sim 6 lower the UM Tekran issim 20 lower and the 2P-LIF sim 22 higher than the calcu-lated spike concentration Figure S3 shows the same mea-
Figure 4 A 22 h sampling period from 1 and 2 September Com-parison of the UM (red line) and UNR (green line) Tekrans withthe UM 2P-LIF (black line) concentrations The concentrations foreach instrument are scaled to force agreement during the secondmanifold spike at hour 33 These are the data from Fig S3 with theconcentration scale expanded to show only ambient data
surement set but with all instruments normalized to the sec-ond manifold spike at hour 33 Figure 4 shows an expandedy axis the concentration scale focusing on the ambient con-centration measurements It is apparent that we now see bet-ter agreement between the 2P-LIF and the UNR Tekran butthat the UM Tekran lies systematically higher than the UNRTekran Figure 5 shows a 3 h subset of the measurements cor-responding to 0500ndash0800 PDT on the morning of 2 Septem-ber The variation between the instruments is greater than 5 and the short-term variations in the Hg(0) concentration varybetween the three instruments Using either calibration ap-proach we see that all instruments capture both the nocturnalincrease in Hg(0) concentration and the greater variability inthe signal but that there are differences in the amplitude ofthe variability
333 Hg(0) intercomparison conclusions
Almost all of the measurements of atmospheric concentra-tions of Hg(0) have been made with CVAFS instrumenta-tion and the majority of those measurements have utilized theTekran 2537 This work provides the first extensive compar-ison of the Tekran 2537 with an instrument that is capable offast in situ detection of Hg(0) using a completely differentmeasurement technique Measurements over two extendedsampling periods show substantial agreement between the2P-LIF and Tekran measurements and suggest that all theinstruments are primarily measuring the same species In-tercomparison precision of better than 25 was achievableover an extended sampling period and precision of better than10 was achieved for subsets of the sampling period Aswe discuss below it is difficult to determine the extent to
wwwatmos-chem-physnet174652017 Atmos Chem Phys 17 465ndash483 2017
472 A J Hynes et al Results from the RAMIX mercury intercomparison
Figure 5 A section of the 22 h sampling period from 1 and2 September Comparison of the UM (red line) and UNR (greenline) Tekrans with the UM 2P-LIF (black line) concentrations Theconcentrations for each instrument are scaled to force agreementduring the second manifold spike at hour 33 These are the datafrom Fig S3 with the concentration scale expanded to show onlyambient data between hours 29 and 32
which interferences from RGM contribute to the differencesobserved
34 Interference tests
As noted above one component of the initial RAMIX pro-posal was an examination of the response of the various sen-sors to potential interfering compounds HgBr2 O3 and H2OAn analysis of the 2P-LIF detection approach suggests thatat the spike levels employed during the RAMIX campaignneither HgBr2 nor O3 should have any interference effectsChanges in the concentration of H2O do affect the 2P-LIFsignal because H2O absorbs the 2P-LIF fluorescence signaland may quench the fluorescence In addition O2 also ab-sorbs the 2P-LIF signal and quenches fluorescence thus achange in the O2 concentration will affect the linearity of theresponse We have presented a detailed discussion of theseeffects (Bauer et al 2014) including an examination of twotypes of interferences that have been observed in LIF sen-sors applied in atmospheric and combustion environmentsand concluded that these are not potential problems in 2P-LIF measurements of atmospheric Hg(0) As we have notedpreviously (Bauer et al 2014) condensation in our samplinglines can produce artifacts in Hg(0) concentration measure-ments Because of the low humidity in Reno it was not nec-essary to use any type of cold trap during ambient measure-ments but we did use a trap during manifold spikes of H2Oso our measurements do not address this as a potential inter-ference
O3 Interference tests
On 7 September an ozone interference test was conductedby simultaneously spiking the sampling manifold with highconcentrations of Hg(0) and ozone The spike in Hg(0) lastedfrom 0900 to 1930 PDT and there were two ozone spikeseach 2 h in duration A comparison of the UM UW and UNRTekrans and the 2P-LIF signal is shown in Fig 6 The UWTekran only measured for a portion of this period but agreesreasonably well with the other Tekrans The 2P-LIF signal iscalibrated by the UM Tekran reading during the initial Hg(0)spike at 0930 PDT The 2P-LIF signal was online for 6 minat the beginning of the first ozone spike and then went offlinefor sim 40 min for instrument adjustments When the 2P-LIFcame back online the magnitude of the normalized signalwas low relative to the Tekrans At 1300 PDT all three in-struments converge and agree well over the course of the sec-ond spike The magnitude of the 2P-LIF signal could havebeen affected adversely by the adjustments but any reductionin signal should have been compensated by a correspondingchange in the reference cell The elevated levels of ozonewere introduced into the manifold by UV irradiation of O2and adding the O2 O3 gas mixture directly into the mani-fold produced a reported sim 8 relative increase of O2 levelsin the manifold mixing ratio As we note above this addi-tional O2 would absorb some of the 2P-LIF signal but thiswould be a very small effect The enhanced quenching byO2 is more difficult to assess but cannot explain the discrep-ancy between the Tekrans and the 2P-LIF signal In additionthe agreement during the second ozone spike was good Onepossible explanation is that the increase in the O2 mixing ra-tio was larger than calculated for the first spike A secondseries of O3 spikes were conducted on 13 September whenwe were attempting to measure total mercury using pyrolysisas described below The 2P-LIF measurements switched ona 5 min cycle between a pyrolyzed line that would have de-composed all the ozone in the sample and a line containingthe ambient air spiked with ozone There was no differencein the 2P-LIF signal from the two sampling channels againsuggesting that O3 has no interference effects
The changes in the Hg(0) concentration measurementsshown in Fig 6 track the predicted changes in calculatedspike concentration However the calculated spike concen-trations which are also shown are 20ndash40 higher than theactual measurements made by the Tekrans
35 Measurements of TM and TOM
We made attempts to use the 2P-LIF instrument to measureTM and hence TOM by difference by sampling through twomanifold lines A pyrolyzer was located at the manifold onone of the sampling lines to measure TM The other samplingline measured ambient Hg(0) TOM was calculated from thedifference in the TM and Hg(0) concentrations and in thissampling configuration the limit of detection for TOM de-
Atmos Chem Phys 17 465ndash483 2017 wwwatmos-chem-physnet174652017
A J Hynes et al Results from the RAMIX mercury intercomparison 473
ndash ndash
Figure 6 An ozone interference test on 7 September A compari-son of the UM UW and UNR Tekrans and the UM-2P-LIF mea-surements The ldquoexpectedrdquo concentration calculated from the ambi-ent Hg(0) concentration prior to the spike plus the calculated spikeconcentration is also shown
pends on the short-term variability in ambient Hg(0) whichis significant and shows a diurnal variation The pyrolysissystem was set up and tested on 12 September Manifoldsampling was conducted on the 13th and 14th and samplingfrom the trailer roof occurred on the 15th We calculated themeans of the pyrolysis and ambient channel concentrationsand the difference which gives the TOM concentration Wealso calculated the standard deviations and standard errors(SEs) and used these errors to calculate in quadrature the 2SE uncertainty in the derived TOM concentration Howeveras discussed below the errors in the means do not appear tocapture the full variability in Hg(0) particularly at shortersampling times
351 14 September
Our most extensive sampling took place on the 14th when wewere able to sample for three sim 2 h periods between 0900and 2000 PDT On this day there were multiple manifoldspikes of HgBr2 and also an Hg(0) spike and we have a madea detailed analysis of the data for each sampling period
The third sampling period which included a large HgBr2spike provided the only definitive opportunity to demon-strate the capability of 2P-LIF coupled with pyrolysis tomeasure oxidized mercury The third sampling period be-gan at sim 1710 PDT during a manifold HgBr2 spike thatbegan at 1700 PDT A short Hg(0) spike was also intro-duced at 1800 PDT Figure 7 shows the 2P-LIF signals fromthe ambient and pyrolyzed sampling lines together with themeans and 1 standard deviation The UM Tekran was of-fline at this time and so the 2P-LIF concentrations are cal-ibrated by the concentrations reported by the UNR Tekranat the beginning of the Hg(0) spike which are also shownBoth the UNR Tekran and UW Tekran report very similar
ndash
Figure 7 Measurements from 14 September hours 17ndash19 (1700ndash1900 PDT) The background-subtracted 2P-LIF signals from theambient (black) and pyrolyzed (red) sampling lines are shown Thegaps correspond to times when the laser was blocked to check powerand background The means and 1 standard deviation of each sam-ple are shown The absolute Hg(0) concentrations are obtained byscaling the ambient Hg(0) signal to the absolute Hg(0) concentra-tion reported by the UNR Tekran during the Hg(0) manifold spike
Hg(0) concentrations during the Hg(0) spike Both systemsreport an Hg(0) concentration of 67 ng mminus3 at the begin-ning of the spike which since the pre-spike concentrationwas sim 19 ng mminus3 corresponds to a spike concentration of48 ng mminus3 This is lower than the calculated spike concen-tration of 61 ng mminus3 reported by the manifold operators andsuggests that the calculated spike was sim 27 higher thanthe actual spike concentration introduced into the manifoldFigure 8 shows the means of each set of ambient and py-rolyzed measurements together with the 2σ variation and2 SEs of the mean Figure 9 shows the TOM concentra-tions calculated from the difference together with 2 SEs inthe TOM concentration The reported spike concentrationsand DOHGS measurements are also shown During the ini-tial sampling period between sim 1710 and 1750 PDT the2P-LIF pyrolysis measurements do not show evidence foran HgBr2 spike Taking the difference between the ambi-ent and pyrolyzed measurements during this period we ob-tain [TOM]= 005plusmn 005 ng mminus3 Shortly before the intro-duction of the Hg(0) spike we see clear evidence for an in-crease in the Hg(0) concentration in the pyrolysis sample rel-ative to the ambient sample We speculate that the manifoldadjustments that were made to introduce the additional Hg(0)spike produced either a change in the flow or some otherchange in the manifold conditions that allowed the HgBr2spike to reach our pyrolyzer which as mentioned above waslocated at the manifold This difference between the two 2P-LIF signals is clearly evident by inspection of Fig 7 Fig-ure 9 shows that the TOM concentration which should con-sist almost exclusively of HgBr2 is significantly larger than
wwwatmos-chem-physnet174652017 Atmos Chem Phys 17 465ndash483 2017
474 A J Hynes et al Results from the RAMIX mercury intercomparison
MM
14 Sep
Figure 8 The 14 September measurements hours 17ndash19 Themeans of the ambient channel (black) and pyrolyzed channel (red)are shown The error bars show both 2 standard errors (thicker line)and 2 standard deviations
both the reported HgBr2 spike concentration and the concen-trations reported by the DOHGS system which are in per-fect agreement Taking the difference between the ambientand pyrolyzed measurements for 1800ndash1821 PDT we ob-tain [TOM]= 120plusmn 017 ng mminus3 with 2 SE uncertainty It isimportant to note again that the calculated Hg(0) spike con-centration is 27 larger than the measured concentrationThis large difference is most likely due to errors in the flowsor the permeation source output but it suggests that little con-fidence can be placed in the calculated concentration of theHgBr2 spike In addition it is clear that the DOHGS mea-surements show a different temporal profile of TOM TheDOHGS system reports TOM concentrations that agree al-most exactly with the calculated spike concentration at thebeginning of the spike period and drop to a very low back-ground level that is below the detection limit at the end ofthe reported spike period In contrast the 2P-LIF measure-ments do not show an increased TOM concentration untilshortly before the introduction of the Hg(0) spike and theytake sim 20 min to drop to background levels The UNR spe-ciation systems sample for 1 h and this is followed by a 1 hanalysis period so they produce a single hourly average ev-ery 2 h During this period the UNR speciation system Spec1sampled for sim 20 min during the spike period and then for afurther 40 min Spec2 was sampling ambient air outside themanifold
Figure S4 shows the 7 s average of the 2P-LIF signal fromthe ambient and pyrolysis sample lines for the first samplingperiod at 0800ndash1027 PDT together with the mean and 1standard deviation (1σ) variation in the 2P-LIF signals Fig-ure S5 shows the means together with the 2σ variation and 2SEs of the mean It is clear that there is significant short-termvariability in the ambient Hg(0) concentration Figure S6shows the TOM concentrations calculated from the differ-ence between the pyrolyzed and ambient channels together
Sep
Figure 9 TOM concentrations calculated from the difference be-tween the pyrolyzed and ambient sample concentrations togetherwith 2 SEs in the TOM concentrations The reported HgBr2 spikeconcentrations and DOHGS measurements are also shown
r d
Figure 10 KCl manual denuder measurements from 16 SeptemberThe raw data for the TDPs for the denuder D1 are shown
with the calculated 2 SEs in the TOM concentration Thereported spike concentration is also shown If we take themeans of the 2P-LIF ambient and pyrolysis measurementsduring the reported spike period we obtain ambient values of206plusmn 005 ng mminus3 and pyrolyzed values of 221plusmn 003 ngmminus3 giving a TOM concentration of 0145plusmn 005 ng mminus3The 2P-LIF measurements are consistent with the detectionof TOM but they are much lower than the calculated spikeand DOHGS measurements shown in Fig 10
Figures S7ndashS9 show the corresponding plots for the sec-ond sampling period fromsim 1212ndash1400 PDT The alternat-ing sampling between the ambient and pyrolysis channelsis more even and Fig S7 shows that there is still variabil-ity in ambient Hg(0) The means of all the samples giveambient values of 172plusmn 002 ng mminus3 and pyrolyzed valuesof 170plusmn 002 ng mminus3 If we take the subset of measure-ments that coincide with the reported spike we obtain am-
Atmos Chem Phys 17 465ndash483 2017 wwwatmos-chem-physnet174652017
A J Hynes et al Results from the RAMIX mercury intercomparison 475
bient values of 179plusmn 002 ng mminus3 and pyrolyzed values of177plusmn 002 ng mminus3 In this case the 2P-LIF measurementsdo not detect HgBr2 and are not consistent with the reportedspike or DOHGS measurements
Figures S10 and S11 show the averages of the TOM con-centrations from the 2P-LIF system together with the mea-surements from the UNR speciation systems the reportedspike concentrations and 5 min DOHGS concentrations Dur-ing this sampling period Spec1 sampled from the RAMIXmanifold while Spec2 sampled ambient air outside the mani-fold Gustin et al (2013) detailed problems with the responseof the Spec2 system and applied a 70 correction that is alsoshown as ldquoSpec2 correctedrdquo Because both the DOHGS and2P-LIF pyrolysis systems are expected to measure the sum ofgaseous (RGM) and particulate (PBM) oxidized mercury wehave plotted the sum of the RGM and PBM concentrationsfrom the speciation systems They are plotted at the midpointof the 1 h sampling period
Over most of the measurement period the 2P-LIF pyrol-ysis and Spec1 measurements are consistent and lower thanthe DOHGS measurements The exception is the large spikein TOM seen by the 2P-LIF system at hour 18 The spikeoccurred during the initial portion of Spec1 sampling andalthough it measures an increase in RGM relative to Spec2the magnitude is not consistent with the 2P-LIF pyrolysis ob-servations
352 13 September
13 September was the first day we were able to samplewith the pyrolysis system and we sampled over a period of5 h The only manifold spike during this period was an O3spike at 1300 PDT that lasted 1 h so the speciation instru-ments were attempting to measure ambient RGM Figure S12shows averages of TOM concentrations as measured by the2P-LIF pyrolysis system together with the hourly averages asmeasured by the DOHGS and UNR speciation instrumentsThe x axis error shows the duration of the 2P-LIF measure-ments together with 2 SE y axis error bars Two of the aver-ages of the 2P-LIF measurement give a physically unrealisticnegative concentration suggesting that combining the 2 SEsin the means of the ambient and pyrolyzed channels under-estimates the uncertainty in the TOM measurement
353 15 September
On 15 September we sampled from the trailer roof usingthe same sampling lines and again alternating between thepyrolyzed and unpyrolyzed channels Figure S13 shows theaverages of the 2P-LIF signal from the ambient and pyrol-ysis channels together with the concentrations measured bythe Spec2 system that was sampling ambient air outside themanifold The concentration obtained from the UM denudersamples described below are also shown The UW DOHGSand Spec1 systems were sampling from the RAMIX mani-
fold with continuous HgBr2 spiking during this period Wesee some evidence for measurable RGM in the first hour ofthe measurements and this is not seen by Spec2 Later mea-surements show no evidence for measurable RGM concen-trations
36 Limits of 2P-LIF detection of TOM
As we have noted above our limit of detection of TOMdepends on the short-term variability in the ambient Hg(0)concentration because we use a single fluorescence cell andswitch between pyrolysis and ambient channels We have at-tempted to give an estimate of the uncertainty by taking 2SEs of the means and combining the errors in quadrature toget an estimate of the uncertainty in the TOM concentrationIf the mean of the ambient Hg(0) concentration is not fluc-tuating significantly on the timescale of channel switchingthis approach should give an accurate estimate of the uncer-tainty in TOM In fact our Hg(0) observations show that thefluctuations in the Hg(0) concentration show a significant di-urnal variation with large fluctuations at night decreasingover the course of morning hours and being smallest in theafternoon This can be seen in the long-term sampling from1 and 2 September and in the observations from 14 Septem-ber The observation of statistically significant but physicallyunrealistic negative TOM concentrations on 13 Septembermay be explained by this Such an artifact could be producedby contamination in the Teflon valve-switching system thatalternates the flow to the fluorescence cell This type of con-tamination should produce a constant bias that is not actuallyobserved It appears that the short-term variability in Hg(0)concentration produces a small bias in some cases that isnot averaged out by switching between the ambient and py-rolyzed channels For example on 13 September the initialsample period of 1 h and 12 min gives an RGM concentrationof 006plusmn 010 ng mminus3 while two shorter sampling periods at1030 PDT (36 min sample) and 1330 PDT (12 min sample)give 015plusmn 009 ng mminus3 Our results suggest that the use of asingle detection channel with switching between ambient andpyrolyzed samples is not adequate to resolve the small con-centration differences that are necessary to be able to monitorambient TOM It is essential to set up two detection systemsone continuously monitoring ambient Hg(0) and the othercontinuously monitoring a pyrolyzed sample stream givingTM to get the precision needed to monitor ambient TOMOver most of the measurement periods our results are con-sistent with the lower TOM values reported by the UNR spe-ciation instruments although there is a large uncertainty inthe concentrations that is actually difficult to quantify In ad-dition it is important to emphasize that this was our first at-tempt to use the pyrolysis approach to attempt to measureTOM It is possible that the pyrolyzer was not working ef-ficiently on 13 September The results from 14 Septemberare more difficult to rationalize The 2P-LIF pyrolysis systemhas the sensitivity to detect the much higher values of RGM
wwwatmos-chem-physnet174652017 Atmos Chem Phys 17 465ndash483 2017
476 A J Hynes et al Results from the RAMIX mercury intercomparison
reported by the DOHGS system and the reported spike con-centrations of HgBr2 At higher concentrations as shown inFig 9 the 2P-LIF system can monitor HgBr2 with sim 10 mintime resolution Our results however cannot be reconciledwith those reported by the DOHGS system or the spike con-centrations reported by the UW manifold team
37 Manual denuder measurements
As we describe above our use of manual denuders was sim-ilar to that described by Landis et al (2002) with the ex-ception that we did not incorporate the integrated elutria-toracceleration jet and impactorcoupler on the denuder in-let and the denuders were not heated Landis et al (2002)suggest that HgCl2 is quantitatively transported throughthe manual denuder elutriatorimpactor inlet when properlyheated In later work Feng et al (2003) reported that suchimpactors could reduce the efficiency of RGM collection al-though in that work there is no reference to the temperatureof the impactor In this work no type of particle filtering wasused on the inlets In addition we used single-photon LIF tomonitor the evolution of Hg(0) in real time as the RGM de-composed on the hot denuder surface during oven analysisThe analysis was carried out in He buffer gas and the Hg(0)concentration was calibrated by manual injections The firstseries of measurements ie 6ndash14 September involved singledenuder sampling On the 15th and 16th we employed tan-dem sampling with two denuders in series to assess the ex-tent of RGM ldquobleedthroughrdquo We used two sets of denuderson the 15th and four sets of denuders on the 16th Figure 10shows the raw data for a denuder analysis showing the pre-heat Hg(0) calibration injections and the temporal profile ofthe Hg(0) LIF signal for one of the 16 September samplesdenuder 1 The two traces correspond to the two monitoringPMTs set at different gains to increase the dynamic range ofthe measurements Figure 11 shows the calibrated profile forthe same denuder together with the ldquoblankrdquo ie the trailingdenuder The complete set of manual denuder data togetherwith corresponding values for the UNR speciation units thatare closest in sampling time are shown in Table 1 Samplingoccurred on denuders 1 4 6 and 7 The ldquotrailingrdquo denuderswhich we have treated as blanks are denuders 3 5 8 and9 The advantage of monitoring the RGM decomposition inreal time is shown in the 16 September data The temporaldecomposition profiles (TDPs) for three of the denuders areshown in Fig 11 and Figs S14 and S15 show reasonableagreement both in absolute concentration of Hg(0) and thetime for decomposition to occur The fourth denuder sampleFig S16 is a factor of 4ndash5 higher in concentration and de-composes on a longer timescale with significant structure inthe TDP Comparing the TDPs for all eight denuders it isclear that the TDP for denuder 7 which shows the anoma-lously high value is very different from the TDPs for theother three sample denuders We believe that this TDP is as-sociated with particulate mercury that has impacted on the
--
Figure 11 KCl manual denuder measurements from 16 SeptemberThe calibrated TDPs for the tandem denuder pair D1 and D3 areshown
denuder wall and decomposes on a slower timescale givinga very different temporal profile from RGM that was de-posited on the denuder wall Table 1 shows the values ofRGM obtained from denuder analysis together with an in-dication of impact from a PBM component We have alsoincluded measurements from the UNR speciation systemsthat overlap with or are close to the times when our mea-surements were made We draw several conclusions fromthe measurements The values we obtain from simultane-ous measurements that are not influenced by the presence ofPBM agree reasonably well with each other are broadly con-sistent with the values reported by the Tekran speciation sys-tems and are typically much lower than the values from theUW DOHGS system Two sets of tandem denuder measure-ments from 15 and 16 September indicate that there is not asignificant level of bleedthrough onto the trailing denudersThis suggests that the large differences between the DOHGSsystem and the UNR speciation systems are not due to spe-cific problems with the RAMIX manifold or the speciationsystems deployed at RAMIX even though Spec2 was notfunctioning properly as documented by Gustin et al (2013)The tandem sampling also demonstrates that any denuder ar-tifact is not a result of some type of bleedthrough artifact thatis preventing RGM from being quantitatively captured by thefirst denuder These results are consistent with prior work byLandis et al (2002) and Feng et al (2003) It is also notewor-thy that the manually sampled denuders were at ambient tem-perature in contrast to the speciation denuders that were heldat 50 C Hence the absolute sampling humidities are similarbut the relative humidities are very different Finally we sug-gest that there is value in monitoring RGM decomposition inreal time as diagnostic of particulate impact when utilizingthe annular denuders without the impactor inlet designed toremove coarse particulate matter that may be retained due togravitational settling
Atmos Chem Phys 17 465ndash483 2017 wwwatmos-chem-physnet174652017
A J Hynes et al Results from the RAMIX mercury intercomparison 477
4 Implications of RAMIX results
We think a realistic assessment of the RAMIX results isimperative because the interpretation of the RAMIX dataand the conclusions presented by Gustin et al (2013) andAmbrose et al (2013) have enormous implications for bothour understanding of current experimental approaches to at-mospheric sampling of mercury species and for the chem-istry itself Speciation systems using KCl denuder samplingare widely used in mercury monitoring networks world-wide to measure RGM concentrations and the Gustin etal (2013) and Ambrose et al (2013) papers suggest theseresults greatly underestimate RGM concentrations with noclear way to assess the degree of bias
41 Intercomparison of Hg(0)
The assessment of the Hg(0) measurements is a little dif-ferent in the two papers with Ambrose et al (2013) notingthat ldquocomparisons between the DOHGS and participating Hginstruments demonstrate good agreement for GEMrdquo whereGEM refers to Hg(0) and they found a mean spike recov-ery of 86 for the DOHGS measurements of Hg(0) basedon comparisons between measured and calculated spike con-centrations Gustin et al (2013) suggest that the UM Tekranagreed well with measurements of TM reported by the DO-HGS system and they ldquohypothesize that the long exposedTeflon line connected to the UM Tekran unit provided a set-ting that promoted conversion of RM to GEM or that RMwas transported efficiently through this line and quantifiedby the Tekran system The latter seems unlikely given thesystem configuration rdquo where RM refers to reactive mer-cury As we note above we believe that the best explanationfor discrepancies between the UM and UNR Tekrans is anexperimental issue with the UM Tekran response during theinitial period of sampling We would suggest that data from5 September one of the few occasions when data from multi-ple instruments agreed over an extended period are not com-patible with either transmission or inline reduction of RGMin our sampling line What is also significant from these datais the very large discrepancy between the spike concentra-tions as measured independently by three different Tekransystems and confirmed by the relative response of the 2P-LIF measurements and the calculated spike concentrationThe discrepancy on the order of 25ndash30 is larger than themanifold uncertainties suggested by Finley et al (2013) Wenote other examples of the measured Hg(0) spikes being sig-nificantly lower than the calculated concentrations In priorwork we have shown that both the Tekran and 2P-LIF sys-tems show excellent agreement over more than 3 orders ofmagnitude in concentration when monitoring the variation inHg(0) in an N2 diluent It is to be expected therefore thatthe recovery of high-concentration spikes should show goodagreement between the different instruments as observed inthe 5 September data The difference between the observa-
tions and the calculated manifold spike concentrations is wewould suggest a reflection of the significant uncertainty inthe calculated manifold spike concentration and is not a re-flection of reactive chemistry removing Hg(0) In additionrandom uncertainties in the flow calculations should not pro-duce a consistently low bias relative to the calculated spikeconcentrations As we note above in Sect 31 Ambrose etal (2013) report an increase in the output of their Hg(0) per-meation tube after the move to the RAMIX site but this as-sumes that their Tekran calibration is accurate The resultsare consistent with their Tekran measuring too high an out-put from the permeation device This is significant if the sameTekran is being used to calibrate the output of the HgBr2
A more difficult issue is the question of resolving the dif-ferences in the temporal variation of ambient Hg(0) at the5 min timescale as captured by the different instruments TheTekran systems should be in agreement with a precision ofbetter than 5 and the 2P-LIF system with a much fastertemporal resolution and detection limit should be capable ofmatching this The differences here are not consistently asso-ciated with a single instrument for example with the 2P-LIFhaving some systematic offset with respect to the CVAFSsystems The extent to which the larger (ie larger than 5 )observed discrepancy which ranged from 10 to 25 is a re-sult of interferences or simply a reflection of instrument pre-cision is difficult to assess We note again that the UM instru-ments had to sample through a very long sampling line andwe expect that oxidized mercury is deposited on the sam-pling line However it is not possible to assess the extentto which oxidized mercury is reduced back to its elementalform introducing small artifacts As we suggest below anintercomparison of instrument response to variation in Hg(0)concentrations in a pure N2 diluent with the Hg(0) concentra-tion varying between 1 and 3 ng mminus3 would provide a defini-tive baseline measurement of the instrument intercomparisonprecision and accuracy We suggest that such a measurementis a critical component of any future intercomparison of mer-cury instrumentation
42 Comparison of total oxidized mercury
To the best of our knowledge RAMIX is the only experi-ment that has measured ambient TOM using multiple inde-pendent techniques It should again be emphasized that theTOM measurements using pyrolysis with 2P-LIF detectionwere the first attempt to perform such measurements and theuse of a single-channel detection system introduced large un-certainties into the measurements The very large discrep-ancies between the measurements of TOM reported by theDOHGS system the Tekran speciation systems and the lim-ited number of 2P-LIF pyrolyzer measurements are the mostproblematic aspect of the RAMIX measurement suite Workprior to RAMIX suggested a potential ozone andor humidityinterference in the operation of KCl-coated annular denudersand a number of studies since have also reported such an ef-
wwwatmos-chem-physnet174652017 Atmos Chem Phys 17 465ndash483 2017
478 A J Hynes et al Results from the RAMIX mercury intercomparison
WO
Wndash1
0100
Figure 12 The ozone concentration and absolute humidity for a35 h sampling period on 13 and 14 September that included twoozone spikes and only sampled ambient TOM
fect (Lyman et al 2010 McClure et al 2014) Typicallyhowever the differences between the RAMIX measurementsare large and are not germane to the differences between theDOHGS and 2P-LIF pyrolyzer measurements The Supple-ment figures give an example of the differences between theDOHGS measurements and the denuder and 2P-LIF mea-surements Ambrose et al (2013) note that the DOHGS mea-surements were on average 35 times larger than those re-ported by the Spec1 system and summarize the comparisonwith denuder measurements as follows ldquoThese comparisonsdemonstrate that the DOHGS instrument usually measuredRM concentrations that were much higher than and weaklycorrelated with those measured by the Tekran Hg speciationsystems both in ambient air and during HgBr2 spiking testsrdquoThe discrepancy of a factor of 35 is an average value but forexample examining the 14 September data at sim 0500 PDTthe DOHGS system is measuring in excess of 500 pg mminus3
compared with sim 20 pg mminus3 measured by the speciation sys-tems a factor of 25 difference At this point the Hg(0) con-centration was sim 3 ng mminus3 so based on the DOHGS mea-surements oxidized mercury is sim 15 of the total mercuryconcentration A recent study by McClure et al (2014) pro-vided a quantitative assessment of the extent to which ozoneand humidity impact the recovery of HgBr2 on KCl recoveryThey note that although they provide a recovery equation tocompare with other studies they do not recommend use ofthis equation to correct ambient data until more calibrationresults become available In Fig 12 we show the ozone con-centration and absolute humidity for a 35 h sampling periodon 13 and 14 September that included two ozone spikes andonly sampled ambient TOM Figure 13 shows the expecteddenuder recovery based on the formula determined by Mc-Clure et al (2014) which varies between a typical value ofsim 70 dropping tosim 50 during the ozone spikes The fig-ure also shows the reported recoveries ie the ratio of RGM
0100
Figure 13 Expected denuder recovery based on the formula de-termined by McClure et al which varies between a typical value ofsim 70 dropping tosim 50 during the ozone spikes The figure alsoshows the reported recoveries ie the ratio of RGM as measuredby either the UNR speciation systems or the 2P-LIF system dividedby the value reported by the DOHGS system
as measured by either the UNR speciation systems or the 2P-LIF system divided by the value reported by the DOHGS sys-tem These values are typically much lower than those pre-dicted by the McClure recovery expression In addition on13 September and for most of the 14th the 2P-LIF pyrolysissystem sees little or no evidence for high spike concentra-tions of HgBr2 but records levels that fluctuate around thosereported by the speciation systems The one exception is thespike at hour 18 on 14 September
We suggest that the ability of the 2P-LIF pyrolysis systemto monitor large spike concentrations is shown by the mea-surements during the 14 September HgBr2 spike at hour 18The evidence for an enhancement in the pyrolyzed samplestream is observable in the raw 7 s averaged data and be-comes clear taking 5 min averages The absolute value of thepyrolyzed enhancement is obtained relative to the concen-tration of the Hg(0) during the spike taken from the mea-surements by the UNR Tekran that are in excellent agree-ment with the DOHGS Hg(0) values The 2P-LIF measure-ments show a significantly larger HgBr2 concentration anda different temporal profile compared with the DOHGS in-strument In particular it is very difficult to rationalize thedifference between the 2P-LIF and DOHGS systems duringthe first hour of the spike We would suggest it is difficult tomake the case that both instruments are measuring the samespecies It is clear that the 2P-LIF pyrolyzer is operating ef-ficiently based on the clear observation of TOM at the endof the spike We again note that the 2P-LIF system is notsensitive to TOM It is important to note that the DOHGS in-strument requires an inline RGM scrubber to remove RGMbefore the measurement of Hg(0) This inline scrubber uti-lizes deposition on uncoated quartz wool and the results ofAmbrose et al (2013) imply that while uncoated quartz cap-
Atmos Chem Phys 17 465ndash483 2017 wwwatmos-chem-physnet174652017
A J Hynes et al Results from the RAMIX mercury intercomparison 479
tures RGM efficiently in the presence of O3 quartz with aKCl coating promotes efficient reduction to Hg(0)
It is also reasonable to question the extent to which theTekran speciation systems operated at RAMIX reflect theperformance of these systems when normally operated underrecommended protocols As noted above the operation ofthe RAMIX manifold and the Tekran speciation systems hasbeen questioned by Prestbo (2016) In our view the two mostsignificant issues are the performance of the two 2537 mer-cury analyzers associated with each speciation system andthe reduced sampling rate The performance of the two 2537units is detailed in Gustin et al (2013) and as they notedthere was a significant response in each instrument Exami-nation of Fig S6 of Gustin et al (2013) shows the relativeresponses of the two instruments and using concentrationsup to 25 ng mminus3 ie manifold spikes they list a regressionof 072[Hg(0)]+ 008 whereas for the non-spike data theyobtain 062[Hg(0)]+ 025 Their Table S5 lists the regressionincluding spikes as 07 (plusmn001)+ 02 with all concentrationsexpressed in ng mminus3 When considering the use of these an-alyzers to monitor oxidized mercury the important factor toconsider is the loading on the gold cartridge Their Table S3lists the mean RGM concentrations from manifold samplingas 52 pg mminus3 for Spec1 and 56 pg mminus3 for Spec2 For a 1 hsample at 4 L minminus1 this corresponds to a cartridge loadingof 13 pg This is similar to the cartridge loading for sam-pling a concentration of 06 ng mminus3 at 4 L minminus1 for 5 minIf we examine Fig S6 of Gustin et al (2013) we see thatthe regression analyses are based on concentrations higherthan 06 ng mminus3 ie higher cartridge loadings At concentra-tions of 06 ng mminus3 the ratio of Spec2 Spec1 obtained fromthese regressions would be 105 085 and 106 depending onwhich regression formula is used We should note that basedon Table S6 of Gustin et al (2013) the median RGM concen-trations in manifold sampling were 41 and 46 pg mminus3 TheRGM concentrations for free-standing sampling were evenlower with means of 26 and 19 pg mminus3 and medians of 23and 14 pg mminus3 for Spec1 and Spec2 respectively For con-centrations below 40 pg mminus3 the cartridge loading drops be-low 10 pg and in addition the Tekran 2537 integration rou-tine becomes significant Swartzendruber et al (2009) re-ported issues with the standard integration routine and notethat below cartridge loadings of 10 pg the internal integra-tion routine produces a low bias in the Hg(0) concentrationThey recommend downloading the raw data ie PMT out-put and integrating offline This issue has recently been dis-cussed by Slemr et al (2016) in a reanalysis of data fromthe CARIBIC program This compounds the problem of cor-recting the bias between Spec1 and Spec2 Because the spe-ciation instruments were sampling at 4 L minminus1 rather thanthe recommended 10 L minminus1 a large number of the mea-surements made by the speciation systems are based on un-corrected cartridge loadings of less than 10 pg mminus3 Basedon the above we caution against drawing significant con-clusions based on differences between Spec1 and the cor-
rected Spec2 These differences are the basis of the conclu-sions of Gustin et al (2013) that ldquoOn the basis of collectiveassessment of the data we hypothesize that reactions form-ing RM (reactive mercury) were occurring in the manifoldrdquo(Gustin et al 2013 abstract) Later they state ldquoThe sametwo denuders coated by the same operator were used from2 to 13 September and these were switched between instru-ments on 9 September Prior to switching the slope for theequation comparing GOM as measured by Spec1 vs Spec2adjusted was 17 (r2
= 057 p lt 05 n= 76) after switch-ing this was 12 (r2
= 062 p lt 005 n= 42) This indi-cates that although there may have been some systematicbias between denuders Spec2 adjusted consistently measuredmore GOM than Spec1 We hypothesize that this trend isdue to production of RM in the manifold (discussed later)rdquoIf reactions in the manifold were producing RM then thisproduction would surely have resulted in the DOHGS mea-suring artificially high ie higher than ambient concentra-tions of oxidized mercury However the paper by Ambroseet al (2013) (written by a subset of the authors of Gustin etal 2013) makes no mention of manifold production of ox-idized mercury In fact Ambrose et al (2013) state in theSupplement to their paper ldquoThe same two denuders pre-pared by the same operator were used in the Tekran Hg spe-ciation systems from 2 to 13 September The denuders wereswitched between Spec1 and Spec2 on 9 September From2 to 9 September the Spec1-GOM Spec2-GOM linear re-gression slope was 17 (r2
= 057 p lt 005 n= 76) from9 to 13 September the Spec1-GOMSpec2-GOM slope was12 (r2
= 062 p lt 005 n= 42) These results suggest thatthe precisions of the GOM measurements made with Spec1and Spec2 were limited largely by inconsistent denuder per-formancerdquo
The oxidized mercury concentrations presented by Am-brose et al (2013) for the RAMIX measurements suggesta well-defined diurnal profile that peaks at night It is im-portant to note that the error bars on this profile (Fig 3 ofAmbrose et al 2013) are 1 standard error rather than 1 stan-dard deviation The standard deviations which actually givean indication of the range of concentrations measured showmuch larger errors indicating significant day-to-day variationin these profiles Nevertheless the measurements show muchlarger oxidized mercury concentrations than the speciationsystems and the very limited number of 2P-LIF measure-ments As we note below there is no known or hypothesizedchemistry that can reasonably explain the large RGM con-centrations seen by the DOHGS instrument Both Gustin etal (2013) and Ambrose et al (2013) draw some conclusionsabout the chemistry of mercury that have significant impli-cations for atmospheric cycling Gustin et al (2013) suggestin their abstract that ldquoOn the basis of collective assessmentof the data we hypothesize that reactions forming RM wereoccurring in the manifoldrdquo Later in a section on ldquoImplica-tionsrdquo they conclude ldquoThe lack of recovery of the HgBr2spike suggests manifold reactions were removing this form
wwwatmos-chem-physnet174652017 Atmos Chem Phys 17 465ndash483 2017
480 A J Hynes et al Results from the RAMIX mercury intercomparison
before reaching the instrumentsrdquo The residence time in theRAMIX manifold was on the order of 1 s depending on sam-pling point and there is no known chemistry that can ac-count for oxidation of Hg(0) or reduction of RGM on thistimescale We would suggest that the most reasonable ex-planation of the discrepancies between the various RAMIXmeasurements includes both instrumental artifacts and an in-complete characterization of the RAMIX manifold If fastgas-phase chemistry is producing or removing RGM in theRAMIX manifold the same chemistry must be operative inthe atmosphere as a whole and this requires that we com-pletely revise our current understanding of mercury chem-istry The discrepancies between the DOHGS and specia-tion systems are further indication that artifacts are associ-ated with KCl denuder sampling under ambient conditionsbut we would suggest that RAMIX does not constitute an in-dependent verification of the DOHGS performance and thatthe 2P-LIF measurements raise questions about the DOHGSmeasurements
Ambrose et al (2013) also suggest that the observationsof very high RGM concentrations indicate multiple forms ofRGM and that the concentrations can be explained by oxida-tion of Hg(0) with O3 and NO3 being the likely nighttimeoxidants We have discussed these reactions in detail previ-ously (Hynes et al 2009) and concluded that they cannotplay any role in homogeneous gas-phase oxidation of Hg(0)Ambrose et al (2013) cite recent work on this reaction byRutter et al (2012) stating that ldquoOn the basis of thermody-namic data for proposed reaction mechanisms purely gas-phase Hg(0) oxidation by either O3 or NO3 is expected tobe negligibly slow under atmospheric conditions howeverin the case of O3-initiated Hg(0) oxidation the results of lab-oratory kinetics studies unanimously suggest the existence ofa gas-phase mechanism for which the kinetics can be treatedas second-orderrdquo We would suggest that a careful reading ofthe cited work by Rutter et al (2012) demonstrates the oppo-site conclusion We provide additional discussion of these is-sues in the Supplement and again conclude that O3 and NO3can play no role in the homogeneous gas-phase oxidation ofHg(0)
5 Future mercury intercomparisons
The discrepancies that are discussed above suggest a needfor a careful independent evaluation of mercury measure-ment techniques The approaches used during the evaluationof instrumentation for the NASA Global Tropospheric Ex-periment (GTE) and the Gas-Phase Sulfur IntercomparisonExperiment (GASIE) evaluation offer good models for suchan evaluation The Chemical Instrument and Testing Exper-iments (CITE 1ndash3) (Beck et al 1987 Hoell et al 19901993) were a major component of GTE establishing the va-lidity of the airborne measurement techniques used in thecampaign The GASIE experiment (Luther and Stecher III
1997 Stecher III et al 1997) was a ground-based intercom-parison of SO2 measurement techniques that might be par-ticularly relevant to issues associated with mercury measure-ment In particular GASIE was a rigorously blind intercom-parison that was overseen by an independent panel consist-ing of three atmospheric scientists none of whom were in-volved in SO2 research We would suggest that a future mer-cury intercomparison should be blind with independent over-sight Based on the RAMIX results it should consist of a pe-riod of direct ambient sampling and then manifold samplingin both reactive and unreactive configurations For examplean unreactive configuration would consist of Hg(0) and oxi-dized mercury in an N2 diluent eliminating any possibility ofmanifold reactions and offering the possibility of obtaining amanifold blank response Such a configuration would allowthe use of both denuder and pyrolysis measurements sinceit is reasonable to conclude based on the current body ofexperimental evidence that denuder artifacts are associatedwith ambient sampling with water vapor and ozone as themost likely culprits A reactive configuration would be sim-ilar to the RAMIX manifold configuration with atmosphericsampling into the manifold and periodic addition of Hg(0)and oxidized mercury over their ambient concentrations Thecombination of the three sampling configurations should en-able instrumental artifacts to be distinguished from reactivechemistry in either the manifold itself or for example on theKCl denuder
6 Conclusions
We deployed a 2P-LIF instrument for the measurement ofHg(0) and RGM during the RAMIX campaign The Hg(0)measurements agreed reasonably well with instruments us-ing gold amalgamation sampling coupled with CVAFS anal-ysis of Hg(0) Measurements agreed to within 10ndash25 onthe short-term variability in Hg(0) concentrations based ona 5 min temporal resolution Our results also suggest thatthe operation of the RAMIX manifold and spiking systemswere not as well characterized as Finley et al (2013) sug-gest We find that the calculated concentration spikes consis-tently overestimated the amount of Hg(0) introduced into theRAMIX manifold by as much as 30 This suggests a sys-tematic error in concentration calculations rather than ran-dom uncertainties that should not produce a high or low bias
We made measurements of TM and hence TOM by dif-ference by using pyrolysis to convert TOM to Hg(0) andswitching between pyrolyzed and ambient samples Theshort-term variation in ambient Hg(0) concentrations is asignificant limitation on detection sensitivity and suggeststhat a two-channel detection system monitoring both the py-rolyzed and ambient channels simultaneously is necessaryfor ambient TOM measurements Our TOM measurementswere normally consistent within the large uncertainty withKCl denuder measurements obtained with two Tekran speci-
Atmos Chem Phys 17 465ndash483 2017 wwwatmos-chem-physnet174652017
A J Hynes et al Results from the RAMIX mercury intercomparison 481
ation systems and with our own manual KCl denuder mea-surements The ability of the pyrolysis system to measurehigher RGM concentrations was demonstrated during oneof the manifold HgBr2 spikes but the results did not agreewith those reported by the UW DOHGS system We wouldsuggest that it is not possible to reconcile the different mea-surement approaches to TOM While there is other evidencethat KCl denuders may experience artifacts in the presenceof water vapor and ozone the reported discrepancies cannotexplain the very large differences reported by the DOHGSand Tekran speciation systems Similarly the differences be-tween the DOHGS and 2P-LIF pyrolysis measurements sug-gest that one or both of the instruments were not making re-liable quantitative measurements of RGM We suggest thatinstrumental artifacts an incomplete characterization of thesampling manifold and limitations in the measurement pro-tocols all make significant contributions to the discrepanciesbetween the different instruments and it would be rash todraw significant implications for the atmospheric cycling ofmercury based on the RAMIX results This is particularlytrue of the RGM results If one were to conclude that thediscrepancies between the DOHGS and speciation systemssampling ambient oxidized mercury are accurate and reflecta bias that can be extrapolated to global measurements thenit means that atmospheric RGM concentrations are muchhigher than previously thought and that we have little un-derstanding of the atmospheric cycling of mercury What isnot in dispute is the urgent need to resolve the discrepanciesbetween the various measurement techniques The RAMIXcampaign provided a valuable guide for the format of anyfuture mercury intercomparison It clearly demonstrated theneed to deploy high-accuracy calibration sources of Hg(0)and oxidized mercury the need for multiple independentmethods to measure elemental and oxidized mercury and toclearly characterize and understand the differences reportedby instruments that are currently being deployed for mea-surements
7 Data availability
Data are available from the corresponding author(ahynesrsmasmiamiedu)
The Supplement related to this article is available onlineat doi105194acp-17-465-2017-supplement
Acknowledgements This work was supported by NSF grant (noAGS-1101965) a National Science Foundation Major Instrumentalgrant (no MRI-0821174) and by the Electric Power ResearchInstitute We thank Mae Gustin and her research group and RobertNovak for their hospitality assistance and use of laboratory facil-ities during the RAMIX intercomparison We thank Mae Gustin
and Dan Jaffe for the use of their RAMIX data for comparison withour results We thank Eric Prestbo for helpful comments on themanuscript
Edited by J B BurkholderReviewed by two anonymous referees
References
Ambrose J L Lyman S N Huang J Gustin M S andJaffe D A Fast time resolution oxidized mercury measure-ments during the Reno Atmospheric Mercury IntercomparisonExperiment (RAMIX) Environ Sci Technol 47 7284ndash7294doi101021es303916v 2013
Bauer D Campuzano-Jost P and Hynes A J Rapid ultra-sensitive detection of gas phase elemental mercury under atmo-spheric conditions using sequential two-photon laser induced flu-orescence J Environ Monitor 4 339ndash343 2002
Bauer D DrsquoOttone L Campuzano-Jost P and Hynes A JGas Phase Elemental Mercury A Comparison of LIF Detec-tion Techniques and Study of the Kinetics of Reaction with theHydroxyl Radical J Photochem Photobiol 57 247ndash256 247doi101016S1010-6030(03)00065-0 2003
Bauer D Everhart S Remeika J Tatum Ernest C and HynesA J Deployment of a sequential two-photon laser-induced fluo-rescence sensor for the detection of gaseous elemental mercury atambient levels fast specific ultrasensitive detection with parts-per-quadrillion sensitivity Atmos Meas Tech 7 4251ndash4265doi105194amt-7-4251-2014 2014
Beck S M Bendura R J McDougal D S Hoell J M GregoryG L Curfman Jr H J Davis D D Bradshaw J Rodgers MO Wang C C Davis L I Campbell M J Torres A L Car-roll M A Ridley B A Sachse G W Hill G F CondonE P and Rasmussen R A Operational overview of NASAGTE CITE-1 airborne instrument intercomparisons ndash carbon-monoxide nitric-oxide and hydroxyl instrumentation J Geo-phys Res 92 1977ndash1985 1987
Breckenridge W H and Umemoto H Collisional Quenching ofElectronically Excited Metal Atoms in Advances in Chemi-cal Physics Dynamics of the Excited State Vol 50 edited byLawley K P John Wiley amp Sons Inc Hoboken NJ USAdoi1010029780470142745ch5 2007
Diacuteez S Human health effects of methylmercury exposure RevEnviron Contam Toxicol 198 111ndash132 doi101007978-0-387-09647-6_3 2009
Ebinghaus R Banic C Beauchamp S Jaffe D Kock H Pir-rone N Poissant L Sprovieri F and Weiss-Penzias P Spa-tial coverage and temporal trends of land-based atmospheric mer-cury measurements in the Northern and Southern Hemispheresin Mercury fate and transport in the global atmosphere Emis-sions measurements and models edited by Mason R and Pir-rone N Springer New York NY 2009
Ernest C T Donohoue D Bauer D Ter Schure A andHynes A J Programmable Thermal Dissociation of Reac-tive Gaseous Mercury a Potential Approach to Chemical Spe-ciation Results from a Field Study Atmosphere 5 575ndash596doi103390atmos5030575 2014
wwwatmos-chem-physnet174652017 Atmos Chem Phys 17 465ndash483 2017
482 A J Hynes et al Results from the RAMIX mercury intercomparison
Feng X Lu J Y Gregoire D C Hao Y Banic C M andSchroeder W H Evaluation and application of a gaseous mer-curic chloride source Anal Bioanal Chem 376 1137ndash11402003
Finley B D Jaffe D A Call K Lyman S Gustin M Peter-son C Miller M and Lyman T Development testing anddeployment of an air sampling manifold for spiking elementaland oxidized mercury during the Reno Atmospheric Mercury In-tercomparison Experiment (RAMIX) Environ Sci Technol 447277ndash7284 doi101021es304185a 2013
Gustin M and Jaffe D Reducing the Uncertainty in Measurementand Understanding of Mercury in the Atmosphere Environ SciTechnol 44 2222ndash2227 2010
Gustin M S Huang J Miller M B Peterson C Jaffe D AAmbrose J Finley B D Lyman S N Call K Talbot RFeddersen D Mao H and Lindberg S E Do we understandwhat the mercury speciation instruments are actually measur-ing Results of RAMIX Environ Sci Technol 47 7295ndash7306doi101021es3039104 2013
Hoell J M Albritton D L Gregory G L McNeal R J BeckS M Bendura R J and Drewry J W Operational overviewof NASA GTECITE-2 airborne instrument intercomparisons ndashnitrogen-dioxide nitric-acid and peroxyacetyl nitrate J Geo-phys Res 95 10047ndash10054 1990
Hoell J M Davis D D Gregory G L McNeal R J BenduraR J Drewry J W Barrick J D Kirchhoff V W J H MottaA G Navarro R L Dorko W D and Owen D W opera-tional overview of the NASA GTE CITE-3 airborne instrumentintercomparisons for sulfur-dioxide hydrogen-sulfide carbonylsulfidedimethyl sulfide and carbon-disulfide J Geophys Res98 23291ndash23304 1993
Houyoux M and Strum M Memorandum Emissions OverviewHazardous Air Pollutants in Support of the Final Mercury andAir Toxics Standard EPA-454R-11-014 Emission Inventoryand Analysis Group Air Quality Assessment Division ResearchTriangle Park NC USA available at httpnepisepagovExeZyPURLcgiDockey=P100DE6HTXT (last access 21 Decem-ber 2016) 2011
Hynes A J Donohoue D L Goodsite M E and HedgecockI M Our current understanding of major chemical and physi-cal processes affecting mercury dynamics in the atmosphere andat the air-waterterrestrial interfaces in Mercury Fate and Trans-port in the Global Atmosphere edited by Mason R and PirroneN Spring New York NY 2009
Landis M S Stevens R K Schaedlich F and Prestbo EM Development and Characterization of an Annular DenuderMethodology for the Measurement of Divalent Inorganic Reac-tive Gaseous Mercury in Ambient Air Environ Sci Technol36 3000ndash3009 2002
Lin C J Pongprueksa P Lindberg S E Pehkonen S O ByunD and Jang C Scientific uncertainties in atmospheric mercurymodels I Model science evaluation Atmos Environ 40 2911ndash2928 doi101016jatmosenv200601009 2006
Lindberg S E Bullock R Ebinghaus R Engstrom D FengX Fitzgerald W Pirrone N Prestbo E and Seigneur C Asynthesis of progress and uncertainties in attributing the sourcesof mercury in deposition Ambio 36 19ndash32 2007
Luther III G W and Stecher III H A Results of the gas-phasesulfur intercomparison experiment (GASIE) Preface HistoricalBackground J Geophys Res 102 16215ndash16217 1997
Lyman S N Jaffe D A and Gustin M S Release of mer-cury halides from KCl denuders in the presence of ozone At-mos Chem Phys 10 8197ndash8204 doi105194acp-10-8197-2010 2010
Mason R A Mercury Emissions from Natural Processes and theirImportance in the Global Mercury Cycle in Mercury Fate andTransport in the Global Atmosphere Emissions Measurementsand Models edited by Pirrone N Mason R A Springer Dor-drecht the Netherlands 173ndash191 2009
Mergler D Anderson H A Chan L H M Mahaffey K RMurray M Sakamoto M and Stern A H Methylmercury ex-posure and health effects in humans A worldwide concern Am-bio 36 3ndash11 2007
McClure C D Jaffe D A and Edgerton E S Evaluation of theKCl denuder method for gaseous oxidized mercury using HgBr2
at an in-service AMNet site Environ Sci Technol 48 11437ndash11444 doi101021es502545k 2014
Prestbo E C Air Mercury Speciation Accuracy and Calibra-tion presented at International Conference on Mercury as aGlobal Pollutant July 2015 available at httpwwwtekrancomfilesPrestbo-Speciation-Accuracypdf last access 21 Decem-ber 2016
Pirrone N Cinnirella S Feng X Finkelman R B FriedliH R Learner J Mason R Mukherjee A B Stracher GStreets D G and Telmer K Global mercury emissions to theatmosphere from natural and anthropogenic sources in Mer-cury Fate and Transport in the Global Atmosphere EmissionsMeasurements and Models edited by Pirrone N Mason R ASpringer Dordrecht the Netherlands 3ndash50 2009
Rutter A P Shakya K M Lehr R Schauer J J and GriffinR J Oxidation of gaseous elemental mercury in the presence ofsecondary organic aerosols Atmos Environ 59 86ndash92 2012
Scheuhammer A M Meyer M W Sandheinrich M B andMurray M W Effects of environmental methylmercury on thehealth of wild bird mammals and fish Ambio 36 12ndash18doi1015790044-7447(2007)36[12EOEMOT]20CO2 2007
Selin N E Global Biogeochemical Cycling of MercuryA Review Annu Rev Environ Resour 34 43ndash63doi101146annurevenviron051308084314 2009
Slemr F Brunke E-G Ebinghaus R and Kuss J Worldwidetrend of atmospheric mercury since 1995 Atmos Chem Phys11 4779ndash4787 doi105194acp-11-4779-2011 2011
Slemr F Weigelt A Ebinghaus R Kock H H Boumldewadt JBrenninkmeijer C A M Rauthe-Schoumlch A Weber S Her-mann M Zahn A and Martinsson B Atmospheric mercurymeasurements onboard the CARIBIC passenger aircraft AtmosChem Phys Discuss in press 2016
Sprovieri F Pirrone N Bencardino M DrsquoAmore F Car-bone F Cinnirella S Mannarino V Landis M EbinghausR Weigelt A Brunke E-G Labuschagne C Martin LMunthe J Waumlngberg I Artaxo P Morais F Barbosa H DM J Brito J Cairns W Barbante C Dieacuteguez M D CGarcia P E Dommergue A Angot H Magand O SkovH Horvat M Kotnik J Read K A Neves L M GawlikB M Sena F Mashyanov N Obolkin V Wip D Feng XB Zhang H Fu X Ramachandran R Cossa D Knoery J
Atmos Chem Phys 17 465ndash483 2017 wwwatmos-chem-physnet174652017
A J Hynes et al Results from the RAMIX mercury intercomparison 483
Marusczak N Nerentorp M and Norstrom C Atmosphericmercury concentrations observed at ground-based monitoringsites globally distributed in the framework of the GMOS net-work Atmos Chem Phys 16 11915ndash11935 doi105194acp-16-11915-2016 2016
Stecher III H A Luther III G W MacTaggart D L FarwellS O Crossley D R Dorko W D Goldan P D Beltz NKrischke U Luke W T Thornton D C Talbot R W LeferB L Scheuer E M Benner R L Wu J Saltzman E S Gal-lagher M S and Ferek R J Results of the gas- phase sulfurintercomparison experiment (GASIE) Overview of experimen-tal setup results and general conclusions J Geophys Res 10216219ndash16236 1997
Streets D G Devane M K Lu Z Bond T C Sunderland EM and Jacob D J All-time releases of mercury to the atmo-sphere from human activities Environ Sci Technol 45 10485ndash10491 2011
Subir M Ariya P A and Dastoor A P A review of uncertain-ties in atmospheric modeling of mercury chemistry I Uncertain-ties in existing kinetic parameters Fundamental limitations andthe importance of heterogeneous chemistry Atmos Environ 455664ndash5676 2011
Subir M Ariya P A and Dastoor A P A review of the sourcesof uncertainties in atmospheric mercury modeling II Mercurysurface and heterogeneous chemistry ndash A missing link AtmosEnviron 46 1ndash10 doi101016jatmosenv201107047 2012
Swartzendruber P C Jaffe D A and Finley B Improved flu-orescence peak integration in the Tekran 2537 for applicationswith sub-optimal sample loadings Atmos Environ 43 3648ndash3651 2009
UNEP United Nations Environment Program ChemicalsBranch The Global Atmospheric Mercury AssessmentSources Emissions and Transport Geneva Switzerlandavailable at httpwwwuneporgchemicalsandwastePortals9MercuryDocumentsPublicationsUNEP_GlobalAtmosphericMercuryAssessment_May2009pdf (lastaccess 21 December 2016) 2008
UNEP United Nations Environment Program Chemicals BranchMercury Time to Act Geneva Switzerland available at httpwwwuneporgPDFPressReleasesMercury_TimeToActpdf(last access 21 December 2016) 2013
UNEP United Nations Environment Program available at httpwwwmercuryconventionorg (last access 21 December 2016)2014
US EPA United States Environmental Protection Agency MercuryResearch Strategy EPA600R-00073 Washington DC USASeptember 2000
US EPA United States Environmental Protection Agency Mercuryand Air Toxics Standard available at httpwwwepagovmatslast access 13 March 2013
wwwatmos-chem-physnet174652017 Atmos Chem Phys 17 465ndash483 2017
- Abstract
- Introduction
- Experimental
-
- RAMIX intercomparison
- The 2P-LIF system
- Measurements of TM and TOM
- Manual denuder sampling of RGM
-
- Results
-
- RAMIX manifold
- UM Tekran performance
- 2P-LIF measurements
-
- 5 September
- 1 and 2 September
- Hg(0) intercomparison conclusions
-
- Interference tests
- Measurements of TM and TOM
-
- 14 September
- 13 September
- 15 September
-
- Limits of 2P-LIF detection of TOM
- Manual denuder measurements
-
- Implications of RAMIX results
-
- Intercomparison of Hg(0)
- Comparison of total oxidized mercury
-
- Future mercury intercomparisons
- Conclusions
- Data availability
- Acknowledgements
- References
-
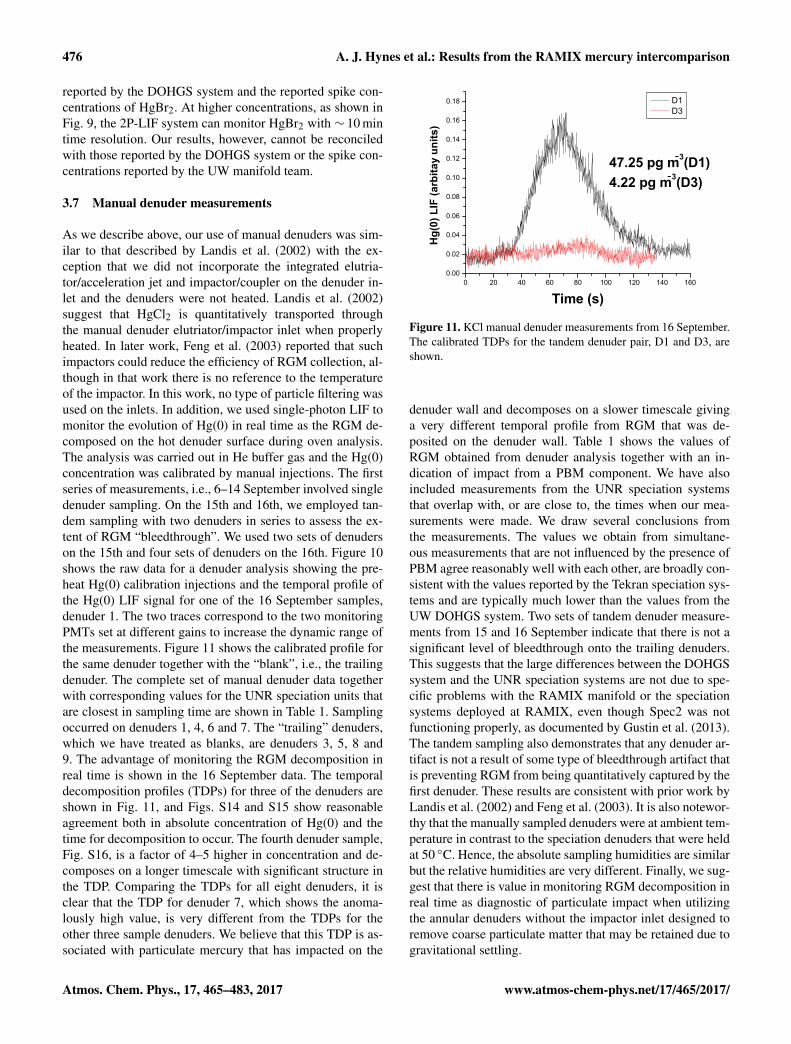