
In Section 7.7 of the method (preparation of 11 N sulfuric ...
18
Errata Sheet – March 5, 2004 • In Section 7.7 of the method (preparation of 11 N sulfuric acid solution), "600 mL reagent water" should read "300 mL reagent water."
Transcript of In Section 7.7 of the method (preparation of 11 N sulfuric ...

Errata Sheet – March 5, 2004
• In Section 7.7 of the method (preparation of 11 N sulfuric acid solution), "600 mLreagent water" should read "300 mL reagent water."

365.1-1
METHOD 365.1
DETERMINATION OF PHOSPHORUS BY SEMI-AUTOMATED COLORIMETRY
Edited by James W. O'DellInorganic Chemistry BranchChemistry Research Division
Revision 2.0August 1993
ENVIRONMENTAL MONITORING SYSTEMS LABORATORYOFFICE OF RESEARCH AND DEVELOPMENT
U.S. ENVIRONMENTAL PROTECTION AGENCYCINCINNATI, OHIO 45268

365.1-2
METHOD 365.1
DETERMINATION OF PHOSPHORUS BY AUTOMATED COLORIMETRY
1.0 SCOPE AND APPLICATION
1.1 This method covers the determination of specified forms of phosphorus indrinking, ground, and surface waters, and domestic and industrial wastes.
1.2 The methods are based on reactions that are specific for the orthophosphateion. Thus, depending on the prescribed pretreatment of the sample, thevarious forms of phosphorus that may be determined are defined in Section3.0 and given in Figure 1.
1.2.1 Except for in-depth and detailed studies, the most commonly measuredforms are total and dissolved phosphorus, total and dissolvedorthophosphate. Hydrolyzable phosphorus is normally found only insewage-type samples. Insoluble forms of phosphorus are determinedby calculation.
1.3 The applicable range is 0.01-1.0 mg P/L. Approximately 20-30 samples perhour can be analyzed.
2.0 SUMMARY OF METHOD
2.1 Ammonium molybdate and antimony potassium tartrate react in an acidmedium with dilute solutions of phosphorus to form an antimony-phospho-molybdate complex. This complex is reduced to an intensely blue-coloredcomplex by ascorbic acid. The color is proportional to the phosphorusconcentration.
2.2 Only orthophosphate forms a blue color in this test. Polyphosphates (andsome organic phosphorus compounds) may be converted to theorthophosphate form by manual sulfuric acid hydrolysis. Organic phosphoruscompounds may be converted to the orthophosphate form by manualpersulfate digestion. The developed color is measured automatically.2
2.3 Reduced volume versions of this method that use the same reagents and molarratios are acceptable provided they meet the quality control and performancerequirements stated in the method.
2.4 Limited performance-based method modifications may be acceptable providedthey are fully documented and meet or exceed requirements expressed inSection 9.0, Quality Control.
3.0 DEFINITIONS

365.1-3
3.1 Calibration Blank (CB) -- A volume of reagent water fortified with the samematrix as the calibration standards, but without the analytes, internalstandards, or surrogate analytes.
3.2 Calibration Standard (CAL) -- A solution prepared from the primary dilutionstandard solution or stock standard solutions and the internal standards andsurrogate analytes. The CAL solutions are used to calibrate the instrumentresponse with respect to analyte concentration.
3.3 Instrument Performance Check Solution (IPC) -- A solution of one or moremethod analytes, surrogates, internal standards, or other test substances usedto evaluate the performance of the instrument system with respect to a definedset of criteria.
3.4 Laboratory Fortified Blank (LFB) -- An aliquot of reagent water or other blankmatrices to which known quantities of the method analytes are added in thelaboratory. The LFB is analyzed exactly like a sample, and its purpose is todetermine whether the methodology is in control, and whether the laboratoryis capable of making accurate and precise measurements.
3.5 Laboratory Fortified Sample Matrix (LFM) -- An aliquot of an environmentalsample to which known quantities of the method analytes are added in thelaboratory. The LFM is analyzed exactly like a sample, and its purpose is todetermine whether the sample matrix contributes bias to the analytical results. The background concentrations of the analytes in the sample matrix must bedetermined in a separate aliquot and the measured values in the LFMcorrected for background concentrations.
3.6 Laboratory Reagent Blank (LRB) -- An aliquot of reagent water or other blankmatrices that are treated exactly as a sample including exposure to allglassware, equipment, solvents, reagents, internal standards, and surrogatesthat are used with other samples. The LRB is used to determine if methodanalytes or other interferences are present in the laboratory environment, thereagents, or the apparatus.
3.7 Linear Calibration Range (LCR) -- The concentration range over which theinstrument response is linear.
3.8 Material Safety Data Sheet (MSDS) -- Written information provided byvendors concerning a chemical's toxicity, health hazards, physical properties,fire, and reactivity data including storage, spill, and handling precautions.
3.9 Method Detection Limit (MDL) -- The minimum concentration of an analytethat can be identified, measured and reported with 99% confidence that theanalyte concentration is greater than zero.
3.10 Quality Control Sample (QCS) -- A solution of method analytes of knownconcentrations that is used to fortify an aliquot of LRB or sample matrix. The

365.1-4
QCS is obtained from a source external to the laboratory and different fromthe source of calibration standards. It is used to check laboratory performancewith externally prepared test materials.
3.11 Stock Standard Solution (SSS) -- A concentrated solution containing one ormore method analytes prepared in the laboratory using assayed referencematerials or purchased from a reputable commercial source
3.12 Total Phosphorus (P) -- All of the phosphorus present in the sample regardlessof forms, as measured by the persulfate digestion procedure.
3.12.1 Total Orthophosphate (P-ortho) -- Inorganic phosphorus [(PO ) ] in the4-3
sample as measured by the direct colorimetric analysis procedure.
3.12.2 Total Hydrolyzable Phosphorus (P-hydro) -- Phosphorus in the sampleas measured by the sulfuric acid hydrolysis procedure, and minuspredetermined orthophosphates. This hydrolyzable phosphorusincludes polyphosphates [(P O ) , (P O ) , etc.] plus some organic2 7 3 10
-4 -5
phosphorus.
3.12.3 Total Organic Phosphorus (P-org) -- Phosphorus (inorganic plusoxidizable organic) in the sample as measured by the persulfatedigestion procedure, and minus hydrolyzable phosphorus andorthophosphate.
3.13 Dissolved Phosphorus (P-D) -- All of the phosphorus present in the filtrate ofa sample filtered through a phosphorus-free filter of 0.45 micron pore size andmeasured by the persulfate digestion procedure.
3.13.1 Dissolved Orthophosphate (P-D ortho) -- As measured by he directcolorimetric analysis procedure.
3.13.2 Dissolved Hydrolyzable Phosphorus (P-D, hydro) -- As measured bythe sulfuric acid hydrolysis procedure and minus predetermineddissolved orthophosphates.
3.13.3 Dissolved Organic Phosphorus (P-D, org) -- As measured by thepersulfate digestion procedure, and minus dissolved hydrolyzablephosphorus and orthophosphate.
3.14 The following forms, when sufficient amounts of phosphorus are present inthe sample to warrant such consideration, may be calculated:
3.14.1 Insoluble Phosphorus (P-I) = (P) - (P-D).
3.14.1.1 Insoluble Orthophosphate (P-I, ortho) = (P, ortho) - (P-D,ortho).
365.1-5
3.14.1.2 Insoluble Hydrolyzable Phosphorus (P-I, hydro) = (P,hydro) - (P-D, hydro).
3.14.1.3 Insoluble Organic Phosphorus (P-I, org) = (P, org) - (P-D,org).
3.15 All phosphorus forms shall be reported as P, mg/L, to the third place.
4.0 INTERFERENCES
4.1 No interference is caused by copper, iron, or silicate at concentrations manytimes greater than their reported concentration in seawater. However, highiron concentrations can cause precipitation of, and subsequent loss, ofphosphorus.
4.2 The salt error for samples ranging from 5-20% salt content was found to beless than 1%.
4.3 Arsenate is determined similarly to phosphorus and should be consideredwhen present in concentrations higher than phosphorus. However, atconcentrations found in sea water, it does not interfere.
4.4 Sample turbidity must be removed by filtration prior to analysis fororthophosphate. Samples for total or total hydrolyzable phosphorus should befiltered only after digestion. Sample color that absorbs in the photometricrange used for analysis will also interfere.
4.5 Method interferences may be caused by contaminants in the reagent water,reagents, glassware, and other sample processing apparatus that bias analyteresponse.
5.0 SAFETY
5.1 The toxicity or carcinogenicity of each reagent used in this method have notbeen fully established. Each chemical should be regarded as a potential healthhazard and exposure should be as low as reasonably achievable. Cautions areincluded for known extremely hazardous materials or procedures.
5.2 Each laboratory is responsible for maintaining a current awareness file ofOSHA regulations regarding the safe handling of the chemicals specified inthis method. A reference file of Material Safety Data Sheets (MSDS) should bemade available to all personnel involved in the chemical analysis. Thepreparation of a formal safety plan is also advisable.
5.3 The following chemicals have the potential to be highly toxic or hazardous,consult MSDS.
5.3.1 Sulfuric acid (Sections 7.2 and 7.7)

365.1-6
6.0 EQUIPMENT AND SUPPLIES
6.1 Balance -- Analytical, capable of accurately weighing to the nearest 0.000l g.
6.2 Glassware -- Class A volumetric flasks and pipets as required.
6.3 Hot plate or autoclave.
6.4 Automated continuous flow analysis equipment designed to deliver and reactsample and reagents in the required order and ratios.
6.4.1 Sampling device (sampler)
6.4.2 Multichannel pump
6.4.3 Reaction unit or manifold
6.4.4 Colorimetric detector
6.4.5 Data recording device
6.5 Acid-washed glassware: All glassware used in the determination should bewashed with hot 1:1 HCl and rinsed with distilled water. The acid-washedglassware should be filled with distilled water and treated with all thereagents to remove the last traces of phosphorus that might be adsorbed onthe glassware. Preferably, this glassware should be used only for thedetermination of phosphorus and after use it should be rinsed with distilledwater and kept covered until needed again. If this is done, the treatment with1:1 HCl and reagents is only required occasionally. Commercial detergentshould never be used.
7.0 REAGENTS AND STANDARDS
7.1 Reagent water: Distilled or deionized water, free of the analyte of interest. ASTM type II or equivalent.
7.2 Sulfuric acid solution, 5N: Slowly add 70 mL of conc. H SO (CASRN 7664-93-2 4
9) to approximately 400 mL of reagent water. Cool to room temperature anddilute to 500 mL with reagent water.
7.3 Antimony potassium tartrate solution: Weigh 0.3 g K(SbO)C H O C1/2H O4 4 6 2
(CASRN 28300-74-5) and dissolve in 50 mL reagent water in 100 mLvolumetric flask, dilute to volume. Store at 4°C in a dark, glass-stopperedbottle.
7.4 Ammonium molybdate solution: Dissolve 4 g (NH ) Mo O C4H O (CASRN4 6 7 24 2
12027-67-7) in 100 mL reagent water. Store in a plastic bottle at 4°C.

365.1-7
7.5 Ascorbic acid, 0.1M: Dissolve 1.8 g of ascorbic acid (CASRN 50-81-7) in 100mL of reagent water. The solution is stable for about a week if prepared withwater containing no more than trace amounts of heavy metals and stored at4°C.
7.6 Combined reagent: Mix the above reagents in the following proportions for100 mL of the mixed reagent: 50 mL of 5N H SO (Section 7.2), 5 mL of2 4
antimony potassium tartrate solution (Section 7.3), 15 mL of ammoniummolybdate solution (Section 7.4), and 30 mL of ascorbic acid solution (Section7.5). Mix after addition of each reagent. All reagents must reach roomtemperature before they are mixed and must be mixed in the order given. Ifturbidity forms in the combined reagent, shake and let stand for a few minutesuntil the turbidity disappears before processing. This volume is sufficient for afour hour operation. Since the stability of this solution is limited, it must befreshly prepared for each run.
Note: A stable solution can be prepared by not including the ascorbic acid inthe combined reagent. If this is done, the mixed reagent (molybdate, tartrate,and acid) is pumped through the distilled water line and the ascorbic acidsolution (30 mL of 7.5 diluted to 100 mL with reagent water) through theoriginal mixed reagent line.
7.7 Sulfuric acid solution, 11 N: Slowly add 155 mL conc. H SO to 600 mL2 4
reagent water. When cool, dilute to 500 mL.
7.8 Ammonium persulfate (CASRN 7727-54-0).
7.9 Acid wash water: Add 40 mL of sulfuric acid solution (Section 7.7) to 1 L ofreagent water and dilute to 2 L. (Not to be used when only orthophosphate isbeing determined).
7.10 Phenolphthalein indicator solution (5 g/L): Dissolve 0.5 g of phenolphthalein(CASRN 77-09-8) in a solution of 50 mL of isopropyl alcohol (CASRN 67-63-0)and 50 mL of reagent water.
7.11 Stock phosphorus solution: Dissolve 0.4393 g of predried (105°C for one hour)Potassium phosphate monobasic KH PO (CASRN 7778-77-0) in reagent water2 4
and dilute to 1000 mL. 1.0 mL = 0.1 mg P.
7.12 Standard phosphorus solution: Dilute 10.0 mL of stock solution (Section 7.11)to 100 mL with reagent water. 1.0 mL = 0.01 mg P.
7.13 Standard phosphorus solution: Dilute 10.0 mL of standard solution (Section7.12) to 100 mL with reagent water. 1.0 mL = 0.001 mg P.

365.1-8
8.0 SAMPLE COLLECTION, PRESERVATION AND STORAGE
8.1 Samples should be collected in plastic or glass bottles. All bottles must bethoroughly cleaned and rinsed with reagent water. Volume collected shouldbe sufficient to insure a representative sample, allow for replicate analysis (ifrequired), and minimize waste disposal.
8.2 Samples must be preserved with H SO to a pH <2 and cooled to 4°C at the2 4
time of collection.
8.3 Samples should be analyzed as soon as possible after collection. If storage isrequired, preserved samples are maintained at 4°C and may be held for up to28 days.
9.0 QUALITY CONTROL
9.1 Each laboratory using this method is required to operate a formal qualitycontrol (QC) program. The minimum requirements of this program consist ofan initial demonstration of laboratory capability, and the periodic analysis oflaboratory reagent blanks, fortified blanks and other laboratory solutions as acontinuing check on performance. The laboratory is required to maintainperformance records that define the quality of the data that are generated.
9.2 INITIAL DEMONSTRATION OF PERFORMANCE
9.2.1 The initial demonstration of performance is used to characterizeinstrument performance (determination of LCRs and analysis of QCS)and laboratory performance (determination of MDLs) prior toperforming analyses by this method.
9.2.2 Linear Calibration Range (LCR) -- The LCR must be determinedinitially and verified every six months or whenever a significant changein instrument response is observed or expected. The initialdemonstration of linearity must use sufficient standards to insure thatthe resulting curve is linear. The verification of linearity must use aminimum of a blank and three standards. If any verification dataexceeds the initial values by ±10%, linearity must be reestablished. Ifany portion of the range is shown to be nonlinear, sufficient standardsmust be used to clearly define the nonlinear portion.
9.2.3 Quality Control Sample (QCS) -- When beginning the use of this
method, on a quarterly basis or as required to meet data-quality needs,verify the calibration standards and acceptable instrument performancewith the preparation and analyses of a QCS. If the determinedconcentrations are not within ±10% of the stated values, performance ofthe determinative step of the method is unacceptable. The source ofthe problem must be identified and corrected before either proceedingwith the initial determination of MDLs or continuing with on-going
365.1-9
analyses.
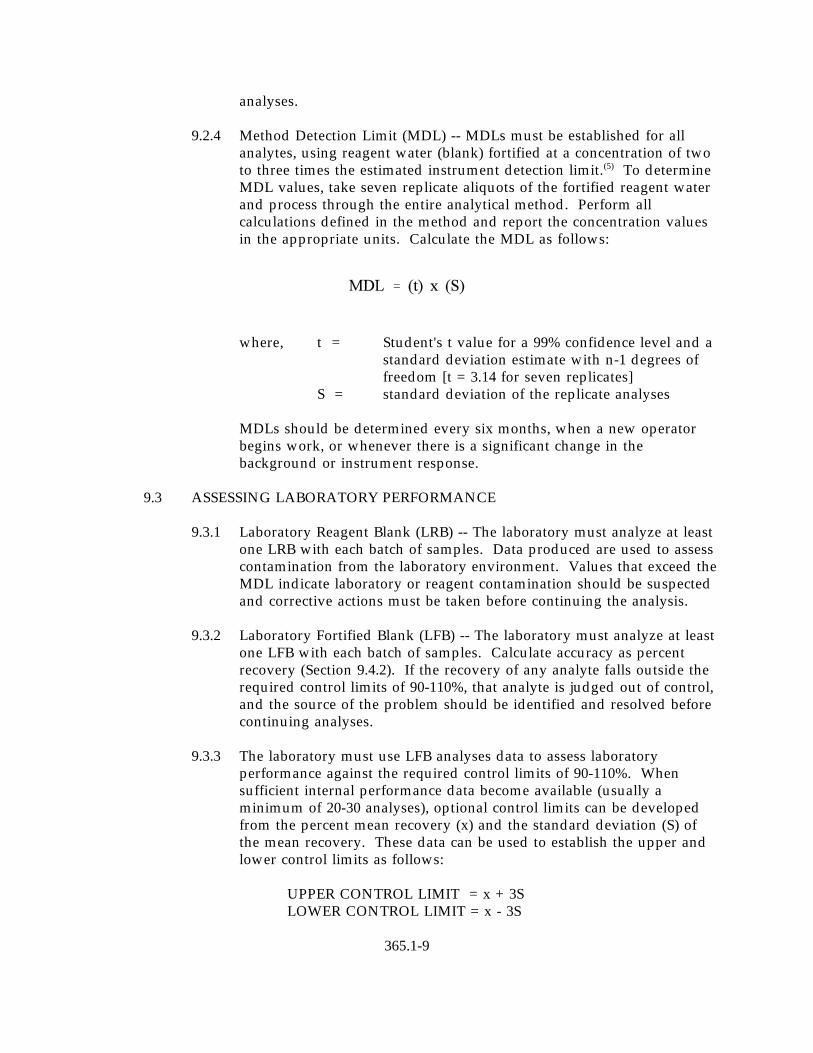
9.2.4 Method Detection Limit (MDL) -- MDLs must be established for allanalytes, using reagent water (blank) fortified at a concentration of twoto three times the estimated instrument detection limit. To determine(5)
MDL values, take seven replicate aliquots of the fortified reagent waterand process through the entire analytical method. Perform allcalculations defined in the method and report the concentration valuesin the appropriate units. Calculate the MDL as follows:
where, t = Student's t value for a 99% confidence level and astandard deviation estimate with n-1 degrees offreedom [t = 3.14 for seven replicates]
S = standard deviation of the replicate analyses
MDLs should be determined every six months, when a new operatorbegins work, or whenever there is a significant change in thebackground or instrument response.
9.3 ASSESSING LABORATORY PERFORMANCE
9.3.1 Laboratory Reagent Blank (LRB) -- The laboratory must analyze at leastone LRB with each batch of samples. Data produced are used to assesscontamination from the laboratory environment. Values that exceed theMDL indicate laboratory or reagent contamination should be suspectedand corrective actions must be taken before continuing the analysis.
9.3.2 Laboratory Fortified Blank (LFB) -- The laboratory must analyze at leastone LFB with each batch of samples. Calculate accuracy as percentrecovery (Section 9.4.2). If the recovery of any analyte falls outside therequired control limits of 90-110%, that analyte is judged out of control,and the source of the problem should be identified and resolved beforecontinuing analyses.
9.3.3 The laboratory must use LFB analyses data to assess laboratoryperformance against the required control limits of 90-110%. Whensufficient internal performance data become available (usually aminimum of 20-30 analyses), optional control limits can be developedfrom the percent mean recovery (x) and the standard deviation (S) ofthe mean recovery. These data can be used to establish the upper andlower control limits as follows:
UPPER CONTROL LIMIT = x + 3SLOWER CONTROL LIMIT = x - 3S

365.1-10
The optional control limits must be equal to or better than the requiredcontrol limits of 90-110%. After each five to ten new recoverymeasurements, new control limits can be calculated using only the mostrecent 20-30 data points. Also, the standard deviation (S) data shouldbe used to establish an on-going precision statement for the level ofconcentrations included in the LFB. These data must be kept on fileand be available for review.
9.3.4 Instrument Performance Check Solution (IPC) -- For all determinationsthe laboratory must analyze the IPC (a mid-range check standard) anda calibration blank immediately following daily calibration, after everytenth sample (or more frequently, if required) and at the end of thesample run. Analysis of the IPC solution and calibration blankimmediately following calibration must verify that the instrument iswithin ±10% of calibration. Subsequent analyses of the IPC solutionmust verify the calibration is still within ±10%. If the calibration cannotbe verified within the specified limits, reanalyze the IPC solution. If thesecond analysis of the IPC solution confirms calibration to be outsidethe limits, sample analysis must be discontinued, the cause determinedand/or in the case of drift the instrument recalibrated. All samplesfollowing the last acceptable IPC solution must be reanalyzed. Theanalysis data of the calibration blank and IPC solution must be kept onfile with the sample analyses data.
9.4 ASSESSING ANALYTE RECOVERY AND DATA QUALITY
9.4.1 Laboratory Fortified Sample Matrix (LFM) -- The laboratory must add aknown amount of analyte to a minimum of 10% of the routine samples. In each case the LFM aliquot must be a duplicate of the aliquot usedfor sample analysis. The analyte concentration must be high enough tobe detected above the original sample and should not be less than fourtimes the MDL. The added analyte concentration should be the sameas that used in the laboratory fortified blank.
9.4.2 Calculate the percent recovery for each analyte, corrected forconcentrations measured in the unfortified sample, and compare thesevalues to the designated LFM recovery range 90-110%. Percentrecovery may be calculate using the following equation:

365.1-11
where, R = percent recoveryC = fortified sample concentrations
C = sample background concentrations = concentration equivalent of analyte added to sample
9.4.3 If the recovery of any analyte falls outside the designated LFM recoveryrange and the laboratory performance for that analyte is shown to be incontrol (Section 9.3), the recovery problem encountered with the LFM isjudged to be either matrix or solution related, not system related.
9.4.4 Where reference materials are available, they should be analyzed toprovide additional performance data. The analysis of referencesamples is a valuable tool for demonstrating the ability to perform themethod acceptably.
10.0 CALIBRATION AND STANDARDIZATION
10.1 Prepare a series of at least three standards, covering the desired range, and ablank by pipetting and diluting suitable volumes of working standardsolutions (Section 7.12 or 7.13) into 100 mL volumetric flasks. Suggestedranges include 0.00-0.10 mg/L and 0.20-1.00 mg/L.
10.2 Process standards and blanks as described in Section 11.0, Procedure.
10.3 Set up manifold as shown in Figure 2.
10.4 Prepare flow system as described in Section 11.0, Procedure.
10.5 Place appropriate standards in the sampler in order of decreasingconcentration and perform analysis.
10.6 Prepare standard curve by plotting instrument response against concentrationvalues. A calibration curve may be fitted to the calibration solutionsconcentration/response data using computer or calculator based regressioncurve fitting techniques. Acceptance or control limits should be establishedusing the difference between the measured value of the calibration solutionand the "true value" concentration.
10.7 After the calibration has been established, it must be verified by the analysis ofa suitable quality control sample (QCS). If measurements exceed ±10% of theestablished QCS value, the analysis should be terminated and the instrumentrecalibrated. The new calibration must be verified before continuing analysis.

365.1-12
Periodic reanalysis of the QCS is recommended as a continuing calibrationcheck.
11.0 PROCEDURE
11.1 Phosphorus
11.1.1 Add 1 mL of sulfuric acid solution (Section 7.7) to a 50 mL sampleand/or standard in a 125 mL Erlenmeyer flask.
11.1.2 Add 0.4 g of ammonium persulfate (Section 7.8).
11.1.3 Boil gently on a pre-heated hot plate for approximately 30-40 minutesor until a final volume of about 10 mL is reached. Do not allow sampleto go to dryness. Alternately, heat for 30 minutes in an autoclave at121°C (15-20 psi).
11.1.4 Cool and dilute the sample to 50 mL. If sample is not clear at thispoint, filter.
11.1.5 Determine phosphorus as outlined (Section 11.3.2) with acid washwater (Section 7.9) in wash tubes.
11.2 Hydrolyzable Phosphorus
11.2.1. Add 1 mL of sulfuric acid solution (Section 7.7) to a 50 mL sampleand/or standard in a 125 mL Erlenmeyer flask.
11.2.2 Boil gently on a pre-heated hot plate for 30-40 minutes until a finalvolume of about 10 mL is reached. Do not allow sample to go todryness. Alternatively, heat for 30 minutes in an autoclave at 121°C(15-20 psi).
11.2.3 Determine phosphorus as outlined (Section 11.3.2) with acid washwater (Section 7.9) in wash tubes.
11.3 Orthophosphate
11.3.1 Add 1 drop of phenolphthalein indicator solution (Section 7.10) toapproximately 50 mL of sample. If a red color develops, add sulfuricacid solution (Section 7.7) drop-wise to just discharge the color. Acidsamples must be neutralized with 1 N sodium hydroxide (40 gNaOH/L).
11.3.2 Set up manifold as shown in Figure 1.
11.3.3 Allow system to equilibrate as required. Obtain a stable baseline withall reagents, feeding reagent water through the sample line.
365.1-13
11.3.4 Place standards in sampler in order of decreasing concentration. andcomplete filling of sampler tray.
11.3.5 Switch sample line from reagent water to Sampler and begin analysis.
12.0 DATA ANALYSIS AND CALCULATIONS
12.l Prepare a calibration curve by plotting instrument response against standardconcentration. Compute sample concentration by comparing sample responsewith the standard curve. Multiply answer by appropriate dilution factor.
12.2 Report only those values that fall between the lowest and the highestcalibration standards. Samples exceeding the highest standard should bediluted and reanalyzed. Any sample whose computed value is less than 5% ofits immediate predecessor must be rerun.
l2.3 Report results in mg P/L.
13.0 METHOD PERFORMANCE
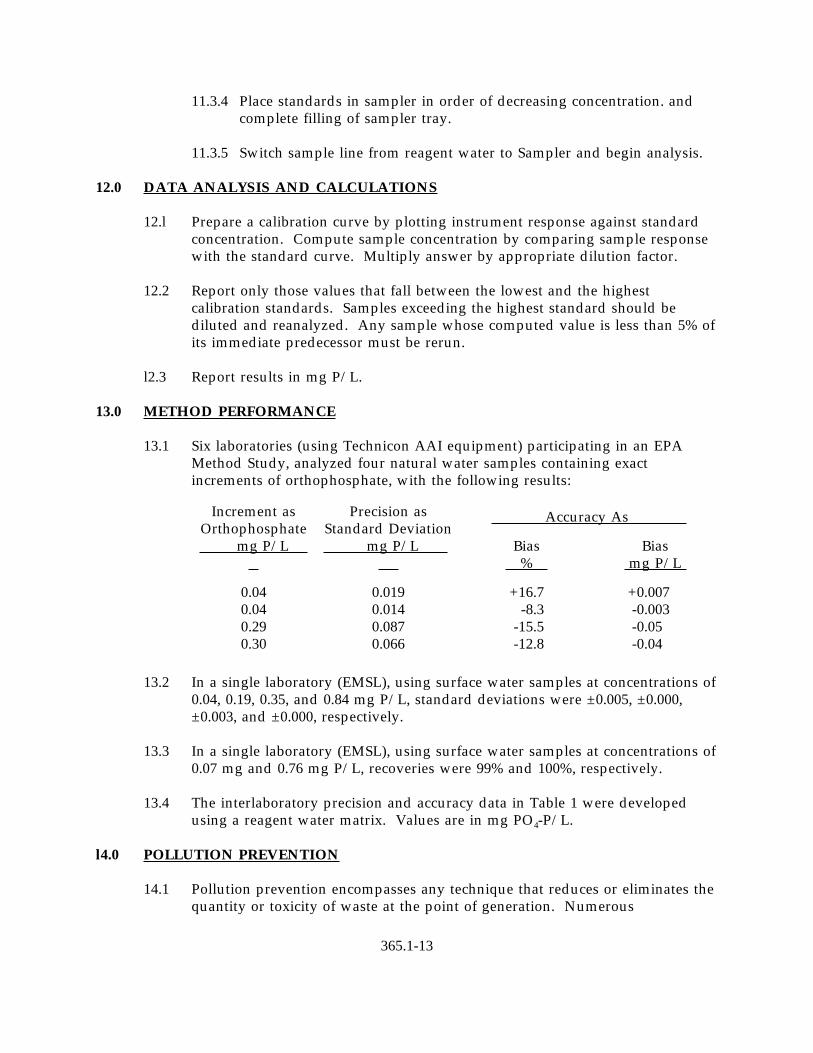
13.1 Six laboratories (using Technicon AAI equipment) participating in an EPAMethod Study, analyzed four natural water samples containing exactincrements of orthophosphate, with the following results:
Increment as Precision asOrthophosphate Standard Deviation mg P/L mg P/L Bias Bias
% mg P/L
Accuracy As
0.04 0.019 +16.7 +0.0070.04 0.014 -8.3 -0.0030.29 0.087 -15.5 -0.050.30 0.066 -12.8 -0.04
13.2 In a single laboratory (EMSL), using surface water samples at concentrations of0.04, 0.19, 0.35, and 0.84 mg P/L, standard deviations were ±0.005, ±0.000,±0.003, and ±0.000, respectively.
13.3 In a single laboratory (EMSL), using surface water samples at concentrations of0.07 mg and 0.76 mg P/L, recoveries were 99% and 100%, respectively.
13.4 The interlaboratory precision and accuracy data in Table 1 were developedusing a reagent water matrix. Values are in mg PO -P/L.4
l4.0 POLLUTION PREVENTION
14.1 Pollution prevention encompasses any technique that reduces or eliminates thequantity or toxicity of waste at the point of generation. Numerous

365.1-14
opportunities for pollution prevention exist in laboratory operation. The EPAhas established a preferred hierarchy of environmental management techniquesthat places pollution prevention as the management option of first choice. Whenever feasible, laboratory personnel should use pollution preventiontechniques to address their waste generation. When wastes cannot be feasiblyreduced at the source, the Agency recommends recycling as the next bestoption.
14.2 The quantity of chemicals purchased should be based on expected usageduring its shelf life and disposal cost of unused material. Actual reagentpreparation volumes should reflect anticipated usage and reagent stability.
14.3 For information about pollution prevention that may be applicable to laboratories and research institutions, consult "Less is Better: LaboratoryChemical Management for Waste Reduction", available from the AmericanChemical Society's Department of Government Regulations and Science Policy,1155 16th Street N.W., Washington, D.C. 20036, (202) 872-4477.
15.0 WASTE MANAGEMENT
15.1 The Environmental Protection Agency requires that laboratory waste management practices be conducted consistent with all applicable rules andregulations. Excess reagents, samples and method process wastes should becharacterized and disposed of in an acceptable manner. The Agency urgeslaboratories to protect the air, water, and land by minimizing and controllingall releases from hoods, and bench operations, complying with the letter andspirit of any waster discharge permit and regulations, and by complying withall solid and hazardous waste regulations, particularly the hazardous wasteidentification rules and land disposal restrictions. For further information onwaste management consult the "Waste Management Manual for LaboratoryPersonnel", available from the American Chemical Society at the address listedin Section 14.3.
16.0 REFERENCES
1. Murphy, J. and Riley, J., "A Modified Single Solution for the Determination ofPhosphate in Natural Waters". Anal. Chim. Acta., 27, 31 (1962).
2. Gales, M., Jr., Julian, E., and Kroner, R., "Method for QuantitativeDetermination of Total Phosphorus in Water". Jour. AWWA, 58, No. 10, 1363(1966).
3. Lobring, L.B. and Booth, R.L., "Evaluation of the AutoAnalyzer II; A ProgressReport", Technicon International Symposium, June, 1972, New York, N.Y.
4. Standard Methods for the Examination of Water and Wastewater, 18th Edition,p. 4-116, Method 4500-P F (1992).

365.1-15
5. Code of Federal Regulations 40, Ch. 1, Pt. 136, Appendix B.
17.0 TABLES, DIAGRAMS, FLOWCHARTS, AND VALIDATION DATA
TABLE 1. INTERLABORATORY PRECISION AND ACCURACY DATA
Number of True StandardValues Value Mean Residual Deviation Residual
Reported (T) (X) for X (S) for S
54 0.150 0.1530 -0.0017 0.0128 -0.0010
69 0.351 0.3670 0.0140 0.0368 0.0084
88 0.625 0.6090 -0.0141 0.0413 -0.0069
87 1.80 1.7374 -0.0444 0.1259 -0.0072
57 2.50 2.4867 0.0146 0.1637 -0.0200
69 2.75 2.8344 0.1158 0.2019 0.0002
53 3.50 3.5619 0.1038 0.2854 0.0295
87 3.60 3.4957 -0.0610 0.2137 -0.0495
64 4.00 3.8523 -0.0989 0.3158 0.0237
57 7.01 6.9576 0.0383 0.5728 0.0632
88 8.20 8.0995 0.0068 0.5428 -0.0528
63 9.00 8.6717 -0.2099 0.6770 0.0236
REGRESSIONS: X = 0.986T + 0.007, S = 0.072T + 0.003

365.1-16

365.1-17


![Sulfuric Acid is[1]](https://static.fdocuments.in/doc/165x107/552847e14a7959c93d8b4684/sulfuric-acid-is1.jpg)


