IN SEARCH OF EFFECTIVE CORPORATE GOVERNANCE · Lehn refers to SOX as the first major federal...
56
2006 Financial Forum Series IN SEARCH OF EFFECTIVE CORPORATE GOVERNANCE
Transcript of IN SEARCH OF EFFECTIVE CORPORATE GOVERNANCE · Lehn refers to SOX as the first major federal...
2006 Financial Forum Series
IN SEARCH OF EFFECTIVE
CORPORATE GOVERNANCE

The views expressed are those of the individual authors and do not necessarily reflect official positions of Networks Financial Institute. Any errors or omissions are the responsibility of the authors.
Table of Contents
Introduction ................................................................................1by John A. Tatom, PhD
Reforming Regulation of Corporate Governance ..............8by Kenneth Lehn, PhD
Audit Committee Financial Literacy: What Might It Mean and Why Bother? ............................17by Roman L. Weil, PhD, Douglas J. Coates, MBA and M. Laurentius Marais, PhD
Focusing More on Outputs and on Markets:What Financial Regulation Can Learn from Progress in Other Policy Areas..............................................33by Lawrence J. White, PhD

1
Introductionby John A. Tatom, PhDDirector of Research, Networks Financial Institute
Government regulation of corporate governance has taken major andcontroversial strides forward since the crisis of corporate governance andscandals that contributed to the high-tech boom of the 1990s and subse-quent stock market crash. Sarbanes-Oxley (SOX) was passed in 2002, butits most onerous provisions, section 404, came into effect more recentlyfor most firms. Meanwhile, the regulatory burden on mutual funds, hedgefunds and perhaps soon even derivatives has mushroomed. The notionthat new government mandates for corporate governance have and willimprove corporate performance has achieved widespread acceptance.
On November 28, 2006, Networks Financial Institute (NFI) held aFinancial Forum, “In Search of Effective Corporate Governance,” at theColumbia Club in Indianapolis Indiana, to discuss these issues andwhether the steps taken in recent years should be revisited. Three expertswere invited to present their analyses of various aspects of the corporategovernance issues and to address some central questions:
• Are corporate boards of directors providing effective governance offinancial activities and reporting? Do boards lack financial literacy?What is required to improve board performance? Are there sufficientmarket incentives to encourage boards to raise their own standards?
• Is the current approach to government regulation of financial institutionseffective? If governments are going to regulate, how can they do so moreeffectively? Can market forces be harnessed to provide effective corporategovernance? Or is this already being done?
• What constitutes good corporate governance financial practice? Doesit respond to market incentives? Can market performance predict thequality of governance?

2
U.S. capital markets have lost some of their competitive advantage, andconsequently the nation’s financial and political leadership will increasinglybe pressed to come to grips with the answers to the questions posed atthis Financial Forum. In 2005-06, 30 foreign firms left the NYSE andNasdaq. Some analysts argue that market capitalization was lowered bythe implementation of the SOX bill and others have argued that theattractiveness of the U.S. equity market for listing foreign initial publicofferings (IPOs) has declined. The total value of securities class-actionlawsuits in the United States has skyrocketed in recent years, to $9.6 billion in 2005 from $150 million in 1997. The Securities IndustryAssociation estimates that the industry spends $25 billion on SEC compliance. Another recent study shows that security underwriting costsin London are roughly half those in the United States. More effective corporate governance, without costly adverse side effects on our capitalmarkets, is a critical issue facing U.S. markets and policymakers.
The Panelists
The papers were prepared by Professor Kenneth Lehn, the Samuel A.McCullough Professor of Finance in the Katz School of Business at theUniversity of Pittsburgh and a former Chief Economist of the U.S.Securities and Exchange Commission, Roman L. Weil, PhD, CMA, CPA,the V. Duane Rath Professor of Accounting at the Graduate School ofBusiness of the University of Chicago, and Lawrence J. White, the ArthurE. Imperatore Professor of Economics at New York University’s SternSchool of Business and Deputy Chair of the Economics Department atStern. Professor White is a former Director of the Economic Policy Office,Antitrust Division, U.S. Department of Justice and is also currently theGeneral Editor of The Review of Industrial Organization.
Professor Kenneth Lehn spoke on “Reforming Regulation of CorporateGovernance.” Lehn points out that corporate governance was nearlyignored in the literature of finance, law and economics from the1930suntil the1980s, when concern over corporate takeovers began to reviveinterest. He attributes the latest round of regulation to the Enron scandal,which was falsely believed to have lowered stock prices. He notes thatwhen the Enron story broke in October 2001, stock prices had alreadytaken most of their decline from peaks over a year earlier in March 2000and that the same pattern had been experienced abroad, unrelated toEnron. He notes that SOX was aimed at restoring confidence in U.S. corporations and raising their value, but ironically just the reverseoccurred, in part by raising cost and reducing risk-taking.
Lehn refers to SOX as the first major federal attempt to micromanage thegovernance process. Lehn advocates a different approach, more groundedin economics, that relies on incentives rather than mandates, a themeemphasized in the paper presented by Professor Lawrence White, as well.Lehn explains that the way to reduce corporate fraud is to raise the cost

3
of committing fraud, so that the penalties for getting caught are in linewith or more than the gains from fraud.
Lehn explains that fraud had increased in the late 1990s for a variety ofreasons that had raised the return from fraud relative to its cost. Theseinclude the fact that the securities market had grown more than fivefold,while the Securities and Exchange Commissions (SEC) budget had onlydoubled, with less than one third of the budget devoted to fraud. Citingearlier work by others, Lehn explains that fraud is most prevalent andhardest to detect in intangible assets, yet that is where relatively largegrowth had occurred. Finally, he explains that executive stock optionsincrease the returns to fraud, even if their correct use serves the interestsof stockholders. Thus the returns to fraud have risen relative to the cost.
Lehn gives high marks to efforts to increase the penalties for fraud, especially the sentences against several big-name fraudsters, class actionsuits and state and local government cases. In his economic model offraud, potential fraudsters are very sensitive to the potential losses theyincur if caught committing fraud. He also notes that the SEC budgetexpanded 139 percent from 2000 to 2006, with enforcement expendituresincreasing by $310 million, about the total budget in 2000. SOX andother mandates are just that, however, mandates that micromanagefirms, reducing legitimate and necessary risk-taking. In Lehn’s view, corporate governance cannot be codified because there is no “one-size-fits-all” prescription. Efforts to do so, like SOX and especially Section404, raise business cost and reduce efficiency and risk-taking, whichlower the value of U.S. resources and make our capital markets uncom-petitive, which further destroy value in our financial and capital markets.
Lehn concludes that Section 404 should be repealed, but if it is not, itshould allow for firms to opt in or to opt out. Then small firms will findthat opting out costs less than the penalty the market might attach fromthe firm not following Section 404. Other firms would find that the benefitsfrom following Section 404 in terms of stockholder valuation would makeopting in attractive. He also argues that independent boards are inferior forrapidly growing, high-tech companies where insider expertise is critical to evaluating management decisions. Professor Lehn explains that theremediation offered by going after fraudulent behavior has lowered thebenefit of SOX mandates and that they should be repealed.
Professor Roman Weil answers the questions posed in his “Audit CommitteeFinancial Literacy: What Might it Mean and Why Might It Matter?” (co-authored with Douglas J. Coates and M. Laurentius Marais). Weil notesthat the New York Stock Exchange and the National Association of SecurityDealers Blue Ribbon Committee on Improving the Effectiveness ofCorporate Audit Committees called in 1999 for increased financial literacy.This call was amplified by SOX in 2002, through a requirement that firmshave an audit committee financial expert and through the creation of thePublic Company Accounting Oversight Board (PCAOB).
4
Professor Weil argues that corporations have inadequate literacy on theirboard of directors’ audit committees, when judged by typical accountingcapabilities required by exchange listing standards and despite largefinancial incentives in the form of increased stock price valuation fromhaving competent, knowledgeable members of these committees.According to Professor Weil, a corporate board is required to evaluate theperformance of its audit committee and to demonstrate its assessment toits external auditor. In addition, audit committees have to comply withstandards set for exchange listings. Weil and his colleagues have developeda test of accounting literacy and given it to over 200 accounting and auditcommittee members. More than half of those tested had inadequate literacy.
In another approach, Professor Weil and his colleagues defined financial,or accounting, literacy for an audit committee member to comprise fourcapabilities: 1) understand criteria for making decisions for reporting,and understand the business transactions and judgments that lead tothose decisions, 2) understand Generally Accepted Accounting Principles(GAAP) and International Financial Reporting Standards (IFRS) implicationsfor critical accounting policies and estimates (CAPE), 3) understandwhether management’s judgments and estimates described in reports areconsistent with the business model, economic environment and objectivesof guidance from GAAP/IFS, and 4) understand the implications of management’s choices for potential manipulation. They ranked membersof audit committees for their potential financial literacy on a four-pointscale based on their education and experience. Again, the performanceon these classifications was very low.
He shows that literacy improved from 2000 to 2004, but it remains disappointingly low. He provides statistical evidence that higher literacy,following his scores, is associated with a statistically higher rate of returnto stockholders, an average of 4.6 percent higher according to his estimate.The evidence shows corporate boards are not meeting their responsibilitiesto their stockholders, but market incentives in the form of higher returnsare likely to lead to continuing further improvement in the qualities ofboard members, in particular, the audit committees, unless impeded byinefficient and ineffective government mandates.
Professor Weil does not advocate specific mandates from the PCAOB foraudit committee membership. Instead he indicates that nominating committees of boards are best suited for selecting members, but that theyshould be informed on the standards of literacy required to carry out theresponsibilities of audit committee members. He also emphasized the mar-ket incentives that exist for appointing more literate committee members.
Professor Lawrence J. White explains in “Focusing More on Outputs and onMarkets: What Financial Regulation Can Learn from Progress in Other PolicyAreas” that financial regulators achieve relatively poor results at relativelyhigh cost to the economy. This is so because of a focus on mandated behav-ior instead of a focus on encouraging the desired behavior and output thatregulators seek through the use of incentives and market mechanisms.
5
White points out that there are three basic types of regulation: economicregulation, health, safety and environmental regulation and informationregulation. While regulations can be implemented in various ways, themost common type is what White calls “command and control” regulation,which aims to set technology standards or performance standards, usuallyapplying a “bubble” concept to an aggregate or group rather than individualunits. This type of regulatory mandate is based on a one-size-fits-allapproach that does not allow companies to best determine how to meetregulatory objectives or provide incentives to do so; indeed, in manycases mandated behavior creates implicit disincentives to strive towarddesired outcomes because of the nature of the mandate.
Professor White argues in his paper that there is ample evidence of successful regulation in areas outside financial services where regulationhas been effective and efficient in accomplishing regulatory objectives. Hecites, in particular, the ‘cap-and-trade’ program to control SO2 emissions;spectrum auctions; and ‘dedicated-access-privilege’ programs for fisheries.Successful regulatory efforts in these examples have been characterizedby reliance on incentives and the marketplace to achieve regulatory ends(specific outputs) with minimal or absent adverse side effects.
There are a number of proposals in the literature that attempt to introducesuch regulation in the financial services area. White discusses several,including introducing incentive-based and output oriented schemes toreform the Community Reinvestment Act, the use of financial statementinsurance as a means of promoting more effective governance and lessfraud in financial reporting and the reform of bond rating to allow morecompetitive and innovative practices, work which Professor White has donefor NFI (“Good Intentions Gone Awry: A Policy Analysis of the SEC’sRegulation of the Bond Rating Industry,” NFI Policy Brief 2006-PB-05,April 2006).
The Origins of the Governance Crisis and Its Costly “Solution”
The recent interest in corporate governance reform was prompted by asurge in accounting and governance scandals in the late 1990s. The climax came in 2002, when there were 29 major corporate scandals and30 indictments of senior executives. A recent tabulation of corporatescandals lists only four major accounting scandals from 1989 to 1995, butthis accelerated to four more (including Enron and Cendant) in 1998 to 2001.
These scandals led to a sea change in regulation in the United States.Sarbanes-Oxley became law in 2002, including Section 404 which onlybecame fully effective in 2005. New regulations on mutual funds’ boardsof directors were adopted that required more outside directors and prohibited insider board chairpersons. New registration and reportingregulations were adopted for hedge funds but were suspended by courtaction. Congressional and bureaucratic pressures continue to press for

6
tighter oversight and disclosure for hedge funds. There continue to beproposals for increased regulation of other financial services products,especially derivatives.
New regulations led to adverse side effects, however, including highercosts for corporate America and damage to U.S. financial markets. Forexample, Financial Executives International surveyed 4,000 public companies in March 2004 and found that Sarbanes-Oxley cost $4.4 million a year. The American Electronics Association estimates that thecost of compliance for all U.S. companies totaled $35 billion in 2004.They also found that the compliance cost of Section 404 for firms withtotal revenue of less than $100 million was 2.5 percent of revenue, butthis fell for firms between $100 and $500 million to 0.5 percent of revenue. This declines to less than 0.1 percent for firms with revenueover $5 billion. A review of SEC filings (more reliable, but voluntary) for2005 first quarter found compliance cost an average of $1.8 million forevery $1 billion in sales. Foley & Lardner reported (May 2005) that average costs for companies with annual revenue below $1 billion hadincreased by $1.6 million to $2.9 million in 2003 from two years earlier.They also found some 20% of public companies were considering goingprivate to avoid the costs of SOX. Costs of SOX compliance fall disproportionately on small firms, where there were no major issues of accounting scandals.
According to an Ernst & Young survey of directors, they are morefocused on compliance with standards and regulation than on obtaininga competitive advantage. Regulation FD (Fair Disclosure) now requiresany “material” information provided to analysts to be provided to thepublic. This has led many companies to stop meeting with analysts,reducing market information. Accounting restatements remain high, nowdue to uncertainties about regulatory standards, instead of earlier scandals.Huron Consulting Group estimates that there were over 400 restatementsin 2004, up from a little over 300 in 2002-03 and about 230-260 in 2000-01.
There are some analysts who claim that SOX produces net benefits forfirms, however. For example, Samuel DiPiazza, chief executive of PwCsays that the costs of applying section 404 were exceptional in the firstyear and will fall in due course. Eugene O’Kelly, the head of KPMG’sAmerican business, has said he reckons auditors’ attention fees related tosection 404 should fall by 15-25% in 2005. Some directors for closelyheld firms claim that SOX gives directors more independence from theprincipal owners.
The damage to U.S. financial markets has created strong concern, includingfrom New York Senator Charles Schumer and New York City MayorMichael Bloomberg, McKinsey Consultants and the prestigious privateCommittee on Capital Markets Regulation. These individuals and groupshave noted that, in 2005-06, 30 foreign firms have left the NYSE andNasdaq. One study found that U.S. financial markets sank by a total of$1.4 trillion as a result of the SOX bill’s passage. In the universe of global

7
IPOs, the fraction of non-U.S. IPOs listed in the United States has fallento under 10% so far in 2006 from 37% in 2000. In 2000, 90% of thefunds raised by foreign companies through new stock offerings wereraised in the United States. By 2005, 90% of the funds raised by foreignfirms were raised outside the United States. In 2005, only two of theworld’s 25 largest initial public offerings listed in the United States. Nextyear, more money will be raised through IPOs in Hong Kong than ineither London or New York. The total value of securities class-action lawsuits in the United States has skyrocketed in recent years, to $9.6 billion in 2005 from $150 million in 1997. The Securities IndustryAssociation estimates that the industry spends $25 billion on SEC compliance. A recent study shows that security underwriting costs inLondon are roughly half those in the United States.
New regulatory burdens have raised questions about how to get moreeffective corporate governance and how to reform our new, burdensomeregulations. Currently, there are more than 10 federal, state and industryregulatory bodies in the United States. The British have only one.Industry experts estimate that the gross financial regulatory costs to U.S.companies are 15 times higher than in Britain. Political leaders agree,especially in the U.S. financial center, that Sarbanes-Oxley needs to bere-examined, especially for smaller firms. Most European and Asiancountries have already begun to adopt international accounting standards,which businesses tend to prefer over the American system controlled bythe Financial Accounting Standards Board. Yet there is no agreement todo so in the United States, and SOX forces foreign firms operating in theUnited States to adopt our standards as well. This is a key factor in de-listing of foreign stocks in the United States.
The newly created Public Company Accounting Oversight Board has notissued any of the annual inspection reports of the nation’s top four auditors.Foreign regulators and auditing firms have endorsed a new set of international standards for auditing performance to constrain the UnitedStates’ new auditing oversight group. There is strong doubt whether U.S.regulation, especially SOX, can improve corporate governance and performance. Professor Lehn argues that our corporate governance standards do not improve corporate performance. Instead, superior governance is created by companies with strong economic performance.Corporate boards could do more to improve the quality of their own governance without government regulation. Professor Weil’s work showsthat audit committees of corporate boards have a huge lack of basicfinancial literacy skills. He also finds that where financial literacy ishigher on boards of directors, there is a large gain in the rate of returnfor corporate owners. The United States could move to a more streamlinedregulatory framework focused on incentives instead of on quantitativerestrictions, as Professor White suggests. Such a system would be moreefficient for corporations and stockholders and it would be more effectivein securing desired outcomes, according to one of the experts at our Forum.
8
Reforming Regulation of Corporate Governance1
by Kenneth Lehn, PhD
A. Introduction
Since the revelation of accounting scandals at Enron, Worldcom, and several other high profile companies (“Enron et al”) five years ago, therehas been unprecedented public focus on U.S. corporate governance. Acommon view, articulated by many journalists, politicians and publicpundits, is that these scandals were indicative of a crisis that erodedinvestor confidence in U.S. corporations. The “crisis of confidence” rationalewas used to justify several policy changes, including, perhaps most promi-nently, the Sarbanes-Oxley Act, which was passed by Congress withunusual speed and signed into law by President Bush on July 30, 2002.
Sarbanes-Oxley is an historic piece of legislation, as the first major federal attempt to micromanage the internal governance procedures ofU.S. corporations. Among other things, it requires (i) chief executive officers (“CEOs”) and chief financial officers (“CFOs”) to certify financialstatements and other information, (ii) companies to file annual internalcontrol reports that include evaluations of the effectiveness of the controls, and (iii) audit committees to comply with new regulations governing their composition and procedures. In addition, Sarbanes-Oxleytightened regulation of auditors and provided the SEC with expandedenforcement authority against auditors, officers, and directors.
Since its adoption, many policymakers on both sides of the aisle, includingsupporters of the legislation, have expressed skepticism about whether
About the Author
Professor Kenneth Lehn is theSamuel A. McCullough Professor of Finance in the Katz School ofBusiness at the University ofPittsburgh, where he teaches coursesin financial economics. ProfessorLehn also is an affiliated professor of law in the School of Law at theUniversity of Pittsburgh. ProfessorLehn joined the faculty at theUniversity of Pittsburgh in 1991 afterserving as chief economist of the U.S.Securities and Exchange Commissionfor four years. Professor Lehn alsohas taught at Washington University,UCLA, Miami University, and theGeorgetown University Law Center.
Professor Lehn’s research focuses ontopics in corporate finance, includingmergers and acquisitions, corporategovernance, and capital structure. In addition, he has written on topicsrelating to the economics of profes-sional sports. Professor Lehn haspublished in leading academic journals, including the Journal of Financial Economics, Journal of Finance, Journal of PoliticalEconomy, American EconomicReview, and the Journal of Law andEconomics. He also has publishedseveral op-ed pieces in the WallStreet Journal. Professor Lehn is afounding editor of the Journal ofCorporate Finance. He has served as a consultant for numerous firmsand government agencies. ProfessorLehn received a BA in economicsfrom Waynesburg College, an MA in economics from Miami University,and a PhD in economics fromWashington University. 1 Preliminary. Please do not quote without permission.

9
Sarbanes-Oxley and other regulations related to corporate governanceare impairing innovation, entrepreneurship, and the competitiveness of U.S.corporations and financial markets.
For example, one year after Sarbanes-Oxley was signed into law, WilliamDonaldson, then chairman of the Securities and Exchange Commission(“SEC”), stated that “I worry about the loss of risk-taking zeal. …Sarbanes-Oxley unleashed batteries of lawyers across the country … [theresult is] a huge preoccupation with the dangers and risks of making theslightest mistake, as opposed to a reasonable approach to legitimate business risk.”2 Similarly, in Congressional testimony in July 2003, AlanGreenspan, then chairman of the Federal Reserve Board, stated that “corporate executives and boards of directors are seemingly unclear, inthe wake of the recent intense focus on corporate behavior, about howan increase in risk-taking on their part would be viewed by shareholdersand regulators. As a result, business leaders have been quite circumspectabout embarking on major new investment projects.”3
In an op-ed in the Wall Street Journal on November 1, 2006, New YorkMayor Michael Bloomberg and Senator Charles Schumer stated that“Since [Sarbanes-Oxley] passage, auditing expenses for companies doingbusiness in the U.S. have grown far beyond anything Congress had antic-ipated. … There appears to be a worrisome trend of corporate leadersfocusing inordinate time on compliance minutiae rather than innovativestrategies for growth, for fear of facing personal financial penalties fromoverzealous regulators.”4 Mayor Bloomberg and Senator Schumer go on to say that they will seek to redefine a “balance of innovation andregulation” over the next several months.
As recently as November 2006 in a speech to the Economic Club of NewYork, Treasury Secretary Paulson called for a reassessment of the regulatory“reforms” adopted after the corporate scandals, arguing that regulation,including Sarbanes-Oxley, and securities litigation is chasing capitalfrom the U.S. to foreign financial markets. As possible evidence of this,24 of the 25 largest worldwide initial public offerings (“IPOs”) last yearlisted in foreign markets, suggesting that U.S. financial markets are nolonger the preferred venue for large IPOs. Secretary Paulsen went on tostate that “When it comes to regulation, balance is key. … Excessive regulation slows innovation, imposes needless costs on investors, andstifles competitiveness and job creation. At the same time, we should notengage in a regulatory race to the bottom, seeking to eliminate necessarysafeguards for investors in a quest to reduce costs.”5
2 Adrian Michaels, “After a Year of U.S. Corporate Clean-Up, William Donaldson Callsfor a Return to Risk-Taking,” Financial Times.com, July 24, 2003.
3 Testimony of Chairman Alan Greenspan before the Committee on Financial Services,U.S. House of Representatives, July 15, 2003.
4 Michael Bloomberg and Charles Schumer, “To Save New York, Learn from London,”Wall Street Journal, November 1, 2006.
5 Remarks by Treasury Secretary Henry M. Paulson on the Competitiveness of U.S.Capital Markets, Economic Club of New York, New York, NY, November 20, 2006.

10
Hence, there is a growing consensus that changes to Sarbanes-Oxley andour approach to regulation of corporate governance is necessary. In arecent interview with SDA-Asia, Alan Greenspan joked that “Sarbanes-Oxley passed both houses with almost unanimous votes. Any bill that goesthrough Congress with that sort of vote cannot be good.” Dr. Greenspanpredicted the 110th Congress will make changes to Sarbanes-Oxley, assome key Democrats, including Congressman Barney Frank, chairman ofthe House Financial Services Committee, and Senator Schumer favor suchreform. In addition, in December 2006, the SEC will consider proposedchanges to controversial Section 404 of Sarbanes-Oxley, which concernsthe audits of companies’ internal financial controls.
As policymakers consider regulatory reform in this area, they shouldconsider a different model for regulating corporate governance. Insteadof trying to micromanage corporate governance with a “one size fits all”approach, as Sarbanes-Oxley does to a large degree, policymakers shouldfocus on affecting the expected costs and benefits of accounting fraudsuch that it is irrational for executives to commit this fraud. As I arguebelow, the expected costs of accounting fraud increased substantiallysince 2001, which greatly reduces the incentive to commit “Enron-like”fraud. This change in incentives is likely to be far more effective in deterringfraud than the costly, cumbersome provisions of Sarbanes-Oxley. In myopinion, Congress should repeal those parts of Sarbanes-Oxley that micro-manage corporate governance procedures and focus on policy variablesthat affect the expected costs and benefits of accounting fraud.
No Evidence Of A “Crisis of Confidence” After Enron
A popular rationale for Sarbanes-Oxley at the time of its passage is thatEnron et al had caused a “crisis of confidence” in U.S. corporations thatmade investors reluctant to invest in U.S. companies. This, in turn, it wasargued, was a major reason for the substantial decline in U.S. stock pricesaround the time the Enron scandal was revealed in October 2001.Sarbanes-Oxley, it was argued, would restore investor confidence in theintegrity of U.S. corporations.
A close look at stock price movements during this time period contradictsthis view.
First, the decline in U.S. stock prices during the period around the revelationof Enron et al was comparable to the decline in stock prices in otherdeveloped countries that did not experience high-profile accounting/governance scandals. For example, the S&P 500, a broad-based U.S.stock market index, declined by 29% from its peak on March 24, 2000 toOctober 15, 2001, the date of the first public revelation of the Enronscandal. The corresponding decline in the U.K.’s FTSE Index was similar,at 25%, even though the U.K. had not been besieged with headline-grabbingcorporate scandals. The corresponding declines in Germany’s DAX index,France’s CAC index, and Japan’s Nikkei index over this period were even
11
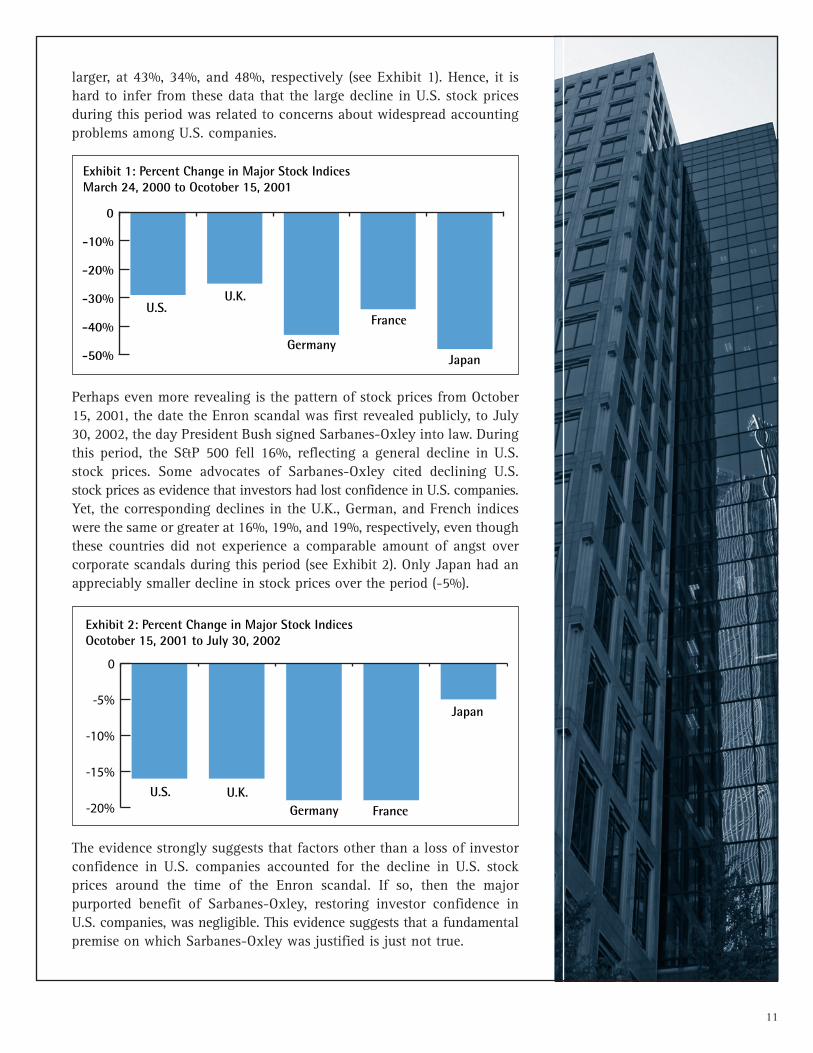
larger, at 43%, 34%, and 48%, respectively (see Exhibit 1). Hence, it ishard to infer from these data that the large decline in U.S. stock pricesduring this period was related to concerns about widespread accountingproblems among U.S. companies.
Exhibit 1: Percent Change in Major Stock Indices March 24, 2000 to Ocotober 15, 2001
-50%
-40%
-30%
-20%
-10%
0
Germany
U.S.U.K.
France
Japan
The evidence strongly suggests that factors other than a loss of investorconfidence in U.S. companies accounted for the decline in U.S. stockprices around the time of the Enron scandal. If so, then the major purported benefit of Sarbanes-Oxley, restoring investor confidence inU.S. companies, was negligible. This evidence suggests that a fundamentalpremise on which Sarbanes-Oxley was justified is just not true.
Perhaps even more revealing is the pattern of stock prices from October15, 2001, the date the Enron scandal was first revealed publicly, to July30, 2002, the day President Bush signed Sarbanes-Oxley into law. Duringthis period, the S&P 500 fell 16%, reflecting a general decline in U.S.stock prices. Some advocates of Sarbanes-Oxley cited declining U.S.stock prices as evidence that investors had lost confidence in U.S. companies.Yet, the corresponding declines in the U.K., German, and French indiceswere the same or greater at 16%, 19%, and 19%, respectively, even thoughthese countries did not experience a comparable amount of angst overcorporate scandals during this period (see Exhibit 2). Only Japan had anappreciably smaller decline in stock prices over the period (-5%).
-20%
-15%
-10%
-5%
0
Exhibit 2: Percent Change in Major Stock Indices Ocotober 15, 2001 to July 30, 2002
GermanyU.S. U.K.
France
Japan
12
Diagnosing the Cause of the Corporate Scandals
In order to prescribe an appropriate remedy for a policy problem, it is important to properly diagnose the reason for the problem.Unfortunately, the hurried nature with which Sarbanes-Oxley was passeddid not allow for a reasoned diagnosis of the problems that led to thescandals.
A common view among advocates of Sarbanes-Oxley at the time of itspassage was that the “greed” of U.S. business executives led to the proliferation of high profile scandals in 2001 and 2002. However, the“greed theory” is not a satisfactory explanation of why these scandalsoccurred when they occurred.
Economists generally assume that people in all walks of life, not justbusiness, prefer “more” to “less,” and that this desire does not swingwidely over time. Furthermore, accounting fraud is not a new phenomenon– cases of accounting fraud go back to the inception of business enterprise.During the past thirty years alone, the SEC has brought hundreds of casesof accounting fraud, including dozens during the stock market boom ofthe late 1990s when some investors and the media were less engaged inthe topic.
If not an outburst of greed, what, then, explains the presumed increasein accounting fraud in the early part of the millennium? Professor GaryBecker, the Nobel- prize winning economist at the University of Chicago,developed an economic theory of crime that suggests an answer.
Under Professor Becker’s theory, crime, or in this case, accounting fraud,can be viewed as an act governed by rational behavior. Whatever theirethical predispositions, executives are more likely to commit fraud as theexpected costs of fraud decline relative to the expected benefits of fraud.Conceptually, the expected costs are simply the probability the fraud isdetected times the penalty incurred if the fraud is detected. Hence, if thereis a 10% chance that the fraud is detected, and the penalty if detected is 10 years in prison, then the expected prison sentence before a fraud iscommitted is one year (i.e., 10% times 10 years).
There is good reason to believe that the probability of detecting accountingfraud, and, therefore, the expected costs of accounting fraud, declinedduring the 1990s. If so, it is predictable that there would have been anincreased incidence of accounting fraud during this period.
First, U.S. securities markets grew substantially during the 1990s, at arate that far outpaced the growth in resources at the SEC, the federalagency chiefly responsible for ferreting out accounting fraud. As onemeasure of this, the value of publicly traded companies on the New YorkStock Exchange (“NYSE”) and Nasdaq increased more than five-fold duringthe 1990s, from $3.1 trillion in 1990 to $16.1 trillion in 2000. During thesame time, the SEC’s budget increased a little more than two-fold, from$162 million in 1990 to $372 million in 2000 (see Exhibit 3).

13
As U.S. securities markets grew more rapidly than the SEC, the probabilitythe SEC would identify and prosecute accounting fraud declined, therebylowering the expected cost of committing fraud. At the margin, this madefraud more rational, resulting in a higher incidence of accounting fraud.
It also is likely that the changing mix of assets in the U.S. economy duringthe 1990s made it more difficult to detect accounting fraud, therebyresulting in a higher incidence of fraud. During the past twenty years,intangible assets such as research and development, human capital, andgrowth options have become a more important part of the U.S. economy,and tangible assets have become less important. Throughout the 1990s,there was enormous growth in firms with mostly intangible assets, suchas telecommunications, software, and dot.com firms. Compared withfirms that have mostly “bricks and mortar” (e.g., steel, textiles, food),these firms are more difficult to value, their managers are more difficultto monitor, and their accounting data is more difficult to verify.
As a result, the probability of detecting accounting fraud is almost certainlymore difficult in firms with largely intangible assets. As a result, accountingfraud is more likely in these firms. Dean Mason Gerety of Northern ArizonaUniversity and I found some support for this hypothesis in a paper publishedin 1997.6 Anecdotally, many of the prominent cases of accounting fraudoccurred in firms with large amounts of intangible assets, such as Worldcom,Qwest, and Adelphia. As firms with mostly intangible assets accounted for alarger proportion of the public market, it is not surprising that there was acorresponding increase in accounting fraud.
A third reason why the incidence of accounting fraud may have grownin the 1990s is that the sizeable increase in the use of executive stockoptions may have increased the expected benefits of committing fraud.Overall, stock options do more good than harm, as they can be used toalign incentives of managers with stockholders. However, stock optionsalso can increase incentives for accounting fraud. If a manager expects
Exhibit 3: SEC Budget and Value of NYSE and NASDAQ Listed Firms1990 and 2000
0
5
10
15
20
$ Tr
illio
n
U.S. Market Cap3.1 SEC Budget
.000372
1990 2000
SEC Budget.000162
U.S. Market Cap16.1
6 Mason Gerety and Kenneth Lehn, “The Causes and Consequences of AccountingFraud,” Managerial and Decision Economics, 1997, pp. 587-599.

14
the fraud to artificially inflate his company’s stock price, and if he viewsthe expected gains from his options position to exceed the expected costsof fraud, then, holding ethical constraints constant, he is more likely tocommit fraud. At the margin, the growth in executive stock option grantsduring the 1990s probably increased the incentive to commit accountingfraud, even if, on balance, stock options serve the interests of stockholders.
If my diagnosis is correct, that the proximate cause of the accountingscandals five years ago was a change in the expected costs and benefitsof fraud, then the appropriate policy response is to change that the cost-benefit calculus in such a way that Enron-like fraud becomes irrational.As I discuss in the next section, Congress, the SEC, and state attorneysgeneral effectively have done this since 2001.
The Expected Costs of Accounting Fraud have IncreasedSubstantially Since Enron
The two variables that determine the expected costs of fraud, the probabilityof detection and the penalty incurred if detected, have both increasedsignificantly since the revelation of Enron et al five years ago. As a result,the incentive to commit accounting fraud is far lower today than it wasfive years ago.
The probability of detection has undoubtedly increased since 2001.Sarbanes-Oxley immediately authorized increased funding of $20 millionfor the SEC, enabling it to add 100 people to its enforcement staff. Sincethen, the SEC budget has grown substantially, to $888 million in 2006,an increase over its level in 2000. The budget for the SEC’s division ofenforcement in 2006 is $336.7 million, almost as large as the entire SECbudget in 2000. In addition to the increase in the SEC’s overall budgetand the budget for its enforcement activities, state attorneys general, perhaps represented most prominently by Elliot Spitzer, have becomemore vigilant in their efforts to fight state securities fraud. This also hasincreased the probability of detection.
The penalties imposed on those caught committing fraud also haveincreased substantially since 2001. Recently, Jeffrey Skilling of Enronand Bernard Ebbers of Worldcom received prison sentences of 24 yearsand 25 years, respectively, meaning that both will live most of theirremaining life in prison. In addition, the remaining $60 million ofSkilling’s personal assets will be liquidated to compensate the allegedvictims of his fraud. Other than his house and $50,000, all of Ebber’s $45million of personal assets will be liquidated for the same reason. In addi-tion to these high profile individuals, dozens of lower level executives havebeen sentenced to prison or face prison sentences related to accountingfraud, resulting in ruination of their lives and personal finances.
In addition, the indictment of Enron’s auditor, Arthur Andersen, resultedin the demise of the firm, causing great financial loss to hundreds of

15
Arthur Andersen partners, most of whom had no culpability in the Enronscandal. This event also has increased the expected costs of accountingfraud, such that the incentive for committing this fraud is considerablyless than it was in 2001.
“One Size Fits All” Regulation is the Wrong Approach
The large increase in the expected costs of accounting fraud has alostundoubtedly gone a long way towards deterring the Enron-like behaviorthat resulted in the adoption of Sarbanes-Oxley. As policymakers considerrevisions to the law in the ensuing months, they should consider repealingthose aspects of Sarbanes-Oxley that impose internal governance procedureson firms.
The inherent problem with prescribing “good governance” standards on allfirms through legislation or regulation is that there are not universal gov-ernance standards that are good for all firms. In reality, optimal governancestructure and procedures vary significantly across firms and industries.
The pressure on the SEC to relieve small firms from the onerous require-ments of Section 404 of Sarbanes-Oxley illustrates the fallacy of “onesize fits all” regulation. The high fixed costs of complying with Section404 are greater than any benefit investors in small firms, if not all firms,could conceivably derive from this provision of Sarbanes-Oxley. Hence,the SEC is considering exemptions for firms below a certain size. Butidentifying the appropriate size for this cutoff and quantifying othervariables that might affect the costs and benefits of this provision on afirm-by-firm basis is prohibitively costly, if not impossible. Furthermore,if complying with this section of Sarbanes-Oxley was efficient, thenfirms should have a private incentive to voluntarily comply with the law.Perhaps as an alternative to outright repeal of Section 404, Congressshould consider allowing firms to “opt in” (or “opt out”) of Section 404.
Similarly, regulations that attempt to prescribe “good” board structuresare inherently plagued by the fact that a “good” (i.e., value-maximizing)board structure for one firm may be a “bad” (i.e., value-reducing) boardstructure for another firm. Consider the issue of independent directors.Corporate governance activists often argue that board independence isuniversally good. Yet, historically, one finds systematic differences in theindependence of boards across companies.
Historically, boards have been more independent in mature industries(e.g., food processing, textiles, steel) than in younger, high-growth industries,such as software and biotech. There is a good economic reason for thispattern. In young, high-growth firms, it is more difficult for outsiders toassess the value of companies and monitor the managers. Hence, addingmore independent directors to the board of a high growth company islikely to add costs that exceed any countervailing benefit. Perhaps thelargest cost is the cost of additional management time as managers,
16
instead of managing the company, need to spend more time providinginformation to the independent directors. Regulation of board size andstructure is likely to impose costs on firms, especially high growth firms,without sufficient countervailing benefit.
The danger with the “one size fits all” provisions of Sarbanes-Oxley is thatit has moved the U.S. in the direction of codifying corporate governance.One of the strengths of the U.S. economic system, and others that derivefrom the U.K. common law tradition is that we generally do not codifycorporate behavior. Different firms are allowed to experiment with,among other things, different governance structures and procedures, subject to enforcement of antifraud laws and regulations. Codifying corporate governance, i.e., restricting choice, imposes substantial costs onfirms, especially those operating in innovative, high growth industrieswhere nimbleness and flexibility are important.
Conclusion
Congress has the opportunity to correct a mistake it made when it hurriedly passed Sarbanes-Oxley in 2002. The federal government is very effective at establishing incentives, but largely ineffective at micromanaging the internal governance procedures of U.S. firms thatvary greatly in terms of size and industry characteristics. This papermakes the argument that the increase in resources allocated to securitiesenforcement and the substantial penalties meted out to executives convicted of accounting fraud have dramatically reduced the incentive toengage in Enron-like behavior. In light of this, Congress should repealthe “one size fits all” provisions of Sarbanes-Oxley, which are unlikely tobe effective remedies for high profile corporate scandals.
17
Audit Committee FinancialLiteracy: What Might It Meanand Why Bother?*Roman L. Weil, PhD, Douglas J. Coates, PhD and M. Laurentius Marais, PhD
Brief History of Financial Literacy
In 1999, the Blue Ribbon Committee on Improving the Effectiveness ofCorporate Audit Committees, convened by the NYSE and the NASD,issued a report recommending that every publicly traded company havean audit committee comprising at least three financially literate members. It did not define financial literacy other than to say, “Such ‘literacy’ signifies the ability to read and understand fundamental financialstatements, including a company’s balance sheet, income statement, andcash flow statement.”1
In 1999, the New York Stock Exchange added to its listing requirementsa rule that each company shall have an audit committee comprising a)independent directors who are b) financially literate, and include c) at
* This paper draws heavily on our earlier paper “Audit Committee Financial Literacy: A Work in Progress,” in the Journal of Accounting Auditing and Finance, Spring 2007.All rights reserved. Where parts are the same, they are reproduced by permission ofGreenwood Publishing Group In., Westport CT.
1 Report and Recommendations of the Blue Ribbon Committee on Improving theEffectiveness of Corporate Audit Committees, printed by The New York Stock Exchange and the National Association of Securities Dealers, 1999.
About the Authors
Roman L. Weil is V. Duane RathProfessor of Accounting at theUniversity of Chicago. He foundedand directed the Directors'Consortium. Professor Weil is authoror co-author of over 100 books andarticles. He has held numerous senioreditorial positions with leadingaccounting journals such as the Journal of Accounting andEconomics, the Financial AnalystsJournal, and The Accounting Review.He has consulted for several governmental agencies and multiplecorporate clients. He has served onnumerous boards and governmentcommittees.
Douglas J. Coates received his MBAdegree in 2005 from the GraduateSchool of Business, University ofChicago. His participation in thiswork received funding from theSchool.
M. Laurentius Marais is the vice president of William E. WeckerAssociates.
18
least one financial expert.2 It did not say what financial literacy means,other than to delegate the decision for any listed company to that company’s board. Aside from the Blue Ribbon recommendation specificallymentioning what we might call accounting literacy, listing requirementshave not focused on accounting matters.3 Then, in 2002, came theSarbanes-Oxley Act (SOX), which requires that public companies have anAudit Committee Financial Expert (ACFE) or explain why they do not.4
The requirements for the ACFE do not necessarily imply accounting literacy, however, as they allow financial executives with no accountingexperience to be the ACFE.5
More important for financial literacy, SOX established the PublicCompany Accounting Oversight Board (PCAOB, but a misnomer, as considering the role SOX has given the PCAOB, Accounting should beAuditing). The PCAOB initially proposed that the auditor should find acompany’s internal controls deficient if it judged the audit committee tobe ineffective. Auditors objected to the PCAOB’s proposal because a company can offset any given weakness in an internal control systemwith some compensating strength elsewhere, and that overall internalcontrol is the issue, not the specific components of the process. The auditcommittee is just one component of the process. The final rule promul-gated by the PCAOB adopted this portfolio approach to internal control:6
59. Ineffective oversight by the audit committee of the company’sexternal financial reporting and internal control over financialreporting should be regarded as at least a significant deficiency andis a strong indicator that a material weakness in internal controlover financial reporting exists.
2 Boldface added. Last Modified 12/20/99. 303.00 Corporate Governance Standards303.01 Audit Committee(A) Audit Committee Policy. Each company must have a qualified audit committee.(B) Requirements for a Qualified Audit Committee.….. (2) Composition/Expertise Requirement of Audit Committee Members.(a) Each audit committee shall consist of at least three directors, all of whom have norelationship to the company that may interfere with the exercise of their independencefrom management and the company (“Independent”);(b) Each member of the audit committee shall be financially literate, as such qualification is interpreted by the company’s Board of Directors in its businessjudgment, or must become financially literate within a reasonable period of time afterhis or her appointment to the audit committee.
3 Some professors of corporate finance have bristled at our suggestions that their performance on the financial literacy quiz described below suggests a lack of such literacy. These professors don’t mind being judged illiterate in accounting, but do in finance. No doubt, audit committee members expert in corporate finance, but not knowledgeable about accounting, will similarly bristle.
4 See Section 407 of the Act.5 One can become a senior financial executive, CFO even, without having more than afirst accounting course in accounting from an MBA program. Such executives haveexpertise in corporate finance, treasury functions, investment banking, but notaccounting nor controllership, nor auditing.
6 PCAOB Release 2004-001, March 9, 2004. Page A-30—Standard.
19
The public accounting firms have a process for instructing their auditorshow to deal with the requirement to assess the effectiveness of the auditcommittee in the context of internal control. PriceWaterhouseCoopers,for example, says:7
Audit Committee Effectiveness
The company’s board of directors is responsible for evaluating theperformance and effectiveness of the audit committee and demon-strating its assessment to the external auditors. When evaluatingthe effectiveness of the audit committee, we believe the boardshould consider the following:
• The audit committee’s compliance with exchange listing standards
• The level of financial expertise among the audit committee members
Note the links: stock exchange listing requirements for financial literacy,PCAOB rules for auditors, and auditors’ guidelines to meet listingrequirements.8 Audit committees need financial literacy. Whether thismeans accounting literacy remains open. The rest of this report assumesit does.
Financial (Accounting) Literacy
We have developed criteria for financial literacy in presentations toboard members. We base the criteria on the mandatory disclosure ofCritical Accounting Policies and Estimates (CAPE) section of theManagement’s Discussion and Analysis part of the annual report. All thenumbers in the financial statements (except the date) are estimates. Management must tell us which ones involve judgments with materialconsequences. We base our criteria for financial literacy on the basiccapabilities required for understanding those judgments, which theAppendix illustrates with excerpts from Kodak’s CAPE:
1. Understand the business model (the way the enterprise earns income)and how or why that business model requires the judgments and esti-mates in CAPE. In short, understand the transactions that require thejudgments described.9 Example: a firm that has more goods availablefor sale or use for a period than it sells or uses must allocate the cost
7 PriceWaterhouseCoopers, Sarbanes-Oxley Act: Section 404, July 2004, pp 27-28.8 Cunningham (2004) explores the inherent contradiction of having the audit committeehire the auditor, as SOX requires, and then having the auditor assess the effectivenessof the audit committee, as the PCAOB, created by SOX, requires. He suggests the statesshould create certifications for audit committees. We guess that how well-intentionedsuch credentialing efforts, they will fail on implementation grounds. Emphasis willfocus on compliance, not knowledge as we suggest here, audit committee membersshould have.
9 We think all board members, not just audit committee members, should understandhow the enterprise earns income, which means that we think all board membersshould master this step.
20
of goods available for sale or use to cost of goods sold and endinginventory. Example: an insurance business model requires measurementof claims loss estimates (often called reserves). Example: selling oncredit requires analyzing accounts receivable or impairments. Testyourself: do I know why these are the CAPE? What would be the nextone to add to the list?
2. Understand the recognition and measurement guidance that GAAPand International Financial Reporting Standards (IFRS) provide forthese CAPE. What is the intent of the standard – that is, the reportingobjective? What judgments and estimates do the standards require andwhat do these standards attempt to achieve – the reporting objective?Example: why does FAS 15810 require estimates of long-term rates ofreturn in accounting for pensions? Do GAAP/IFRS provide a freechoice? Example: yes, for choosing among specific identification andLIFO or FIFO or weighted-average cost flow assumptions for inventory,or, example: no, for choosing accounting treatment for leases, whereGAAP/IFRS provide qualifying conditions for accounting methods.Test yourself: do I understand the qualifying conditions for my enterprise’suse of hedge accounting? Or, of sales treatment for financial assettransfers? Or, of sales treatment of goods leased in capital leases?
3. Understand whether management’s judgments/estimates described in CAPE are consistent with the business model, with the economicenvironment, and with objectives of the applicable guidance fromGAAP/IFRS. Example: the business model is to make mortgage loanswith low initial interest rates and low down-payments; is theallowance for uncollectible loans consistent with the higher expecteduncollectibles such loans imply as compared to more normal mortgagelending policies? Has the lender changed its methods as the rate of increase in housing prices has declined?
4. Understand the implications of management choices for potential manipulation of financial reporting, including both choices amongmethods under GAAP/IFRS and estimates required for the implementationof the methods. Example: did management make an estimate (or changean accounting method) to achieve a financial reporting objective – thatis, meet an earnings target? Example: did management, using LIFO,delay year-end purchases so that cost of goods sold would decline relative to normal year-end purchasing behavior, increasing earningsby a few cents per share?
While these criteria seem straightforward, even minimal, we have anec-dotal push-back. The audit committee chairman of one of the largest andbest known U.S. companies said, “These criteria are wrong. I know I’mgood enough to be the audit committee chairman, but my company’s
10 Financial Accounting Standards Board, Statement of Financial Accounting StandardsNo. 158, “Employers’ Accounting for Defined Benefit Pension Plans and OtherPostretirement Plans.”
21
transactions are too complicated for me to understand them all.” Thischairman fails even our first test. Note that the criteria don’t say,“Understand all the transactions,” but do require understanding the oneswhere accounting choices materially affect the financial statements.Another audit committee member said, “I don’t need to know all that; Iam a good judge of character and the top executives of my company arethe most honest people I have ever met.”
Results of Financial Literacy Quiz
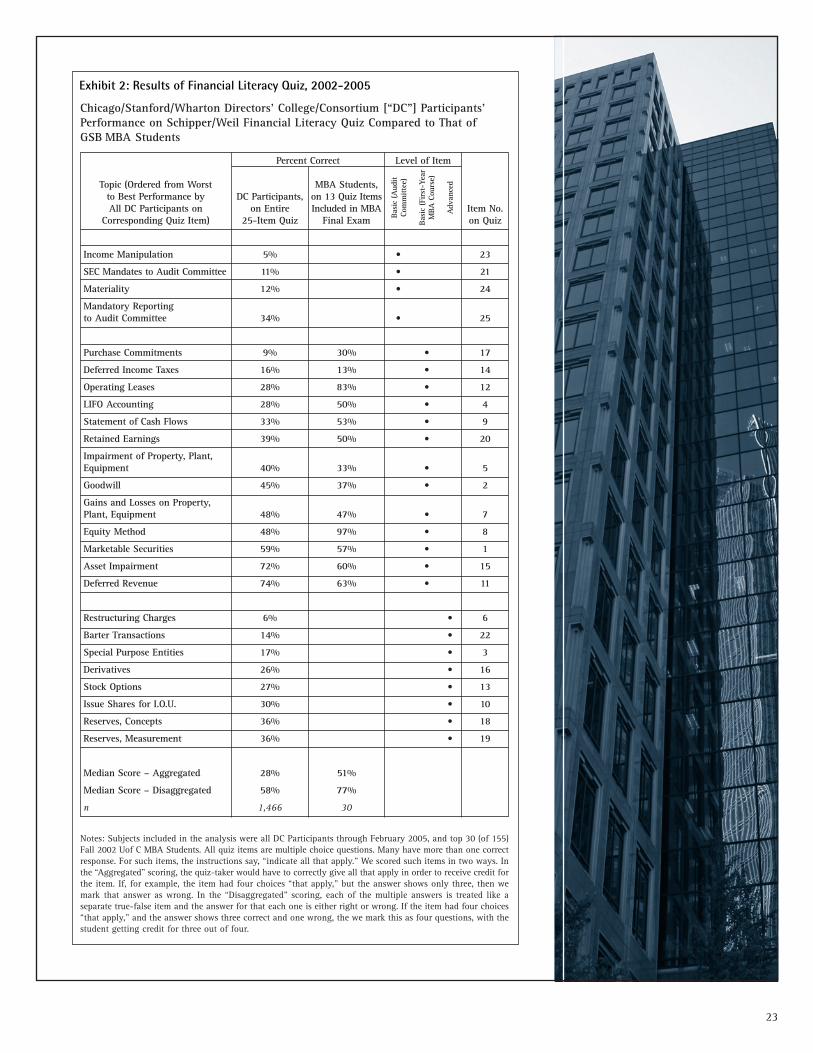
We have developed a multiple-choice quiz covering a variety of accountingand audit committee topics, which we have offered to over 2,000 attendeesat the Chicago Graduate School of Business, Stanford Law School, andWharton multiple-day executive education sessions for board members.Over the past five years, more than 1,400 attendees, almost all boardmembers or CEOs or CFOs or general counsel, have taken this quiz. The25-item quiz contains 13 questions whose answers are in the textbookwe have used to teach first-quarter, first-year MBA students, 2 items ofbasic audit committee issues, and 7 items required clear understanding ofsome topics currently pertinent for many companies, but advanced. SeeExhibit 2 for a compilation of question topics, our taxonomy of difficultylevel, and the results.
The median score on this quiz is about 8 correct out of 25, and this scorehas remained constant over several years of testing. The results point tofinancial illiteracy. The individual quiz takers, self-selected from largeraudiences, are likely people more confident of their financial literacythan those who did not take the quiz.11 Note that fewer than 30 percentof the respondents gave the correct answer for six items which one couldanswer from the first-term MBA textbook. One of these, item 20 onretained earnings, as defined in Chapter 2 of the textbook, has only 40percent correct answers. The people who took this quiz, likely the betterhalf of our board member attendees, are not yet financially literate, atleast about accounting matters. Perhaps our quiz is so difficult that youthink an accounting literate board member needn’t score more than 8 or9 correct out of 25. We do not provide the quiz in this article, as we tryto keep it from going into general circulation, hence ruining its use as aquiz.12 We gave the participants at the conference in November 2006 acopy of the questions, but not the answers.
11 One of us can report that in over 40 years of teaching, many students have said theequivalent of, “I don’t have time to take the (optional) exam in class you’re about to give, but, don’t worry, I know the material. I’m just too busy.” Not once has such a student excelled on the final examination in the same course. We think it unlikelythat those who have attended these sessions and chosen not to take the quiz wouldhave done better than those who did.
12 If you want a copy of the quiz, write [email protected]. You will receivea copy of the quiz. If you want a copy of the answers, you have to take the quiz andsend in your answers, as instructed on the cover page of the quiz.
Audit Committee Score in 2004111 211 221 222 311 321 322 331 332 333 411 421 422 431 432 433 441 442 443 444 n
444
443 Dow 1
442
441
433 anteA13varT 6
MBI234 4Conoc
o6
431
151itiC224 8
421 {1,1*} 1 3
411
21531333 12
23423123233 29
21133 3
431027223Leh-man
7 4 4 Qwest 61
11512123 10
311
ttobbA33234112SVC222 48
2*133122 9
*SKRB112Health-
netWyeth 3
111 MBNA 1
n 1 35 5 45 1 35 17 1 22 3 18 12 1 4 200
Audi
t Co
mm
itte
e Sc
ore
in 2
000
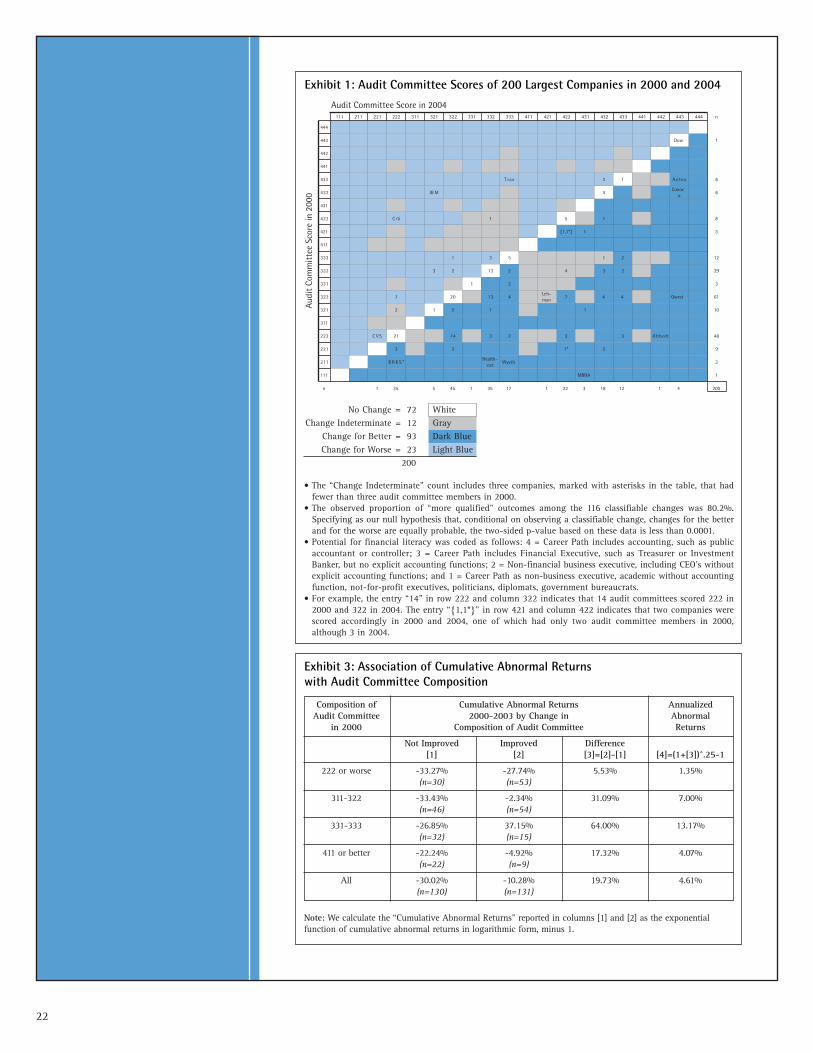
Exhibit 1: Audit Committee Scores of 200 Largest Companies in 2000 and 2004
22
Exhibit 3: Association of Cumulative Abnormal Returns with Audit Committee Composition
No Change = 72 WhiteChange Indeterminate = 12 Gray
Change for Better = 93 Dark BlueChange for Worse = 23 Light Blue
200
• The “Change Indeterminate” count includes three companies, marked with asterisks in the table, that hadfewer than three audit committee members in 2000.
• The observed proportion of “more qualified” outcomes among the 116 classifiable changes was 80.2%.Specifying as our null hypothesis that, conditional on observing a classifiable change, changes for the betterand for the worse are equally probable, the two-sided p-value based on these data is less than 0.0001.
• Potential for financial literacy was coded as follows: 4 = Career Path includes accounting, such as publicaccountant or controller; 3 = Career Path includes Financial Executive, such as Treasurer or InvestmentBanker, but no explicit accounting functions; 2 = Non-financial business executive, including CEO's withoutexplicit accounting functions; and 1 = Career Path as non-business executive, academic without accountingfunction, not-for-profit executives, politicians, diplomats, government bureaucrats.
• For example, the entry “14” in row 222 and column 322 indicates that 14 audit committees scored 222 in2000 and 322 in 2004. The entry “{1,1*}” in row 421 and column 422 indicates that two companies werescored accordingly in 2000 and 2004, one of which had only two audit committee members in 2000,although 3 in 2004.
Composition of Cumulative Abnormal Returns Annualized Audit Committee 2000-2003 by Change in Abnormal
in 2000 Composition of Audit Committee Returns
Not Improved Improved Difference[1] [2] [3]=[2]-[1] [4]=(1+[3])^.25-1
222 or worse -33.27% -27.74% 5.53% 1.35%(n=30) (n=53)
311-322 -33.43% -2.34% 31.09% 7.00%(n=46) (n=54)
331-333 -26.85% 37.15% 64.00% 13.17%(n=32) (n=15)
411 or better -22.24% -4.92% 17.32% 4.07%(n=22) (n=9)
All -30.02% -10.28% 19.73% 4.61%(n=130) (n=131)
Note: We calculate the “Cumulative Abnormal Returns” reported in columns [1] and [2] as the exponential function of cumulative abnormal returns in logarithmic form, minus 1.
23
Exhibit 2: Results of Financial Literacy Quiz, 2002-2005
Chicago/Stanford/Wharton Directors’ College/Consortium [“DC”] Participants’Performance on Schipper/Weil Financial Literacy Quiz Compared to That of GSB MBA Students
Basi
c (A
udit
Com
mitt
ee)
Basi
c (F
irst
-Yea
r M
BA C
ours
e)
Adv
ance
d
Percent Correct Level of Item
Topic (Ordered from Worst MBA Students,to Best Performance by DC Participants, on 13 Quiz ItemsAll DC Participants on on Entire Included in MBA Item No.
Corresponding Quiz Item) 25-Item Quiz Final Exam on Quiz
Income Manipulation 5% • 23
SEC Mandates to Audit Committee 11% • 21
Materiality 12% • 24
Mandatory Reporting to Audit Committee 34% • 25
Purchase Commitments 9% 30% • 17
Deferred Income Taxes 16% 13% • 14
Operating Leases 28% 83% • 12
LIFO Accounting 28% 50% • 4
Statement of Cash Flows 33% 53% • 9
Retained Earnings 39% 50% • 20
Impairment of Property, Plant, Equipment 40% 33% • 5
Goodwill 45% 37% • 2
Gains and Losses on Property, Plant, Equipment 48% 47% • 7
Equity Method 48% 97% • 8
Marketable Securities 59% 57% • 1
Asset Impairment 72% 60% • 15
Deferred Revenue 74% 63% • 11
Restructuring Charges 6% • 6
Barter Transactions 14% • 22
Special Purpose Entities 17% • 3
Derivatives 26% • 16
Stock Options 27% • 13
Issue Shares for I.O.U. 30% • 10
Reserves, Concepts 36% • 18
Reserves, Measurement 36% • 19
Median Score – Aggregated 28% 51%
Median Score – Disaggregated 58% 77%
n 1,466 30
Notes: Subjects included in the analysis were all DC Participants through February 2005, and top 30 (of 155)Fall 2002 Uof C MBA Students. All quiz items are multiple choice questions. Many have more than one correctresponse. For such items, the instructions say, “indicate all that apply.” We scored such items in two ways. Inthe “Aggregated” scoring, the quiz-taker would have to correctly give all that apply in order to receive credit forthe item. If, for example, the item had four choices “that apply,” but the answer shows only three, then wemark that answer as wrong. In the “Disaggregated” scoring, each of the multiple answers is treated like a separate true-false item and the answer for that each one is either right or wrong. If the item had four choices“that apply,” and the answer shows three correct and one wrong, the we mark this as four questions, with thestudent getting credit for three out of four.
24
Survey of Efforts to Track or Improve Financial Literacy
In 2002, we sent a short questionnaire to audit committee chairs. Thesurvey’s most substantive questions asked:
• Does the company or its Board assess the financial literacy of themembers of audit committee? If so, how?
• Has the company or the board taken steps since 1999 to increasethe financial literacy of the members of the audit committee? Ifso, what?
Summary of the Results
We received 27 responses, 25 from audit committee chairs and 2 fromCFOs. None of the respondents reported any formal process to assess thefinancial literacy of the audit committee members. The majority of therespondents report that the someone – general counsel, other boardmembers, management, search firms – screen candidates before nominatingthem. Two-thirds assessed the financial literacy of the potential auditcommittee members by looking at the background of the candidates andevaluating their academic and professional experience. Two respondedthat they do not assess financial literacy. Another two responded that they perform the assessment informally and gave no details of theassessment process. The remainder responded that the board reviews themembers but they did not mention the process by which they reviewtheir financial literacy.
Not one of the respondents indicated that their board had any formalprocess to increase financial literacy of the audit committee members.Several report that board members attended seminars, read publications,and hired consultants to meet with them and management to reviewfinancial issues. We found evidence neither of formal training nor of systematic steps taken by the firm to increase the literacy of the auditcommittee members. None of the respondents indicated that they hadany way of evaluating the impact of practices that they do follow toincrease financial literacy.
Rating Audit Committee Potential for Financial Literacy
Where are we? We know that those who voluntarily take our quiz scorelow, even on basic MBA-level accounting questions. What we can learnabout the actual people who comprise audit committees today?
Scoring Individual Audit Committee Members
We have devised a protocol for scoring the career potential for financial(accounting) literacy of audit committee members, using informationprovided in the company’s proxy statement about each member’s career.We use a four-grade score:
• 4 = Career path includes accounting function, such as public accountant
25
or controller, or provides some other clear indication of accountingexpertise.
• 3 = Career path includes financial executive function, such as Treasureror Investment Banker, but no explicit accounting functions.
• 2 = Career path includes non-financial business executive function,including CEOs without explicit accounting functions.
• 1 = Other career paths, such as non-business executive, academic withoutaccounting function, not-for-profit executive, politician, diplomat, orformer government bureaucrat. (In a handful of cases this code representsNone, when we apply our ranking of the top three members of an auditcommittee to an occasional committee having fewer than three members).
We find readers comfortable with this classification, with the possibleexception of the distinction between the scores of 4 and 3. Many, likelymore than half, of present-day CFOs are 3s. The most common career pathto CFO has been through the position of corporate treasurer, which does notrequire knowledge of generally accepted accounting principles at the levela controller needs. As a result of conversations with such CFOs and otherswho work with them, we see a distinct difference in the potential for finan-cial (recall, meaning accounting) literacy between treasurers and con-trollers.13 Similarly, we think former investment banker CFOs have had lessexposure to accounting issues than controllers in their career paths to CFO.As little substantive exposure to accounting issues as the treasurer/CFO hashad, the CEO likely has had less. Hence we score CEOs who have not hadexperience as a financial executive a notch below the financial executive.
Scoring Audit Committees
We grade each audit committee in our sample with a 3-part grade thatcan range from 111 (worst) to 444 (best). If a company has more thanthree members on its audit committee, we use the top three scores.14 Inall, we have scored for this study the audit committees of approximately300 companies, virtually all having at least three members. Thus, wescored more than 900 individual audit committee members.
Companies Rated
We rated the 200 largest and 100 smallest companies in the Fortune 1000list, as published in April 2004, provided those companies supplied datain proxy statements on audit committees for the year 1999 or 2000. Werated the largest 50 companies’ audit committees also for 1996, to collectdata on whether the changes we observed between 2000 and 2004 merelycontinued trends or represented, in fact, a departure coinciding with thecorporate scandals and new listing requirements.
13 More than one CFO treats as a badge of honor the fact that he (these are always men)doesn’t know GAAP, but relies on a trusted controller.
14 We view financial literacy ranking as lexicographic in the sense that one memberwith score 4 is better than five members with score 2.
26
Results
Exhibit 1 shows our primary results: a cross-classification of audit committee scores in 2000 and in 2004 for the 200 largest companies. Acompany’s score for 2000 determines its row and the score for 2004 itscolumn. For example, the cell at the intersection of row 322 with column421 contains the number 1, with the name Lehman (Bros.), indicatingthat only one company had its audit committee score 322 in 2000 and421 in 2004. Row 211, column 222 includes the superscript “*” forBerkshire Hathaway, indicating that in 2000 the audit committee hadonly one member (whom we scored a 2, together with two scores of 1representing “None”). The {1*, 1} entry for row 421, column 422, indicatesthat one company (Sanmina) had a 2000 audit committee with only twomembers, while another company (Tenet Healthcare) had at least 3 membersin both years.
Exhibit 1 is color-coded (shaded) into four classes: the audit committeescore remained the same between 2000 and 2004 (on the diagonal, inwhite), or the score improved (below, to the right of, the diagonal, in darkblue), or the score got worse (above, to the left of, the diagonal, in lightblue), or the score changed but the quality of the change is ambiguous(gray or a cell count is marked with an asterisk). The score change isambiguous, as in the case of Lehman Bros (322 to 421), when at least onecomponent of the score gets better (for Lehman, the top score increasedfrom 3 to 4), while at least one got worse (for Lehman, the third scoredeclined from 2 to 1); or, when the audit committee improved by virtueof simply adding a member, such as when the 2000 audit committee hadfewer than 3 members and the 2004 committee has 3 or more members.
Hall of Fame
No company has an audit committee with a score of 444, which likelymeans that board nominating committees think not every audit committeemember needs to understand GAAP in his or her own head. Four companies – Dow, Aetna, ConocoPhillips, and Qwest—score 443, withDow scoring 443 in 2000, as well. Two of these companies, Aetna andQwest have had some accounting difficulties in recent years and theirhigh audit committees’ high scores likely reflect a concern with beefingup the financial literacy in the wake of accounting troubles.15 DowChemical stands alone at the top of this list.16 MBNA appears to havemade the greatest change for the better, from 111 to 431.
15 Farber (2004) found, in a sample of firms cited for violation of SEC Rule 10b-5, apositive association between fraud detection and subsequent improvements in thequality of the board of directors and audit committee activity.
16 One of its members receiving a score of 4 might be a 3. The member has never beenan auditor or a controller, but has been on the board of the AICPA and a trustee ofthe Financial Accounting Foundation.

27
At the Bottom
One company from the top 200, CVS, has an audit committee currentlyscoring only 221. Thirty-six from the largest 200 companies score 222,including Berkshire-Hathaway, ChevronTexaco, and Citigroup. The scoreof 2 indicates a CEO whose proxy bio reports no experience as a financialexecutive. Berkshire-Hathaway might assert, “We don’t need them; ouraudit members collectively have equivalent, even better, experience,judgment, and wisdom than does a former audit partner.” Perhaps, butdo these 2s genuinely understand how management can manipulateincome with year-end purchases or by classifying hedges as effective, ornot? Thirty-seven of the largest companies have audit committees ranking222 or lower. At even money, we’d bet that at least one of them producesan accounting scandal within the next five years.17
Progress
Do the data in Exhibit 1 suggest progress towards greater audit committeefinancial literacy? Yes. We performed the following simple test. First,focus on the companies in which audit committee scores changed clearlyfor the better (93) or for the worse (23), excluding the 72 whose scoresdid not change and the 12 whose score changes were indeterminate.There are 116 (= 93 + 23) audit committees changing clearly for the better or for the worse, among which 80 percent changed for the better.We specify a null hypothesis that, conditional on observing a classifiablechange, changes for the better and for the worse are equally likely. Wethen calculate, based on these data, the two-sided p-value under this nullhypothesis of equal probabilities. (What are the chances that with 116coin flips, each having equal chances of heads or tails, there will be apreponderance of heads or tails as great as 93 of 116?) The p-value is lessthan .0001, indicating a statistically significant elevation above 50 percentof the proportion of changes for the better.
Do the changes for the better arise only for the largest companies? No.We examined that question by creating a cross-classification, parallelingExhibit 1, for the 100 smallest companies in the same Fortune 1000 listas we used to find the largest 200. The smallest 100 have revenuesbetween $1.2 billion and $1.4 billion, while the largest 200 have revenuesbetween $9 billion (Avnet) and $259 billion (Wal-Mart). Again, we specifya null hypothesis that conditional on observing a classifiable change,changes for the better and for the worse are equally likely. Fifty-five ofthe 100 have classifiable changes, 45 (i.e., 82 percent) for the better and
17 See the data at http://securities.stanford.edu/, which suggests that any one companyhas about a 2 percent chance of being involved in accounting-related scandals in any one year. This suggests that any one company has at best a 98 percent chance ofavoiding accounting-related scandal, assuming perfect serial dependence. The chancethat 37 independent events each with 98 percent of success will all have successfuloutcomes is .9837, i.e., about 47.5 percent, which means the chance of at least onefailure is about 52.5 percent.
28
10 for the worse. Based on these data, the two-sided p-value under thenull hypothesis of equal probabilities is also less than .0001. Here also the proportion of changes for the better appears statistically significantlyelevated. We do not show these data, which you can get from the authors.
Timing of Changes in Regulations Appear to Matter
Have things changed since the new listing requirements have taken effect?Yes. We examine that question by creating the cross-classification, paral-leling Exhibit 1, for the 50 largest companies in our list between 1996 and2000. You can get these data, too, from the authors, by writing us.
Again, we specify a null hypothesis that, conditional on observing a classifiable change, changes for the better and for the worse are equallylikely. Twenty-eight of the 50 have classifiable changes, 15 (i.e., 54 percent,compared to 80 and 82 percent in Exhibit 1) for the better and 13 for theworse. Based on these data, the two-sided p-value under the null hypothesisof equal probabilities is 0.850. These changes unlike those in Exhibit 1,indicate no statistically significant departure from equal probabilities ofa change up and a change down.18 In other words, behavior since the newlisting requirements looks different.
Market Reaction to Audit Committee Potential for Financial Literacy
There is evidence that the market reacts as though it prefers an auditcommittee with more potential for financial, that is accounting, literacy.DeFond, Hann, and Hu (2004) found significantly positive cumulativeabnormal residuals around the appointment of accounting financialexperts to the audit committee, but not around the appointment of non-accounting financial experts or directors without financial expertise.Davidson, et al. (2004) investigated stock returns surrounding 136appointments of directors to audit committees and found significantlypositive stock price reaction when new members of audit committeeshave financial expertise. We report our own tests next.
We partitioned those of our 300 companies having sufficient market datafor our tests19 (181 of the 200 hundred largest and 90 of the 100 smallestof the Fortune 1000) into two groups for analysis. One group comprises131 companies whose audit committees improved; a second group of“not improved” companies comprises 130 whose audit committee ratingswere unchanged and 29 whose ratings declined;20 and a third, ignored
18 The difference between the proportions of improvers in Exhibits 1 and 3 (80 and 54percent) is highly statistically significant in a Fisher exact test, as is the between theproportions of improvers in Exhibits 2 and 3 (82 and 54 percent; p-values 0.01).
19 We calculated monthly “abnormal returns” for each company having CRSP returnsdata for at least 30 months of our initial estimation period (January 1996–December1999) and for all 48 months of the “target period” for our analysis (January 2000–December 2003).
20 By “improve” we mean a Pareto improvement in the potential for financial literacyreflected in our scores. To improve, none of the three individual scores for membersof the committee gets worse and at least one gets better.
29
group comprises the 10 companies whose score changes were indeterminate(such as a change from score of 322 to 421).21 For each company we computed a total excess return, relative to an equally weighted marketindex, for the four-year period from the beginning of 2000 through theend of 2003.22 Then we computed the average excess return for the 138improvers separately from that of the 133 non-improvers, both overalland within subgroups based on the audit committee ratings for 2000.Exhibit 3 reports the results.
Over the 4-year period 2000-2003, the improvers generated a cumulativeexcess return of 19.73 percent greater than that of the non-improvers, foran annual average of 4.6 percent (compounded annually). We also computed the difference in the excess returns between the improvers andthe non-improvers as a function of the starting score. Note, for example,that 100 (= 46 + 54) companies started with scores of 311, 321 or 322.Fifty four of these improved and forty six did not. In this group, theimprovers out-(excess)-earned the non-improvers by over 31 percentduring the four years, or 7 percent per year. These differences are statistically significant in terms of a permutation test on the t statistic for the effect of “Improved” status in a two-way analysis of variance (p = 0.01).23
The excess returns difference between improvers and non-improvers isnot monotonic across sub-groups. We have not tested why this might beso, but we hypothesize that, like us, the market prefers quality over quantity,
21 An alternative analysis in which we classified these 10 indeterminate cases as 7“Improved” and 3 “Not improved” based on lexicographic ordering produced virtually identical results.
22 We calculated as “excess returns,” also known as “abnormal returns,” the predictionerrors from a market model in logarithmic returns, using an equally weighted indexof NYSE and AMEX firms to represent the market factor for listed firms and anequally weighted index of NASDAQ firms to represent the market factor for NASDAQfirms. We specified our market models in terms of returns defined, for firm i inmonth t, as ri,t = ln((pi,t+di,t)/pi,t-1), where “ln” denotes the natural logarithm, pi,tthe closing price in month t, and di,t dividends accrued in month t. For each samplefirm we recalculated the coefficients of the market model for each successive “targetyear” in 2000-2003, using as estimation data all available returns from the immediatelypreceding four-year period. This procedure produced a sample of 271 companies havingcomplete monthly abnormal returns data for 2000-2003. We calculated a “TotalAbnormal Return” for each company by summing the monthly abnormal returnsacross all four years. We calculated the “Average Abnormal Return” for each specified group of companies as the simple average of Total Abnormal Returns for individual companies.
23 Specifically, this two-way analysis of variance included main effects for initial-score-group and improvement-status. Because we expect that the standard assumptions forthe validity of parametric ANOVA test statistics do not apply to our data, we applieda nonparametric method to the ANOVA t statistic for the effect of “Improved.” Weused a Monte Carlo method to approximate the permutation distribution of the t statistic under permutation of the “Improved” and “Not improved” labeling of companies within each subgroup based on initial committee structure. In a randomsample of 1,000 permutations, the recalculated t statistic was greater than or equal to our sample value in 10 cases, yielding an estimated p-value of 0.010, with a 99percent upper confidence bound of 0.020.
30
and views as 411 as preferable to 333. We prefer, but don’t know if themarket prefers, one accounting expert, joined by two university presidents,to three corporate treasurers or investment bankers. The improvement froma 222 or worse is less likely to improve to 4xx than is a 333, which, if itimproves, must add at least one 4.
Costs and Benefits of a More Literate Audit Committee
What does it cost to improve the potential literacy of the audit committee?The out-of-pocket cost is likely zero, but surely less than $100,000 peryear for replacing a 3 or 2 or 1 with a member who scores 4. Considerthat we know, anecdotally, dozens of potential 4s (think former partnersat Arthur Andersen or retirees from the Big 4 accounting firms who mustleave the firm at age 60 or 61) who can do the work. These 4s don’t bringglamour, but they are abundant. On average for companies with marketcapitalization of $10 billion, companies which improved their audit committees’ potential literacy had increases in wealth of about $580 million per year greater than the companies whose audit committees didn’t improve. You can hire a lot of ex-Andersen partners for $600 millionper year.
Further Directions
Audit committee members appear not yet literate if by financially literatewe mean understanding accounting at the level of an introductory MBAaccounting course. Boards appear to have begun the process of improvingfinancial literacy. Shareholders appear to benefit from the company’saudit committee being more literate, and the magnitude of the returndwarfs the costs of increasing that literacy.
We are now comparing the scores of audit committees of a matched sample of companies – those in options backdating trouble and those otherwise similar, which are not. We expect to find that those who are introuble have audit committees with lower scores for potential financialliteracy than the matched companies, who are not in trouble.
Should We Test Nominees for Audit Committee Membership?
Now that we know audit committee members are illiterate about accountingmatters, the question naturally arises: should we have externally-imposedstandards for audit committee membership? Yes, if we authors of thispaper get to set the standards and become the gatekeepers. No, otherwise.We think nominating committees should choose their own audit committees.We can publicize the benefits to having literate members and let the self-interests of the board nominating committees take the matter from there.
31
Appendix. Illustration of Financial Literacy Criteria, Basedon Kodak’s Disclosure
We illustrate the 4-point criteria for financial literacy using Kodak management’s disclosure of its critical accounting policies and estimates.Kodak mentions inventory issues in its note: “Kodak reduces the carryingvalue of its inventory based on estimates of what is excess, slow-movingand obsolete, as well as inventory whose carrying value is in excess ofnet realizable value….”24
1. Understand the transactions that cause management to have to makea judgment about inventory carrying value.
Kodak purchases more raw materials or manufactures other items forinventory than it sells during a period. It has ending inventories on itsbalance sheet. The accounting equation requires a valuation (Kodakcalls it carrying value) of those inventories in order to measure cost ofgood sold. Kodak tells us this importantly affects its reported numbers.
2. What choices do GAAP/IFRS provide among accounting methods andestimates for management in reporting on those transactions?
In Kodak’s case, management must make four sorts of choices tomeasure inventory carrying value: cost basis (for example, historicalcost, replacement cost, lower of cost or market), frequency of inventorycalculations (periodic or perpetual), cost inclusion rules for manufacturedinventory (where on the spectrum of direct versus absorption costingto put itself), and whether to use a cost flow assumption and if so,which one (specific identification or a choice between LIFO, FIFO,weighted average). This illustration focuses only the last of these, thecost flow assumption.
Which unit’s costs flow into cost of goods sold during the period – thecost of the first units produced (FIFO), or the cost of the last units produced (LIFO), or the cost of the next unit produced (NIFO), or anaveraging approach, or even specific identification? U.S. GAAP allowall of these except NIFO; other countries forbid LIFO as well.
Why did management choose a LIFO cost flow assumption? From theoutside, we can guess that Kodak chose LIFO because of its effects ondeferrals of tax payments. An audit committee member needn’t guessand can judge that such choice meshes with corporate policy.
4. Most important: a financially literate board member needs to understandthe implications for financial reporting of management’s choice, includingthe potential this choice gives management to manipulate income.
24 This sentence appears in Kodak's annual reports for all the years 2002-05 in the MD&A section.
32
For example, choosing LIFO instead of FIFO means reporting lowerincome in times of rising prices, but deferring income tax payments untilthe company dips into old LIFO layers. And, management can manipulateend-of-period purchases to manipulate income under LIFO. And, theaudit committee should be ready to understand why entering a new lineof business will enable avoiding decrements to LIFO layers and avoidinghigher tax payments than would occur without the new line.
References
Cunningham, Lawrence A., “A New Product for the State CorporationLaw Market: Audit Committee Certifications.” Berkeley Business LawJournal 1 (2004): 327-368. http://ssrn.com/abstract=521722
Davidson, Wallace N., III, Xie, Biao, and Xu, Weihong, “MarketReaction to Voluntary Announcements of Audit CommitteeAppointments: The Effect of Financial Expertise,” 2004.http://papers.ssrn.com/sol3/papers.cfm?abstract_id=562515
DeFond, Mark, Hann, Rebecca N. and Hu, Xuesong, “Does the MarketValue Financial Expertise on Audit Committees of Boards of Directors?”(January 2004). http://ssrn.com/abstract=498822
Farber, David B., “Restoring Trust After Fraud: Does CorporateGovernance Matter?” (January 7, 2004). http://ssrn.com/abstract=485403
33
Focusing More on Outputs andon Markets: What FinancialRegulation Can Learn fromProgress in Other Policy AreasLawrence J. White, PhD
I. Introduction
Despite three decades of “deregulation” and “regulatory reform” in theU.S., financial regulation — the regulation of banks and other depositoryinstitutions,1 of insurance companies, of pension funds, of securities andother financial instruments, of the markets in which these instrumentstrade, and of corporate disclosure and governance — continues to cut awide swath through the U.S. economy.2 This persistence and pervasivenessis understandable, if not always excusable, because financial institutionsand processes are often complex and difficult to understand by the partiesthat rely on them.
About the Author
Lawrence J. White is Arthur E.Imperatore Professor of Economics at New York University’s Stern Schoolof Business and Deputy Chair of theEconomics Department at Stern.During 1986-1989 he was on leaveto serve as Board Member, FederalHome Loan Bank Board, and during1982-1983 he was on leave to serveas Director of the Economic PolicyOffice, Antitrust Division, U.S.Department of Justice. He is currently the General Editor of theReview of Industrial Organization.
Prof. White received a BA fromHarvard University (1964), an MSc from the London School ofEconomics (1965), and a PhD fromHarvard University (1969). He is theauthor of The Automobile IndustrySince 1945 (1971); IndustrialConcentration and Economic Power in Pakistan (1974); ReformingRegulation: Processes and Problems(1981); The Regulation of AirPollutant Emissions from MotorVehicles (1982); The Public Library in the 1980s: The Problems of Choice(1983); International Trade in OceanShipping Services: The U.S. and theWorld (1988); The S&L Debacle:Public Policy Lessons for Bank and Thrift Regulation (1991).
Prof. White’s webpage is found athttp://pages.stern.nyu.edu/~lwhite/.His e-mail address [email protected].
1 Unless otherwise indicated, references to “banks” in this paper will refer generally toall depositories and thus will include savings institutions and credit unions, as well ascommercial banks.
2 The recognition of this persistence and pervasiveness is not meant to belittle the regu-latory progress that has been made. There is no question that the removal of interestrate ceilings on most bank deposits, the lifting of most restrictions on the branching ofbanks, the lifting of the restrictions on banks’ securities and insurance activities (andvice-versa), the instituting of “prompt corrective action” for faltering banks, etc., wereworthwhile achievements. The point of this paper, however, is that financial regulationshould look more broadly for better ways of setting and achieving regulatory goals.
34
Regardless of the reasons for regulation, however, public policy shouldalways be looking for opportunities to make regulation more efficientand effective. In this regard, financial regulation and financial regulators(and policy makers) have much to learn from progress in other regulatorypolicy areas. Though the hold of “command-and-control” regulationremains a powerful force across the regulatory spectrum, there arenoticeable signs of progress in a few areas: a movement away from aninputs-oriented process and toward a focus on outputs and a greaterreliance on markets. It is these “outputs and markets” regulatory initiativesthat warrant greater attention by policy makers for financial regulation.
This paper will discuss a few of these initiatives and why they are importantand should serve as role models for change in financial regulation. Bycontrast, concrete examples of “outputs and markets” initiatives in financialregulation are difficult to find — indeed, that’s a major point of this paper— but I will identify two reforms that have been suggested (but havenever been implemented) as illustrations of the directions in which creativefinancial regulation could move.
Sections II and III of this paper will establish a framework and vocabularyfor discussing regulation and provide examples of successful reformsthat are in the “outputs and markets” spirit. Extensive references will bemade to environmental regulation, so as to provide useful references thatilluminate important points. Section IV will return the discussion tofinancial regulation and will draw parallels to the earlier examples.Section V offers a brief conclusion.
II. Classifying Regulation
As a prelude to and guide for the discussion of regulation that follows, itwill be useful to develop a broad classification scheme for the types of reg-ulation that are observed in the U.S. economy. A useful byproduct that canbe distilled from this classification scheme is the realization that there arestrong parallels between financial regulation and other types of regulationand thus that the lessons that are being learned in other regulatory areasmay well have relevance for financial regulation. A second classificationscheme will describe common methods of regulatory implementation.
A. A broad classification scheme for types of regulation.3
At first glance, governmental regulation may appear to be an undiffer-entiated mass of government intervention into the workings of markets.However, it is possible and useful to classify regulation generally intothree broad categories:• Economic regulation: control over firms’ prices, entry, exit, and/or profits;• Health-safety-environment regulation: control over firms’ production
processes, inputs, and/or outputs; and
3 This discussion draws heavily on White (1996a, 1996b).

35
• Information regulation: control over the types and formats of information provided by firms.
Though this categorization is not airtight and there are surely ambiguitiesand fuzzy areas at the boundaries, the framework nevertheless is usefulfor organizing a discussion of regulation and, in the current context, fordrawing the parallels between financial regulation and the other formsof regulation that are found in the U.S. economy. For example, in the category of economic regulation, bank regulators’ former ceilings ondeposit interest rates or limits on entry or on branching were little different from the fare-setting restrictions that were imposed by the former Civil Aeronautics Board (CAB) on the airline industry. In the category of health-safety-environment regulation, bank regulators’ safety-and-soundness requirements that are imposed on banks or theSecurities and Exchange Commission’s (SEC) competency requirementsfor securities brokers are little different from the Federal AviationAdministration’s (FAA) safety requirements that are imposed on the airline industry and its pilots. And in the category of information regulation, the disclosure requirements of the SEC are little different fromthe Department of Transportation’s (DOT) regulation of the fareannouncements of the airline industry.
Though the SEC’s regulation of corporate governance might be thoughtto be outside of this broad categorization, the goal of corporate governanceregulation — assuring investors of a fair outcome — is not all that differentfrom the safety goals of many non-financial regulators, such as the FAAor the Consumer Product Safety Commission (CPSC).
B. Classifying types of regulatory implementation.
At its best, regulation should be aimed at remedying market failures:dealing with market power problems; addressing problems of asymmetricinformation; and/or dealing with externality/spillover phenomena. Ofcourse, as students of regulation well understand, much governmentintervention, even when cloaked in the mantle of addressing market failures, is really about rent seeking by interested parties rather thanabout correcting market failures. Still, even when the political motivesare “pure” and well-intended, the execution of regulatory correctivemeasures may well yield excessively costly outcomes.
“Command-and-control” regulation is a general regulatory mode fordealing with perceived market-failure problems that warrant a policyresponse. Rather than rely on incentives and the power of harnessingindividuals’ self-interest, this is an effort by the regulator to impose centrally devised (macro) solutions at the local (micro) level.
Within the ambit of command-and-control regulation, two types ofintervention are prominent. A common feature is “technology standards,”whereby regulations require that firms adopt specific technologies in
36
order to satisfy the regulatory targets. The second route is that of “performance standards,” whereby the regulations instead specify a performance target and then allow the regulated entities to find their bestways to achieve that target.
The environmental policies of the 1970s provide good illustrations. Thepolitical recognition that air pollution, for example, was a problem thatwarranted correction led to the Clean Air Acts of 1970 and 1977 and thecreation of the Environmental Protection Agency (EPA). The initialinstincts of the engineers and lawyers who set policies for the agencywas to insist on “technology standards” — on specifications of the tech-nologies that individual polluters would have to adopt so as to reducetheir polluting emissions.
In essence, this was a focus on inputs. However, for a focus on inputs tobe efficient, the regulator would have to possess (and be able to dissem-inate and enforce) detailed knowledge of the characteristics of the polluting party and of which technology (and at what levels and qualities)would best allow the polluting party to reduce its emissions at the leastcost. Such knowledge was unlikely to be in the hands of the regulator.But in its absence, a “one-size-fits-all” technology standard would likelybe the regulatory choice, with obvious costs of a poor fit for many of theregulated entities.
A different approach was being suggested at the time: “performancestandards.” In essence, instead of monitoring inputs and input choices,the regulator would monitor output. If, say, the goal of public policy wasto reduce ambient levels of sulfur dioxide (SO2), the inputs-oriented technology-standards approach would specify the details of the type ofequipment that electric utilities and other emitters of SO2 would berequired to install and maintain for each source of emissions. By contrast, a performance-standards approach would specify the quantityof S02 that each emissions source would be allowed to emit — perhapsexpressed as an emissions rate — and then leave it to the polluting partyto figure out the least costly way to meet that standard.
One can understand the regulatory and political preference for the tech-nology-standard/inputs-control approach. It provides the appearance ofa direct assault on the problem, which satisfies political concerns. Itoffers a direct technological prescription. Further, inputs are often easierfor regulators to measure and monitor. Finally, interested parties may beable to exert political influence that favor the specific inputs that theyproduce.4 But it is clear that such an approach is insensitive to costs and,as a consequence, can (and is likely to) be inflexible and costly. At leastin partial recognition of the inflexibility and the cost insensitivity, in the
4 See, for example, Ackerman and Hassler (1981) for a discussion of the costliness ofthe political compromises embodied in the standards of the Clean Air Act of 1977that, in essence, specified electric utilities’ uses of particular types of coal as themeans for reducing SO2 emissions.
37
environmental area technology standards often gave way to performancestandards, as policy makers recognized the superiority of performancestandards.
Even performance standards, however, are relatively inflexible, sincethey usually are insensitive to the relative ease or difficulty (or costliness)with which particular pollutant sources or technologies can meet thespecified standards.
A third step in the evolution of regulatory standards was a “bubble” concept.In most instances, a performance standard would specify a positive levelof emissions rather than zero. Consequently, if a company had multipleemission (e.g., SO2 sources within a compact region — e.g., an “airshed”),then what would matter (from an environmental perspective) waswhether the aggregate of emissions from all of those sources met thestandard and not whether the emissions from any individual source metthe standard. In essence, one could imagine that all of the emissionsources were merged under a glass or plastic bubble, and the regulatoryconstraint should apply only to the aggregate emissions (or emissionrate) that emerged from the bubble. This would allow the emitter a fur-ther degree of flexibility and of cost reduction: the emitter could meetthe overall standards by reducing emissions to a greater extent at thosesources for which reductions could be achieved at relatively low marginalcosts while reducing less at those sources with relatively high marginalcosts of reductions.
These three forms of regulatory controls are currently applied simultane-ously in the three important dimensions of regulatory policy that pertainto motor vehicles: safety regulation, pollution control regulation, andfuel economy regulation. In the area of safety regulation, there is a mixtureof technology standards and performance standards: particular types ofdevices – e.g., airbags, dual braking systems, padded dashboard andvisors, impact-absorbing steering wheels and columns, impact-absorbingbumpers, etc. – are specified per vehicle, although performance standardsgovern exactly what levels of protection the devices must achieve. In theair pollution area, performance standards prevail: maximum exhaustemission rates for pollutants per vehicle (per mile) are specified. In thefuel economy area, fuel economy standards (miles per gallon) are specifiedbut at the manufacturer-average level (the so-called “corporate averagefuel economy,” or CAFE standard) for automobiles and (separately) fortrucks, which allows a motor vehicle manufacturer to meet the standardby averaging across its (sales-weighted) vehicle sales.5 A further stepbeyond the bubble (or CAFE) approach is to allow companies to tradetheir requirements among themselves. The next section will discuss threeimportant regulatory examples.
5 In addition, the CAFE standards have an extra element of flexibility by allowing alimited amount of carry-forward, carry-back allowances across calendar years.
38
III. Going Beyond “Command-and-Control”: Embracing“Outputs and Markets”
The limits of command-and-control regulation, even with the greaterflexibility of performance standards and of “bubble” possibilities, areclear. There is still too much inflexibility, too much of an insistence onone-size-fits-all. However, just as the bubble approach would allow anindividual emitter to gain greater flexibility and efficiency (and lowercosts) by adjusting emissions across sources, a group of emitters couldsimilarly achieve greater flexibility and lower costs among themselves:the parties with the lower marginal costs of emissions reductions wouldbe able to trade (in return for a monetary payment) their additionalreductions to other emitters that have higher marginal costs of reductions.The trades establish a market price for reductions and provide the oppor-tunity costs that emitters can use to decide whether they should devoteeffort to reducing emissions below the standard (and thus be sellers oftheir “excess” reductions) or whether such efforts are not worthwhile andthose emitters should be buyers. Equivalently, if one thinks of the allowableemissions under the standard as embodying permits, then the low-costreducers would be selling permits and the high-cost reducers would bebuying permits. The aggregate amount of emissions is unchanged, butthe aggregate amount of costs associated with the reductions necessaryto meet the standard is further reduced by the opportunity for tradingacross firms.6
This important additional flexibility has been added to three noteworthyregulatory programs, which will be discussed below: (a) the “cap-and-trade” system for controlling SO2 (“acid rain”) emissions from electricutilities; (b) the use of auctions for allocating uses of the electromagneticspectrum; and (c) the use of designated access programs to control over-fishing of fisheries.7
A. The “cap-and-trade” program for controlling SO2 emissions
The Clean Air Act of 1990 provided the added flexibility for controllingSO2 (acid rain) emissions by electric utilities.8 An aggregate nationalquota for maximum annual allowable SO2 emissions was established bythe Act (to go into effect in 1995), with individual annual quotas (“caps”)of emission permits (that collectively summed to the national total) thatwere allocated to individual electric utilities based on a fraction of theirhistorical emissions. Electric utilities could emit quantities of SO2 only upto the levels for which they owned permits9 — but they could trade
6 The first major recognition of this possibility is found in Dales (1968).7 The following discussion draws heavily on White (2006b).8 Descriptions of the program can be found, for example, in Joskow et al. (1998),Stavins (1998), Schmalensee et al. (1998), Joskow and Schmalensee (1998), Ellermanet al. (2000), and Raymond (2003, ch. 3). As Hahn (1989) points out, there were earlierinstances, on a smaller scale, of this kind of approach in the environmental area.
9 Enforcement of these limits by the EPA has been quite effective.
39
permits among themselves. This program has been described as “cap-and-trade” and has been considered to be highly successful as a way of achievingsizable SO2 emissions reductions at costs that were substantially below thelevels that had been forecast prior to the enactment of the Act.10
Notice how far environmental policy – at least in the area of SO2 emissions– has come. Rather than the inputs-oriented technology standards thatwere often favored three decades ago, the cap-and-trade approach focuseson an “output” target – allowing no more than a specified aggregateannual amount of SO2 emissions (permits) – and allows trades amongemitters that create a market in the permits and that thus allow efficientreallocations of emission-reduction efforts among emitters, as well asproviding a greater incentive for emitters to discover low-cost ways ofreducing emissions.11
B. Spectrum auctions12
Prior to the 1990s, federal policy with respect to the allocation of theelectromagnetic spectrum for broadcasting and communications purposescould be easily classified: It was clearly a “technology standards” versionof “command-and-control” regulation. The regulatory problem was thatof dealing with “interference”: one party’s broadcast transmissions willinterfere with a second party’s transmissions, if the two are at the sameplace, time, and frequency band. From the mid 1920s onward, federalregulatory policy for dealing with interference involved the designationof specific broadcast locations, specific frequency bands, specific powerlimits, specific uses for the broadcast transmissions (e.g., radio, TV, tele-phone, satellite, etc.), and the specific holder of a license who could use thespectrum at that location and frequency band for that specified purpose.
Prior to the 1980s, where there were competing candidates for a specificlicense, the Federal Communications Commission (FCC) would hold com-parative hearings (which became known as “beauty contests”) to determinewhich candidate was best suited for the specific use designated by thatlicense. This beauty contest format collapsed in the early 1980s when theFCC was swamped with applications for the burgeoning business of providing cellular telephone service. The Congress passed legislation thatinstead allowed lotteries among pre-qualified applicants. The subsequentlarge windfalls that transpired when lottery winners were bought out byother companies provoked a political reaction, which led (along withCongress’s desire to increase budgetary revenues) in 1993 to legislationthat authorized the FCC to design and conduct auctions for cellular telephone spectrum and similar frequency bands.
The spectrum auctions, which began in 1994 and have continued to thepresent, have raised tens of billions of dollars for the U.S. Treasury while
10 See, especially, the discussion in Ellerman et al. (2000).11 On this latter point, see, for example, Downing and White (1986).12 This section draws heavily on White (2001).

40
allowing the purchasers/users substantially greater flexibility in use andtechnology than has been true for the traditional command-and-controlspectrum license. The spectrum auction system – which (like the SO2 permits)involves a greater focus on outputs (getting the spectrum into the handsof those who place the highest value on it) and on markets – is consid-ered a highly successful innovation in the way that spectrum is allocated.13
C. Dedicated-access-privilege programs for overfished fisheries14
As fishing technologies have improved (better boats and engines, betternets and tackle, etc.), the threat – and reality – of overfishing of open-oceanfish stocks by commercial fishing fleets has grown. As of 2005, theNational Marine Fisheries Service (NMFS) reported that, of the 251 fishstocks whose status could be ascertained by the NMFS, 73 (29%) wereoverfished, subject to overfishing, and/or approaching an overfishedcondition.15 These stocks include such well known fish categories as cod,haddock, flounder, hake, sea scallop, monkfish, red snapper, grouper,black sea bass, conch, yellowfin tuna, marlin, sailfish, and albacore.
With overfishing, the stock of available fish declines because too few fishremain for replenishment. Perhaps the most dramatic is the story of theU.S. Atlantic cod fishery. The cod fishery catch peaked in 1980 at 118million pounds but then declined severely. In 2004 the cod catch wasonly 16 million pounds, less than 14% of its peak level 24 years earlier.
Where fisheries are recognized to be overfished, the NMFS has often triedto restrict the size of the catch (so as to allow replenishment) by settinga target limit for the annual catch and then trying to meet this target byinstituting restrictions on fishermen’s use of inputs – the essence of thetechnology standards version of command-and-control regulation.These limitations have included limits on the number of calendar daysduring which a fishery is open for fishing; limits on the type of gear thatcan be used while fishing; limits on the size or type of vessel that can beused in fishing; limits on the number of one-day trips that boats canmake into the fishery; and limits (licenses) on who can do the fishing.
These input limitations – especially the limits on the number of calendardays for fishing – have led to “fishing derbies” or “races for the fish,” inwhich fishermen try feverishly to maximize the amount of fish harvestingthat they can accomplish within the limited time period available tothem.16 Further, where the restrictions have taken the form of limits on
13 Discussions of the auctions can be found, for example, in McMillan (1994), McAfeeand McMillan (1996), Cramton (1997, 1998), and White (2001).
14 This section draws heavily on White (2006b).15 The NMFS issues annual assessments of the state of U.S. fisheries. The
report for 2005 was issued on June 20, 2006 and can be accessed at:http://www.nmfs.noaa.gov/docs/Report_text_FINAL3.pdf.
16 In addition to the sheer inefficiency of such “derbies,” the frenzied pace also increases accidents among fishermen as well as accelerating accidents to and losses of fishing gear and vessels.

41
gear and vessels, fisherman ingenuity and technological improvementshave often foiled and overcome the limiting intent of the restrictions.Together with the frenzied derbies, the result is likely to be an aggregateexceeding of the target catch. Such overages often lead to yet tighterrestrictions.
The “poster child” for this process was the contraction of the Alaska halibut season. From an open season of over 150 days in the early 1970s,the season length shrank to only 47 days by 1977 and then collapsed toan average of only 2-3 days per year between 1980 and 1994.17 Similarly,the collapse of the surf clam fishery in the Mid-Atlantic region caused aprogressive shortening of allowable fishing time until, in 1990, surf clamvessels were permitted to fish only 6 hours every other week.18
At the heart of the overfishing problem is the absence of property rightsin the fish until they are caught. Unlike the standard model for agriculturalproduction – that of the owner-occupier farmer who owns the land, tillsthe soil, cultivates the crops, harvests the crops, and brings them to market– the open-seas model for fishing provides the individual fisherman/harvesterwith no such ownership of the harvesting environment. Instead, the openseas generally provide open access to all on a first-come, first-servedbasis.19 In essence, the open seas are a watery “commons” and thus aresusceptible to “the tragedy of the commons.”20
The recognition of this absence-of-ownership problem has led to a fewregulatory programs in the U.S. (and more abroad) that are an alternativeto the NMFS’s command-and-control limitations on inputs. Instead,these programs – which are variously described as “dedicated-access-privilege” (DAPs) or “individual fishing quotas” (IFQs) – adopt an “output”focus, which is often supplemented by markets. An annual “total allowablecatch” (TAC), which will allow for adequate replenishment, must beestablished by the regulator (in the U.S., the NMFS). Percentage allocationsof the TAC must then be allocated among fishermen in some fashion.Although auctions (following the spectrum example) might seem to be anatural method, they are not used in the U.S. and are rarely used abroad.Instead, following the SO2 model, individual allocations (IFQs) are basedon historical fishing patterns, and/or there is a delegation of the allocationprocess to local groups or communities (who then decide on individualallocations among their members). The IFQ holder then has a quasi property right, which is often transferable (and thus markets are broughtinto the picture).21
There are seven fisheries under federal management in the U.S. that currently
17 See, for example, NRC (1999, pp. 71-72, 304-307), Gates (2005), and Leal (2006).18 See, for example, Wang (1995).19 Even after the U.S. extended its exclusive economic zone (EEZ) to 200 nautical miles in
1976, access to fisheries within the EEZ generally remained open to U.S. fishermen.20 Hardin (1968).21 And, as was true for the SO2 program, enforcement of the IFQ limits is essential.
42
use this “output” (TAC) allocation system for limiting fish harvests.22
In addition, TAC allocation systems are in widespread use in NewZealand and Australia and have been used in some fisheries by Canada,Iceland, the Netherlands, Norway, Greenland, Japan, Chile, Russia, andEstonia. The experiences with these TAC allocation systems have generallybeen favorable.23
IV. Financial Regulation
As was noted in the Introduction, financial regulation covers a broadrange of institutions, instruments, markets, and processes. And acrossthis range, command-and-control regulation continues to be the norm.Often regulations are “technology standards” and input-focused, such asthe requirement that the bonds held by banks cannot be below “investmentgrade” or that short sales of stock can only occur on an “uptick” (or ona zero-plus uptick) or that the CEOs of publicly traded companies mustpersonally attest to the accuracy of their companies’ financial statements.Sometimes the regulations are more like “performance standards,” suchas the minimum capital requirements (as a percent of assets) that banksand other depositories, insurance companies, and broker-dealers mustmeet, where the institutions are given flexibility (e.g., invest in higherquality assets or reduce the size of liabilities) in how they meet therequirements.
One is hard-pressed, however – or, at least, this author is hard pressed –to find examples of financial regulation that would qualify for the “outputs and markets” orientation of the regulatory examples discussedabove. Indeed, I am aware of none.
However, so as to forestall the claim that financial regulation is so different from other kinds of regulation (which it surely is not, as wasargued in Section II) that the “outputs and markets” orientation is simply not relevant, I will offer two past suggestions for changes in specific pieces of financial regulation that would have brought them intothe “outputs and markets” framework.24 It is noteworthy that neither
22 These are the Alaska pollock, Alaska halibut, Alaska sablefish, Alaska king crabs,Pacific whiting, South Atlantic wreckfish, and Atlantic surf clam/ocean quahog fisheries. The Gulf of Mexico red snapper fishery is scheduled to implement an IFQprogram in early 2007. Wyman (2005) identifies three additional fisheries that wereunder international or state management that, as of 2002, were using output allocation systems.
23 The results for the U.S. are reviewed by the NRC (1999, ch. 3 and App. G), and favorable reviews can also be found in Iudicello et al. (1999) and Leal (2000, 2002,2005, 2006). The NRC (1999, ch. 3 and App. G) provides details on the experiences ofNew Zealand (see also Newell et al. (2005)) and Iceland and provides a bibliography onother countries’ experiences.
24 These are the only two proposals of which this author is aware. I welcome suggestionsfor additions to this list or for examples of actual financial regulations in place thatembody the “outputs and markets” orientation.

43
suggestion has been embraced by regulatory policy. The first concerns apiece of bank regulation: the Community Reinvestment Act (CRA) of1977. The second concerns a piece of SEC regulation: the SEC’s little-known regulation of the bond-rating industry since 1975.
A. A “cap-and-trade” system for the CRA25
The Community Reinvestment Act (CRA) of 1977 requires banks26 to “meetthe credit needs of the local communities in which they are chartered consistent with the safe and sound operation of such institutions.”27 TheCRA requires federal bank regulators to assign each bank a CRA rating of“outstanding,” “satisfactory,” “needs to improve,” or “substantial noncom-pliance.” These ratings are based largely on the bank’s record of lending inthe low- and moderate-income neighborhoods within the area in which thebank operates. Although low CRA ratings carry no direct consequence, bankregulators are required to take the ratings into account when a bank or itsholding company applies to charter a new bank, establish a new branch,relocate, or merge with or acquire another bank. Enforcement of the CRAoccurs through “compliance” examination and supervision.
The CRA is clearly in the model of “command-and-control” regulation.The initial mode of enforcement was more focused on bank efforts andwas thus inputs-oriented and in that sense much like a technology standard.In the mid 1990s bank regulators revamped CRA enforcement, so as toemphasize actual volumes of lending and its dispersion; in that sense,regulators were embracing a performance standard.
In 1995 Michael Klausner, a Stanford Law School Professor, proposed a“cap-and-trade” system for banks’ CRA obligations, which was consciouslymodeled on the SO2 cap-and-trade system. Under Klausner’s proposal, abank’s annual CRA quota would be defined specifically – for example, as adollar amount that was a specified percentage of its assets or its deposits –in terms of loans to residents, businesses, and projects in the bank’s low-income neighborhoods that were originated and/or bought and held bythe bank. This obligation could be transferred to other lenders, and thus amarket in these obligations could develop. Banks with higher costs originat-ing and/or holding such loans could seek other lenders (which need not bebanks) with lower costs and pay them to acquire the former’s obligations.The aggregate amount of such lending would be satisfied at lower aggregatecosts than is incurred under the current administration of the CRA.
Klausner’s suggestion has never been implemented.
25 This section draws heavily on Klausner (1995).26 The CRA covers commercial banks and savings institutions, but not credit unions.27 Further discussion of the CRA, including critiques, can be found, for example, in
White (1993, 2000, 2002b), Macey and Miller (1993), and Klausner (1995). It isimportant to note that the CRA is a community-based lending obligation and is independent of the Equal Credit Opportunity Act of 1974, which prohibits discrimination in lending on the basis of race, color, religion, national origin, gender, marital status, or age.
44
B. An “outputs” orientation for the SEC’s regulation of the bond rating industry28
In 1975, the SEC proposed minimum capital (net worth) requirements forbroker-dealers and wanted those capital requirements to be related(inversely) to the quality of the assets held by a broker-dealer. For assessingthe quality of a broker-dealer’s bond assets, the SEC wanted to use theratings issued by leading bond rating firms (such as Moody’s, Standard& Poor’s, and Fitch). In this respect it was following the lead of federalbank regulators, who in the 1930s had begun relying on ratings for judgmentsabout the safety of bonds in banks’ portfolios.29
Whose ratings should the broker-dealers heed? This question had notbeen adequately addressed by the bank regulators, who had made vaguereferences only to “recognized rating manuals” (and apparently everyoneinvolved understood that these references were to Moody’s, S&P, andFitch). But what was to prevent the bogus “XYZ” rating firm from offeringto provide AAA ratings for the bonds of any company that was willingto pay a suitable price to XYZ? And what was to prevent a broker-dealerfrom claiming that the XYZ’s ratings were “recognized”?
To deal with this problem, the SEC created a new regulatory category –“nationally recognized statistical rating organization” (NRSRO) – andimmediately “grandfathered” Moody’s, S&P, and Fitch into the category.Over the next 25 years, between 1975 and 2000, the SEC designated onlyfour additional rating firms as NRSROs, and by 2000 mergers among thenew firms and with Fitch had reduced the number of NRSROs back to theoriginal three.
In essence, though the SEC’s NRSRO designation had dealt with the“whose ratings?” problem, it had now created an artificial regulatoryentry barrier that protected the incumbent NRSROs and that made entryinto the bond rating business more difficult (though not impossible).Since other financial regulators had adopted the SEC’s NRSRO categoryto solve their “whose ratings?” problems, a broad array of regulatedfinancial institutions were now required to heed the ratings of this (literally)handful of “anointed” bond raters when these institutions consideredbuying bonds for their own portfolios; and thus the bond issuers wouldnow focus their attention on the incumbent NRSROs as well.
Compounding this entry barrier was the lack of transparency in the SEC’smethods: the SEC never defined the characteristics of a NRSRO, andapplicants for NRSRO status could only submit a written request andthen wait indefinitely – sometimes for years – for a response from theagency’s staff. Even when the SEC staff did grant NRSRO status to an
28 This section draws heavily on White (2002a, 2002-2003, 2006a, 2006c).29 State insurance regulators had also followed the bank regulators’ lead when
they used bond ratings for the determination of insurance companies’ capital requirements, starting in the 1940s.

45
applicant, it would do so through a “no action” letter, which promisedthat the Division of Market Regulation would not recommend enforcementaction to the full Commission against any broker-dealer that used theapplicant’s ratings for determining its capital requirements. The SEC didn’teven issue a press release at these times (and additionally insisted in theno-action letter that the applicant not market itself as a NRSRO).
In 1997 the SEC proposed a set of criteria for designating a NRSRO.Unfortunately, but not surprisingly, the criteria focused largely on theinput characteristics of a bond rating company (e.g., “adequate staffing,financial resources, and organizational structure…systematic rating procedures…extent of contacts with the managements of issuers...internalprocedures to prevent misuse of nonpublic information…”) – as well asinsisting (as a “Catch 22”) that a bond rating company achieve “nationalrecognition” in order to be designated as a NRSRO. Fortunately, the SECnever finalized these proposed criteria.
In 2001 (as well as 2002 and 2006), this author proposed two differentroutes for NRSRO regulation. The best route would be to abandon theNRSRO category entirely (and have the financial regulators cease theirdelegations of their safety judgments to a handful of bond rating companies30) and thus allow financial markets participants to make theirown judgments as to which ratings by which rating companies could be trusted.
However, this first route was recognized to be a deregulatory pipedream,and a second route was also proposed: the NRSRO designation would beretained, but the SEC would have to cease being an artificial (andopaque) barrier to entry. Instead, the SEC should establish a transparentprocess for judging applicants and reviewing incumbents that uses criteriabased on outputs – a firm’s efficacy in predicting bond defaults – which isthe primary characteristic of ratings about which the financial markets care.
This output orientation for NRSRO regulation has never been actedupon.31
30 Note that this delegation of safety judgments to a handful of bond rating companiesis not the same as the principle of relying on (impersonal) markets that has beenadvocated.
31 In 2005 the SEC again proposed a set of criteria for NRSRO designation; and againthe criteria were focused on inputs. However, in September 2006 new legislation –the Credit Rating Agency Reform Act of 2006 – was enacted that may force the SECto open entry into the NRSRO category but that still focuses on inputs (and that maygive the SEC the opportunity, if it is so inclined, to impose instead a rigid model onthe bond rating business that will favor incumbents and restrict entry). A discussionof this legislation can be found in White (2006c).

46
V. Conclusion
An “outputs and markets” orientation would surely be a worthwhilechange of direction for financial regulation. The examples from outsideof financial regulation discussed above – the SO2 cap-and-trade program,the spectrum auctions, and the fishery designated access programs – providesuccessful role models.
I have described specific suggested changes that could be made in twoimportant pieces of financial regulation that would bring them withinthis “outputs and markets” orientation. There are surely more areas offinancial regulation that could similarly be brought within this framework.I urge regulators and policy makers to think creatively to make suchchanges a reality.

47
References
Ackerman, Bruce A. and William T. Hassler. Clean Air and Dirty Coal.New Haven, Conn.: Yale University Press, 1981.
Cramton, Peter, “The FCC Spectrum Auctions: An Early Assessment,”Journal of Economics and Management Strategy, 6 (Fall 1997), pp. 431-495.
Cramton, Peter, “The Efficiency of the FCC Spectrum Auctions,” Journalof Law & Economics, 41 (October 1998), pp. 727-736.
Dales, J.H., Pollution, Property, and Taxes: An Essay in Policy-Makingand Economics. Toronto: University of Toronto Press, 1968.
Downing, Paul B. and Lawrence J. White, “Innovation in PollutionControl,” Journal of Environmental Economics and Management, 13(March 1986), pp. 18-29.
Gates, John M., “Management of the Pacific Halibut Fishery,” inStephen Cunningham and Tim Bostock, eds., Successful FisheriesManagement: Issues, Case Studies and Perspectives. Delft: EburonAcademic Publishers, 2005, pp. 45-73.
Hahn, Robert W., “Economic Prescriptions for Environmental Problems:How the Patient Followed the Doctor’s Orders,” Journal of EconomicPerspectives, 3 (Spring 1989), pp. 95-114.
Hardin, Garrett, “The Tragedy of the Commons,” Science, 162(December 13, 1968), pp. 1243-1248.
Ellerman, A. Denny, Paul L. Joskow, Richard Schmalensee, Juan-PabloMontero, and Elizabeth M. Bailey, Markets for Clean Air: The U.S. AcidRain Program. New York: Cambridge University Press, 2000.
Iudicello, Suzanne, Michael Weber, and Robert Wieland, Fish, Markets,and Fishermen: The Economics of Overfishing. Washington, D.C.: IslandPress, 1999.
Joskow, Paul L. and Richard Schmalensee, “The Political Economy of Market-Based Environmental Policy: The U.S. Acid Rain Program,”Journal of Law & Economics, 41 (April 1998), pp. 37-83.
Joskow, Paul L., Richard Schmalensee, and Elizabeth E. Bailey, “The Market for Sulfur Dioxide Emissions,” American Economic Review, 88 (September 1998), pp. 669-685.
Klausner, Michael, “Market Failure and Community Reinvestment: A Market-Oriented Alternative to the Community Reinvestment Act,”University of Pennsylvania Law Review, 143 (May 1995), pp. 1561-1593.
Leal, Donald R., Homesteading the Oceans: The Case for Property Rightsin U.S. Fisheries. PERC Policy Series #PS-19, August 2000.
Leal, Donald R., Fencing the Fishery: A Primer on Ending the Race forFish. Bozeman, MT: Political Economy Research Center, 2002.
48
Leal, Donald R., ed., Evolving Property Rights in Marine Fisheries.Lanham, MD: Rowman & Littlefield, 2005.
Leal, Donald R., “Saving Fisheries with Free Markets,” Milken InstituteReview, 8 (First Quarter 2006), pp. 56-66.
Macey, Jonathan R. and Geoffrey P. Miller, “The CommunityReinvestment Act: An Economic Analysis,” Virginia Law Review, 79(March 1993), pp. 291-348.
McAfee, Preston, and John McMillan, “Analyzing the Airwaves Auction,”Journal of Economic Perspectives, 10 (Winter 1996), pp. 159-175.
McMillan, John, “Selling Spectrum Rights,” Journal of EconomicPerspectives, 8 (Summer 1994), pp. 145-162.
National Research Council (NRC), Sharing the Fish: Toward a NationalPolicy on Individual Fishing Quotas. Washington, D.C.: NationalAcademy Press, 1999.
Newell, Richard G., James N. Sanchirico, and Suzi Kerr, “Fishing QuotaMarkets,” Journal of Environmental Economics and Management, 49(May 2005), pp. 437-462.
Raymond, Leigh, Private Rights in Public Resources: Equity andProperty Allocation in Market-Based Environmental Policy.Washington, D.C.: Resources for the Future Press, 2003.
Schmalensee, Richard, Paul L. Joskow, A. Denny Ellerman, Juan-PabloMontero, and Elizabeth M. Bailey, “An Interim Evaluation of SulfurDioxide Emissions Trading,” Journal of Economic Perspectives, 12(Summer 1998), pp. 53-68.
Stavins, Robert N., “What Can We Learn from the Grand PolicyExperiment? Lessons from SO2 Allowance Trading,” Journal ofEconomic Perspectives, 12 (Summer 1998), pp. 69-88.
Wang, Stanley D., “The Surf Clam ITQ Management: An Evaluation,”Marine Resource Economics, 10 (March 1995), pp. 93-98.
White, Lawrence J., “The Community Reinvestment Act: GoodIntentions Headed in the Wrong Direction,” Fordham Urban LawJournal, 20 (Winter 1993), pp. 281-292.
White, Lawrence J., “Competition versus Harmonization: An Overviewof International Regulation of Financial Services,” in Claude Barfield,ed., International Trade in Financial Services. Washington: AmericanEnterprise Institute, 1996a, pp. 5-48.
White, Lawrence J., “International Regulation of Securities Markets:Competition or Harmonization?” in A. Lo (ed.), The IndustrialOrganization and Regulation of Securities Markets, Chicago, Universityof Chicago Press, 1996b, pp. 207-235.
49
White, Lawrence J., “‘Financial Modernization’: What’s in It forCommunities?” New York Law School Journal of Human Rights, 17 (Symposium 2000), pp. 115-128.
White, Lawrence J., “‘Propertyzing’ the Electromagnetic Spectrum: WhyIt’s Important, and How to Begin,” in Jeffrey A. Eisenach and RandolphJ. May, eds., Communications Deregulation and FCC Reform: Finishingthe Job. Boston: Kluwer, 2001, pp. 111-143; reprinted in Media Law &Policy, 9 (Fall 2000), pp. 19-48.
White, Lawrence J., “The Credit Rating Industry: An IndustrialOrganization Analysis,” in Richard M. Levich, Carmen Reinhart, andGiovanni Majnoni, eds., Ratings, Rating Agencies, and the GlobalFinancial System. Boston: Kluwer, 2002a, pp. 41-63.
White, Lawrence J., “Financial Modernization after Gramm-Leach-Bliley: What about Communities?” in Patricia A. McCoy, ed., FinancialModernization after Gramm-Leach-Bliley. Dayton: Lexis Publishing,2002b, pp. 235-256.
White, Lawrence J., “The SEC’s Other Problem,” Regulation, 25 (Winter2002-2003), pp. 38-42.
White, Lawrence J., “Good Intentions Gone Awry: A Policy Analysis ofthe SEC’s Regulation of the Bond Rating Industry,” Policy Brief #2006-PB-05, Networks Financial Institute, Indiana State University, 2006a.
White, Lawrence J., “The Fishery as a Watery Commons: Lessons fromOther Policy Areas for U.S. Fisheries Policy,” Stern School of Business,New York University, Working Paper #EC-06-19, 2006b
White, Lawrence J., “A New Law for the Bond Rating Industry – For Better or For Worse?” Regulation 130 (Spr 2007), pp. 48-52.
Wyman, Katrina M., “From Fur to Fish: Reconsidering the Evolution of Private Property,” New York University Law Review, 80 (April 2005),pp. 117-240.


Networks Financial Institute at Indiana State University was founded in 2003 through a grant from Lilly Endowment Inc. and strives to facilitate broad, collaborative thinking, dialogue and progress in the evolving financial services marketplace through
student programs, financial literacy and thought leadership. NFI is a leader in preparing students for careers in the financial services industry. NFI connects Indiana State’s financial,
business and educational expertise and resources with today’s needs in the financial services marketplace. NFI is a primary source for objective and applied research within the financial services industry.
networksfinancialinstitute.org • 800-603-7113