In-Room Treatment Verification Using Film and CBCT
70
SAM: HDR Brachytherapy: Treatment Verification Methods In-Room Treatment Verification Using Film and CBCT Oana Craciunescu, PhD, DABR Department of Radiation Oncology Duke University Medical Center
Transcript of In-Room Treatment Verification Using Film and CBCT

SAM: HDR Brachytherapy: Treatment Verification Methods
In-Room Treatment Verification Using Film and CBCT
Oana Craciunescu, PhD, DABR
Department of Radiation Oncology
Duke University Medical Center

Role of imaging in modern brachytherapy
• Application insertion
• Planning
• Treatment Verification
• Applicator design
• Facilitate real-time dosimetry
• Dose summation
• Functional imaging
Image-guided brachytherapy (IGBT)

Objectives
• To describe current applications of Film/Fluoro and
CBCT(kV) in brachytherapy, especially as it relates to in-
room treatment verification
• We have time for the “With What” and “For What”, but not
for the “How”

FILM/Fluoro: With what?
• Standard simulator
• Flat panel detector
• (just film) Radiochromic film
• OR-based X-ray unit
• AccuBoost® (mammographic equipment)
• C-arm

FILM/Fluoro: For What?
• LDR/HDR GYN:
– Applicator insertion
– Planning • Orthogonal
• Semi-orthogonal planning with
C-arm with/without jig
– Pre-TX verification
• LDR prostate:
– Needle loading by 3rd party
– Post implant film verification
• HDR breast
– IGBT with AccuBoost
• More recent reported uses:
– Real time HDR TX verification with
modified C-arm fluoroscopy
(2016)
– Pre-TX Catheter verification for
HDR prostate (2017)
– Guidance for free-hand needle
placement in HDR GYN (2017)

FILM: 2D Planning GYN + (Potential
refilming for TX verification)
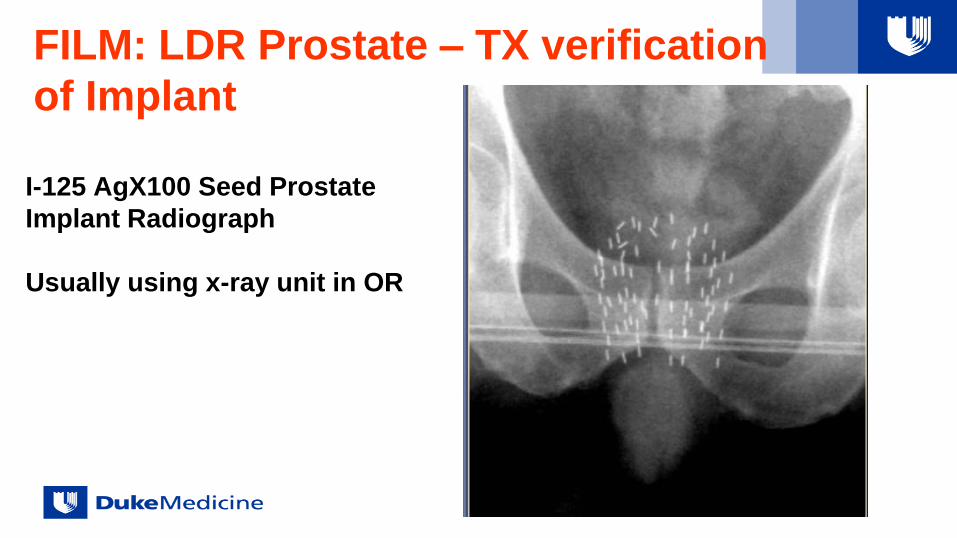
FILM: LDR Prostate – TX verification
of Implant
I-125 AgX100 Seed Prostate
Implant Radiograph
Usually using x-ray unit in OR

FILM: LDR prostate 3rd party loaded
sterile needles + autoradiograph

FILM: HDR Breast Boost (AccuBoost®)
From J Hiatt, Non-invasive Image-guided Breast Brachytherapy, AAPM 2015

FILM: HDR prostate

FILM: HDR GYN
Olsen, Craciunescu, Chino, under review, IJ Contemporary Brachytherapy, 2017
Duke University Medical Center
Free-hand Interstitial Needles

Fluoro: Prostate HDR needle checks

Fluoro: HDR Applications

Fluoro: HDR GYN, C-arm, VIR-method

Fluoro: Real-time HDR TX Verification

kV-CBCT: With what?
• CBCT enabled simulators
• C-arms
• Note: reports of MV-CBCT use in brachytherapy:
– Since MV CBCT images are less affected by high atomic number
materials, such as metal objects, they can complement the
information provided by kV CT(or CBCT) in images with metal-
induced streak artifacts. Deschovich et al. , Brachytherapy,vol. 5, Issue 2, 85-86, 2006

kV-CBCT • Commercially available systems:
– Varian, Acuity - C-arm CBCT
– Nucletron, Simulinx

CBCT: For what?
• GYN (G) & Prostate (P)
– Planning (G, P): alone or with MRI/US
– Applicator/Needle reconstruction and position (G, P)
– Free-hand needle placement (G)
– Gold marker displacement (P)
– Post-plan/seed localization LDR (P)
– C-arm CBCT for QA of LDR (P)
• Breast:
– Multi catheter HDR interstitial
– Balloon-based

CBCT
• Stand alone for planning
• As in-room imaging for applicator placement and pre-TX
verification
• As part of a hybrid method when access to MRI is limited
– Use of MRI at least at 1st FX and identify HRCTV/IRCTV
– Continue subsequent fractions with CT or CBCT

Duke Brachy Suite BrachySuite Console
• CBCT Console
+ Access to 3.0 T MRI in Rad Onc on same hallway
CBCT
Console

Advantages of a CBCT in Brachy Suite
• Intra-operative imaging
• Large mechanical clearance (scan in stirrups, make adjustments)
• Can be easily combined with other imaging modalities
– Primary, secondary (US, MRI)
• Minimize applicator/needles motion
– Limiting the patient’s motion is expected to limit post insertion applicator
motion, which in return leads to more accurate planning.
• Good for applicator delineation
• Ability to image and verify before treatment
• Can scan, plan and treat under anesthesia

Image Quality vs. Patient Size
Technique: 150 SID, kVp = 120 , mA = 80, ms = 13
Large patients attenuate more, resulting in detection of fewer photons (increased noise,
reduced signal, increased HU discrepancy, ie computer mistakes a thick absorber for
high density material)
AP = 17 cm AP = 25 cm AP = 31 cm AP = 35 cm

CBCT vs CT (Female pelvis, small size)

CT vs. CB contours

CBCT vs. CT (breast)
Courtesy of Dorin Todor, VCU

CBCT Prostate

GYN

GYN: CBCT-based planning Opt imag
protocol

GYN Interstitial

GYN: CBCT-based planning

GYN: CBCT-based Planning

OAR: Good agreement with MRI (small patient size,
good quality CBCT)

OAR: Poor agreement with MRI Craciunescu et. Al, Brachytherapy, vol. 15, S137-138, 2016

CBCT: GYN, Free-hand Needle Placement Guidance
Duke University Brachytherapy

CBCT: GYN, Free-hand Needle, Planning
CBCT: Needles reconstruction
MRI: HRCTV + normal tissue

Prostate


VCU setup, HDR Prostate
Courtesy of Dorin Todor, VCU

C-arm CBCT for LDR
prostate on-line verification

Post-Operative Seed Localization
Intra-Operative
Seed Localization

Conclusions
• X-ray films/Fluoro and kV-CBCT (Simulators, C-arms)
have a role in “in-room” pre/post TX verification for several
brachytherapy applications
• Thorough understanding of advantages and limitations is
needed before using as sole imaging procedure for in-
room treatment verification and/or planning

“Indeed, we often mark our progress in science by
improvements in imaging.”
Martin Chalfie
Next CT and MRI in room TX Verification

Thank you!

compared for HDR and LDR cases for structures used in planning for both
approaches. Target V200, V150, V100, V95, D90, rectum V100, rectum
D2cc, and rectum D1cc were compared between LDR and HDR patients.
Due to HDR plans being nested within patients, significance (p) was
determined using a linear mixed effects model with random intercepts for
each patient. P!0.05 was considered statistically significant.
Results: The study cohort consisted of 112 patients treated from 2012-2016.
51 patients received LDR, 61 patients received HDR (100 total implants). 23
patients had brachytherapy as a boost. 91 (81.2%) had cT1a-c disease, and
21 (18.8%) had cT2a-c disease. Gleason score 6, 7, and 8-10 were present in
52 (46.4%), 52 (46.4%), and 8 (7.2%) patients. 41 (36.6%) and 57 (50.9) had
low and intermediate risk disease, respectively. Median pre-treatment PSA
was 6.43 (interquartile range [IQR] 4.93-9.29). As described in the table,
patients receiving HDR had lower target V200, V150, V100, and V95,
while there was no difference in D90. Rectum D2cc was similar between
LDR and HDR, but rectum D1cc was lower in the HDR group. Rectum
V100 was zero for all patients with HDR, and higher for LDR.
Conclusions: In our series of patients treated by the same brachytherapists,
patients receiving HDR brachytherapy had lower V150 and V200 within the
target, and lower rectal doses compared to our LDR patients. Target
coverage was also better in the HDR patients, although D90’s were similar.
PO127
Twice vs Single Applications in High Dose Rate
Brachytherapy (HDR) Boost. Same Results in High
Risk Prostate Cancer Patients?
Silvia Rodriguez Villalba, PhD, MD, Antonio Otal Palacin, PhD, Jose
Richart Sancho, MPh, Jose Perez-Calatayud, MPh, Manuel Santos Ortega,
PhD, MD, Carolina Domingo, PhD, MD. Radiation Oncology, Hospital
Clinica Benidorm, Benidorm, Spain.
Purpose: HDR brachytherapy (BT) boost is utilized for dose escalation in
the treatment of clinically localized high risk prostate cancer. We report two
different regimens, 2 aplications of 9,5 Gy related to one aplication of 15 Gy
as a boost to external beam radiotherapy (EBRT) in a large cohort of patients
treated in a single institution.
Materials and Methods: We reviewed retrospectively data of 95 patients
treated for clinically localized prostate cancer, High risk patients
(D’Amico classifications) with curative intent between August 2009 and
December 2015. All patients received either IMRT pelvic radiotherapy
(Median 50,4 Gy ) in combination with a HDR in two regimens: 2
fractions of 9,5 Gy (69 patients. 73%) separated one week before May of
2014 or a single fraction of 15 Gy (26 patients. 27%) after these
date.Treatment was delivered using an out-patient intraoperative
ultrasound-based technique with the patient under spinal anesthesia and
sedation. BT boost was administrated 3-4 weeks after finishing EBRT
according our protocol in all the patients.
Results: Median age 59 years (51-82 y). Median Gleason 7 (3-10) and
median value of PSA at diagnosis 11 ng/ml (2, 26-106 ng/ ml). Fifty
patients (16%) were diabetic, 49 (52%) high blood pressure and 16 (17%)
were under an anticoagulant treatment. Eighty five patients (95%) were
staged with a magnetic resonance (MRI). Ninety four patients (99%)
received androgen deprivation (AD) and 29 (31%) as neoadjuvant
treatment. Median AD was 24 months (5-24 m). All patients had a
personally follow-up. Follow-up assessment was with CTCAE v.4 and
blood test with PSA at 12 weeks, every 4 months for the first year and
then every 6 months. After 5 years of follow up, it is done once a year.
Median follow-up is 39 months (8-83 m). At December of 2016, 83
patients (87%) are alive without disease, 2 (2%) have died of tumor and
10 patients (11%) have died of other causes. Overall survival at 12, 24
and 60 months are 99, 96 and 96% % respectively for the patients treated
with 2 fractions and 100 % at 12 and 24 months for patients treated with
a single fraction without statistical significance (p NS). Biochemical
control is 100% in both groups. Local control is 100% in both groups,
lymph node control is 99% (one retroperitoneal recurrence in a patient
treated with 2 fractions) and 4 patients have bone metastases (all patients
treated with 2 fractions regimen) without statistical significance (p NS).
There is not acute genitourinary (GU) or gastrointestinal (GI) toxicity
grade 3. One patient (1%) needed a transurethral resection because
chronic obstruction and another surgical treatment of urethral stenosis.
Five patients (5%) developed rectitis grade 3 (3 treated with 2 fractions of
9,5 Gy and one patient treated with 1 fraction of 15 Gy) in a median time
of 8 months (3-29 m). All of them were solved with Argon laser. There
are not difference in adverse grade 3 rectal events between both groups
(p 5 NS). Due to the low number of other toxicities reported in follow-
up, multivariate analysis was not done.
Conclusions: Prostate HDR boost delivered in a single 15 Gy treatment
fraction compares favorably in terms of toxicity to 2 fractions of 9.5 Gy,
one week apart. Longer follow-up is needed to compare clinical results in
terms of overall survival and local control.
PO128
Clinical Application of Pre-Treatment Image
Verification of Catheter Positions for HDR Prostate
Brachytherapy
Ryan L. Smith, MAppSc1, Annette Haworth, PhD
2, Max Hanlon, BSc
3,
Bronwyn Matheson, MD1, Jeremy Millar, MD1, Vanessa Panettieri, PhD1,
Rick Franich, PhD3. 1Alfred Health Radiation Oncology, The Alfred
Hospital, Melbourne, Australia;2School of Physics, University of Sydney,
Sydney, Australia;3School of Science, RMIT University, Melbourne,
Australia.
Purpose: Swelling of the prostate and perineum occurs and over the time
period between imaging (for treatment planning) and treatment delivery,
causing the catheter positions (and hence displaced planned source dwell
positions) to potentially shift relative to the anatomy. Displaced catheter
positions unaccounted for at treatment can produce a perturbed dose
distribution relative to the prostate and surrounding organs at risk. Re-
imaging the patient, ideally in the treatment bunker, prior to treatment
delivery is desirable in order to verify the position of the catheters relative
to the surrounding anatomy. We have established a pre-treatment imaging
approach using our Brachytherapy Image Guided Verification (BIGV)
system. Pre-treatment image verification of the catheter positions are
performed in the treatment bunker and compared directly to the treatment
planning system. In this work we present the clinical results for 14 HDR
prostate patients, where pre-treatment verification was performed on
images acquired immediately prior to treatment delivery.
Materials and Methods: Pre-treatment imaging was performed for 28
treatment fractions, (2 fractions per patient) with the positions of the
implanted catheters at each treatment fraction verified using the BIGV
system. This system which consists of a flat panel detector (FPD)
embedded into the brachytherapy treatment couch and a ceiling suspended
x-ray device. The patient was setup on the treatment couch and aligned
above the sensitive region of the FPD. Radio-opaque x-ray markers were
inserted into the plastic proguide catheters in order to verify the positions
relative to previously implanted gold prostate fiducial markers. The ceiling
suspended x-ray system was positioned above the patient and an anterior-
posterior (A-P) x-ray image was acquired with the FPD. The gold prostate
fiducial markers were identified and registered with the markers identified
in the treatment plan. A comparison of planned and measured catheter
positions was then performed relative to the prostate. Catheter tip positions
were compared and the agreement of the catheter path through the prostate
region was evaluated for all catheters with inserted x-ray markers.
Observed catheter displacements at treatment were re-created on the
treatment plan to assess any dosimetric impact.
Results: The average registration uncertainty between the A-P image and the
TPS for the gold fiducial markers was 0.9 mm (s.d.0.4mm,max 1.7mm). The
S114 Abstracts / Brachytherapy 16 (2017) S14eS118

largest catheter displacement was observed for fraction 1 with an average
catheter tip displacement in the inferior direction of 10.8 mm. The average
inferior catheter tip displacement for fraction 2 was 1.5 mm (s.d. 0.9 mm,
max. 3.3 mm). The catheter paths through the prostate region agreed to
within 2mm, as shown in figure 1 (blue planned, red measured catheter
paths), suggesting minimal lateral displacement of the catheter positions.
Conclusions: Pre-treatment imaging has been performed to verify catheter
positions, with the patient in the treatment position, immediately prior to
treatment delivery. The measured catheter displacements observed for
fraction 1 were on average greater than fraction 2, and suggests the rate
of perineum swelling is important and may result in a deviated dose
distribution. The BIGV system which enables direct comparison of
planned catheter positions with measured positions, immediately prior to
treatment, permit the introduction of adaptive planning techniques in
HDR prostate brachytherapy.
PO129
Focal Radiosensitization of Brachytherapy:
Determining the Optimal Design of Drug Eluting
Implants
Christian V. Guthier, Ph.D.1, Anthony V. D’Amico, M.D., Ph.D.
1,
Martin T. King, M.D., Ph.D.1, Paul L. Nguyen, M.D.1,
Peter F. Orio, M.D.1, Srinivas Sridhar, Ph.D.1,2,
G. Mike Makrigiorgos, Ph.D.1, Robert A. Cormack, Ph.D.
1 1Department of
Radiation Oncology, Brigham and Women’s Hospital and Dana-Farber
Cancer Institute, Boston, MA, USA; 2Department of Physics, Nanomedicine
Science and Technology Center, Northeastern University, Boston, MA, USA.
Purpose: In-situ drug release concurrent with radiation therapy has been
proposed as a means to enhance the therapeutic ratio of permanent
prostate brachytherapy. Both brachytherapy sources and brachytherapy
spacers have been proposed as potential eluters to release drugs directly
into the prostate. This work models the biologic effect of implantable
eluters of radio-sensitizer in conjunction with brachytherapy to determine
which of the proposed methods is the preferred delivery approach.
Materials and Methods: The combined effect of implanted drug eluters
and radioactive sources were modeled in a manner that allowed selection
of eluter location to optimize biologic effect for a range of model
parameters. The retrospective study includes 20 patients previously
treated with LDR brachytherapy from which prostate geometries, source
and spacer positions were extracted. The biological effect of drug
concentrations was calculated by using the steady state solution to the
diffusion equation including an elimination term characterized by the
diffusion-elimination modulus (4b). Radiosensitization was assumed to be
dependent on drug concentration up to a saturation concentration (csat).
For a given number of eluters (ne) the clinical objective was to find the
best possible configuration of eluters, for a given drug delivery vehicle
that maximizes the biological effect.
Results: The biologic effect was calculated for prostate volumes from 11
cm3 to 64cm3, 4b from 0.01 mm-1 to 1 mm-1, csat from 0.05 to 8.0 times
the steady state drug concentration released from the surface of the eluter
and ne from 10 to minimum number of either number of used spacers or
seeds. For the parameter space of (4b,csat)5([0.01, 0.25],[0.05, 4]) that
results in a large fraction of the gland being maximally sensitized,
drug eluting spacers or sources produce equal increase in biologic
effect. For the remaining (4b,csat)-space eluting spacers are preferable.
Placing drug eluting implants in planned locations throughout the
prostate results in even greater sensitization than using only source or
spacer locations .
Conclusions: Drug eluting brachytherapy spacers offer a means to increase
the biologic effect of brachytherapy implants with no change in treatment
process. Incorporating additional needle placements to allow the freedom
to place spacers independently of source placement offers a means to
increase the therapeutic ratio with relatively minor modifications of the
implant process.
PO130
Single Fraction High Dose Rate Brachytherapy as
Monotherapy in Intermediate Risk Prostate Cancer:
Early Clinical Outcomes
Raghavendra Gowda, FRANZCR, Jehan Titus, FRACS,
Eric Yeoh, FRANZCR, John Lawson, M Sc CMPS, Evangelos Katsilis,
B Med.Rad (RT). Royal Adelaide Hospital, Adelaide, Australia.
Purpose: To report early urinary (GU), gastrointestinal (GI) adverse events
(AEs) and PSA outcomes after single fraction high dose rate brachytherapy
as monotherapy (HDR-M) for intermediate risk (NCCN risk category)
prostate cancer using real-time trans-rectal ultrasound (TRUS) based
planning.
Materials and Methods: Between April 2015 and September 2016, a total
of 40 consecutive patients with intermediate risk prostate cancer were
treated with a single fraction of 19 Gy (n510) or 20 Gy (n530) HDR-
M. None received hormone therapy Real time US based planning
technique was used. Genito-urinary (GU) and gastro-intestinal (GI)
toxicity were assessed using the International Prostate Symptom Score
scale (IPSS) and RTOG scales (GI/GU) scales. Biochemical relapse was
defined according to the Phoenix Consensus definition (PSA nadir þ
2mg/L).
Results: Median age was 69y (range, 51y-84y) and median follow up was
9 months (range, 3-22 months). All patients tolerated the procedure well
with no intraoperative or perioperative complications. No patient
developed urinary retention. Five (12.5%) patients developed Grade 2
urinary toxicity which returned to baseline by 3 months. There was no
O Grade3 urinary toxicity (including urinary strictures). Median IPSS at
baseline was 6 , increased to 9 at 1month , returning to 6 at 3months.
No patient developed any Grade of GI toxicity. After a median follow
up of 9 months there were no biochemical failures. Cumulative
percentage of patients with PSA ! 1 ml at 6 months was 30% with
PSAs continuing to fall in all patients as of last follow up. Median
percentage PSA fall at 1, 3, and 6 months was 47%, 70% and 79%
respectively compared to iPSA.
Conclusions: This is the first report of the use of single fraction HDR
brachytherapy as monotherapy in prostate cancer from Australia. This
treatment is well tolerated with early results showing low GU/ GI adverse
events and good early PSA outcomes. Longer follow up is needed to
assess long-term outcomes and toxicities.
S115Abstracts / Brachytherapy 16 (2017) S14eS118
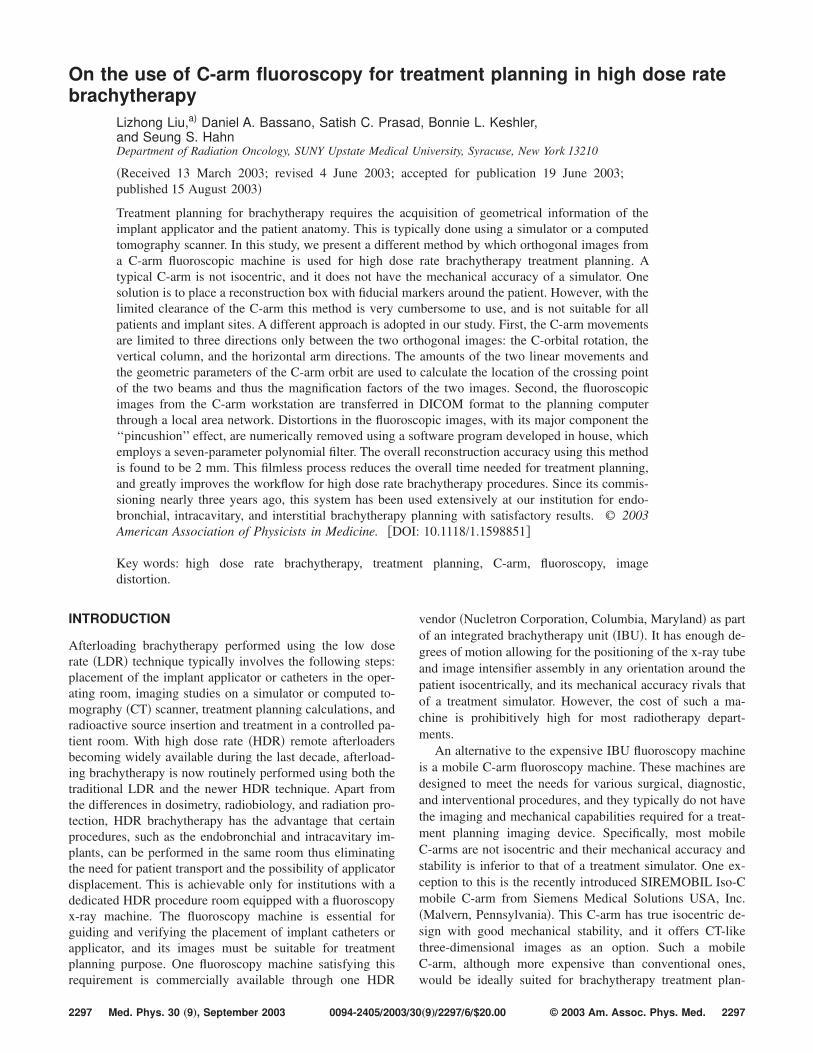
On the use of C-arm fluoroscopy for treatment planning in high dose ratebrachytherapy
Lizhong Liu,a) Daniel A. Bassano, Satish C. Prasad, Bonnie L. Keshler,and Seung S. HahnDepartment of Radiation Oncology, SUNY Upstate Medical University, Syracuse, New York 13210
~Received 13 March 2003; revised 4 June 2003; accepted for publication 19 June 2003;
published 15 August 2003!
Treatment planning for brachytherapy requires the acquisition of geometrical information of the
implant applicator and the patient anatomy. This is typically done using a simulator or a computed
tomography scanner. In this study, we present a different method by which orthogonal images from
a C-arm fluoroscopic machine is used for high dose rate brachytherapy treatment planning. A
typical C-arm is not isocentric, and it does not have the mechanical accuracy of a simulator. One
solution is to place a reconstruction box with fiducial markers around the patient. However, with the
limited clearance of the C-arm this method is very cumbersome to use, and is not suitable for all
patients and implant sites. A different approach is adopted in our study. First, the C-arm movements
are limited to three directions only between the two orthogonal images: the C-orbital rotation, the
vertical column, and the horizontal arm directions. The amounts of the two linear movements and
the geometric parameters of the C-arm orbit are used to calculate the location of the crossing point
of the two beams and thus the magnification factors of the two images. Second, the fluoroscopic
images from the C-arm workstation are transferred in DICOM format to the planning computer
through a local area network. Distortions in the fluoroscopic images, with its major component the
‘‘pincushion’’ effect, are numerically removed using a software program developed in house, which
employs a seven-parameter polynomial filter. The overall reconstruction accuracy using this method
is found to be 2 mm. This filmless process reduces the overall time needed for treatment planning,
and greatly improves the workflow for high dose rate brachytherapy procedures. Since its commis-
sioning nearly three years ago, this system has been used extensively at our institution for endo-
bronchial, intracavitary, and interstitial brachytherapy planning with satisfactory results. © 2003
American Association of Physicists in Medicine. @DOI: 10.1118/1.1598851#
Key words: high dose rate brachytherapy, treatment planning, C-arm, fluoroscopy, image
distortion.
INTRODUCTION
Afterloading brachytherapy performed using the low dose
rate ~LDR! technique typically involves the following steps:
placement of the implant applicator or catheters in the oper-
ating room, imaging studies on a simulator or computed to-
mography ~CT! scanner, treatment planning calculations, and
radioactive source insertion and treatment in a controlled pa-
tient room. With high dose rate ~HDR! remote afterloaders
becoming widely available during the last decade, afterload-
ing brachytherapy is now routinely performed using both the
traditional LDR and the newer HDR technique. Apart from
the differences in dosimetry, radiobiology, and radiation pro-
tection, HDR brachytherapy has the advantage that certain
procedures, such as the endobronchial and intracavitary im-
plants, can be performed in the same room thus eliminating
the need for patient transport and the possibility of applicator
displacement. This is achievable only for institutions with a
dedicated HDR procedure room equipped with a fluoroscopy
x-ray machine. The fluoroscopy machine is essential for
guiding and verifying the placement of implant catheters or
applicator, and its images must be suitable for treatment
planning purpose. One fluoroscopy machine satisfying this
requirement is commercially available through one HDR
vendor ~Nucletron Corporation, Columbia, Maryland! as part
of an integrated brachytherapy unit ~IBU!. It has enough de-
grees of motion allowing for the positioning of the x-ray tube
and image intensifier assembly in any orientation around the
patient isocentrically, and its mechanical accuracy rivals that
of a treatment simulator. However, the cost of such a ma-
chine is prohibitively high for most radiotherapy depart-
ments.
An alternative to the expensive IBU fluoroscopy machine
is a mobile C-arm fluoroscopy machine. These machines are
designed to meet the needs for various surgical, diagnostic,
and interventional procedures, and they typically do not have
the imaging and mechanical capabilities required for a treat-
ment planning imaging device. Specifically, most mobile
C-arms are not isocentric and their mechanical accuracy and
stability is inferior to that of a treatment simulator. One ex-
ception to this is the recently introduced SIREMOBIL Iso-C
mobile C-arm from Siemens Medical Solutions USA, Inc.
~Malvern, Pennsylvania!. This C-arm has true isocentric de-
sign with good mechanical stability, and it offers CT-like
three-dimensional images as an option. Such a mobile
C-arm, although more expensive than conventional ones,
would be ideally suited for brachytherapy treatment plan-
2297 2297Med. Phys. 30 „9…, September 2003 0094-2405Õ2003Õ30„9…Õ2297Õ6Õ$20.00 © 2003 Am. Assoc. Phys. Med.

ning. However, most mobile C-arms in clinical use today are
the conventional nonisocentric type. In addition to the me-
chanical capabilities, fluoroscopy images from C-arms are
distorted due to photocathode curvature and electron optics
of the image intensifier,1–3 and unlike some C-arms specifi-
cally designed for quantitative imaging such as digitally sub-
tracted angiography the distortions in a mobile C-arm fluo-
roscopy system are typically not digitally corrected by the
vendors. One solution to the nonisocentricity and mechanical
accuracy issues facing a mobile C-arm is to place a recon-
struction box with fiducial markers around the patient. We
purchased such a reconstruction box from our HDR machine
vendor ~Varian Medical Systems, Inc., Palo Alto, California!and experimented with the box technique during the com-
missioning stage for our HDR treatment system. We soon
realized that clearance was an issue with the C-arm and that
the reconstruction box technique was not suitable for the
localization of applicators for different patient sizes and im-
plant sites. Another investigator4 has reached the same con-
clusion with box from a different manufacturer. The classical
solution of using a magnification ring placed on the patient
skin while taking images is simply not accurate enough for
brachytherapy treatment planning. It has been suggested4
that a ruler with markers can be placed inside the patient near
the implant site for obtaining magnification factors. This
might work for well-selected cases such as a pelvic implant
with ruler inserted in the rectum, but is in general not fea-
sible for other implant sites.
In this study we present a new approach for utilizing the
mobile C-arm fluoroscopy for treatment planning in brachy-
therapy. With our new reconstruction method, the nonisocen-
tricity issue facing a mobile C-arm is solved by limiting its
degrees of motion between two orthogonal images and by
deriving the magnification factors from the geometric param-
eters and the allowed movements of the C-arm. The subop-
timal mechanical accuracy and stability of the mobile C-arm
is partially accounted for by these parameters and by the data
entry process. Distortions in the fluoroscopy images are digi-
tally corrected using a software program developed in house
that employs a seven parameter polynomial filter. Since the
commissioning nearly three years ago, this system has been
in extensive clinical use in our institution for endobronchial,
intracavitary, and some interstitial implants with satisfactory
results.
The paper is organized in four sections. The materials and
methods section describes the C-arm fluoroscopy machine,
the reconstruction method, and the image distortion correc-
tion used in this study. Phantom test results and clinical ap-
plications are presented in the results and discussions sec-
tion. And finally major conclusions of this study are
summarized in the closing section.
MATERIALS AND METHODS
Mobile C-arm fluoroscopy machine and treatmentplanning system
The mobile C-arm x-ray machine used in this study is a
model OEC 9800 surgical C-arm manufactured by GE OEC
Medical Systems ~Waukesha, Wisconsin!. It has both fluo-
roscopy and spot x-ray capability. Its image intensifier ~II!has a diameter of 12 inches featuring a 1k31k digital reso-
lution. The x-ray target to II distance is nominally 100 cm,
and the clearance from the bottom of the target housing to
the II is 80 cm. The workstation for the C-arm is Ethernet
ready, allowing for the direct transfer of digital fluoroscopic
images to a treatment planning computer through a local area
network.
The mobile C-arm is mechanically a very versatile ma-
chine. In addition to its roller wheels, there are 6 degrees of
rotational and linear movements allowing for the proper po-
sitioning of the device around the patient. Figure 1 is a sche-
matic drawing of the C-arm, illustrating its major compo-
nents and movements. Shown on the top of the C-arm orbit
is the x-ray target, and the II is at the bottom. Rotation in the
plane of the C-arm orbit is allowed up to a maximum of 90
degrees counterclockwise and 25 degrees clockwise from the
vertical anterior–posterior ~AP! position shown in the figure.
The C-arm orbit can also be flipped such that the target is on
the bottom of the orbit, allowing for posterior–anterior ~PA!orientation. Tilting of the C-arm orbital plane, and swiveling
of the C-arm orbit and the horizontal cross arm are also
possible. These rotational movements are complemented by
two additional degrees of linear movements along the hori-
zontal cross arm and the vertical column. Each of the two
linear movements has a travel range of up to 20 cm.
The C-arm is not an isocentric machine in its orbital ro-
tation plane, i.e., the central axis of its x-ray beam does not
pass through a fixed point in space as the machine is being
rotated along the C-arm orbit. As shown in Fig. 1, the C-arm
orbital rotational center ~ORC! is offset from the central axis
beam by a distance, labeled OS in the figure. This offset is 10
cm for the C-arm in this study. The flip–flop rotation of the
C-arm is, however, an isocentric motion, and its axis of ro-
tation passes through the ORC ~see Fig. 1!.
FIG. 1. Schematic drawing of the GE OEC 9800 mobile C-arm with its 6
degrees of motion. Sitting on top of the C-arm orbit is the x-ray target, and
at the bottom is the image intensifier ~II!. The C-arm is not isocentric, with
the central axis of the x-ray beam offset from the orbital rotation center
~ORC! by an amount OS. Such a design provides adequate clearance in the
lateral direction without increasing the C-arm orbit size.
2298 Liu et al.: C-arm fluoroscopy for brachytherapy treatment planning 2298
Medical Physics, Vol. 30, No. 9, September 2003

The HDR brachytherapy treatment planning system used
in this study is Varian BrachyVision 6.1 ~Varian Medical
Systems, Inc., Palo Alto, California!, operating on a Win-
dows NT platform. Digital images in DICOM as well as the
generic JPEG, TIFF, and bitmap formats can be imported
directly into BrachyVision. Following the transfer of the
C-arm fluoroscopic images to the computer, distortions in
these images are digitally corrected using a FORTRAN pro-
gram developed in-house. The corrected DICOM images are
imported into BrachyVision for treatment planning.
Although not adopted in our implementation, it is worth-
while to mention the reconstruction box method as provided
by the HDR manufacturers. The reconstruction box method
in general is mathematically precise, and is widely used in
localizing intracranial targets5 such as arteriovenous malfor-
mations. The fiducial markers on the box provide a reference
frame, and the method is not dependent on the mechanical
accuracy of the imaging device for reconstruction. In order to
use the box method on other treatment sites such as the pel-
vis and lung, the reconstruction box has to be large enough,
e.g., the box provided by our HDR manufacturer is 45 cm
364 cm. With a clearance of 80 cm between the C-arm
x-ray target housing and the II, such a large box placed on
the patient table leaves no room to maneuver the C-arm
without causing a collision. However, this is not to say that
the reconstruction box method cannot be used on body sites
other than the brain. With a portable or ceiling mounted
x-ray machine, clearance is not an issue, and it is possible to
position the machine freely around the box. Of course, such
a machine would not have fluoroscopic capability.
Virtual isocenter reconstruction
Two x-ray images taken from different orientations are
required for the three-dimensional reconstruction of the
sources and structures in brachytherapy treatment planning.
The orientations of the two images should be sufficiently
apart, e.g., 40 degrees or greater, in order to have adequate
reconstruction accuracy. There are clinical situations for
which orthogonal images are necessary. For example, in the
case of intracavitary cervical implant AP and lateral ~LAT!images are needed in order to identify patient anatomical
points such as the bladder and rectum.6 Although the flip–
flop rotation of the C-arm is an isocentric motion and utiliz-
ing image pairs taken with this rotation for reconstruction is
straightforward, its rotational range is limited in the presence
of the patient table, and this degree of motion is not suitable
for imaging all implant sites. The nonisocentric C-arm or-
bital rotation is needed for an imaging technique that can
meet all the clinical needs.
The difficulty with using a nonisocentric x-ray machine
for imaging is ultimately the issue of determining the orien-
tations and magnification factors of the two images. A new
reconstruction method is developed and adopted in this
study, which fully addresses these two issues for the mobile
C-arm. This new method has two major components: ~1!Among the 6 degrees of rotational and linear movements of
the C-arm, only the orbital rotation and the two linear move-
ments along the horizontal cross arm and vertical column are
allowed between the two images; ~2! The central axes of the
two images cross at one point in space, and the location of
this point can be determined using the geometric parameters
of the C-arm orbit and the amounts of rotational and linear
movements between the two images.
Figure 2 is an illustration of this method. The central axis
of the x-ray beam is offset from the C-arm orbital rotation
center ~ORC! by an amount OS ~see Fig. 1!. As the x-ray
target and II are rotated in the C-arm orbital plane from the
vertical AP to the horizontal LAT position, the central axes of
the AP and LAT beams cross at a point in space. This point is
away from the ORC by an amount OS right lateral and OS
superior, as shown in Fig. 2~a!. We call this crossing point
the ‘‘virtual isocenter’’ ~VI!. This displacement of the VI
from the ORC results in a decrease for the target-VI distance
for the vertical AP beam but an increase for the horizontal
LAT beam. Allowing the C-arm two additional linear move-
ments between the two images further changes the location
of the VI. As shown in Fig. 2~b!, the horizontal movement
changes the target-VI distance for the LAT beam, and the
vertical movement changes the target-VI distance for the AP
beam.
Once the location of the VI is known, it is straightforward
to determine the magnification factors of the AP and LAT
images. They are simply the ratios of the target-II distance
over the target-VI distance. With this information the three-
dimensional reconstruction of the brachytherapy sources and
structures is readily available with any modern treatment
planning system. We term this method of using the C-arm
images for treatment planning the ‘‘virtual isocenter recon-
struction’’ ~VIR! method.
Table I is a summary of the geometric parameters of the
C-arm for the VIR method. Note that the target-II distance is
dependent on the orientation of the C-arm, and this distance
varies by as much as 2.3 cm between the PA and right lateral
~RLAT! orientation. This is a direct result of the target and II
sagging, and the mechanical imperfection of the C-arm. The
target-VI distance is dependent on the linear movements in
FIG. 2. The virtual isocenter reconstruction ~VIR! method. ~a! Rotating the
C-arm in its orbital plane from the vertical AP to the horizontal LAT posi-
tion. The two beams cross at a point away from the orbital rotational center.
We term this crossing point the ‘‘virtual isocenter’’ ~VI!. ~b! Allowing hori-
zontal and vertical adjustments of the C-arm orbital plane between the two
orthogonal images moves the VI to a new location. The horizontal adjust-
ment changes the x-ray target to VI distance for the LAT beam, and the
vertical adjustment changes that for the AP beam.
2299 Liu et al.: C-arm fluoroscopy for brachytherapy treatment planning 2299
Medical Physics, Vol. 30, No. 9, September 2003

the horizontal ~LR! and vertical ~UD! directions between the
LAT and AP or PA images, as discussed previously. Only two
orthogonal image pairs, AP-LLAT and PA-RLAT, are al-
lowed because of the limited orbital rotation range of the
C-arm. It is not possible, for example, to have AP and RLAT
as an image pair without using the flip–flop rotation of the
C-arm ~see Fig. 1!, such a rotational movement is not al-
lowed in the VIR method.
Several measurements are required in order to obtain the
geometric parameters listed in Table I. The target-II distance
is measured radiographically by placing a stainless steel ruler
at a known distance from the II surface. From the magnifi-
cation of the projected x-ray image at the II plane, the
target-II distance can be calculated through M
5TID/(TID-D), where M is the magnification, TID is the
target-II distance, and D is the ruler-II distance. The mea-
surement of the target-VI distance is illustrated in Fig. 3. The
center of II to the floor distance is measured for both the AP
and LAT orientations, and the VI to II distance for the AP
orientation is then the difference of the two. Similarly the VI
to II distance for the LAT orientation is the difference of the
center of II to the right wall distance between the AP and
LAT orientations.
C-arm mechanical accuracy
The C-arm is not designed to be mechanically as accurate
and stable as the treatment simulator. One indication of this
is the orientation dependence of the target-II distance shown
in Table I, a direct result of the target and II sagging. Another
aspect of this is the relative shift of the target and the II in the
plane perpendicular to the beam central axis, as shown in
Fig. 4. Figure 4~a! is a fluoroscopic image taken with the
C-arm in the AP orientation, and Fig. 4~b! in the LAT orien-
tation. The larger dot in each figure is the projection of a BB
placed on the target housing as a central axis indicator, and
the smaller one is a BB placed at the center of the II plane.
The relative positions of the two BBs appear shifted between
the AP and LAT images. Such a shift is indication of the
transverse movement of the II relative to the target. Figure
4~c! is a schematic drawing of the sagging induced relative
movements of the target and II. In addition to the two linear
movements discussed above, i.e., movements in the target-II
direction and the transverse direction, it is also possible that
sagging introduces a tilting of the II plane, as shown in Fig.
4~c!.In the VIR method these mechanical imperfections of the
C-arm are partially accounted for by using the orientation
dependent target-II distance, shown in Table I, and by allow-
ing small adjustment of the x-ray central axis indicator dur-
ing data entry in the treatment planning system. Sagging in-
duced tilting of the II plane is not accounted for in the
current algorithm.
Image distortion correction
It is well known1–3 that fluoroscopic images from the im-
age intensifier are distorted. Figure 5~a! is an example of this
distortion for a square Lucite plate placed on the II plane
directly. The major component of the distortion is the ‘‘pin-
cushion’’ effect, appearing as the stretch of corners for the
TABLE I. Geometric parameters of the C-arm for the VIR method. See the
text for details.
Orientation Target-VI Distance ~cm! Target-II Distance ~cm!
AP 59.52UD 100.5
LLAT 79.52LR 100.8
PA 78.91UD 99.1
RLAT 59.81LR 101.4
FIG. 3. Determination of the x-ray target to VI distance. The VI to II dis-
tance for the AP beam is the difference between the II to the floor distance
for the LAT beam and that for the AP beam. Similarly, the VI to II distance
for the LAT beam is the difference between the II to the right wall distance
for the AP beam and that for the LAT beam.
FIG. 4. Sagging induced relative movements of the x-ray target and II sys-
tem. ~a! Fluoroscopic image taken with C-arm in the AP orientation. The
large dot is a BB placed on the x-ray target housing as a central axis indi-
cator, and the small one is a BB placed at the center of the image intensifier
plane. ~b! Same as ~a! but taken with C-arm in the LAT orientation. Note
that the relative positions of the two BBs are shifted from that of ~a!. ~c!Schematic drawing showing the relative movements of the x-ray target and
II in the longitudinal and transverse directions. Also showing is a possible
tilting of the II plane.
2300 Liu et al.: C-arm fluoroscopy for brachytherapy treatment planning 2300
Medical Physics, Vol. 30, No. 9, September 2003

square object. The origin for this distortion is the curved
shape of the photocathode and the electron optics inside the
image intensifier. In addition, there is a rotational component
to the distortion that is dependent on the orientation of the
C-arm. This component has its origin in the earth magnetic
field and stray magnetic field in the surroundings.
The distortion corrected image shown in Fig. 5~b! is ob-
tained using a software program developed in house. This
program employs a seven parameter polynomial filter shown
below,
r5r8F11a•S r8
RD 2
1b•S r8
RD 4G ,
u5u81d01d1S r8
RD1d2S r8
RD 2
1gx•x8
R•S 12
uy8u
RD1gy•
y8
R•S 12
ux8u
RD ,
where R is the radius of the II, and a, b, d0 , d1 , d2 , gx , and
gy are the seven fitting parameters. (r8,u8) and (x8,y8) are
the polar and Cartesian coordinates of the raw image pixel,
and (r ,u) is the polar coordinate of the distortion corrected
image pixel. The pincushion effect is a distortion in the radial
direction, and is described by the first polynomial. The two
terms in the equation with parameters a and b are found to
be sufficiently accurate for the C-arm in this study. For the
distortion in the azimuth direction, the major component is
the constant term, d0 . The other higher order corrections
represent spiral-like and parabolic-like distortions in the im-
aging plane.
The seven fitting parameters of the distortion correction
program are obtained by analyzing the fluoroscopic images
of a standard diagnostic imaging quality assurance test plate.
The rectangular Lucite plate with metallic square lattice pat-
tern embedded is placed on the II plane, and fluoroscopic
images are taken with the C-arm at different orientations.
These images are analyzed using the correction program, and
the fitting parameters are adjusted until the corrected images
are satisfactory. Table II shows the values of these param-
eters for the different C-arm orientations. With these param-
eters, the average residual distortion error in the corrected
image is 0.3 mm, and the maximum over the entire II plane
is 1.0 mm. Such a degree of accuracy is acceptable for most
brachytherapy treatment planning.
RESULTS AND DISCUSSION
Phantom test
In order to evaluate the overall accuracy of the recon-
struction method, a test phantom is constructed using four
plastic catheters. Two catheters are taped to the top of a
Styrofoam block, and two to the bottom of the block. The
four catheters form a box of 10 cm wide, by 7 cm high, by
approximately 13 cm long. Figure 6~a! is a schematic draw-
ing of this phantom. The plastic catheters are loaded with
FIG. 5. ~a! Uncorrected fluoroscopic image of a square plate placed on the
image intensifier. ~b! Distortion corrected image obtained using a seven
parameter polynomial filter.
TABLE II. Parameters used for image distortion correction. See the text for details.
Orientation a b d0 (°) d1 (°) d2 (°) gx (°) gy (°)
AP 20.1 0.003 8.0 21.8 20.9 20.5 20.3
LLAT 20.1 0.003 6.5 21.2 21.2 1.0 20.2
PA 20.1 0.003 21.5 1.8 0.9 0.7 0.0
RLAT 20.1 0.003 0.0 1.2 1.2 20.9 0.0
FIG. 6. ~a! Test phantom constructed using four catheters taped to the top
and bottom surfaces of a Styrofoam block. The catheters form a box of 10
cm wide, by 7 cm high, by approximately 13 cm long. ~b! Distortion cor-
rected AP and LAT images of the test phantom.
2301 Liu et al.: C-arm fluoroscopy for brachytherapy treatment planning 2301
Medical Physics, Vol. 30, No. 9, September 2003

dummy ribbon seeds, and AP and LAT fluoroscopic images
taken. These images are transferred to the BrachyVision
treatment planning computer, and distortions in the images
are digitally removed using the correction program. The cor-
rected images, shown in Fig. 6~b!, are then imported into the
BrachyVision planning program, and the locations of the
dummy seeds are reconstructed. The maximum reconstruc-
tion error over the entire phantom dimensions is found to be
2 mm. Such an overall degree of accuracy, which is the com-
bined total of the residual image distortion in the II plane as
discussed previously, the reconstruction algorithm, and the
data entry process, is adequate for most HDR brachytherapy.
Clinical cases
The virtual isocenter reconstruction method using C-arm
images has been in clinical use at our institution for nearly
three years. Figure 7 is an example of its application in int-
racavitary Fletcher–Suite brachytherapy treatment planning.
Table III is a summary of all the HDR brachytherapy im-
plants performed at our institution during this time period.
All treatment planning calculations, except for the case of
vaginal cylinder implants, are done using either the C-arm
VIR method or the conventional simulator and CT method.
For vaginal cylinder implants the geometry is simple enough
that no image is used for planning and C-arm fluoroscopy is
used for verifying applicator placement in the AP direction
only. For breast MammoSite ~Proxima Therapeutics, Inc.,
Alpharetta, Georgia! treatment, CT is used for treatment
planning and for verification of the placement, shape, and
integrity of the applicator, and C-arm fluoroscopy is used for
constancy checks of the applicator before each treatment
fraction.
There are situations in which the simulator or CT scanner
is the preferred imaging device, as indicated in Table III.
These typically are large planar or volume implants for
which the simulator offers the flexibility of arbitrary imaging
orientation, and the CT simplifies catheter identification. In
principle, the VIR method could also be extended to nonor-
thogonal imaging geometry. However, with the limited or-
bital rotational range of the C-arm and the metallic side bar
of the patient table such an extension has little practical use.
The commissioning of the VIR method requires a signifi-
cant effort by a physicist. For a partial commissioning, it is
possible to use spot x-ray films instead of fluoroscopic im-
ages on the C-arm machine. Once commissioned, regular
quality assurance checks on a quarterly or semiannual basis
are required to maintain the overall performance of the
system.
CONCLUSIONS
The virtual isocenter reconstruction method presented in
this study offers a new practical solution for brachytherapy
treatment planning using C-arm images. This method pro-
vides adequate geometric reconstruction accuracy, and elimi-
nates the need for patient transport between applicator inser-
tion and treatment delivery for HDR procedures such as
endobronchial and intracavitary implants. The filmless pro-
cess greatly reduces the overall time needed for treatment
planning, and makes the overall HDR brachytherapy proce-
dure a smooth process. This reconstruction method, however,
does not replace conventional simulator and CT treatment
planning, especially for large planar or volume implants and
for implants that require nonorthogonal imaging geometry.
a!Author to whom correspondence should be addressed; electronic mail:
[email protected] S. Rudin, D. R. Bednarek, and R. Wong, ‘‘Accurate characterization of
image intensifier distortion,’’ Med. Phys. 18, 1145–1151 ~1991!.2 E. Gronenschild, ‘‘Correction for geometric image distortion in the x-ray
imaging chain: Local technique verses global technique,’’ Med. Phys. 26,
2602–2616 ~1999!.3 R. R. Liu, S. Rudin, and D. R. Bednarek, ‘‘Super-global distortion cor-
rection for a rotational C-arm x-ray image intensifier,’’ Med. Phys. 26,
1802–1810 ~1999!.4 A. Y. C. Fung, ‘‘C-arm imaging for brachytherapy source reconstruction:
Geometrical accuracy,’’ Med. Phys. 29, 724–726 ~2002!.5 R. L. Siddon and N. H. Barth, ‘‘Stereotaxic localization of intracranial
targets,’’ Int. J. Radiat. Oncol., Biol., Phys. 13, 1241–1246 ~1987!.6 ICRU, ‘‘Dose and volume specification for reporting intracavitary
therapy in gynecology,’’ ICRU Report No. 38, Bethesda, MD: Interna-
tional Commission on Radiation Units and Measurements, 1985.
FIG. 7. Example of a Fletcher–Suite implant using the VIR method.
TABLE III. Summary of HDR implants performed from June 2000 to March
2003.
Implant type No. of implants Imaging device for planning
Endobronchial 45 C-arm
Esophageal 2 C-arm
GYN–Fletcher–Suite 6 C-arm
GYN–cylinder 79 ~C-arm!
GYN–interstitial 1 CT
Sarcoma 12 Simulator
Head and Neck 6 C-arm, Simulator, CT
Breast–MammoSite 1 CT, ~C-arm!
Total 152
2302 Liu et al.: C-arm fluoroscopy for brachytherapy treatment planning 2302
Medical Physics, Vol. 30, No. 9, September 2003

C-Arm imaging for brachytherapy source reconstruction:Geometrical accuracy
Albert Y. C. Funga)
Department of Medical Physics, Memorial Sloan-Kettering Cancer Center, New York, New York 10021
~Received 31 December 2001; accepted for publication 25 February 2002; published 11 April 2002!
We study the accuracy of brachytherapy source reconstruction using C-Arm images. We use a
phantom embedded with dummy ribbons in a regular pattern, placed at the rotation center of the
C-Arm. With a commercial reconstruction jig, radiographic films are taken without the image
intensifier. The average error in reconstructed seed coordinates is 0.1 cm. However, the jig is
inconvenient for patient procedures. For C-Arm reconstruction without the jig, the magnifications
of the image intensifier along orthogonal directions are different. We ‘‘stretch’’ the image to equal-
ize the magnifications. Afterward, seed reconstruction has an average error of 0.1 cm in all
directions. © 2002 American Association of Physicists in Medicine. @DOI: 10.1118/1.1473136#
Key words: geometrical, accuracy, C-Arm, brachytherapy, reconstruction
C-Arm mobile fluoroscopic units are generally considered
inferior in geometrical accuracy of images for the purpose of
radiation therapy planning, as evidenced by various articles
recommending high-order polynomial correction for
distortion.1,2 However, there are clinical occasions in which
the most convenient localization method is with a C-Arm.
The original motivation of our project was to investigate the
suitability of C-Arm reconstruction for treatment planning of
high dose rate ~HDR! brachytherapy of gynecological can-
cer, but it will be clear in later discussion that the result
applies to other treatment sites. We studied the quantitative
accuracy of seed reconstruction using C-Arm images, with
and without a commercial reconstruction jig, and describe
the result.
The C-Arm checked in our study is the General Electric
OEC Series 9600 model. We used an in-house solid phantom
to check the accuracy of C-Arm reconstruction. The phantom
~Fig. 1! is made of acrylic slabs embedded with ribbons of
metal seed dummies in a regular pattern. Five ribbons are
arranged along the diagonal to avoid overlapping of indi-
vidual ribbon images on orthogonal views. Each ribbon con-
sists of dummies separated 1 cm apart. The phantom was
placed at the rotation center of the C-Arm. Images were
taken at anterior–posterior ~AP! and left lateral directions.
The same set of images were taken with and without a com-
mercial jig ~Fig. 2!. ~The jig was manufactured by Gam-
mamed, MDS Nordion Haan GmbH, Bergische Str. 16,
D-42781 Haan, Germany.! The jig consists of four transpar-
ent acrylic plates rigidly attached that surround the patient.
On each plate are embedded radio-opaque markers at known
positions. The jig also provides places to insert orthogonal
film cassettes. The markers appear as circular dots on radio-
graphic films. The marker positions were digitized together
with the seeds, and ABACUS Version 3.1, the GammaMed
software for HDR planning, was used in seed reconstruction.
ABACUS calculates the seed positions based on the known
~relative! coordinates of the markers. We have also recon-
structed the seeds without using the jig and its markers, and
just assuming orthogonal isocentric films.
We first discuss the general difficulties in reconstruction
using images straightforwardly without a jig. ~a! The Image
Intensifier ~II! of the C-Arm is not designed for perfect im-
ages. The image plane of the II is not well defined, and
geometric distortion is well known. ~b! Sagging due to the
heavy II produces uncertainties in distances and angles be-
tween the x-ray source, the phantom, and the II. ~c! The
C-Arm rotation is not isocentric, even by design. As shown
in Fig. 3, the source–axis distance is angular dependent. ~d!
The ABACUS software assumes we have actual-size images
taken at the ‘‘film’’ location. The II images, whether digital
ones on a computer screen or hard copies from the fluoro-
scope printer, have different magnifications from those at the
II plane.
The jig resolves all of the above-mentioned problems. Ra-
diographic films are taken without the II, thus bypassing its
accompanying issues: distortion, ill-defined plane, and sag-
ging. The film records actual-size images at fixed distances.
The markers are the solution for nonisocentricity. Coordi-
nates of the x-ray sources can be deduced from the digitized
locations of the markers. The accuracy of seed reconstruction
with the jig is excellent. Position of every reconstructed
dummy seed is compared with the supposed position, and the
average error in reconstructed seed coordinates is within 0.1
cm, which is acceptable for brachytherapy planning. How-
ever, the jig is 34349 cm in dimension, rather small for
many patients to fit in and in the way of the physician per-
forming the procedure. It is also fragile, and can be easily
bent or damaged during use. C-Arm has bulky II, which is
difficult to maneuver under the patient couch. If posterior–
anterior ~PA! images were adequate, we could have the x-ray
source below and the II above a supine patient. However,
this jig requires an AP film, hence we would have to try
pushing the II under the couch.
Hence, we also examined C-Arm reconstruction without
the jig. The distances between various C-Arm components
724 724Med. Phys. 29 „5…, May 2002 0094-2405Õ2002Õ29„5…Õ724Õ3Õ$19.00 © 2002 Am. Assoc. Phys. Med.

were obtained from the manufacturer. The II images should
be rescaled to the actual size at the II plane. In practice, we
rescaled the images by one of the ribbons in the images. The
scale was chosen so that the reconstructed seeds on the cho-
sen ribbon have the correct separation, 1 cm. This canceled
out first-degree error in distances and image magnifications.
The ribbon was along the superior–inferior ~SI! direction,
perpendicular to the C-Arm rotation plane. The reconstructed
seed coordinates had a mean error of 0.065 cm ~standard
deviation 0.025 cm! in the SI direction, but 0.2–0.3 cm along
the other two orthogonal directions. We noticed that the di-
ameters of the ‘‘circular’’ II and its images were in different
proportions along various directions. Specifically, the II re-
ceptor had a diameter of 24.4 cm along the C-Arm rotation
plane and 24.8 cm perpendicular. The circular rim on the
images ~the hard copies from the fluoroscope printer! mea-
sured 11.45 cm along the C-Arm rotation plane, and 10.8 cm
perpendicular. This may be observed from Fig. 4, a to-scale
image. Therefore, image magnifications along orthogonal di-
rections were different by 7.7%. With a commercial graphic
software that has image processing functions ~such as Mi-
crosoft Paint!, we modified the II images by ‘‘stretching’’ the
image 7.7% perpendicular to the C-Arm plane. After chang-
ing the magnification in one direction, seed reconstruction
became excellent in all directions, with a mean error of 0.59
cm ~standard deviation 0.030 cm!. Hence the main distortion
of II images was this different magnification along orthogo-
nal directions.
C-Arm distortion is known to be a function of the strength
and direction of the Earth’s magnetic field. The heavy II also
causes sagging which is dependent on the orientation. In the
study we used AP, PA, and lateral films. ~Right and left lat-
erals were taken with the same II position. The II could not
rotate 180° along the rail, so we turned the whole C-Arm
together with its base.! These represent the four extreme po-
sitions and orientations for the II. Hence, the result implies
that reconstruction uncertainty is insignificant for any II ori-
entation.
This reconstruction method assumes there is a ribbon per-
pendicular to the C-Arm rotation plane. For HDR brachy-
FIG. 1. In-house rectangular phantom with regularly spaced dummy seeds
embedded. The phantom measures 3031236 cm. The figure is ‘‘figurative’’
in the sense that the number of seeds shown is different from the actual
number on the phantom.
FIG. 2. Acrylic commercial reconstruction jig from Gammamed, with em-
bedded radio-opaque markers on four ‘‘thick’’ plates.
FIG. 3. Nonisocentric rotational geometry of C-Arm. The x-ray source and
the II rotate on a common circular rail. The two locations drawn are for AP
and lateral imaging. The ‘‘rotation center’’ is the center of the circular path.
There is actually no ‘‘isocenter’’ of radiation.
FIG. 4. AP image of the rectangular phantom taken with C-Arm fluoroscopy.
725 Albert Y. C. Fung: C-Arm imaging 725
Medical Physics, Vol. 29, No. 5, May 2002

therapy of gynecological cancer one may use the dummy
ribbon inserted into the patient’s rectum. Our method will be
useful for implants in other anatomical sites if ~a! the patient
is positioned such that dummy ribbons lie perpendicular to
the C-Arm rotation plane, or ~b! a scale ~ring or ruler! is put
on the patient with the known dimension perpendicular to the
C-Arm rotation plane. One may estimate the error when the
scale is not exactly perpendicular. Suppose the ribbon is 10°
to the C-Arm rotation axis, the fractional error in length will
be
1
cos 0°2
1
cos 10°50.015. ~1!
An implant of maximum size 10 cm, if centered on the II
aperture, will have the extreme points 5 cm from the center,
and positional error at the extreme will be 0.75 mm, which is
clinically acceptable.
In conclusion, we have studied the use of a C-Arm and a
commercial jig in brachytherapy localization. The jig reduces
reconstruction errors, but poses risk of being too small and
easily damaged, and inconvenient for clinical use. The II
images without a jig, however, may provide accurate recon-
struction, if the images are stretched along one direction to
give the same magnification as the other orthogonal direc-
tion.
a!Electronic mail: [email protected] N. S. Cosby and K. W. Leszczynski, ‘‘Computer-aided radiation therapy
simulation: Image intensifier spatial distortion correction for large field of
view digital fluoroscopy,’’ Phys. Med. Biol. 43, 2265–2278 ~1998!.2 R. R. Liu, S. Rudin, and D. R. Bednarek, ‘‘Super-global distortion cor-
rection for a rotational C-arm x-ray image intensifier,’’ Med. Phys. 26,
1802–1810 ~1999!.
726 Albert Y. C. Fung: C-Arm imaging 726
Medical Physics, Vol. 29, No. 5, May 2002

Journal of Contemporary Bra chy the ra py (2012/volume 4/number 3)
Address for correspondence: Kirti Tyagi, PhD, Medical Physicist, Radiation Oncology Centre,
INHS Asvini, Colaba, Mumbai-400005, India, ��e-mail: [email protected]
Original paper
Non isocentric film-based intracavitarybrachytherapy planning in cervical cancer:a retrospective dosimetric analysis with CT planningKirti Tyagi, PhD1, Hari Mukundan, MD1, Deboleena Mukherjee, MSc1, Manoj Semwal, PhD2, Arti Sarin, MD2
1Radiation Oncology Centre, INHS Asvini, Colaba, Mumbai, India, 2Radiotherapy Department, R&R Hospital, Delhi, India
Abstract
Purpose: To compare intracavitary brachytherapy dose estimation for organs at risk (bladder and rectum) based onsemi-orthogonal reconstruction of radiographs on non-isocentric X-ray unit and Computed Tomography (CT) – basedvolumetric planning in cervical cancer.
Material and methods: Bladder and rectal points as per International Commission on Radiation Units and Measu -rements (ICRU) report 38, were retrospectively evaluated on 15 high dose rate intracavitary brachytherapy applicationsfor cervical cancer cases. With the same source configuration as obtained during planning on radiographs performedon a non-isocentric X-ray unit, the mean doses to 2cc of most irradiated part of bladder and rectum were computed byCT planning and these estimates were compared with the doses at ICRU bladder and rectal points.
Results: The mean ICRU point dose for bladder was 3.08 Gy (1.9-5.9 Gy) and mean dose to 2 cc (D2cc) bladder was6.91 Gy (2.9-12.2 Gy). ICRU rectal dose was 3.8 Gy (2.4-4.45 Gy) and was comparable with D2cc rectum dose 4.2 Gy (2.8-5.9 Gy). Comparison of mean total dose (ICRU point vs. D2cc) for each patient was found to be significantly differentfor bladder (p = 0.000), but not for rectum (p = 0.08).
Conclusions: On comparison of ICRU point based planning with volumetric planning on CT, it was found that blad-der doses were underestimated by the film based method. However, the rectal doses were found to be similar to the D2ccdoses. The results with non isocentric film based treatment planning were similar to the existing literature on orthogo-nal film based simulator planning.
J Contemp Brachyther 2012; 4, 3: 129-134
DOI: 10.5114/jcb.2012.30678
Key words: bladder dose, brachytherapy, cervical cancer, radiograph, rectal dose.
Clinical Investigations
Received: 23.04.2012
Accepted: 19.07.2012
Published: 27.09.2012
Purpose
High Dose Rate (HDR) brachytherapy in the treatmentof cervical cancer with or without external radiotherapy isan essential component of management. It has a high the -rapeutic index delivering a high dose to primary cervical lesion and lower doses to adjacent organs [1-3]. In brachythe -rapy, an exact knowledge of the applicator geometry is necessary for an accurate calculation of dose to tumor andcritical organs [4]. The traditional ways to reconstructthe brachytherapy catheters are either using a semi-ortho -gonal film method with a reconstruction jig or a pair ofisocentric orthogonal or variable angle X-ray imagingmethod. X-ray images are obtained by using a therapy sim-ulator or an integrated brachytherapy unit (IBU). Except IBU,the procedure requires that the patient is transferred afterthe application to the X-ray unit room for obtaining the re-construction images and needs to be transported back tothe brachytherapy treatment room to administer the irra-
diation. A modern approach in treatment planning for cer-
vical cancer is based on Computed Tomography (CT) or
Magnetic Resonance (MR) images and on a 3D dose calcu-
lation. Since 2004, several guidelines for image based
brachytherapy for cervical cancer have been published [2,5,6].
At our centre, intracavitary brachytherapy (ICBT) planning
has been carried with the 2D X-ray film method using a re-
construction jig and semi orthogonal reconstruction. The pre-
sent study was carried out with the intention of changing over
to CT based 3D planning. The treatments delivered using 2D
film planning were also planned with CT imaging keeping
the same source configuration. The doses to organs at risks
i.e. bladder and rectum were computed by both the methods
for further analysis. To our knowledge, there has been lim-
ited published data or literature available regarding the do -
simetric comparison of semi orthogonal reconstruction
of non isocentric X-rays with orthogonal X-rays or CT-MRI
brachytherapy treatment planning in cervical cancers.

Journal of Contemporary Bra chy the ra py (2012/volume 4/number 3)
Kirti Tyagi, Hari Mukundan, Deboleena Mukherjee et al.130
Material and methods
Patients selection
Ten patients with cervical cancer (Stage IIB – 4 patients,Stage IIIB – 4 patients, Stage IVA – 2 patients) who under-went 30 intracavitary brachytherapy insertions at our cen-tre were included in this study. Treatment planning wasdone with conventional planning with a reconstruction jig.A preliminary study of CT guided volumetric planning hasbeen performed retrospectively. This study was approvedby the hospital’s ethical committee.
Treatment scheme
The standard treatment protocol for cervical cancers atour centre consists of external beam radiotherapy (50 Gy/25 fractions) with concomitant chemotherapy and ICBT. After 7-10 days of completion of external chemo-radio-therapy to the pelvis, patients were taken for HDR-ICBT anda total dose of 21 Gy in three equal fractions of 7 Gy eachat weekly intervals was given.
Brachytherapy insertion
The Fletcher Williamson applicators (Nucletron, Veenen -daal, The Netherlands®) were used for intracavitarybrachytherapy application consisting of uterine tandem anda pair of ovoids. Standard metallic applicators were usedwithout special modification for CT/MRI compatibility. Before each application, a urinary catheter was inserted andthe catheter balloon inflated with contrast and normal saline(7 ml) for visualizing the bladder. Appropriate packing wasdone to fix the applicator in position and to push the blad-der and rectum away from the vaginal applicators. Blad-der and rectal reference points were identified according toICRU 38 recommendations. The patients were under con-scious sedation.
Brachytherapy planning and treatment: conventional planning
After insertion of the applicators, X-ray images were tak-en with patient in supine position (AP and lateral views)
for conventional planning with a reconstruction jig. To mi -ni mize patient movement during radiographs, the recon-struction jig base plate was kept below the patient and it remained there till the treatment was completed. The re-construction jig (Fig. 1) was supplied by Nucletron® andcomprises of a base plate and a C shaped mountable struc-ture. The base and side plates are embedded with radioopaque markers at known positions. These markers appearas a straight line with circular dots on radiographic films.The X-ray tube is focused on the markers on upper C-shapedplate. The base plate also has a provision for holding theradiographic film cassettes for lateral as well as AP radio -graphs. The brachytherapy treatment planning systems re-quire setup parameters, with magnification factors of the im-ages. Semi orthogonal reconstruction method is used forreconstruction of the images. This method allows the useof a non isocentric X-ray unit to take the two reconstructionradiographs. Truly orthogonal orientations are not easilyobtained with non isocentric X-ray unit. A localization jigwith AP and lateral cross wires is placed over the patientand radiographs are taken. The semi orthogonal reconstruc -tion method accepts X-rays beams whose central axes donot intersect and are not perpendicular to one another.The only requirement is that the projections of the cross-wires on the two corresponding box faces are visible onthe radiographs (Fig. 2).
Geometrical reconstruction of applicator and dose com-putation was carried out using PLATO SUNRISE(Brachytherapy v14.3.5, Nucletron, The Netherlands®)brachytherapy treatment planning system using Vidar Do -simetry Pro scanner. The films were scanned with scanner.Point A was defined on the radiographs as being 2 cm su-perior (along the tandem) to the flange abutting external cervical os and 2 cm lateral from the axis of the tandem.The source positions were loaded as per the standard load-ing pattern in accordance with the Manchester System. Thesedwell positions were then optimized to minimize the doseto rectal and bladder points. The 7 Gy dose was prescribedto point A. The doses to point A, bladder and rectum werecalculated. In the planning process, bladder and rectum point
Fig. 1. X-ray images were taken with patient in supine position (AP and lateral views) for conventional planning
Right
Left
Anterior
Posterior

Journal of Contemporary Bra chy the ra py (2012/volume 4/number 3)
Intracavitary brachytherapy planning in cervical cancer 131
doses were planned to keep below 80% of dose to point Afor each planned fraction.
3D CT post treatment planning
A CT scan (Somatom Sensation 4, Siemens®) with 3 mmslice thickness through the pelvis was performed for 15 cas-es out of 30 ICBT insertions. The CT images were transferredto Oncentra Virtual Simulation System (Oncentra Master-Plan version 3.3, Nucletron®) via networking and subse-quently to the Plato Treatment Planning System (Nucle-tron®). The patient was shifted to the treatment chamber andtreatment was delivered by MicroSelectron – HDR (Nu-cletron®) as per the conventional planning. Subsequentlythe radiation oncologist delineated the bladder and rectum(OARs) in each slice of all the CT images. Although few CTslices contained artefacts, but this was not a serious im-pediment to contouring bladder and rectum in this study.Rectum was contoured from above the anal sphincter tothe level of transition to sigmoid. The entire bladder wascontoured. After catheter reconstruction, for each applica-tion, the corresponding optimized dwell positions used inconventional 2D planning were duplicated for 3D planningwith the contours now drawn. DVH parameters for mini-mum dose to the most irradiated contiguous volumeof 0.1cc, 1cc and 2cc (D0.1cc, D1cc and D2cc, respectively)were produced for each OAR with 100 000 sample points.No contouring was done during actual treatment planning.
Statistical analysis
The paired Student’s t-test was performed for compar-ison of ICRU point doses and D2cc volume doses for blad-der and rectum. Mean ratio (D2cc/ICRU) was also calcu-lated.
Results
The mean age of the patients was 55 (range 45-60) years.Tumor stage was evaluated according to the International Fed-eration of Gynaecology and Obstetrics (FIGO) classification[7]. The mean contoured volume of bladder and rectum was 104 (± 64) cc and 48 (± 13) cc, respectively. Table 1 showsthe mean ICRU point doses and D2cc volume doses for blad-der and rectum from this study. The mean D2cc of the blad-der obtained from the CT plan was 6.91 Gy (2.9-12.2 Gy).The mean ICRU bladder dose obtained for our patients was 3.08 Gy (1.9-5.9 Gy). Our results reveal that ICRU blad-der dose is less than bladder D2cc dose by a ratio of 2.24 (Fig. 3). Mean ICRU and D2cc doses calculated showa statistically significant difference for bladder (p = 0.000).
The mean D2cc of the rectum obtained from the 3D planwas 4.2Gy (2.8-5.9 Gy). The mean ICRU rectal dose obtainedfrom the conventional plan for all patients was 3.8 Gy (2.4-4.45 Gy) (Table 2, Fig. 4). Mean ICRU and D2cc dosescalculated did not reveal a statistically significant differencefor rectum (p = 0.08). The average ratio in this study was1.10. Physical doses (EBRT+HDR) for OARs at ICRUpoints as well D2cc were converted to a biologically equiv-alent dose and normalised to conventional 2Gy (α/β = 3),EQD2 (Table 3).
Discussion
Intracavitary brachytherapy is an integral part of the treat-ment of cervical cancer. The treatment planning for the de-livery of radiation is dependent on the imaging modalityused as well as the method of reconstruction of the appli-cators and organ at risk. Orthogonal radiographs are traditionally used for treatment planning. However, semi-orthogonal reconstruction especially in the context of C-armbased brachytherapy planning has also been used. There islimited literature available on non-isocentric radiographybased intracavitary brachytherapy planning especially
LateralFocus
AP Focus
Radiograph
Radiograph
P: A point to be reconstructed
P
Fig. 2. The semi orthogonal reconstruction method accepts
X-rays beams whose central axes do not intersect and are
not perpendicular to one another
Mean (range) ICRU (Gy) Mean (range) D2cc (Gy) Paired t-test (range) Average ratio (D2cc/ICRU)
Bladder 3.08 (1.9-5.9) 6.91 (2.9-12.2) p = 0.000, CI (2.29-5.38) 2.24 ± 1.01
Rectum 3.8 (2.4-4.45) 4.2 (2.8-5.9) p = 0.08, CI (–0.15-0.91) 1.10 ± 0.229
Table 1. Mean ICRU point Doses and D2cc volume doses in bladder and rectum in our study (semi orthogonal
method)
ICRU – International Commission on Radiation Units and Measurements; D2cc – dose received by 2cc of the volume of the bladder calculated from image based CT
planning; CI – confidence interval

Journal of Contemporary Bra chy the ra py (2012/volume 4/number 3)
Kirti Tyagi, Hari Mukundan, Deboleena Mukherjee et al.132
with respect to volumetric dosimetry. Extensive literatureis available which clearly suggests that image basedbrachytherapy is better than point based brachytherapy.The starting point was to retrospectively evaluate our cli -nical practice by applying 3D assessment of the OARs us-ing CT scans.
Fung [8] has evaluated the reconstruction jig with a C-armbased mobile fluoroscopic unit and found that the jig notonly has an excellent accuracy of reconstruction, but it alsoresolves problems encountered while using C-arm. BothFung [8] and Cuijpers [9] have suggested that using the jigresolves the problem such as distortion, ill defined planesand sagging, which are issues with image intensifier usedin C-arm fluroscopic units. They have reported that the re-construction jig is narrow and the localization of the mark-er point becomes difficult for very bulky patients. Never-theless, in our study our patients did not experience anydifficulty in fitting within the jig possibly due to the small-er built of the Indian females as compared to the Westernpopulation. In the radiographs taken with the help of recon -struction jig, the bladder and rectal markers were pro perlyvisualized in both AP as well as lateral radiographs. How-ever, in some patients the radio opaque markers and con-trast in bulb of Foley’s catheter were faintly visualized withusual exposure factors and required increasing of the ex-posure factors (kV, mAs).
Bladder Rectum
Mean (range) Mean (range) Average Ratio Mean (range) Mean (range) Average Ratio
ICRU (Gy) D2cc (Gy) (range) (D2cc/ ICRU) ICRU (Gy) D2cc (Gy) (D2cc/ICRU)
Onal et al. [12] 6.1 (2.9-8.7) 9.2 (7.6-12.9) 1.51 5 (2.2-10.7) 8.3 (5.1-12.3) 1.66
Jamema et al. [13] 4.56 7.12 1.56 ± 0.6 4.63 5.16 1.11 ± 0.2
Tan et al. [14] 2.9 (1.2-4.5) 3.9 (1.3-6.3) 1.34 ± 0.34 3.4 (2.4-4.2) 3.6 (1.8-5.9) 1.07 ± 0.25
Table 2. Mean ICRU point doses and D2cc volume doses in bladder and rectum (orthogonal method)
ICRU – International Commission on Radiation Units and Measurements; D2cc – dose received by 2cc of the volume of the bladder calculated from image based CT
planning
OAR’S
Bladder Mean Rectum Mean
(range) (Gy) (range) (Gy)
ICRU Point 54 ± 2 (51.8-60.7) 55 ± 1 (52.6-56.6)
D2cc 65 ± 10 (87.5-53.5) 56 ± 2 (53.3-60.6)
Table 3. Biologically normalized total dose EQD2
for bladder and rectum (α/β = 3) in our study
Semi-orthogonal Orthogonal method
method
Present study Onal et al. [12] Jamema et al. [13]
(n = 15) (n = 63) (n = 22)
Point A (Gy) 7 7 7
Bladder Mean 3.08 6.1 4.56
(range) (Gy) (1.9-5.9) (2.9-8.7)
Rectum Mean 4.2 5 4.63
(range) (Gy) (2.8-5.9) (2.2-10.7)
Table 4. Comparison of mean ICRU point doses (Gy)
for bladder and rectum using semi-orthogonal
method and orthogonal method
n – number of brachytherapy insertions (for a prescription dose of 7 Gy to Point A).
Fig. 3. Comparison of bladder dose by conventional and
CT planning
Do
se (
Gy
)
14
12
10
8
6
4
2
0
0 5 10 15 20
BT insertions
Conventional plan
CT plan
Fig. 4. Comparison of rectal dose by conventional and CT
planning
Do
se (
Gy
)
7
6
5
4
3
2
1
01 3 5 7 9 11 13 15
BT insertions
CT plan
Conventional plan

Journal of Contemporary Bra chy the ra py (2012/volume 4/number 3)
Intracavitary brachytherapy planning in cervical cancer 133
For image based dosimetry CT images were used for reconstruction of the applicators. All the patients in this studywere treated using standard Fletcher Williamson applica-tor. The artefacts produced by metal applicators were re-duced up to some extent by manipulating the CT windowand level setting during CT scan. The accuracy of CT re-construction was compared with the radiograph based reconstruction of the applicator by overlaying CT recon-struction on radiograph reconstruction. The maximum va -riation of ± 6 mm was observed between these two with re-spect to point A. This is attributed to shifting of patientbetween X-ray room and CT room. It has been shown byGrigsby et al. [10] that movement of reference points rela-tive to bony structures during the interval time of two in-tracavitary implants led to an average shift of 10-15 mm anddose differences of up to 35% were observed due to this highdose gradient. Thomadsen et al. [11] have also concluded thatany movement of patient should be avoided as this can pro-duce large changes in dose to bladder and rectum.
We compared our results of non isocentric film basedICBT using semiorthogonal reconstruction with the dataavailable in the literature where ICBT was performed withorthogonal reconstruction delivering a dose 7 Gy at simi-lar point A (Table 4). We found that our calculations withsemiorthogonal radiographs for bladder and rectal doseswere comparable to the doses calculated with orthogonalradiography based studies such as Onal et al. [12] (62 HDRapplications), Jamema et al. [13], (22 HDR applications) (bothauthors prescribed 7 Gy dose at Point A) as well as with Tanet al. [14] (55 applications with 5.3 Gy to Point A). When wecompared our results for the mean ICRU point doses ob-tained using semi orthogonal approach and the D2cc dos-es for rectum and bladder on CT scans, we found that the av-erage ratio of ICRU rectal dose to D2cc (rectum) by ourapproach was 1.10 which is similar to the ratios obtainedsuch as 1.66, 1.11 and 1.07 by other authors [12-14] for rec-tum, respectively. However, the ICRU bladder point un-derestimated the bladder D2cc dose by a ratio of 2.24 in ourstudy as compared to 1 .51, 1.56 and 1.34 [12-14] (Table 2),but it was comparable with Schoeppel et al. [15] and Baril-lot et al. [16]. Other authors such as Hunter et al. [17] havealso found that the ratio of max bladder dose (from CT im-ages) to ICRU reference dose (calculated from radiographs)varied from 1.01 to 3.59. Schoeppel et al. [15] has reportedaverage ratios of 2.3 (range 1.4-2.7) for the bladder and 1.3(range 0.9-2.1) for the rectum. Barillot et al. [16] used ultra -sonography for evaluating the bladder doses and found thatmaximum doses in the bladder were on an average 2.7 timeshigher than the doses at the ICRU reference points (calcu-lated from radiographs).
Our results are similar with published data for rectal dos-es, however there is a broad range for bladder doses. Fell-ner et al. [18] has attributed the wide range of ratios forthe bladder to different methods used like radiographs, ultrasound, CT to evaluate the doses and the difference inindividual patient anatomy.
Conclusions
Treatment planning based on semi-orthogonal films ob-tained with a non-isocentric X-ray unit with the help of a re-
construction jig is comparable to true orthogonal films onan isocentric X-ray unit. ICRU reference point doses by se -miorthogonal reconstruction underestimated the blad derD2cc volume doses, but no significant difference wasfound for rectum. CT/ MRI based 3D volume based plan-ning should be used wherever feasible as it is better in as-sessing the doses to OAR volumes than conventional filmpoint based 2D planning and has today become the stan-dard of care in many institutions.
References
1. Atahan I L, Onal C, Ozyar E et al. Long-term outcome andprognostic factors in patients with cervical carcinoma: a retro-spective study. Int J Gynecol Cancer 2007; 17: 833-842.
2. Nag S. High dose rate brachytherapy: its clinical applications& treatment guidelines. Technol Cancer Res Treat 2004; 3: 269-287.
3. Viani GA, Manta GB, Stefano EJ et al. Brachytherapy for cervixcancer: low dose rate or high dose rate Brachytherapy – a metaanalysis of clinical trials. J Exp Clin Cancer Res 2009; 28: 47.
4. Chassangne D, Duthyerix A, Almond P et al. ICRU ReportNo.38: Dose & Volume specification for reporting Intracavi-tary therapy in gynecology. International Commissioning on Radi-ation Units & Measurements, Bethesda 1985.
5. Nag S, Cardenes H, Chang S et al. Proposed guidelines forimage-based intracavitary brachytherapy for cervical carcino-ma: report from Image-Guided Brachytherapy Working Group.Int J Radiat Oncol Biol Phys 2004; 60: 1160-1172.
6. Pötter R, Haie-Meder C, Van Limbergen E et al. Recommen-dations from gynecological (GYN) GEC ESTRO working group(II); concepts & terms in 3D image based treatment planningin cervix cancer brachytherapy – 3D dose volume parametersand aspects of 3D image based anatomy, radiation physics,radiobiology. Radiother Oncol 2006: 78: 67-77.
7. American joint Committee on Cancer, AJCC cancer stagingmanual. 5th ed. Lippincott-Raven, Philadelphia 1997, pp. 259-273.
8. Fung AYC. C-Arm imaging for brachytherapy source recon-struction: Geometrical Accuracy. Med Phys 2002; 29: 724-726.
9. Cuijpers JP. Clinical use of a non-isocentric C-arm unit for online film less reconstruction of brachytherapy applicators.Radiother Oncol 2001; 61: 200-209.
10. Grigsby P, Georgiou A, Williamsons J et al. Anatomic varia-tion of gynaecologic brachytherapy prescription points. Int J Radiat Oncol Biol Phys 1993; 27: 725-729.
11. Thomadsen B, Shahabi, Stitt J et al. High dose rate intracavi-tary brachytherapy for carcinoma of the cervix: the MadisonSystem: II, procedural and physical considerations. Int J Radia tOncol Biol Phys 1992; 24: 349-357.
12. Onal C, Arslan G, Topkan E et al. Comparison of convention-al and CT based planning for Intracavitary brachytherapy forcervical cancer: target volume coverage and organs at risk dos-es. J Exp Clinical Cancer Res 2009; 28: 95.
13. Jamema SV, Saju S, Mahantshetty U et al. Dosimetric evalua-tion of rectum and bladder using image based CT planningand orthogonal radiographs with ICRU 38 recommendationsin Intracavitary brachytherapy. J Med Phys 2008; 33: 3-8.
14. Tan YI, Choo BA, Lee KM. 2D to 3D evaluation of organs atrisk doses in intracavitary brachytherapy for Cervical Cancer.J Contemp Brachyther 2010; 2: 37-43.
15. Schoeppel S, La Vigne M, Martel M et al. Three dimensionaltreatment planning of intracavitary gynaecologic implants:analysis of ten cases and implications for dose specification.Int J Radiat Oncol Biol Phys 1999; 28: 277-283.
16. Barillot I, Horiot J, Maingon P et al. Maximum and Mean blad-der dose defined from ultrasonography: comparison with

Journal of Contemporary Bra chy the ra py (2012/volume 4/number 3)
Kirti Tyagi, Hari Mukundan, Deboleena Mukherjee et al.134
the ICRU reference in gynaecological brachytherapy. RadiotherOncol 1994; 30: 231-238.
17. Hunter R, Wong F, Moore C et al. Bladder base dosage inpatients undergoing intracavitary therapy. Radiother Oncol 1986;7: 189-197.
18. Fellner C, Pötter R, Knocke TH et al. Comparison of radiogra-phy and computed tomography based treatment planning incervix cancer in brachytherapy with specific attention to somequality assurance aspect. Radiother Oncol 2001; 58: 53-62.

Radiochromic filmebased quality assurance for CT-based high-dose-rate
brachytherapy
Saeid Asgharizadeh1,2, Hamed Bekerat1,2, Alasdair Syme1,2, Saad Aldelaijan1,2,
Francois DeBlois1,2, T�e Vuong2, Michael Evans1,3, Jan Seuntjens1, Slobodan Devic1,2,*1Medical Physics Unit, McGill University, Montr�eal, Qu�ebec, Canada
2Department of Radiation Oncology, Jewish General Hospital, McGill University, Montr�eal, Qu�ebec, Canada
3Department of Medical Physics, McGill University Health Centre, Montr�eal, Qu�ebec, Canada
ABSTRACT PURPOSE: In the past, film dosimetry was developed into a powerful tool for external beam
radiotherapy treatment verification and quality assurance. The objective of this work was the devel-
opment and clinical testing of the EBT3 model GafChromic film based brachytherapy quality assur-
ance (QA) system.
METHODS AND MATERIALS: Retrospective dosimetry study was performed to test a patient-
specific QA system for preoperative endorectal brachytherapy that uses a radiochromic film dosim-
etry system. A dedicated phantom for brachytherapy applicator used for rectal cancer treatment was
fabricated enabling us to compare calculated-to-measured dose distributions. Starting from the
same criteria used for external beam intensity-modulated radiation therapy QA (3%, 3 mm), passing
criteria for high- and low-dose gradient regions were subsequently determined. Finally, we inves-
tigated the QA system’s sensitivity to controlled source positional errors on selected patient plans.
RESULTS: In low-dose gradient regions, measured dose distributions with criteria of 3%, 3 mm
barely passed the test, as they showed 95% passing pixels. However, in the high-dose gradient re-
gion, a more stringent condition could be established. Both criteria of 2%, 3 mm and 3%, 2 mm
with gamma function calculated using normalization to the same absolute dose value in both
measured and calculated dose distributions, and matrix sizes rescaled to match each other showed
more than 95% of pixels passing, on average, for 15 patient plans analyzed.
CONCLUSIONS: Although the necessity of the patient-specific brachytherapy QA needs yet to
be justified, we described a radiochromic film dosimetryebased QA system that can be a part of
the brachytherapy commissioning process, as well as yearly QA program. � 2015 American
Brachytherapy Society. Published by Elsevier Inc. All rights reserved.
Keywords: Radiochromic film dosimetry; Quality assurance; Brachytherapy
Introduction
Brachytherapy represents clinical use of small encapsu-
lated radioactive sources at short distances from target vol-
umes for irradiation of both malignant tumors and benign
lesions. Brachytherapy methods vary considerably depend-
ing on their complexity and the scope to which they are
individualized to particular patients. The aim of a brachy-
therapy quality assurance (QA) program should be to maxi-
mize the likelihood that each treatment is administered
accurately, recognizing the clinical intent and that it is per-
formed safely for both the patient and others who might be
exposed to radiation during the treatment. With the ad-
vancements in brachytherapy treatment techniques, the
need for comprehensive QA programs has been recognized
(1), and the number of QA tools and procedures has been
summarized in numerous recommendation documents
(2e4). In addition, within the last decade, the brachyther-
apy community witnessed a widespread use of various im-
age guidance techniques and with it new challenges for
brachytherapy QA programs (5, 6).
The absence of patient-specific QA process in brachy-
therapy is in contrast with the situation for intensity-
modulated radiation therapy (IMRT)where this is a standard
practice. External beamebased IMRT uses specialized
computer-driven technology to create dose distributions that
Received 25 November 2014; received in revised form 9 January 2015;
accepted 8 February 2015.
* Corresponding author. Medical Physics Unit, McGill University,
Jewish General Hospital, 3755 Cote St-Catherine, Montreal, Qu�ebec, Can-
ada H3T 1E2. Tel.: þ1-514-340-8222/2595; fax: þ1-514-340-8642.
E-mail address: [email protected] (S. Devic).
1538-4721/$ - see front matter � 2015 American Brachytherapy Society. Published by Elsevier Inc. All rights reserved.
http://dx.doi.org/10.1016/j.brachy.2015.02.192
Brachytherapy 14 (2015) 578e585

conform to tumor targets with extremely high precision (7).
The generated conformal dose distributions around the tu-
mor can have steep dose gradients at the transition to adja-
cent healthy tissues, similar to those commonly
encountered in brachytherapy treatments. IMRT technique
has been discussed in detail in the literature covering tech-
nical, physical, and clinical aspects (8, 9). Numerous publi-
cations (10e12) outlined the importance of performing
comprehensive acceptance testing, commissioning, and
QA programs for IMRT. A number of methods, techniques,
and detector systems have been designed for patient-specific
IMRT verification purposes, where both dosimetric and
spatial uncertainties are determined (13e15).
From the point of view of the equipment used, brachy-
therapy uses a rather simple technology, in the form of
driving an encapsulated radioactive source to preplanned
dwell positions to spend preplanned dwell times. On the
other hand, brachytherapy procedures involve procedures
performed by different professionals (radiation oncologists,
physicists, therapists, and others), each of which can repre-
sent a potential source of treatment error. Possible mistakes
during the process of CT-based planned brachytherapy pro-
cedures could occasionally lead to serious faults, thus
undermining the treatment goals. Possible adverse effects
may be further amplified as brachytherapy is given over
one or only few fractions (16).
The use of radiochromic films for dose measurements in
brachytherapy dates back to the work by Sayeg and Gregory
(17) who measured surface dose rates with high-dose-rate
(HDR) beta particle ophthalmic applicators. Sharma et al.
(18) used radiochromic films tomeasure the anisotropy func-
tion of iridium-192 (192Ir) brachytherapy sources. Poon et al.
(19) modeled the intracavitary mold applicator used for
endorectal cancer brachytherapy treatments for Monte
Carloesimulated dose calculations subsequently verified
using the external beam therapy (EBT) film model. Evans
et al. (20) introduced aQAcheck for source positioning using
radiochromic instead of traditional radiographic film.
In the case of IMRT-based dose evaluation, the gamma
index is often used to quantify differences between two
dose distributions (21): one calculated by the treatment
planning system (TPS) and another one measured by the
appropriate QA tool. The gamma function quantifies a
quadratic combination of the distance-to-agreement
(DTA) metric between two dose distributions with a point
doseedifference metric. A passing criterion can be estab-
lished that determines that a particular number of evalua-
tion points (usually 95%) satisfy a combined dose
difference (DD) and DTA threshold (e.g., 5%, 2 mm).
Following the same approach as in the case of IMRT QA,
Devic et al. (22) reported on the possible use of radiochro-
mic filmebased dosimetry system for HDR quality control
and commissioning.
In this work, we describe a potential patient-specific QA
system for fractionated preoperativeHDR 192Ir brachytherapy
treatments for rectal cancer patients. The patient-specific QA
tool developed here relies on the radiochromic film dosimetry
system and the gamma evaluation method for quantitative
evaluation of dose distributions. To investigate the eventual
need for patient-specific QA in brachytherapy practice, we
performed a retrospective dosimetry study on 15 CT-based
rectal treatment plans. The QA system described was used
to compare dose distributions calculated using Task Group
No. 43 formalism (23) with those measured by the EBT3
model GafChromic filmebased reference dosimetry system
using a specially designed brachytherapy QA phantom. We
also investigated the QA system’s sensitivity to source posi-
tional errors by introducing intentional and controlled offsets
on selected patient plans.
Methods and materials
Radiochromic film dosimetry protocol
In this study, we used the latest EBT3 GafChromic film
model (Ashland Inc., Wayne, NJ) that provides two signifi-
cant performance improvements over the EBT2 film model.
Although the active layer in the two film models remains the
same, the EBT3 film model has a unique polyester substrate
that prevents the formation of Newton’s rings interference
patterns in images acquired using flatbed document scanners
(24). Furthermore, as opposed to the EBT2 film model that
has an asymmetric structure of layers, the EBT3 film model
has a 30-mm thick active layer sandwiched between two
mated 125-mm thick polyester sheets.
All films used in this work were from the same batch
number (A05151202). The reading device used was a
flatbed Epson Expression 10000XL document scanner (Ep-
son, Nagano, Japan) that provides 48-bit red, green, and
blue images scanned in transmission mode. In this work,
we used reference radiochromic film dosimetry protocol
described by Aldelaijan et al. (25) with the calibration irra-
diation setup using parallel-opposed beam geometry. As
shown, the main advantage of this irradiation setup was
to achieve a greater degree of dose homogeneity in the re-
gion of interest (ROI) within the phantom where the cali-
bration film pieces are positioned. Fifteen calibration film
pieces (200 � 2.500) were exposed to various doses in a range
between 25 and 3000 cGy. All films were scanned with a
127 dpi resolution, which corresponds to 0.2 mm/pixel.
Discontinued FilmQA software (3cognition LLC, version
2.0.1215) was used to analyze irradiated and 24 h postexpo-
sure scanned film pieces, and based on the anticipated dose
range used in this study (0e30 Gy), we decided to use the
green color channel (25). We also tested the latest triple-
channel film analysis approach (26) using the FilmQAPro
(Ashland, Inc., Wayne, NJ) software.
Figure 1 shows the calibration curve (a), as well as the
uncertainty vs. error analysis (b) for the reference radio-
chromic film dosimetry system used in this work. As ex-
pected, dose errors (calculated as the difference between
known and calculated dose) and dose uncertainties (sum
579S. Asgharizadeh et al. / Brachytherapy 14 (2015) 578e585

of experimental and fitting uncertainties (25)) are higher at
lower dose values. The larger dose errors at lower dose
values will eventually result in more significant discrep-
ancies between calculated and measured doses within
low-dose regions when gamma function is calculated. The
uncertainty vs. error analysis (Fig. 1, b) suggests that the ra-
diochromic film dosimetry system used in this work is
consistent with its one sigma uncertainty estimate because
the error points are larger than the uncertainty values in less
than 33% of cases and provides a one sigma uncertainty
better than 3% in a dose range of up to 30 Gy.
HDR brachytherapy QA phantom
Design of a solid water phantom with an intracavitary
mold applicator (Nucletron, Veenendaal, The Netherlands)
positioned at its center is shown in Fig. 2. The applicator
is made of silicon rubber and has a length of 28 cm, a
24 mm diameter, and a flexible cylindrical shape. Eight cath-
eters are placed within its circumference around a central
cavity designed to accommodate a tandem catheter for gyne-
cological brachytherapy applications. The brachytherapy QA
phantom consists of four solid water slabs (Fig. 2). One slab
has dimensions of 30 � 30 � 2 cm3, and the second one has
dimensions of 30� 30� 5 cm3, and the two slabs are milled
to accommodate the applicator in the center. Two additional
slabs of solid water with dimensions 30 � 30 � 5 cm3 are
added above and below to provide full scattering conditions.
According to the latest American Association of Physicists
in Medicine Task Group No. 43 update (23), every point
of calculation and/or measurement must be surrounded by
at least 5 cm of water-equivalent material. In designing the
phantom depicted in Fig. 2, we made sure that every film
measurement point within the ROI, defined in the next sec-
tion, was surrounded by at least 5 cm of solid water material.
Finally, the two central slabs of solid water are attached
together with plastic screws to assure that the applicator
would not move during dose delivery.
During QA measurements, two sheets of EBT3 model
GafChromic film were placed 2 cm above and 5 cm below
the center of the applicator to measure dose distributions
within high- and low-dose gradient regions, respectively.
To ensure films were positioned inside the phantom in a
reproducible manner, we used a permanent marker to draw
an area that defines the film size on two slabs of solid water.
Radiochromic filmebased brachytherapy QA analysis
Figure 3 outlines basic steps in the proposed radiochro-
mic filmebased brachytherapy QA system that mimics the
well-established IMRT QA procedure using the same
dosimetry system. The three-dimensional dose distribution
of each treatment plan was recalculated with brachytherapy
treatment planning software using a CT image data set of
the QA phantom. Dwell times and dwell positions for each
plan were re-entered manually to the QA (mock) plan
created within Masterplan (version 4.1; Nucletron, Veenen-
daal, The Netherlands). Two planar dose distributions posi-
tioned at 2 cm below and 5 cm above the center of the
applicator were exported as a Digital Imaging and Commu-
nications in Medicine dose file and subsequently imported
into FilmQA software (Fig. 3a).
Next, the scanned (digitized) film images created using
the mock plan was imported as Tiff files into the FilmQA
software (Fig. 3b) and coregistered to the calculated dose
distribution. Alignment is achieved by lining up permanentFig. 1. (a) Calibration curve and (b) dose error vs. total uncertainty for the
reference radiochromic film dosimetry system used in this work.
Fig. 2. High-dose-rate brachytherapy phantom for rectal cancer patients.
Applicator is centered in the phantom. Two GafChromic films are posi-
tioned 2 cm below and 5 cm above the center of the applicator. Film di-
mensions not to scale.
580 S. Asgharizadeh et al. / Brachytherapy 14 (2015) 578e585

fiducial marks on the phantom (drawn by permanent
marker and aligned to the first dwell position of the appli-
cator) to fiducial marks (created using a permanent marker)
on the film sheet. However, because of several sources of
uncertainties in this method (estimated to be within
1 mm) during gamma function analysis, we used manual
dose adjustment option (with a step size of 0.1 mm) to
maximize passing rate of the function by moving film dose
distribution with respect to calculated one, assuming that
the shifts are not larger than 1 mm.
Before comparing the two dose distributions using the
gamma function (Fig. 3c), the scanned film image is con-
verted into an absolute dose image using previously estab-
lished calibration curve. To reduce the level of noise in film
measurements because of low-dose values measured (usu-
ally away from the center of the dose distribution), gamma
function calculations were confined to an ROI, defined as
an area with doses in excess of 30% of the maximum dose
calculated by the TPS.
For this study,we selected treatment plans for 15 rectal can-
cer patients treated preoperatively with HDR brachytherapy.
The treatment is delivered in four daily fractions (with a
prescription dose of 6.5 Gy to the target volume per fraction)
within the four consecutive days after the CT simulation and
treatment planning. Before each treatment fraction, the appli-
cator is inserted into the rectal lumen, and a radiograph is taken
for comparison with the reference digitally reconstructed
radiograph, created based on planning CT. Comparison of
the two radiographs is carried out to determine corrections
(if any) needed to assure that the treatment plan, created using
planningCT, is delivered to the target in a reproduciblemanner
during all treatment fractions. Details of this image-guided
brachytherapy (IGBT) technique have been described in de-
tails previously (26). For most of the IGBT techniques
(rectum, head and neck, breast, surface), fractionation allows
for eventual implementation of patient-specific QA because
the time between CT simulation and first treatment fraction
is usually 1 day, as it is the case for IMRT. However, a large
number of brachytherapy procedures (gynecology, prostate,
and esophagus) are adaptive (daily imaging and planning
before treatment delivery) and do not provide enough time
for such QA programs. Instead, the adaptive brachytherapy
techniques may benefit from the implementation of in vivo
patient-specific QA (27). On the other hand, taking into
Fig. 3. The procedure for the comparison of the measured dose distribution with the calculated one. (a) Measured netOD distribution converted to dose
image. (b) Calculated dose distribution converted to dose image. (c) Two dose images are coregistered and compared.
581S. Asgharizadeh et al. / Brachytherapy 14 (2015) 578e585

account the relative technical simplicity of brachytherapy dose
delivery and recent reporting on the usefulness of patient-
specificQA for IMRT (28), additional retrospective dosimetry
studies (similar to ours) may prove that in vivo patient-specific
QA could be the only meaningful path toward brachytherapy
quality care improvement for fractionated IGBT as well.
When choosing treatment plans for this study, we tried
to avoid repetitive combinations of channels in the appli-
cator to collect plans covering different dose distributions.
Although most treatment plans created and delivered use
only three channels, we have made sure these are distrib-
uted in our sample group around all aspects around the
applicator (ANT, POST, LT, and RT). In addition, we also
included three plans (ANT, POST, and LT) with four cath-
eters. For each treatment plan, we compared the calculated
planar dose distributions with measured ones using the
gamma function method, which combines two mapping
criteria of DDs and DTAs. In this work, we altered the cri-
terion for DD to be 1%, 2%, and 3%, whereas the criterion
for DTA was changed to be 1, 2, and 3 mm.
Commonly in IMRT QA practice, both measured and
calculated dose distributions are converted to relative dose
images being normalized to the origin point set at the center
of the calculated dose distribution matrix. However, such
method provides comparison (in terms of the gamma func-
tion passing criteria) of relative dose distributions only. In
the case of an incorrectly used activity, for dose calculation
such a comparison would not be detected by such a system.
In the case of IMRT QA, this problem was alleviated by the
use of ionization chamber measurements in parallel to the
film measurement within the same phantom. To test the
ability of the radiochromic film system in providing com-
parison between absolute dose distributions, we calculated
gamma function by normalizing both calculated and
measured dose distributions to the very same absolute dose
value equal to the maximum dose taken from the calculated
dose distribution, the later one assumed to be a reference.
Only in such a way, can the two dose distributions be
compared in terms of absolute dose if the gamma function
is used for comparison.
Another technical detail frequently overlooked in the
process of IMRT QA is the difference in pixel resolutions
between measured (with film) and calculated (with TPS)
dose distributions. In our case, we have used the scanning
pixel size of 0.2 mm/pix (commonly used during our IMRT
QA), whereas the pixel size in the calculated dose distribu-
tion was 2 mm/pix. To assess the impact of different pixel
sizes of dose distributions used for gamma function calcu-
lation, we had also resampled the film-measured dose dis-
tribution of 0.2 to 2 mm/pix.
Finally, to investigate the sensitivity of our filmebased
brachytherapy QA system to positional errors of the 192Ir
source, we selected three patient plans and introduced
deliberate errors of 1, 2, 3, and 5 mm, for one dwell posi-
tion, in one channel at the treatment console and delivered
the erred plan to the QA phantom containing radiochromic
films. Measured dose distributions were then compared
with the calculated one for a given treatment plan. The re-
sulting change in average passing pixels (APPs) of the
gamma maps will be used to describe the sensitivity of
our QA system to this intentional positional error.
Results and discussion
Gamma evaluation for high- and low-dose regions
Table 1 summarizes the average values of passing pixels
(APP) for high- and low-dose gradient areas, respectively.
The first column within a given dose gradient area corre-
sponds to APP when dose distributions were normalized
to the center values separately (corresponding to relative
dose distribution comparison via gamma map), and
measured and calculated dose matrices had different pixel
sizes. The second column (labeled renormalized) corre-
sponds to APP of gamma functions calculated using rela-
tive dose distributions in two dose images (calculated and
measured) normalized to the very same dose value (abso-
lute dose comparison) corresponding to the maximum ab-
solute dose value of dose distribution calculated within
the plane containing the film. The third column for both
dose gradient regions corresponds to the gamma function
calculated based on absolute dose comparison and the mea-
surement dose image rescaled to match the pixel size of the
calculated dose image. Finally, the last column for both
dose gradient regions incorporates the triple-channel radio-
chromic film dosimetry method (29).
Results presented in Table 1 suggest that the variation of
the DTA parameter has more influence on gamma map
passing pixels in the high-dose gradient area (film at plane
2 cm from the center of the applicator). In contrast, it can
be seen that the DD parameter will have more influence
on the percentage of the passing pixels in a low-dose
gradient region (film at plane 5 cm from the center of the
applicator). On the other hand, introduction of dose distri-
bution normalization to the same dose value (absolute dose
comparison) slightly improves the APP in the high-dose
gradient region, contrary to the trend in the low-dose
gradient region. This might be caused by the fact that the
uncertainty in absolute dose measured with the film de-
creases as the dose is increased (25). Rescaling of the
high-resolution dose measurements image to calculated
low-resolution dose image resulted in an overall reduction
in APP for all cases. In the case of the FilmQA software,
and in other commercially available software packages,
the calculated low-resolution dose distribution image is
oversampled to match the high resolution of the film mea-
surement. Our results confirm previously published data
(30, 31) that such an approach may lead to an unjustified
overconfidence in the calculated gamma function. Although
the scanning resolution of the film image should be as close
as possible to the dose calculation grid size, one should at
least match the high-resolution image to the low-resolution
582 S. Asgharizadeh et al. / Brachytherapy 14 (2015) 578e585

one, and not vice versa. Introduction of the triple-channel
method leads to a significant increase in the pixel passing
rate within low-dose gradient region when compared with
the rescaled images approach, albeit still below 95%,
showing that the method improves dose measurements
analysis in dose regions with higher noise levels. In the
high-dose gradient region, the impact of triple channel ap-
pears to be less significant, yet achieving the 95% passing
rate for 1%, 3 mm criterion.
Positional source errors measurements
Figure 4 shows the percentage of APPs for the gamma
function calculated using different DTA parameters
affected by introducing positional errors for one dwell po-
sition of 1, 2, 3, and 5 mm in 3 selected patients. On
average, plans had 56 dwell positions over three channels,
with 2.5-mm step size. This figure further suggests that in
the high-dose region, the introduction of positional errors
greater than 1 mm leads to a significant reduction of the
passing pixel rate. Although the introduction of a 1-mm
source shift had no significant impact on the percentage
of passing pixels for 3%, 3 mm criteria, even this smallest
error was already registered by more stringent 3%, 2 mm
criteria resulting in a significant drop in passing pixels from
100% to 85%. Figure 4 also reveals that a source positional
error of 2 mm decreased the percentage of passing pixels
significantly well below 60% for all the DD/DTA combina-
tions tested, indicating that the system described in this
work can detect positional errors larger than 1 mm.
Summary of radiochromic filmebased QA system for
brachytherapy
Figure 5 represents the summary of the proposed radio-
chromic film dosimetry QA system. The system relies on an
initial scanning of the QA phantom and established calibra-
tion curve for a given radiochromic film dosimetry system.
For every new radiochromic film batch, a new calibration
curve has to be created. The end-to-end test starts with
the transfer of the treatment plan onto a CT data set of
Table
1
APPsforadifferentcombinationofDTA
andDD
criteria
inhigh(film
at2cm
)andlow-dose
gradientregion(film
at5cm
)
Criteria
High-dose
gradientregion(film
at2cm
)Low-dose
gradientregion(film
at5cm
)
DD,DTA
Original
Renorm
alized
Renorm
alized
&rescaled
Renorm
alized
&rescaled
&triple
channel
Original
Renorm
alized
Renorm
alized
&rescaled
Renorm
alized
&rescaled
&triple
channel
1%,1mm
65.3
76.5
51.7
32.3
65.1
52.1
24.6
22.2
1%,2mm
85.3
91.9
81.9
81.5
79.4
63.3
38.9
46.2
1%,3mm
92.2
96.8
94.3
95.3
86.9
70.5
54.1
71.4
2%,1mm
73.1
85.5
70.2
62.3
76.2
62.9
39.3
43.0
2%,2mm
89.5
94.9
88.5
92.9
85.7
70.9
50.1
62.9
2%,3mm
95.1
97.8
97.2
97.2
90.9
75.8
62.1
83.2
3%,1mm
79.9
92.4
83.6
79.8
83.9
70.8
54.8
68.1
3%,2mm
92.4
96.9
94.4
96.0
89.6
77.1
62.4
83.6
3%,3mm
95.9
98.6
98.4
98.2
95.3
81.1
70.1
92.0
APPs5
averagepassingpixels;
DTA
5distance
toagreem
ent;DD
5dose
difference.
Fig. 4. Effect of positional errors in average passing pixels in high-dose
region.
583S. Asgharizadeh et al. / Brachytherapy 14 (2015) 578e585

the QA phantom and recalculation of the dose distribution
that is intended to be delivered to the patient.
The very same plan is also sent to the treatment console
and delivered to radiochromic film sheets placed within the
QA phantom at predefined positions. Dose distribution cor-
responding to the film position is exported from a recalcu-
lated plan and imported into film analysis software together
with the measured dose distribution. Two dose distributions
are subsequently compared using the gamma function.
Conclusions
In thiswork,we tested a radiochromicfilmebasedQApro-
cedure for patient-specific QA of HDR brachytherapy. Two
filmswere positioned at 2 cmbelow and 5 cmabove the center
of an endorectal brachytherapy applicator within a QA phan-
tom. These two films were used to study the behavior of the
QA system in low- and high-dose gradient regions.
The gamma evaluation method was used to evaluate
dose distributions for the case of preoperative endorectal
brachytherapy treatments based on radiochromic film
dosimetry. In low-dose gradient regions, measured dose
distributions with criteria of 3%, 3 mm barely passed the
test as they showed 95% passing pixels for the oversampled
and relative dose distribution comparison. However, in the
high-dose gradient region, a more stringent condition could
be established. Both criteria of 2%, 3 mm and 3%, 2 mm
with gamma function calculated using normalization to
the same absolute dose value in both measured (using
triple-channel method) and calculated dose distributions
and matrix sizes rescaled to match lower resolution (calcu-
lated dose image) showed more than 95% pixels passing on
average for 15 patient plans used.
We also demonstrated that the QA system described when
used in conjunction with preoperative endorectal HDR
brachytherapy is sensitive to source positional errors. We
investigated the effect of the positional errors on the
percentage of passing pixels and concluded that introducing
a positional error for one dwell position within one channel
larger than 1 mm will decrease the average percentage of
the passing pixels at a level that is significant and detectable.
In this work, we described a radiochromic filmebased
brachytherapy QA system, which could be used as a
patient-specific QA tool if the treatment protocol allows
for a sufficient time and resources to undertake all the steps
similar to well-established IMRT QA. However, the neces-
sity of patient-specific QA program in brachytherapy
should be assessed with regard to the ongoing discussion
whether the very same patient-specific QA programs should
be continued and/or changes for IMRT toward process-
specific QA program. Additional retrospective dosimetry
studies (similar to this one) may prove that in vivo
patient-specific QA could be the only meaningful path to-
ward brachytherapy quality care improvement for both
IGBT and adaptive CT-based fractionated brachytherapy
techniques. On the other hand, the system described in this
work could be readily used for regular QA tests (e.g., after
a source change) and/or during the process of commis-
sioning of the new brachytherapy program in the clinic.
Acknowledgments
This work was supported by the Natural Sciences and
Engineering Research Council of Canada Contract No.
386009. SD is a Senior Research Scientist supported by
the Fonds de Recherche en Sant�e du Qu�ebec 26856.
References
[1] Slessinger E, Grigsby PW,Williams J. Improvements in brachytherapy
quality assurance. Int J Radiat Oncol Biol Phys 1989;16:497e500.
[2] Nath R, Anderson LL, Meli JA, et al. Code of practice for brachyther-
apy physics: Report of the AAPM Radiation Therapy Committee
Task Group No. 56. Med Phys 1997;24:1557e1598.
[3] Valentin J. Prevention of high-dose-rate brachytherapy accidents.
ICRP Publication 97. Ann ICRP 2005;35:1e51.
Fig. 5. Summary of the proposed radiochromic filmebased brachytherapy quality assurance (QA) system.
584 S. Asgharizadeh et al. / Brachytherapy 14 (2015) 578e585

[4] Butler WM, Merrick GS. Clinical practice and quality assurance
challenges in modern brachytherapy sources and dosimetry. Int J Ra-
diat Oncol Biol Phys 2008;71:S142eS146.
[5] Williamson JF. Current brachytherapy quality assurance guidance:
Does it meet the challenges of emerging image-guided technologies?
Int J Radiat Oncol Biol Phys 2008;71:S18eS22.
[6] Cormack RA. Quality assurance issues for computed tomography-,
ultrasound-, and magnetic resonance imaging-guided brachytherapy.
Int J Radiat Oncol Biol Phys Phys 2008;71:S136eS141.
[7] Bortfeld T, Schmidt-Ullrich R, De Neve W, et al. Image-guided
IMRT. Berlin, Germany: Springer; 2006. p. 1041.
[8] Webb S. The physical basis of IMRT and inverse planning. Br J Ra-
diol 2003;76:678e689.
[9] Staffurth JA. Review of the clinical evidence for intensity-modulated
radiotherapy. Clin Oncol 2010;22:643e657.
[10] Van Esch A, Bohsung J, Sorvari P, et al. Acceptance tests and quality
control (QC) procedures for the clinical implementation of intensity
modulated radiotherapy (IMRT) using inverse planning and the
sliding window technique: Experience from five radiotherapy depart-
ments. Radiother Oncol 2002;65:53e70.
[11] Van Zijtveld M, Dirkx MLP, de Boer HCJ, et al. Dosimetric pre-
treatment verification of IMRT using an EPID; clinical experience.
Radiother Oncol 2006;81:168e175.
[12] Warkentin B, Steciw S, Rathee S, et al. Dosimetric IMRT verification
with a flat-panel EPID. Med Phys 2003;30:3143e3155.
[13] Low DA, Harms WB, Mutic S, et al. A technique for the quantitative
evaluation of dose distributions. Med Phys 1998;25:656e661.
[14] DeWagter C.QA-QC of IMRTdEuropean perspective. Image-guided
IMRT. Berlin, Heidelberg, Germany: Springer; 2006. p. 117e128.
[15] Molineu A, Followill DS, Balter PA, et al. Design and implementa-
tion of an anthropomorphic quality assurance phantom, for
intensity-modulated radiation therapy for the Radiation Therapy
Oncology Group. Int J Radiat Oncol Biol Phys 2005;63:577e583.
[16] Thomadsen B, Lin SW, Laemmrich P, et al. Analysis of treatment de-
livery errors in brachytherapy using formal risk analysis techniques.
Int J Radiat Oncol Biol Phys 2003;57:1492e1508.
[17] Sayeg JA, Gregory RC. A new method for characterizing beta-ray
ophthalmic applicator sources. Med Phys 1991;18:453e461.
[18] Sharma SD, Bianchi C, Conte L, et al. Radiochromic film measure-
ment of anisotropy function for high-dose-rate Ir-192 brachytherapy
source. Phys Med Biol 2004;49:4065e4072.
[19] Poon E, Reniers B, Devic S, et al. Dosimetric characterization
of a novel intracavitary mold applicator for Ir-192 high dose
rate endorectal brachytherapy treatment. Med Phys 2006;33:
4515e4526.
[20] Evans M, Devic S, Podgorsak EB. High dose-rate brachytherapy
source position quality assurance using radiochromic film. Med Dos-
im 2007;32:13e15.
[21] Low DA, Dempsey JF. Evaluation of the gamma dose distribution
comparison method. Med Phys 2003;30:2455e2464.
[22] Devic S, Tomic N, DeBlois F. Brachytherapy TPS QA using EBT
model GafChromic film. Med Phys 2009;36:2528.
[23] Rivard MJ, Coursey BM, DeWerd LA, et al. Update of AAPM Task
Group No. 43 Report: A revised AAPM protocol for brachytherapy
dose calculations. Med Phys 2004;31:633e674.
[24] Reinhardt S, Hillbrand M, Wilkens JJ, et al. Comparison of Gafchro-
mic EBT2 and EBT3 films for clinical photon and proton beams.Med
Phys 2012;39:5257e5262.
[25] Aldelaijan S, Mohammed H, Tomic N, et al. Radiochromic film
dosimetry of HDR 192Ir source radiation fields. Med Phys 2011;
38:6074e6083.
[26] Devic S, Vuong T, Moftah B, et al. Image guided high dose rate en-
dorectal brachytherapy. Med Phys 2007;34:4451e4458.
[27] Tanderup K, Beddar S, Andersen CE, et al. In vivo dosimetry in
brachytherapy. Med Phys 2013;40:070902.
[28] Kry SF, Molineu A, Kerns JR, et al. Institutional patient-specific
IMRT QA does not predict unacceptable plan delivery. Int J Radiat
Oncol Biol Phys 2014;90:1195e1201.
[29] Lewis D, Micke A, Yu X, et al. An efficient protocol for radiochro-
mic film dosimetry combining calibration and measurement in a sin-
gle scan. Med Phys 2012;39:6339e6350.
[30] Nelms BE, Simon JA. A survey on planar IMRT QA analysis. J Appl
Clin Med Phys 2007;8:76e90.
[31] Baileya DW, Nelms EB, Attwood K, et al. Statistical variability and
confidence intervals for planar dose QA pass rates. Med Phys 2011;
38:6053e6064.
585S. Asgharizadeh et al. / Brachytherapy 14 (2015) 578e585


![J ~ staCYLan.DMDproduce a panoramic view from different angles [1-4, 6, 8, 11]. With newer CBCT With newer CBCT machines and software, a CBCT can produce high resolution, more accurate](https://static.fdocuments.in/doc/165x107/5fa8602b20539b297e42f17f/j-produce-a-panoramic-view-from-different-angles-1-4-6-8-11-with-newer-cbct.jpg)