IN-PROGRESS REVIEW DRAFT · 2019. 5. 24. · TARGET MARKET OPPORTUNITIES IN ASIA FOR ORANGES AND...
44
TARGET MARKET OPPORTUNITIES IN ASIA FOR ORANGES AND MANDARINS Part of Asia Market Success, April 2016 IN-PROGRESS REVIEW DRAFT Pre-release copy of significant commercial value to industry Document contains incomplete & in-progress research for comment For named reviewer/firm only; do not duplicate or distribute RECIPIENT FIRM
Transcript of IN-PROGRESS REVIEW DRAFT · 2019. 5. 24. · TARGET MARKET OPPORTUNITIES IN ASIA FOR ORANGES AND...
TARGET MARKET OPPORTUNITIES IN ASIA FOR ORANGES AND MANDARINS Part of Asia Market Success, April 2016
IN-PROGRESS REVIEW DRAFT Pre-release copy of significant commercial value to industry Document contains incomplete & in-progress research for comment For named reviewer/firm only; do not duplicate or distribute
RECIPIENT
FIRM
IINNHHEERREENNTT LLIIMMIITTAATTIIOONNSS This work was commissioned by the Department of Agriculture and Food Western Australia (DAFWA), with funding through the State Government’s Royalties for Regions program and prepared by Coriolis. This work is based on secondary market research, analysis of information available or provided to Coriolis by our client, and a range of interviews with industry participants and industry experts. Coriolis have not independently verified this information and make no representation or warranty, express or implied, that such information is accurate or complete. Projected market information, analyses and conclusions contained herein are based (unless sourced otherwise) on the information described above and on Coriolis’ judgement, and should not be construed as definitive forecasts or guarantees of future performance or results. Neither Coriolis nor its officers, directors, shareholders, employees or agents accept any responsibility or liability to readers or recipients of this report other than DAFWA or people other than DAFWA who rely upon it (described below as Recipients) with respect to this document. Coriolis wishes to draw Recipients’ attention to the following limitations of the Coriolis document “Target Market Opportunities in Asia for the Western Australian Premium Products” (the Coriolis Document) including any accompanying presentation, appendices and commentary (the Coriolis Commentary): a. Coriolis has not been asked to independently verify or audit the information or material provided to it by or on behalf of the Client or any of the parties involved in the project; b. the information contained in the Coriolis Document or any Coriolis Commentary has been compiled from information and material supplied by third party sources and publicly available information which may (in part) be inaccurate or incomplete; c. Coriolis makes no representation, warranty or guarantee to Recipients, whether express or implied, as to the quality, accuracy, reliability, currency or completeness of the information provided in the Coriolis Document and any Coriolis Commentary or that reasonable care has been taken in compiling or preparing them; d. the analysis contained in the Coriolis Document and any Coriolis Commentary are subject to the key assumptions, further
qualifications and limitations included in the Coriolis Document and Coriolis Commentary, and are subject to significant uncertainties and contingencies, some of which, if not all, are outside the control of Coriolis; and e. any Coriolis Commentary accompanying the Coriolis document is an integral part of interpreting the Coriolis document. Consideration of the Coriolis document will be incomplete if it is reviewed in the absence of the Coriolis Commentary and Coriolis conclusions may be misinterpreted if the Coriolis document is reviewed in absence of the Coriolis Commentary. Coriolis is not responsible or liable in any way for any loss or damage incurred by any person or entity other than DAFWA relying on the information in, and the Recipient unconditionally and irrevocably releases Coriolis from liability for loss or damage of any kind whatsoever arising from, the Coriolis document or Coriolis Commentary including without limitation judgements, opinions, hypothesis, views, forecasts or any other outputs therein and any interpretation, opinion or conclusion that the Recipient may form as a result of examining the Coriolis document or Coriolis Commentary. The Coriolis document and any Coriolis Commentary may not be relied upon by the Recipient, and any use of, or reliance on that material by the Recipient is entirely at their own risk. Coriolis shall have no liability for any loss or damage arising out of any such use. AACCCCEESSSSIIBBIILLIITTYY Coriolis seeks to support the widest possible audience for this research. This document has been designed to be as accessible to as many users as possible. Any person – with or without any form of disability – should feel free to call the authors if any of the material cannot be understood or accessed. We welcome the opportunities to discuss our research with our readers and users. All photos used in this discussion document were either (1) purchased by Coriolis from a range of stock photography providers as documented, (2) received written permission to use Southern
Forest Food Council photo or (3) are low resolution, complete product/brand for illustrative purposes used under fair dealing/fair use for both “research and study” and “review and criticism”. Our usage of them complies with Australian law or their various license agreements (© Dollar Photo Club). CCOOPPYYRRIIGGHHTT Copyright © Western Australian Agriculture Authority, 2016 IIMMPPOORRTTAANNTT DDAAFFWWAA DDIISSCCLLAAIIMMEERR The Chief Executive Officer of the Department of Agriculture and Food and the State of Western Australia and their employees and agents (collectively and individually referred to below as DAFWA) accept no liability whatsoever, by reason of negligence or otherwise, arising from any use or release of information in this report or any error, inaccuracy or omission in the information. DAFWA does not make any representations or warranties about its quality, accuracy, reliability, currency, completeness or suitability for any particular purpose. Before using the information, you should carefully evaluate these things. The information is general in nature, is not tailored to the circumstances of individuals or businesses, and does not constitute financial, taxation, legal, business or management advice. We recommend before making any significant financial or business decisions, you obtain such advice from appropriate professionals who have taken into account your individual circumstances and objectives. The information in this report should not be presumed to reflect or indicate any present or future policies or decisions by the Government of Western Australia.
2
FFIINNAALL vv110000;; AApprriill 22001166

SCREENING OVERVIEW In Phase One of the Target Market Opportunities in Asia for WA Premium Products Report (TMO Report), extensive import/export trade data was fed through a multi-stage screening process to “hone-in” on potential opportunities for Western Australia; stakeholder interviews also fed into this process
3
STRUCTURE OF MULTI-STAGE SCREENING PROCESS USED IN THIS PROJECT Model; 2016
INDIVIDUAL FIRM ROLE & RESPONSIBILITY STAGE I STAGE II STAGE III STAGE IV
PLATFORM PRODUCT POSITIONING TARGET MARKET
FIT WITH WA
WA INDUSTRY-GOOD RESEARCH
9 PLATFORMS
679 TRADE CODES
47 QUAL/QUANT
SCREENS
Project does not attempt to address firm-level operational or executional activities: - R&D
- Product development
- Sourcing & supply chain
- Production & operations
- Marketing & branding
- Sales & sales structure
- Capital structure
- Negotiation
- Distributor appointment
20 OPPORTUNITIES
YOU ARE
HERE
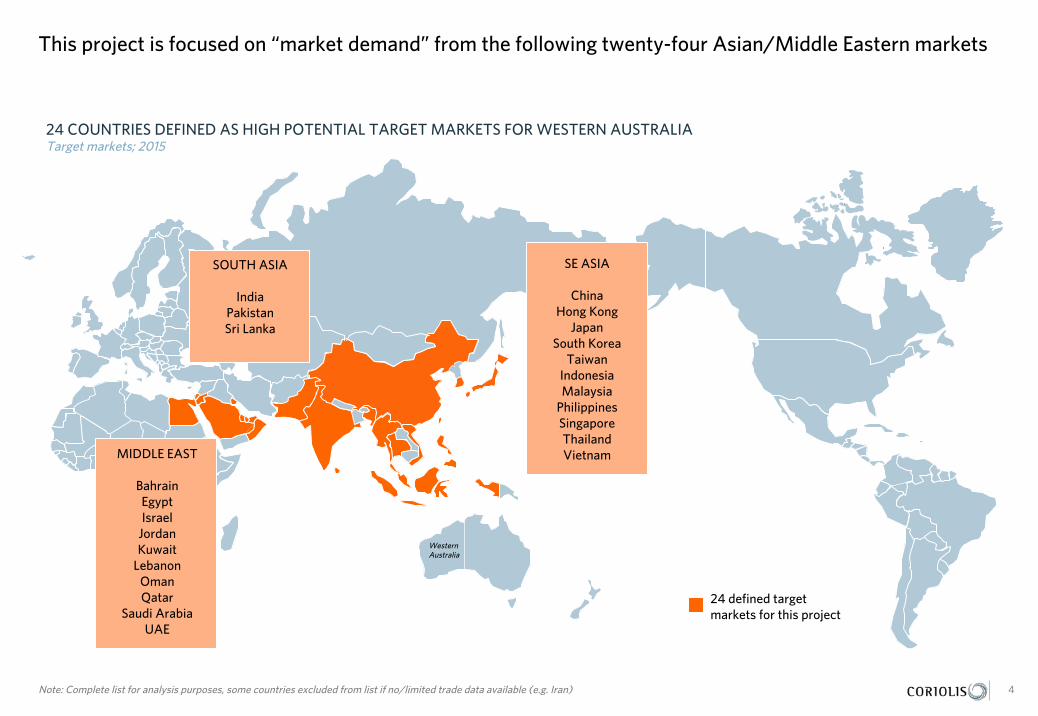
4 This project is focused on “market demand” from the following twenty-four Asian/Middle Eastern markets
Note: Complete list for analysis purposes, some countries excluded from list if no/limited trade data available (e.g. Iran)
24 COUNTRIES DEFINED AS HIGH POTENTIAL TARGET MARKETS FOR WESTERN AUSTRALIA Target markets; 2015
MIDDLE EAST
Bahrain Egypt Israel
Jordan Kuwait
Lebanon Oman Qatar
Saudi Arabia UAE
24 defined target markets for this project
4
SOUTH ASIA
India Pakistan Sri Lanka
Western Australia
SE ASIA
China Hong Kong
Japan South Korea
Taiwan Indonesia Malaysia
Philippines Singapore Thailand Vietnam

PRODUCT PROFILE
HS Code 080510/080520
Product Oranges, mandarins, clementine & citrus hybrids, fresh or dried
Out-of-scope Lemons, limes, grapefruit; oranges and mandarins that are frozen, cooked, pureed, preserved; juices, peel, baby foods, supplements, etc. as all are covered under other screened trade codes
Origin Malay Archipelago, first cultivated in China around 2500 BC
Example ingredients
Oranges, mandarins
Forms/usage - Healthy, convenient snack, especially for children - Gift giving - Ingredient in Middle Eastern Cuisines - Juicing - Flavouring in confectionary
Drivers of consumer/market success
- Healthy (vitamin C)
- Convenient self packaged snack
- Traditional fruit of many of the markets
- Gift giving culture
WHAT IS THE PRODUCT? Oranges & mandarins emerged in Phase I as one of twenty “high growth, high potential” opportunities for Western Australia; they are citrus fruit that are consumed fresh, juiced and used as an ingredient
5 Source: photo credit (Dollar Photo); Coriolis analysis
PRODUCT OVERVIEW Example; 2016

DOCUMENT STRUCTURE
What is the strategic situation in the market?
In this environment, what is the opportunity for Western Australia?
Who are the potential in-market partners?
Who are the key firms in Western Australia capable of delivering?
6

Western Australia is well-positioned to expand orange & mandarin exports to Asia, though focus on key high value markets is required
7
- Asian orange & mandarin imports are rising, with import value growth being driven by expanding tonnage and increasing average FOB (free-on-board) prices
- Asian & Middle Eastern orange and mandarin imports come from five main suppliers – China, the USA, Egypt, South Africa and Australia
- China, the USA and Egypt stand out for driving orange/mandarin import value growth in Asia & the Middle East
- China leads in absolute volume growth while Spain stands out for rate of growth
- Average FOB price to target Asian markets vary by supplier, with China leading at $1.33/kg; Australia sells at an average of -21% discount to China
- Oranges & mandarins go to a wide number of the target markets, with no single country predominating; China is a relatively small importer
- Growth in orange & mandarin imports is broad based and coming from multiple markets
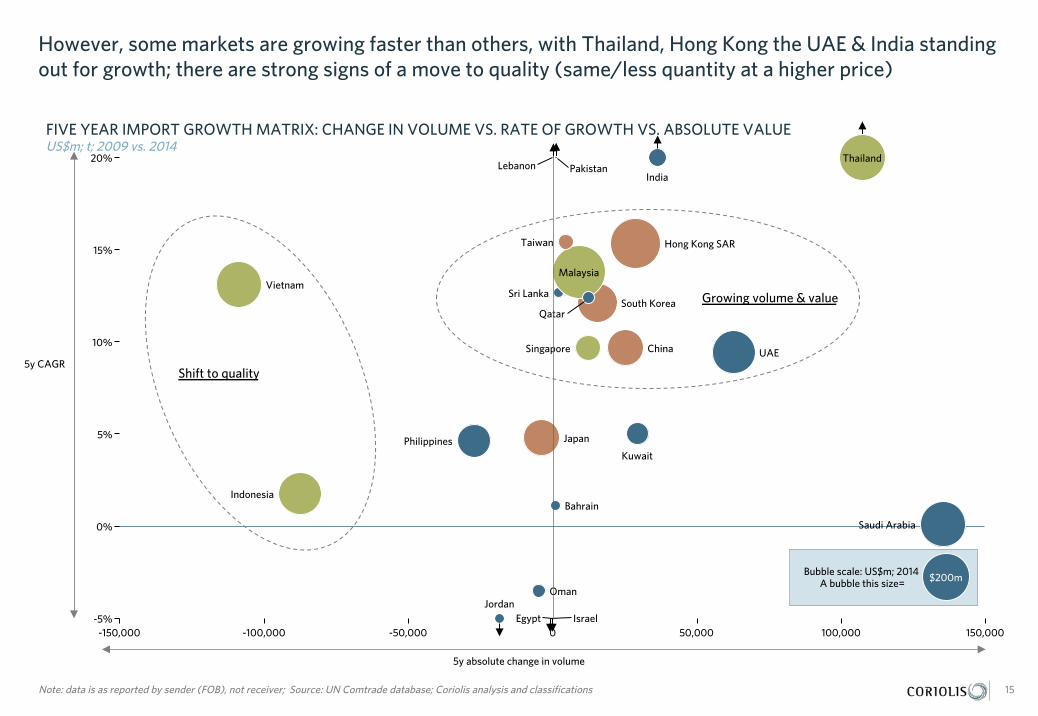
- However, some markets are growing faster than others, with Thailand, Hong Kong the UAE & India standing out for growth; there are strong signs of a move to quality (same/less quantity at a higher price)
- Average orange/mandarin import prices vary by region, with East & South East Asia paying more than the Middle East; Thailand and South Korea stand out as large markets that pay well
- Imported orange/mandarin consumption and aggregate imports appear partially driven by income per capita; a number of markets appear to have long-run penetration upside
- Market share varies by country; Australia is stronger predominantly in East Asia; China really only achieving high penetration in poorer countries (e.g. Philippines, Thailand, Indonesia)
- Western Australia has opportunities for orange & mandarin export growth across a range of Asian markets
- Data supports new high value, premium orange & mandarin opportunities being initially launched in (1) Singapore, (2) Hong Kong and (3) Japan
- As a “Straw Man” for discussion, we propose a export market roll-out plan
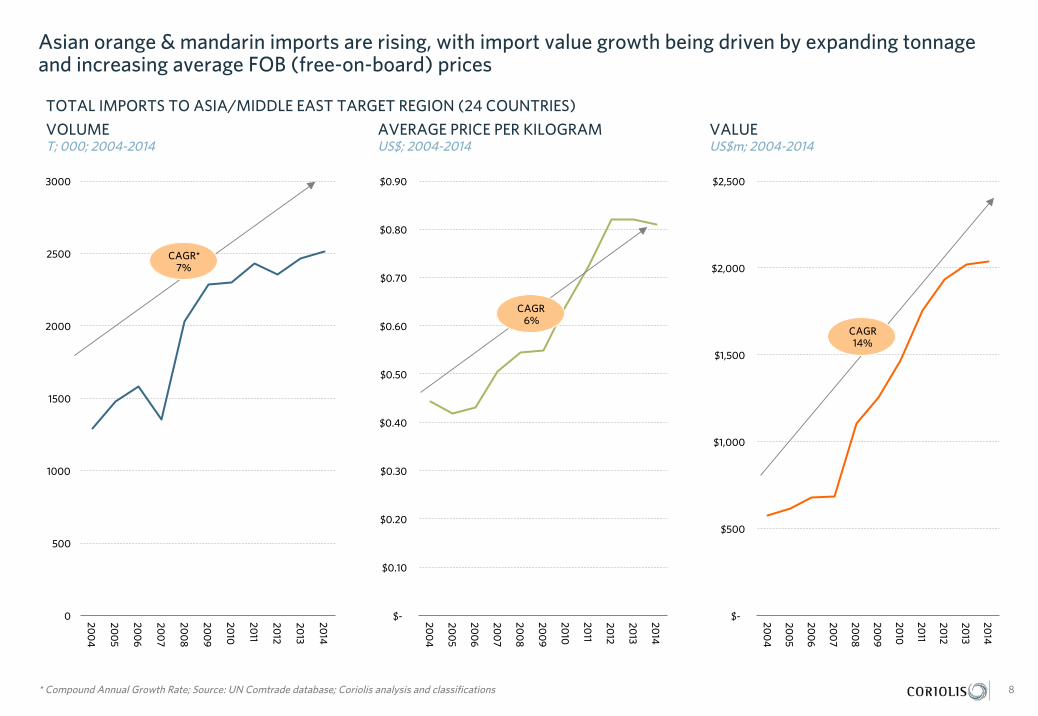
Asian orange & mandarin imports are rising, with import value growth being driven by expanding tonnage and increasing average FOB (free-on-board) prices
0
500
1000
1500
2000
2500
3000
200
4
200
5
200
6
200
7
200
8
200
9
2010
2011
2012
2013
2014
8 * Compound Annual Growth Rate; Source: UN Comtrade database; Coriolis analysis and classifications
VOLUME T; 000; 2004-2014
$-
$0.10
$0.20
$0.30
$0.40
$0.50
$0.60
$0.70
$0.80
$0.90
200
4
200
5
200
6
200
7
200
8
200
9
2010
2011
2012
2013
2014
AVERAGE PRICE PER KILOGRAM US$; 2004-2014
$-
$500
$1,000
$1,500
$2,000
$2,500
200
4
200
5
200
6
200
7
200
8
200
9
2010
2011
2012
2013
2014
VALUE US$m; 2004-2014
CAGR* 7%
CAGR 6%
CAGR 14%
TOTAL IMPORTS TO ASIA/MIDDLE EAST TARGET REGION (24 COUNTRIES)

Asian & Middle Eastern orange and mandarin imports come from five main suppliers – China, the USA, Egypt, South Africa and Australia
9 Note: data is as reported by sender (FOB), not receiver; Source: UN Comtrade database; Coriolis analysis and classifications
EXPORT VALUE BY SUPPLIER TO TARGET REGION US$m; FOB; 2014
Key ME/EU Australasia Key S.H.
Other
E/SE Asia USA
$150 $315 $282 $377 $32 $881
Pakistan $51
Egypt $209
Turkey $13
Other $32
Australia $147
New Zealand $3
South Africa $261
Spain $42
Thailand $7
Hong Kong SAR $65
China $789
Argentina $21
USA $377
Other E/SE Asia $7 Singapore
$12
TOTAL = US$2,038m

China, the USA and Egypt stand out for driving orange/mandarin import value growth in Asia & the Middle East
10 Note: data is as reported by sender (FOB), not receiver; Source: UN Comtrade database; Coriolis analysis and classifications
EXPORT VALUE BY SUPPLIER TO TARGET REGION US$m; FOB; 2004-2014
2005
Pakistan
New Zealand
2004
Turkey
10y ABS
Argentina
Australia
Other
Hong Kong SAR
Other E/SE Asia
South Africa
Thailand
2011 2010 2009
Singapore
China
Spain
2014 2012 2013 2007
USA
2006 2008
Egypt
$50
$30
$83
$51
$74
$66
$89
$51
$117
$140
$39
$66
$150
$3
$2
$177
$3 $1
$1
$8 $6
$6
$16
$3
$142
$26 $23 $30
$12
$1
$1
$147
$191 $7 $65
+$5
+$132
+$7
+$39 +$6
+$40
-$6 +$16
+$27
+$5
+$209
+$717
$1,752
$1,471
$1,931
$2,038 $2,019
$1,253
$618 $573
$682
$1,103
$684
$157
$40
$73
$410 $304
$109 $72
$73 $25
$82
$100
$67
$789 $785
+$80
+$187
-$0
$24
$25
$419 $532
$691
$67
$193
$469
$359
$15
$478
$498
$261
$262
$51
$246
$17
$38
$289
$162
$3
$221
$3
$214
$3 $11 $23
$14
$377
$223
$2
$220
$2
$68
$13
$37
$4
$12
$5
$3 $2
$38
$13 $41
$3
$15
$32
$42
$70
$256
$52
$245
$24
$19
$8
$49
$20
$23
$65
$3
$3
$16 $8
$15
$187
$13
$4
$3
$12 $9
$8
$209
$5
$21
$1
$20
$3
$1
$1
$169
$13
$23
$1
$24
$1
$27
$114
$7
$13
$4
$11
$6
$6
$4
$143
$3
$130
$4
$11 $20 $6 $73
$3
$7
$6
$4
$5 $5
$114
$9 $5
$75
CAGR 14%

China leads in absolute volume growth while Spain stands out for rate of growth
11 Note: data is as reported by sender (FOB), not receiver; Source: UN Comtrade database; Coriolis analysis and classifications
FIVE YEAR EXPORT GROWTH MATRIX: CHANGE IN VALUE VS. RATE OF GROWTH VS. ABSOLUTE VALUE US$m; 2009 vs. 2014
$150 $200 $-50 $400 $350 $50 $250 $0 $100 $300
60%
10%
70%
20%
40%
30%
50%
-10%
0% $200m Egypt
Pakistan
Spain
Turkey
New Zealand
Australia
Other
South Africa
Thailand
Hong Kong SAR
China
Argentina USA
Other E/SE Asia Singapore
5y absolute change in value
5y CAGR
Bubble scale: US$m; 2014 A bubble this size=
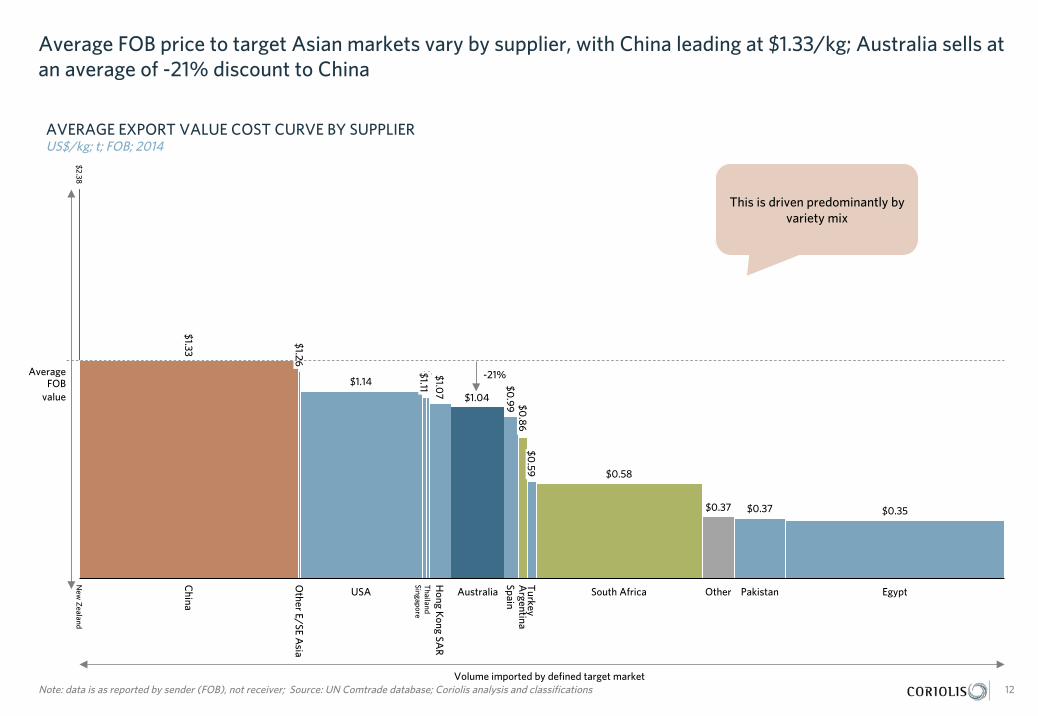
Average FOB price to target Asian markets vary by supplier, with China leading at $1.33/kg; Australia sells at an average of -21% discount to China
12 Note: data is as reported by sender (FOB), not receiver; Source: UN Comtrade database; Coriolis analysis and classifications
AVERAGE EXPORT VALUE COST CURVE BY SUPPLIER US$/kg; t; FOB; 2014
Other E/SE A
sia
Hong K
ong SAR
Pakistan
China
New
Zealand
USA South Africa
Turkey
Singapore
Other
Thailand
Spain
Egypt
Argentina
Australia
$1.10
$0.37
$0.58
$1.11
$0.35 $0.37
$1.33
$1.14
$1.04
$1.26
$2.38
$0.86
$0.59
$1.07
$0.99
Volume imported by defined target market
Average FOB
value
-21%
This is driven predominantly by variety mix
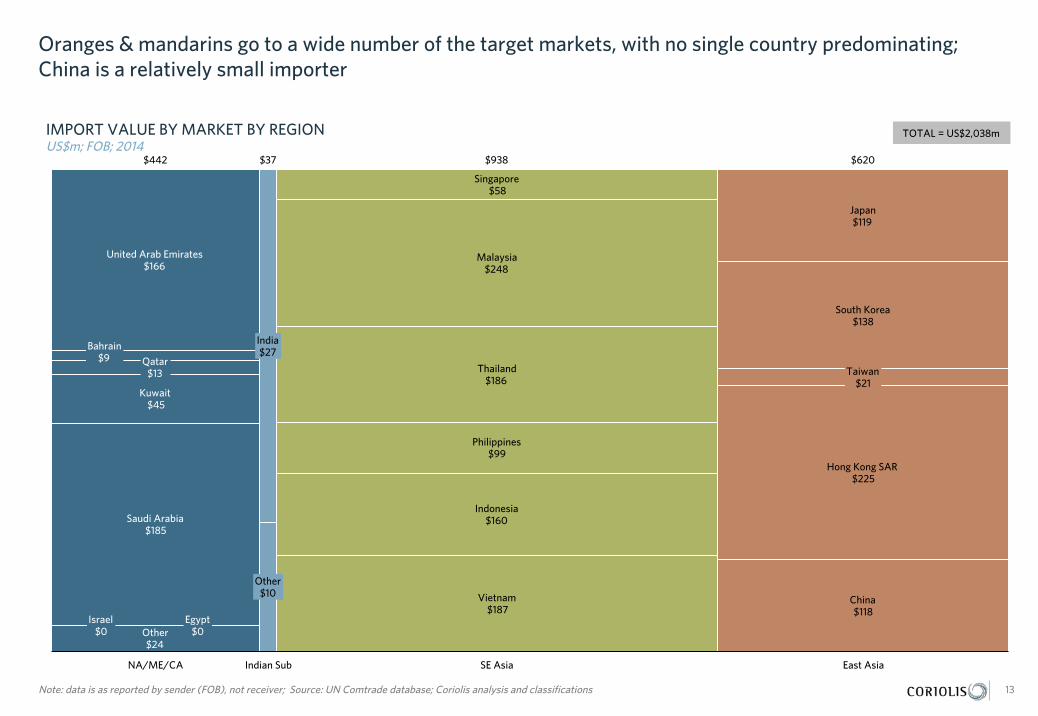
Oranges & mandarins go to a wide number of the target markets, with no single country predominating; China is a relatively small importer
13 Note: data is as reported by sender (FOB), not receiver; Source: UN Comtrade database; Coriolis analysis and classifications
IMPORT VALUE BY MARKET BY REGION US$m; FOB; 2014
NA/ME/CA East Asia Indian Sub SE Asia
China $118
$37 $938 $620
Other $24
Other $10
$442
Israel $0
Egypt $0
Singapore $58
India $27
Saudi Arabia $185
Bahrain $9
United Arab Emirates $166
Kuwait $45
Qatar $13
South Korea $138
Japan $119
Hong Kong SAR $225
Taiwan $21
Vietnam $187
Thailand $186
Malaysia $248
Indonesia $160
Philippines $99
TOTAL = US$2,038m

Growth in orange & mandarin imports is broad based and coming from multiple markets
14 Note: data is as reported by sender (FOB), not receiver; Source: UN Comtrade database; Coriolis analysis and classifications
IMPORT VALUE BY MARKET BY REGION US$m; FOB; 2004-2014
2011 2012 2013 2014
Indonesia
Hong Kong SAR
Philippines
China
Japan
South Korea
Vietnam
Taiwan
Thailand
2008 2010 2009 2005 2004 2007 2006
Singapore
Israel Egypt
Bahrain
Other Ind. Sub
Qatar Kuwait
India Other ME
Malaysia
United Arab Emirates
Saudi Arabia
$10
$14
$38
$46
$10
$45
$11
$34
$7
$44
$6 $9
$21
$94 $115
$13
$89
$9
$11
$35
$15
$28
$20
$13
$18 $65
$185
$105
$180
$96
$186
$58 $94
$146 $0 $173 $0
$0 $0
$119 $57
$197
$53
$138
$14
$47 $52
$224
$207
$78
$219
$119
$162
$159
$185
$12
$682
$618
$3
$166
$1,103
$150
$684
$573 $5
$110
$8
$108
$5
$118
$5 $53
$2,019
$84
$2,038
$29 $29
$46
$1,931
$134
$1,253
$120
$1,471
$106
$1,752
$129
$117
$140
$9
$158
$5
$225
$2
$157
$7
$103
$10
$108
$10
$131
$8
$110
$9
$63
$10
$74
$9
$96
$8
$46 $39
$1 $3
$40
$9
$52
$9
$0
$3
$186
$3 $3
$22
$3
$17
$162
$7
$21
$10
$71
$4
$113
$5
$61
$9
$57
$7
$137
$4
$122
$18
$35
$27
$25
$19
$79
$22
$50
$5
$163
$51
$130
$42
$233
$36
$200
$48
$72 $61
$51
$58
$133
$53
$82
$10
$1 $1 $2
$11
$7
$11
$26 $29
$329
$37
$248
$1
$25 $27 $3
$1
$124
$1
$135
$0
$187
$1
$94
$0
$72
$0
$101
$1
$90
$0
$94
$0
$108
$0
$155
$0
$126
$0
$87 $79
$0
$0
$80
$0
$106 $19
$95
$28
$63
$24
$157
$26
$147
$24
$1 $2
$99
$39 $41 $34
$1
$22
$10 $16
$4
$0
$28 $30
$160 $35
$210
$40
$210
$19
$122 $31
CAGR 14%
Bubble scale: US$m; 2014 A bubble this size=
However, some markets are growing faster than others, with Thailand, Hong Kong the UAE & India standing out for growth; there are strong signs of a move to quality (same/less quantity at a higher price)
15 Note: data is as reported by sender (FOB), not receiver; Source: UN Comtrade database; Coriolis analysis and classifications
FIVE YEAR IMPORT GROWTH MATRIX: CHANGE IN VOLUME VS. RATE OF GROWTH VS. ABSOLUTE VALUE US$m; t; 2009 vs. 2014
20%
-150,000
15%
-50,000 -100,000 150,000
0%
0
5%
10%
100,000 -5%
50,000
$200m
Egypt
UAE
Thailand
Vietnam
Jordan
Japan
South Korea
Lebanon
Kuwait
China
Sri Lanka
Bahrain
Israel
Indonesia
Hong Kong SAR
India
Philippines
Singapore
Saudi Arabia
Qatar
Taiwan
Malaysia
Pakistan
Oman
5y absolute change in volume
5y CAGR Shift to quality
Growing volume & value

Average orange/mandarin import prices vary by region, with East & South East Asia paying more than the Middle East; Thailand and South Korea stand out as large markets that pay well
16 Note: data is as reported by sender (FOB), not receiver; Source: UN Comtrade database; Coriolis analysis and classifications
AVERAGE IMPORT VALUE COST CURVE BY MARKET/REGION US$/kg; t; FOB; 2014
Saudi Arabia
Qatar
Vietnam
China
Bahrain
Malaysia
Singapore
Om
an
Indonesia
Jordan
Pakistan
Taiw
an
Lebanon
UAE
Sri Lanka India
Hong K
ong SAR
South Korea
Thailand
Japan
Egypt Israel
Philippines
Kuwait
$1.15
$0.58
$0.11
$1.13
$0.76
$0.39
$0.51 $0
.69 $0
.54
$1.16
$0.37
$0.4
5
$0.89
$0.85
$0.89
$0.38
$0.4
3
$1.41
$1.63
$1.02
$0.38
$1.21
$1.19
Volume imported
Average import
value
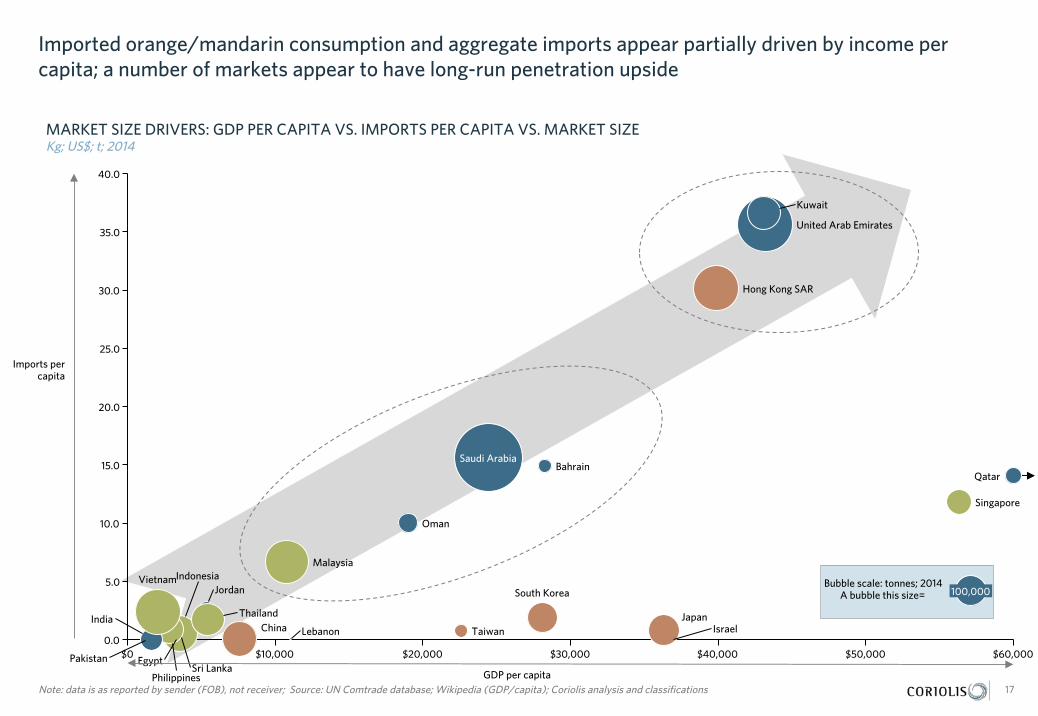
Imported orange/mandarin consumption and aggregate imports appear partially driven by income per capita; a number of markets appear to have long-run penetration upside
17 Note: data is as reported by sender (FOB), not receiver; Source: UN Comtrade database; Wikipedia (GDP/capita); Coriolis analysis and classifications
MARKET SIZE DRIVERS: GDP PER CAPITA VS. IMPORTS PER CAPITA VS. MARKET SIZE Kg; US$; t; 2014
$50,000 0.0
$40,000 $30,000 $60,000
30.0
25.0
$0
40.0
35.0
$10,000 $20,000
5.0
10.0
20.0
15.0
Jordan South Korea
Malaysia
Taiwan
Kuwait
Lebanon China
Sri Lanka
100,000
Bahrain
Israel Japan
Hong Kong SAR
Indonesia Vietnam
Singapore
Thailand
Qatar
India
Saudi Arabia
Philippines
Pakistan Egypt
Oman
United Arab Emirates
GDP per capita
Imports per capita
Bubble scale: tonnes; 2014 A bubble this size=
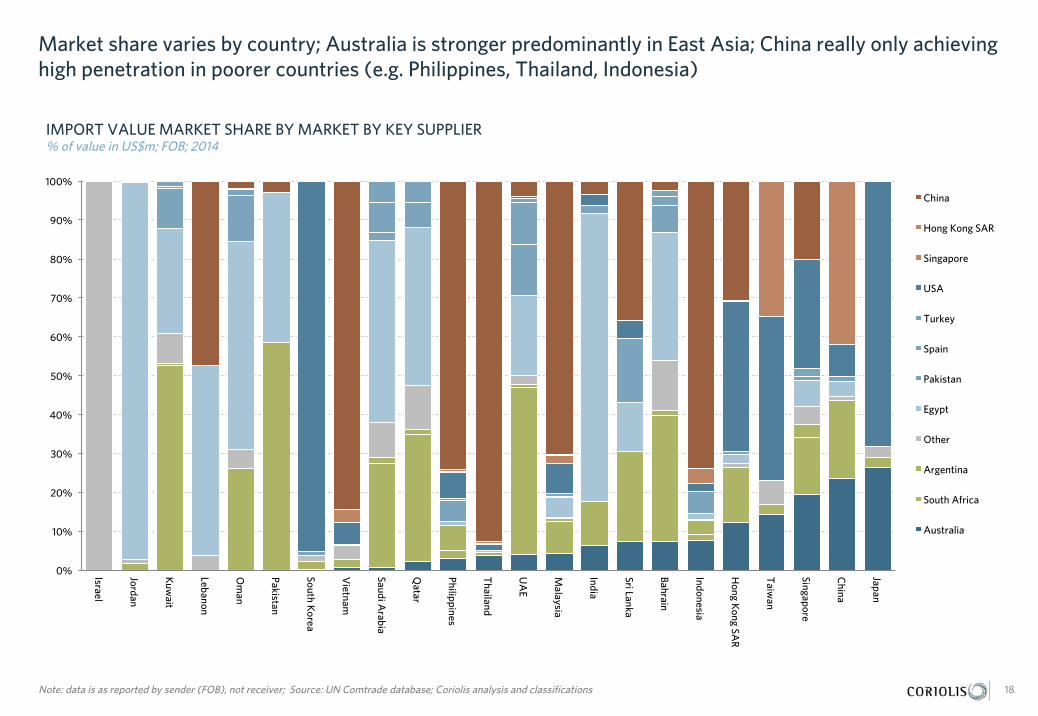
Market share varies by country; Australia is stronger predominantly in East Asia; China really only achieving high penetration in poorer countries (e.g. Philippines, Thailand, Indonesia)
0%
10%
20%
30%
40%
50%
60%
70%
80%
90%
100%
Israel
Jordan
Kuw
ait
Lebanon
Om
an
Pakistan
South Korea
Vietnam
Saudi Arabia
Qatar
Philippines
Thailand
UA
E
Malaysia
India
Sri Lanka
Bahrain
Indonesia
Hong K
ong SAR
Taiw
an
Singapore
China
Japan
China
Hong Kong SAR
Singapore
USA
Turkey
Spain
Pakistan
Egypt
Other
Argentina
South Africa
Australia
18 Note: data is as reported by sender (FOB), not receiver; Source: UN Comtrade database; Coriolis analysis and classifications
IMPORT VALUE MARKET SHARE BY MARKET BY KEY SUPPLIER % of value in US$m; FOB; 2014

Western Australia has opportunities for orange & mandarin export growth across a range of Asian markets
19 Note: data is as reported by sender (FOB), not receiver; Source: UN Comtrade database; Coriolis analysis and classifications
AUSTRALIAN IMPORT VALUE MARKET VS. MARKET VALUE US$m; FOB; 2014
Indonesia
Thailand
South Korea
Qatar
Singapore
Om
an
Malaysia
Saudi Arabia
Bahrain
Jordan Israel
Taiw
an
Pakistan
Lebanon
Philippines
Hong K
ong SAR
UA
E
China
India
Japan
Sri Lanka
Kuw
ait
Vietnam
0%
0%
0
%
14%
24%
6%
4%
3%
0%
19%
4%
1%
2% 1%
7%
0%
7%
12%
26%
8%
4%
0%
Total value of imports
Australian Market share
WA should be able to grow share in
Singapore to around 25%

Bubble scale: US$m; 2014 A bubble this size=
Data supports new high value, premium orange & mandarin opportunities being initially launched in (1) Singapore, (2) Hong Kong and (3) Japan
20 Note: data is as reported by sender (FOB), not receiver; Source: UN Comtrade database; Coriolis analysis and classifications
WHERE TO FOCUS FOR NEW HIGH VALUE, PREMIUM PRODUCTS: AU SHARE VS. AVERAGE VALUE VS. MARKET SIZE % of value; US$; US$m; 2014
$0.00 15% 5% 10% 20% 30% 25% 0%
$0.20
$0.80
$1.40
$1.60
$0.60
$1.20
$1.00
$1.80
$0.40
India
$100
Sri Lanka
Singapore
UAE
Malaysia
Indonesia
Saudi Arabia
Vietnam China
Kuwait
Oman
Bahrain Qatar
Thailand
Taiwan
Israel
Pakistan
Lebanon
Jordan
Hong Kong SAR
South Korea
Japan
Philippines
AU share of total import value
VALUE Average
FOB $/kg 2014 1
3
2 4?
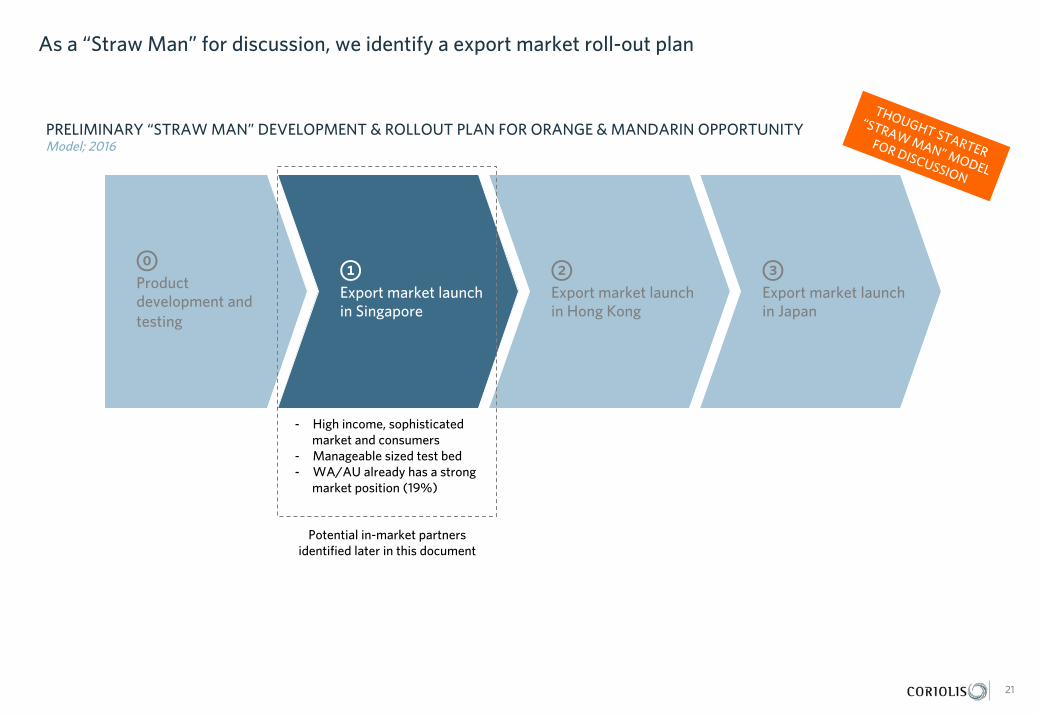
As a “Straw Man” for discussion, we identify a export market roll-out plan
21
PRELIMINARY “STRAW MAN” DEVELOPMENT & ROLLOUT PLAN FOR ORANGE & MANDARIN OPPORTUNITY Model; 2016
1 Export market launch in Singapore
2 Export market launch in Hong Kong
3 Export market launch in Japan
0 Product development and testing
Potential in-market partners identified later in this document
- High income, sophisticated market and consumers
- Manageable sized test bed - WA/AU already has a strong
market position (19%)
DOCUMENT STRUCTURE
What is the strategic situation in the market?
In this environment, what is the opportunity for Western Australia?
Who are the potential in-market partners?
Who are the key firms in Western Australia capable of delivering?
22

Western Australia can grow orange and mandarin exports to Asia, but focus and innovation are required
23
IS THE MARKET DEVELOPED & COMPETITIVE?
- The flow of oranges & mandarins from the farm through to the consumer is relatively straight forward and simple
- Orange prices are competitive in Asia
- Asian markets generally have a much less developed orange and mandarin range and offer than western countries
- “Leading indicator” Western markets strongly suggest depth of range in Asian orange and mandarin markets will increase going forward
- Retailers generally offer a few loose bulk SKU; beyond this range increases (and therefore sales increases) primarily come from increasing the number of prepack SKU
WHAT IS WA CAPABLE OF DELIVERING?
- A wide range of premium, value-adding product attributes emerged from our cross-country retailer survey
- Western Australian citrus producers need to continue to move forward and improve through new products
- Multiple potential positions exist to develop a premium orange and mandarin offer for Asia
- Products from other firms in other markets demonstrate what is possible in terms of developing a premium Western Australian orange and mandarin offer
- There are a wide range of potential product positions or claims available for a premium carrot product from Western Australia targeting Asia
- As a “Straw Man” for discussion, we identify an opportunity for a high value, premium orange or mandarin product with select characteristics for export market launch

HOW IS THE MARKET STRUCTURED? The flow of oranges & mandarins from the farm through to the consumer is relatively straight forward and simple
24 Source: Coriolis
SIMPLIFIED MODEL OF SUPPLY CHAIN: ORANGES & MANDARINS Model; 2016
Retailers
Foodservice & Institutional
Exports
Wholesalers
Distributor(s) (multi-layered in large markets)
Domestic Packer
Agent/Broker/ Distributor
Packer/Processor Sales/Marketing
In-Market Farmer
Logistics Providers
(Airfreight, Seafreight, Trucking)
WA Citrus Packer
Other Australian Packer
WA Farmer
South African Packer
Argentinian Packer
USA Packer
Chinese Packer
Other Packer
Other Asian/ME Packer
This stage branches and adds multiple layers in large markets

WHO IS THE COMPETITION? PRICING Orange prices are competitive in Asia
$0.16
$0.45 $0.45
$0.35
$0.83 $0.83 $0.87
$1.32 $1.35
$0.46 $0.40
$0.63
$0.24
$0.86
$0.69
$1.28
Tesco G
olden Orange
Bagged, Navel (A
U)
Bagged, Navel, Sunkist
Loose, Valencia (SA
)
Loose, Navel (SA
)
Loose, Navel (A
U)
Loose, Navel (A
U)
Loose, large, Late Navel
Loose, large, Navel (U
S)
Sunkist Valencia (A
U)
Bagged, 8 pack
Bagged, 5 pack
First Choice, 8 pack
First Choice, 5 pack
Loose, Navel, Large,
Imported
Loose, Navel
25 Source: Coriolis from store checks
SHELF PRICE PER ORANGE ACROSS SELECT SE ASIAN MARKETS AND AUSTRALIA: ORANGES US$/item; Jan 2016
SELECT SE ASIAN RETAILERS AUSTRALIA
AU AU AU AU
Malaysia Thailand Singapore Hong Kong
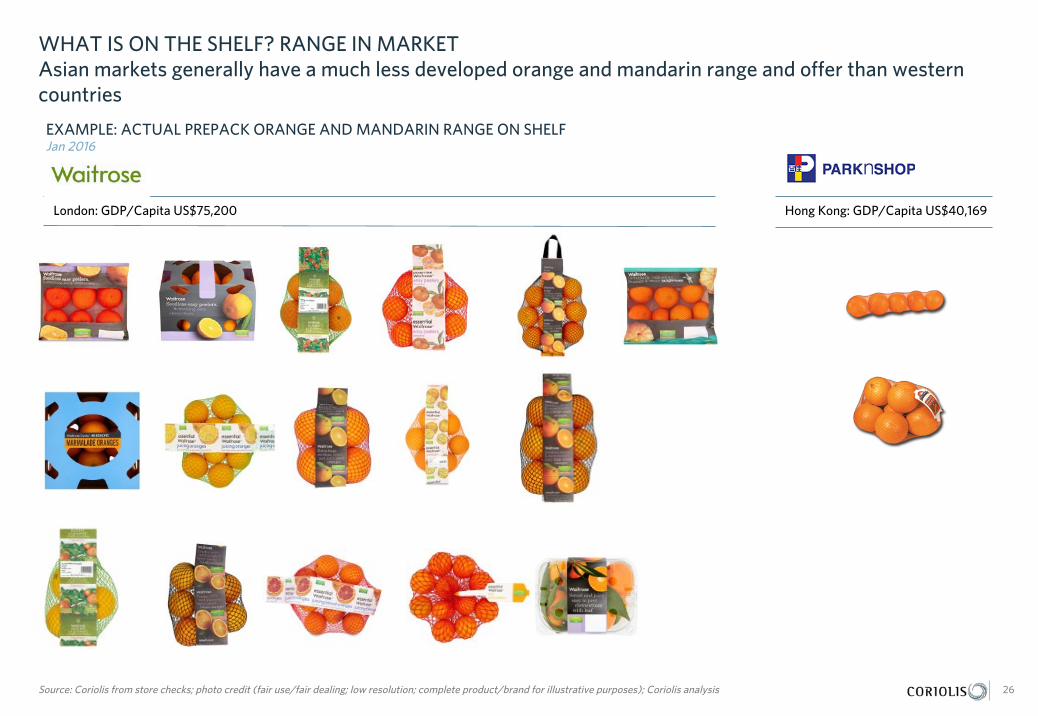
WHAT IS ON THE SHELF? RANGE IN MARKET Asian markets generally have a much less developed orange and mandarin range and offer than western countries
26 Source: Coriolis from store checks; photo credit (fair use/fair dealing; low resolution; complete product/brand for illustrative purposes); Coriolis analysis
EXAMPLE: ACTUAL PREPACK ORANGE AND MANDARIN RANGE ON SHELF Jan 2016
London: GDP/Capita US$75,200 Hong Kong: GDP/Capita US$40,169

IS THE MARKET DEVELOPED & COMPETITIVE? RANGE “Leading indicator” Western markets strongly suggest depth of range in Asian orange & mandarins markets will increase going forward
20
15
13
10
6 6 5
8 7 7
4 3
2
Waitrose (UK)
Tesco (UK)
Sainsbury (UK)
Wegmans (NY)
Safeway (CA)
Coles (AU)
Woolworths (AU)
Fairprice (Sing)
Cold Storage (Sing)
Tesco (TH)
Tesco (MY)
Park'N Shop (HK)
Wellcome (HK)
27 Source: Coriolis from store checks
NUMBER OF LINES ON SHELF: SELECT RETAILERS FROM ACROSS MULTIPLE MARKETS SKU; actual; Jan 2016
SE Asia Anglo-American
Average 5.2 sku/store
Average 10.7 sku/store
2x
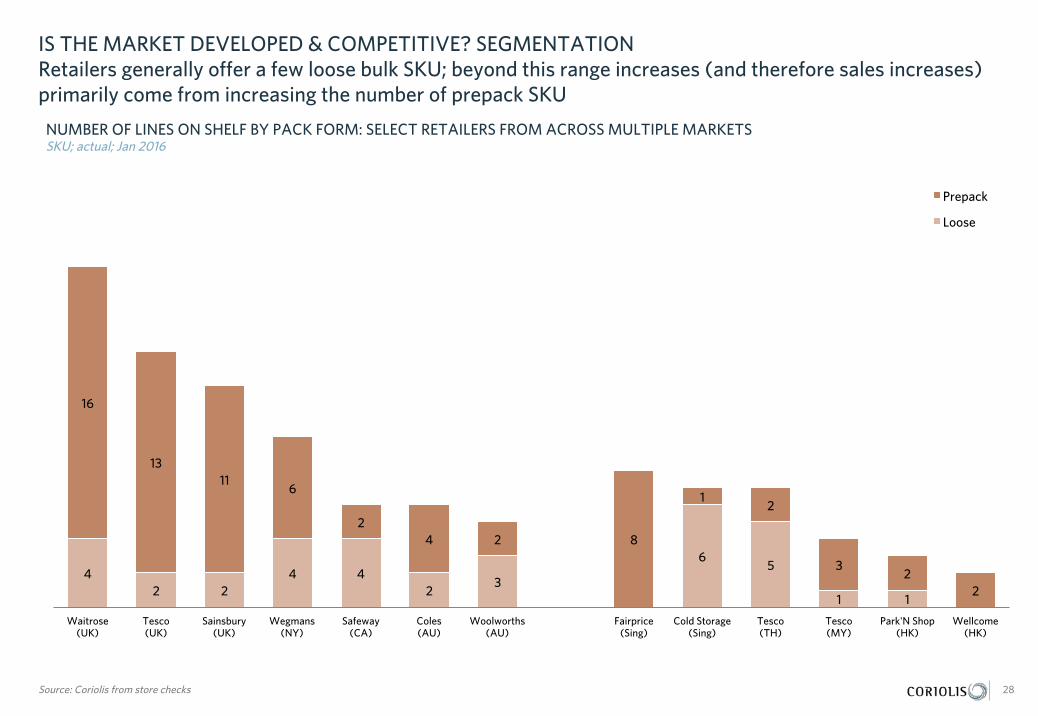
IS THE MARKET DEVELOPED & COMPETITIVE? SEGMENTATION Retailers generally offer a few loose bulk SKU; beyond this range increases (and therefore sales increases) primarily come from increasing the number of prepack SKU
4 2 2
4 4 2
3
6 5
1 1
16
13 11
6
2 4 2 8
1 2
3 2
2
Waitrose (UK)
Tesco (UK)
Sainsbury (UK)
Wegmans (NY)
Safeway (CA)
Coles (AU)
Woolworths (AU)
Fairprice (Sing)
Cold Storage (Sing)
Tesco (TH)
Tesco (MY)
Park'N Shop (HK)
Wellcome (HK)
Prepack
Loose
28 Source: Coriolis from store checks
NUMBER OF LINES ON SHELF BY PACK FORM: SELECT RETAILERS FROM ACROSS MULTIPLE MARKETS SKU; actual; Jan 2016

IS THE MARKET DEVELOPED & COMPETITIVE? PRODUCT ATTRIBUTES A wide range of premium, value-adding product attributes emerged from our cross-country retailer survey
49%
18%
14%
13%
8%
4%
4%
3%
2%
1%
1%
Named variety
Named origin
Easy peeling
Size
Organic
Sweet
Use
Seedless
Family pack
Sumer value
Kids pack
29 Source: Coriolis from store checks
PERCENT OF OBSERVED PRODUCTS ON SHELF MAKING THE CLAIM ON PACK % of SKU; N=106; Jan 2016
- This provide very clear instruction on what product attributes are succeeding the most across markets
- Western Australian citrus producers looking to grow value and share should focus in these areas
- Specifying variety and origin stand out, with approximately 1/2 observed product SKU noting the variety of orange or mandarin
- Survey universe is all products in all listed retailers (across multiple countries)
TAKEAWAYS

WHAT IS WA CAPABLE OF DELIVERING? STRATEGIC DIRECTION Western Australian citrus producers need to continue to move forward and improve through new products
30
SUGGESTED STRATEGIC DIRECTION: WESTERN AUSTRALIAN ORANGES/MANDARINS Model; 2016
Loose, bulk oranges/
mandarins
Everyday prepack
oranges/mandarins
Organic Named gourmet varieties
Sized prepacked
Chinese suppliers are here
WA suppliers are here in Asia
High growth, high potential opportunities
are here
USA & UK suppliers are here
Loose, bulk, variety specified
Unique IP controlled
varieties
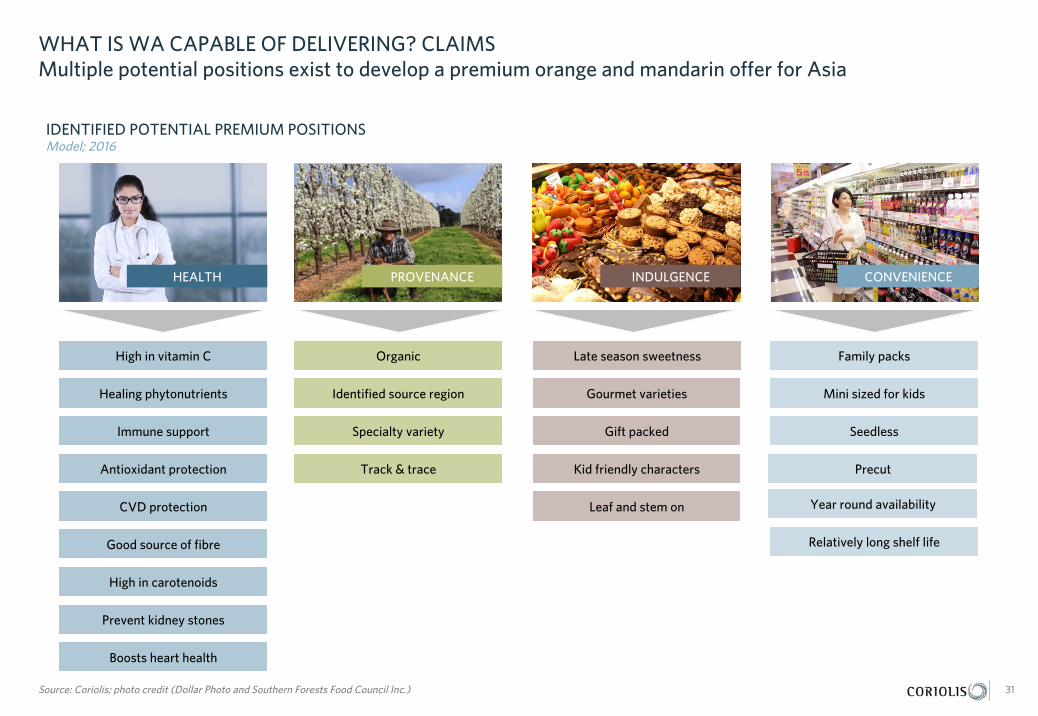
WHAT IS WA CAPABLE OF DELIVERING? CLAIMS Multiple potential positions exist to develop a premium orange and mandarin offer for Asia
31 Source: Coriolis; photo credit (Dollar Photo and Southern Forests Food Council Inc.)
IDENTIFIED POTENTIAL PREMIUM POSITIONS Model; 2016
Organic Family packs High in vitamin C
Identified source region Gourmet varieties Mini sized for kids Healing phytonutrients
Specialty variety Gift packed Seedless Immune support
Track & trace Kid friendly characters Antioxidant protection
CVD protection
Good source of fibre
High in carotenoids
Prevent kidney stones
Precut
Boosts heart health
HEALTH PROVENANCE INDULGENCE CONVENIENCE
Late season sweetness
Leaf and stem on Year round availability
Relatively long shelf life

WHAT IS WA CAPABLE OF DELIVERING? GLOBAL PEERS Products from other firms in other markets demonstrate what is possible in terms of developing a premium Western Australian orange and mandarin offer
32 Source: photo credit (fair use/fair dealing; low resolution; complete product/brand for illustrative purposes); Coriolis analysis
EXAMPLES OF PREMIUM PRODUCTS FROM OTHER MARKETS Select; 2016
Cooks’ Ingredients Sweet and juicy Sweet Mandarins
Marmalade oranges Easy to peel Premium local produce Year of the rabbit
Organic With leaf Direct from tree to trolley Gift packaging for Chinese NY
Vegetarian Vegetarian “Fresh, simple”
Traditional growing region Sustainably grown “Just they way you love it”
Packed on date
Appeal to cuteness
Basket opens into fruit bowl
Sustainable packaging
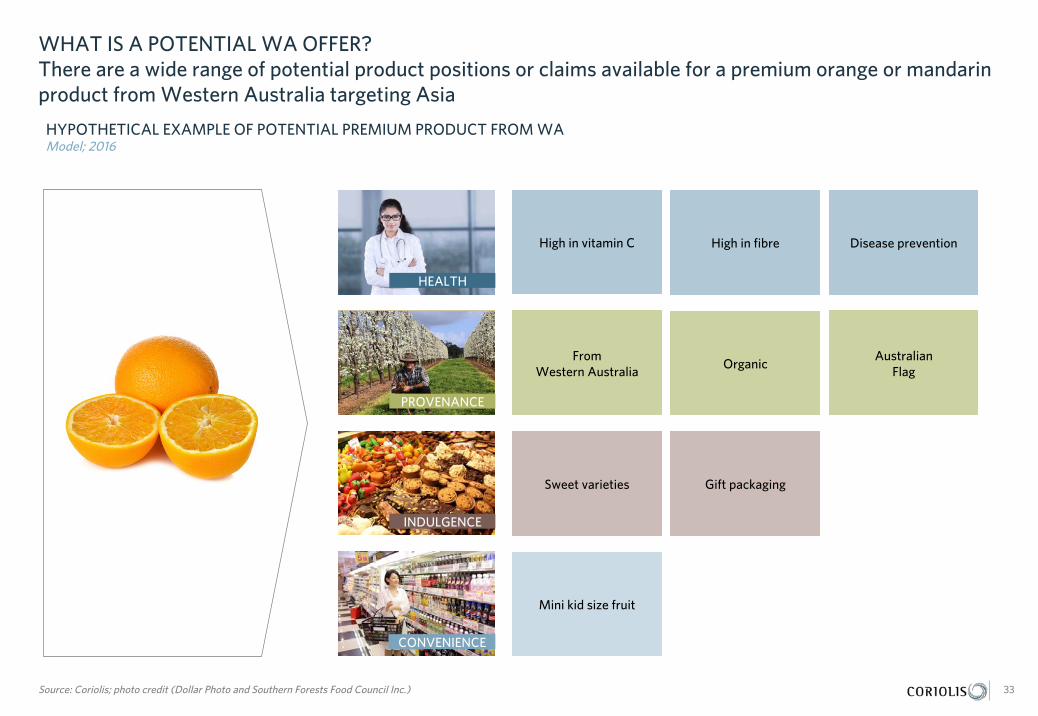
WHAT IS A POTENTIAL WA OFFER? There are a wide range of potential product positions or claims available for a premium orange or mandarin product from Western Australia targeting Asia
33 Source: Coriolis; photo credit (Dollar Photo and Southern Forests Food Council Inc.)
HYPOTHETICAL EXAMPLE OF POTENTIAL PREMIUM PRODUCT FROM WA Model; 2016
High in vitamin C High in fibre
From Western Australia
Organic Australian
Flag
Sweet varieties
Mini kid size fruit
Disease prevention
Gift packaging
HEALTH
PROVENANCE
INDULGENCE
CONVENIENCE

WHAT IS THE IDENTIFIED OPPORTUNITY? As a “Straw Man” for discussion, we identify an opportunity for a high value, premium orange or mandarin product with select characteristics for export market launch
34
PRELIMINARY “STRAW MAN” DEVELOPMENT & ROLLOUT PLAN FOR ORANGE & MANDARIN OPPORTUNITY Model; 2016
CURRENT WA POSITIONING IN ASIA
IDENTIFIED HIGH GROWTH, HIGH VALUE OPPORTUNITY FOR WA
High in vitamin C
From Western Australia Organic
Australian Flag On stem
Convenient packaging
Includes named variety From
Australia Prepack
POTENTIAL FUTURE PRODUCT LINE EXTENSION
Gift packaging
Sweet varieties
Use specific Mini kid sized fruit
Healthy snack
Easy peel
DOCUMENT STRUCTURE
What is the strategic situation in the market?
In this environment, what is the opportunity for Western Australia?
Who are the potential in-market partners?
Who are the key firms in Western Australia capable of delivering?
35
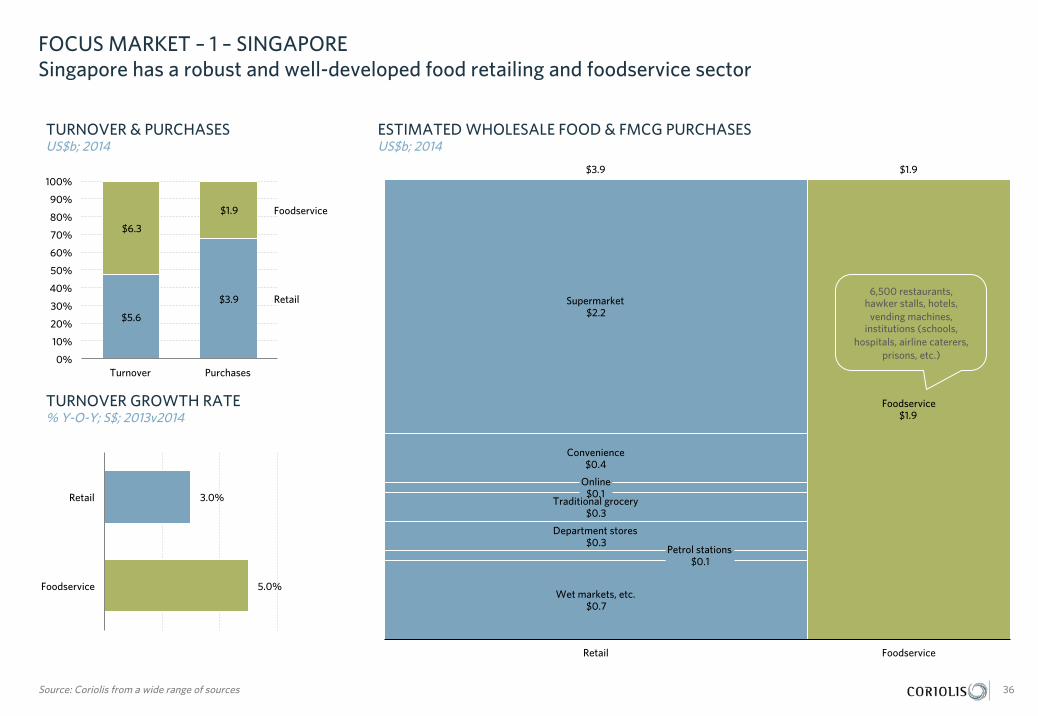
FOCUS MARKET – 1 – SINGAPORE Singapore has a robust and well-developed food retailing and foodservice sector
$5.6
$3.9
$6.3
$1.9
0%
10%
20%
30%
40%
50%
60%
70%
80%
90%
100%
Turnover Purchases
36 Source: Coriolis from a wide range of sources
TURNOVER & PURCHASES US$b; 2014
ESTIMATED WHOLESALE FOOD & FMCG PURCHASES US$b; 2014
Foodservice Retail
$1.9 $3.9
Online $0.1
Traditional grocery $0.3
Supermarket $2.2
Convenience $0.4
Wet markets, etc. $0.7
Foodservice $1.9
Department stores $0.3
Petrol stations $0.1
Foodservice
Retail 6,500 restaurants,
hawker stalls, hotels, vending machines,
institutions (schools, hospitals, airline caterers,
prisons, etc.)
3.0%
5.0%
Retail
Foodservice
TURNOVER GROWTH RATE % Y-O-Y; S$; 2013v2014
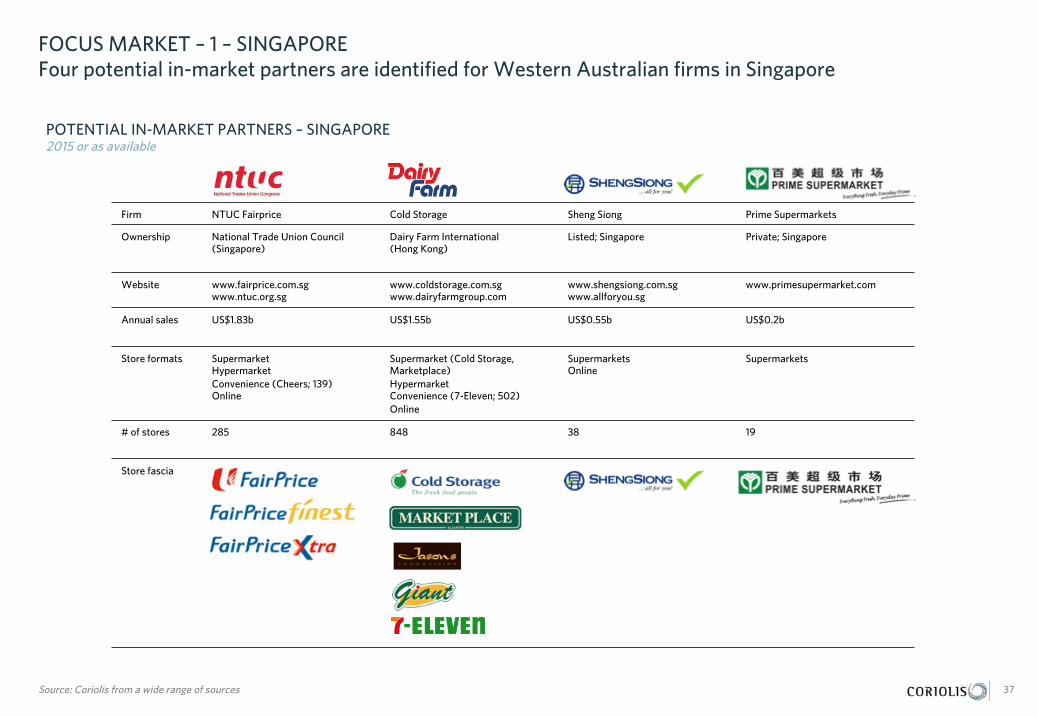
FOCUS MARKET – 1 – SINGAPORE Four potential in-market partners are identified for Western Australian firms in Singapore
Firm NTUC Fairprice Cold Storage Sheng Siong Prime Supermarkets
Ownership National Trade Union Council (Singapore)
Dairy Farm International (Hong Kong)
Listed; Singapore Private; Singapore
Website www.fairprice.com.sg www.ntuc.org.sg
www.coldstorage.com.sg www.dairyfarmgroup.com
www.shengsiong.com.sg www.allforyou.sg
www.primesupermarket.com
Annual sales US$1.83b US$1.55b US$0.55b US$0.2b
Store formats Supermarket Hypermarket Convenience (Cheers; 139) Online
Supermarket (Cold Storage, Marketplace) Hypermarket Convenience (7-Eleven; 502) Online
Supermarkets Online
Supermarkets
# of stores 285 848 38 19
Store fascia
37 Source: Coriolis from a wide range of sources
POTENTIAL IN-MARKET PARTNERS – SINGAPORE 2015 or as available
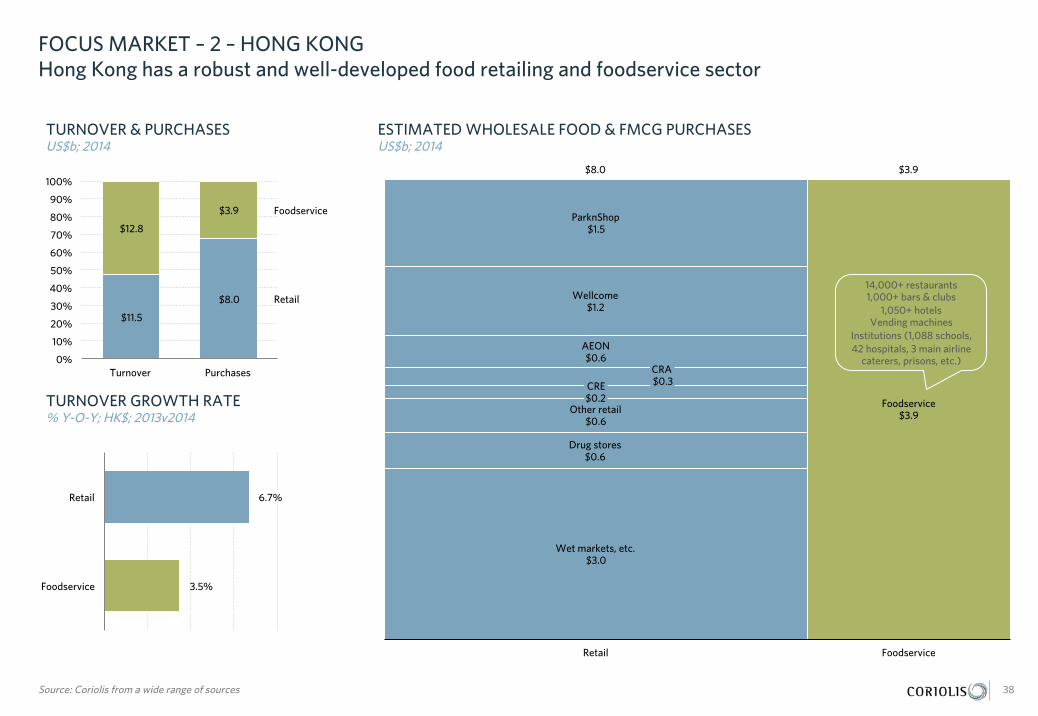
FOCUS MARKET – 2 – HONG KONG Hong Kong has a robust and well-developed food retailing and foodservice sector
$11.5
$8.0
$12.8
$3.9
0%
10%
20%
30%
40%
50%
60%
70%
80%
90%
100%
Turnover Purchases
38 Source: Coriolis from a wide range of sources
TURNOVER & PURCHASES US$b; 2014
ESTIMATED WHOLESALE FOOD & FMCG PURCHASES US$b; 2014
Retail Foodservice
$3.9 $8.0
Foodservice $3.9
CRA $0.3 CRE
$0.2
Wellcome $1.2
AEON $0.6
Drug stores $0.6
Wet markets, etc. $3.0
ParknShop $1.5
Other retail $0.6
Foodservice
Retail 14,000+ restaurants 1,000+ bars & clubs
1,050+ hotels Vending machines
Institutions (1,088 schools, 42 hospitals, 3 main airline
caterers, prisons, etc.)
6.7%
3.5%
Retail
Foodservice
TURNOVER GROWTH RATE % Y-O-Y; HK$; 2013v2014
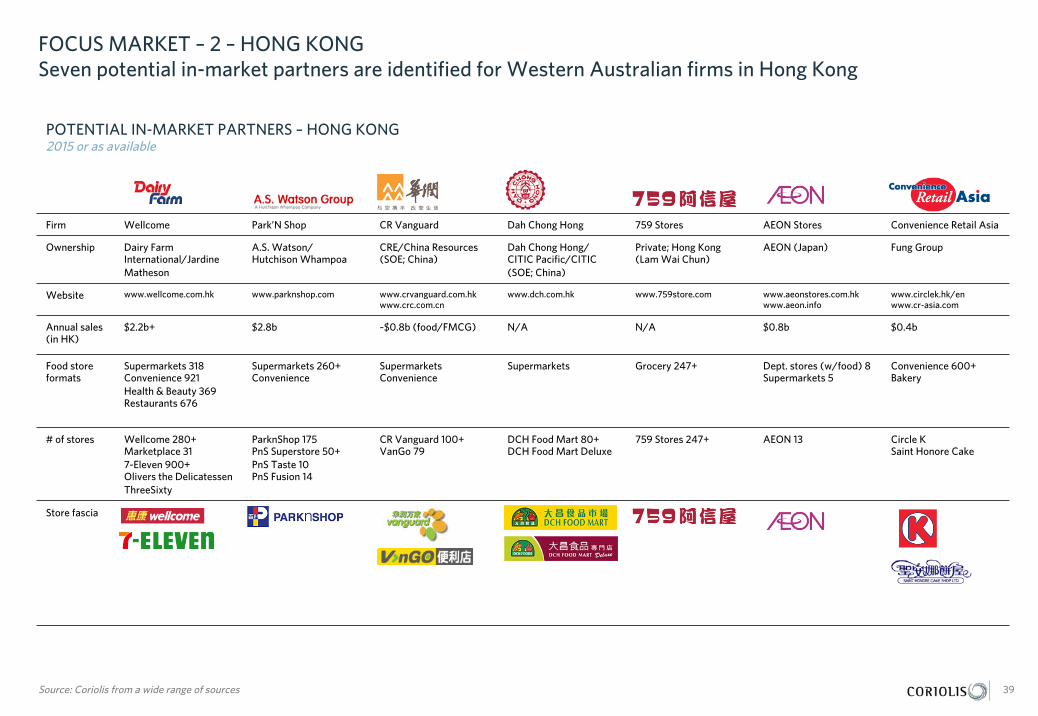
FOCUS MARKET – 2 – HONG KONG Seven potential in-market partners are identified for Western Australian firms in Hong Kong
Firm Wellcome Park’N Shop CR Vanguard Dah Chong Hong 759 Stores AEON Stores Convenience Retail Asia
Ownership Dairy Farm International/Jardine Matheson
A.S. Watson/ Hutchison Whampoa
CRE/China Resources (SOE; China)
Dah Chong Hong/ CITIC Pacific/CITIC (SOE; China)
Private; Hong Kong (Lam Wai Chun)
AEON (Japan) Fung Group
Website www.wellcome.com.hk www.parknshop.com www.crvanguard.com.hk www.crc.com.cn
www.dch.com.hk
www.759store.com www.aeonstores.com.hk www.aeon.info
www.circlek.hk/en www.cr-asia.com
Annual sales (in HK)
$2.2b+ $2.8b ~$0.8b (food/FMCG) N/A N/A $0.8b $0.4b
Food store formats
Supermarkets 318 Convenience 921 Health & Beauty 369 Restaurants 676
Supermarkets 260+ Convenience
Supermarkets Convenience
Supermarkets Grocery 247+ Dept. stores (w/food) 8 Supermarkets 5
Convenience 600+ Bakery
# of stores Wellcome 280+ Marketplace 31 7-Eleven 900+ Olivers the Delicatessen ThreeSixty
ParknShop 175 PnS Superstore 50+ PnS Taste 10 PnS Fusion 14
CR Vanguard 100+ VanGo 79
DCH Food Mart 80+ DCH Food Mart Deluxe
759 Stores 247+ AEON 13 Circle K Saint Honore Cake
Store fascia
39 Source: Coriolis from a wide range of sources
POTENTIAL IN-MARKET PARTNERS – HONG KONG 2015 or as available

FOCUS MARKET – 3 – JAPAN Japan has a robust and well-developed food retailing and foodservice sector
$331
$232
$310
$93
0%
10%
20%
30%
40%
50%
60%
70%
80%
90%
100%
Turnover Purchases
40 Source: Coriolis from a wide range of sources
TURNOVER & PURCHASES US$b; 2014
ESTIMATED WHOLESALE FOOD & FMCG PURCHASES US$b; 2014
Foodservice Retail
Convenience $112.9
$93.0
Small grocers $27.5
Specialists $22.5
Foodservice $93.0
Other grocery $16.6
$287.1
Supermarkets $102.3
Online $5.3
Foodservice
Retail 711,000 restaurants, bars & clubs, 87,927 hotels/motels/etc., vending machines,
institutions (schools, hospitals, airline
caterers, prisons, etc.)
0.0%
2.4%
Retail
Foodservice
TURNOVER GROWTH RATE % Y-O-Y; JPY; 2013v2014
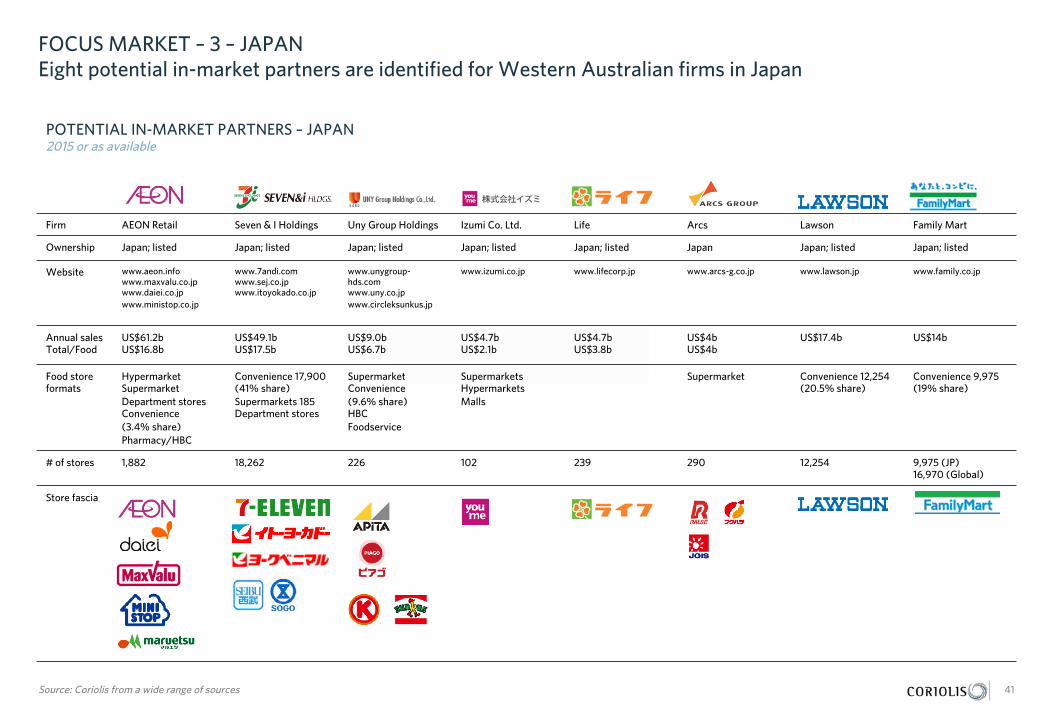
FOCUS MARKET – 3 – JAPAN Eight potential in-market partners are identified for Western Australian firms in Japan
41 Source: Coriolis from a wide range of sources
POTENTIAL IN-MARKET PARTNERS – JAPAN 2015 or as available
Firm AEON Retail Seven & I Holdings Uny Group Holdings Izumi Co. Ltd. Life Arcs Lawson Family Mart
Ownership Japan; listed Japan; listed Japan; listed Japan; listed Japan; listed Japan Japan; listed Japan; listed
Website www.aeon.info www.maxvalu.co.jp www.daiei.co.jp www.ministop.co.jp
www.7andi.com www.sej.co.jp www.itoyokado.co.jp
www.unygroup-hds.com www.uny.co.jp www.circleksunkus.jp
www.izumi.co.jp
www.lifecorp.jp www.arcs-g.co.jp www.lawson.jp
www.family.co.jp
Annual sales Total/Food
US$61.2b US$16.8b
US$49.1b US$17.5b
US$9.0b US$6.7b
US$4.7b US$2.1b
US$4.7b US$3.8b
US$4b US$4b
US$17.4b US$14b
Food store formats
Hypermarket Supermarket Department stores Convenience (3.4% share) Pharmacy/HBC
Convenience 17,900 (41% share) Supermarkets 185 Department stores
Supermarket Convenience (9.6% share) HBC Foodservice
Supermarkets Hypermarkets Malls
Supermarket Convenience 12,254 (20.5% share)
Convenience 9,975 (19% share)
# of stores 1,882 18,262 226 102 239 290 12,254 9,975 (JP) 16,970 (Global)
Store fascia
DOCUMENT STRUCTURE
What is the strategic situation in the market?
In this environment, what is the opportunity for Western Australia?
Who are the potential in-market partners?
Who are the key firms in Western Australia capable of delivering?
42

IDENTIFIED WA COMPANIES
43
AGRIFRESH
COSTA GROUP
GINGIN CITRUS
ADDRESS: 12/41 Catalano Ct, Canning Vale, WA 6155 ADDRESS: 45 Orton Rd, Casuarina, WA 6167 ADDRESS: Dooling Road, Neergabby, WA 6503
PHONE: 08 9455 4538 PHONE: 08 9419 5850 PHONE: 0418 944 151
WEBSITE: www.agrifresh.com.au WEBSITE: www.costagroup.com.au WEBSITE: N/A
Sources: Coriolis from a wide range of sources
GOLDEN GROVE ORCHARD
HARVEY CITRUS
MOORA CITRUS
ADDRESS: 1378 Chittering Rd, Lower Chittering, WA 6084
ADDRESS: 7 Fifth Street, Harvey, WA 6220 ADDRESS: 1429 Prices Rd, Moora, WA 6510
PHONE: 08 9571 8074 PHONE: 08 9729 3861 PHONE: 08 9653 1318
WEBSITE: www.goldengroveorchard.com.au WEBSITE: N/A WEBSITE: www.mooracitrus.com
ODEUM FARMS
YAMBELLUP ESTATE
ADDRESS: 34 Catalano Road, Canning Vale, WA 6155 ADDRESS: 399 River Rd, Harvey, WA 6220
PHONE: 08 9256 8100 PHONE: 0417 911 534
WEBSITE: www.odeum.com.au WEBSITE: www.yambellup.com.au

AUSTRALIA Coriolis Australia Pty Ltd
PO Box 5831 St Georges Terrace
Perth, WA 6831 Australia
+61 8 9468 4691
NEW ZEALAND Coriolis (New Zealand) Limited
PO Box 90-509 Victoria Street West
Auckland, 1142 New Zealand
+64 9 623 1848
www.coriolisresearch.com
Coriolis is the leading Australasian management consulting firm specialising in the wider food value chain. We work on projects in agriculture, food and beverages, consumer packaged goods, retailing & foodservice. In other words, things you put in your mouth and places that sell them. WHERE WE WORK We focus on the Asia Pacific region, but look at problems with a global point-of-view. We have strong understanding of, and experience in, markets and systems in Australia, China, Japan, Malaysia, New Zealand, Singapore, South Korea, Thailand, the United Kingdom and the U.S. We regularly conduct international market evaluations and benchmarking. WHAT WE DO We help our clients assemble the facts needed to guide their big decisions. We develop practical, fact-based insights grounded in the real world that guide our clients decisions and actions. We make practical recommendations. We work with clients to make change happen. We assume leadership positions to implement change as necessary. HOW WE DO IT All of our team have worked across one-or-more parts of the wider food value chain, from farm-to-plate. As a result, our recommendations are grounded in the real world. Our style is practical and down-to-earth. We try to put ourselves in our clients’ shoes and focus on actions. We listen hard, but we are suspicious of the consensus. We provide an external, objective perspective. We are happy to link our fees to results. WHO WE WORK WITH We only work with a select group of clients we trust. We build long term relationships with our clients and more than 80% of our work comes from existing clients. Our clients trust our experience, advice and integrity.
Coriolis advises clients on growth strategy, mergers and acquisitions, operational improvement and organisational change. Typical assignments for clients include… FIRM STRATEGY & OPERATIONS We help clients develop their own strategy for growing sales and profits. We have a strong bias towards growth driven by new products, new channels and new markets. MARKET ENTRY We help clients identify which countries are the most attractive – from a consumer, a competition and a channel point-of-view. Following this we assist in developing a plan for market entry and growth. VALUE CREATION We help clients create value through revenue growth and cost reduction. TARGET IDENTIFICATION We help clients identify high potential acquisition targets by profiling industries, screening companies and devising a plan to approach targets. DUE DILIGENCE We help organisations make better decisions by performing consumer and market-focused due diligence and assessing performance improvement opportunities. EXPERT WITNESS We provide expert witness support to clients in legal cases and insurance claims. We assist with applications under competition/fair trade laws and regulations.