In-Line Process Control & Yield Management in LED...
21
In-Line Process Control & Yield Management in LED Manufacturing Frank Burkeen November 1, 2012 General Manager & Vice President, Growth and Emerging Markets
Transcript of In-Line Process Control & Yield Management in LED...
In-Line Process Control & Yield
Management in LED Manufacturing
Frank Burkeen
November 1, 2012
General Manager & Vice President, Growth and Emerging Markets
2 KLA-Tencor Corporation
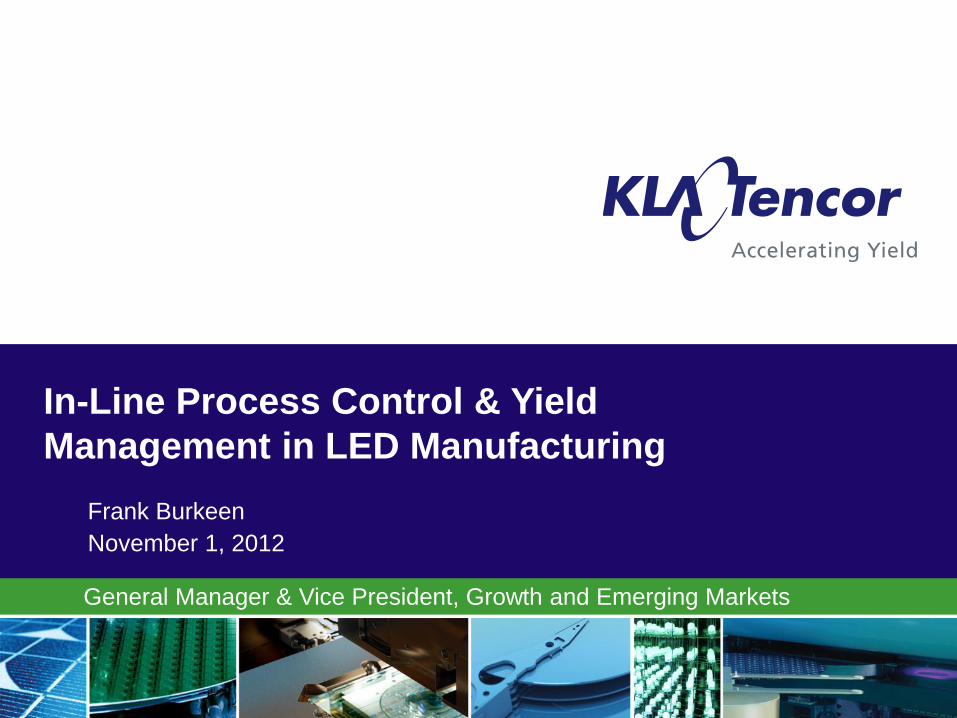
KLA-Tencor Overview
Installed base ~22,500 tools
> 5,800 employees
~ 3,780 technical personnel in 17
countries
>$1.5B R&D investments over last
4 years
FY 2012 Revenue 3.2 billion
Global leader in yield acceleration since 1976
KLA-Tencor Markets
Metrology Wafer Reticle LED Service/Apps
3 KLA-Tencor Corporation
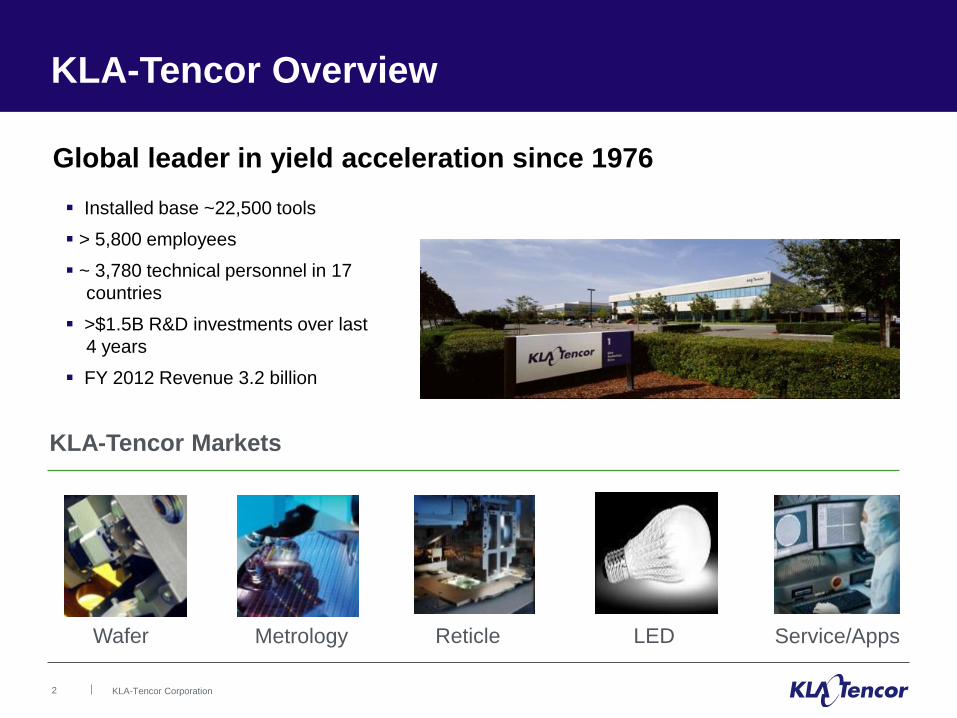
Improve Substrate
Quality, Go/No-go
Maximize MOCVD
Performance, Uptime
Manage Process Tool
Uptime
In-line Defectivity
Improve Back-end
Process, Go/No-go
ICOS WI-2250
Substrate metrology
Front and Back Correlation
HRP-250 Stylus Profiler
Excursion Response
Candela 8620/
CS20
Wafer Fab Die Fab Packaging Substrate & Epi
Substrate LED epiwafer LED die LED lamp Dies-on-wafer
KLA-Tencor LED Process Control Solution
Process R&D MicroXAM1200
Optical Profiler
KLARITY LED
4 KLA-Tencor Corporation
Outline
Process control drivers Inline yield management strategy Summary
5 KLA-Tencor Corporation
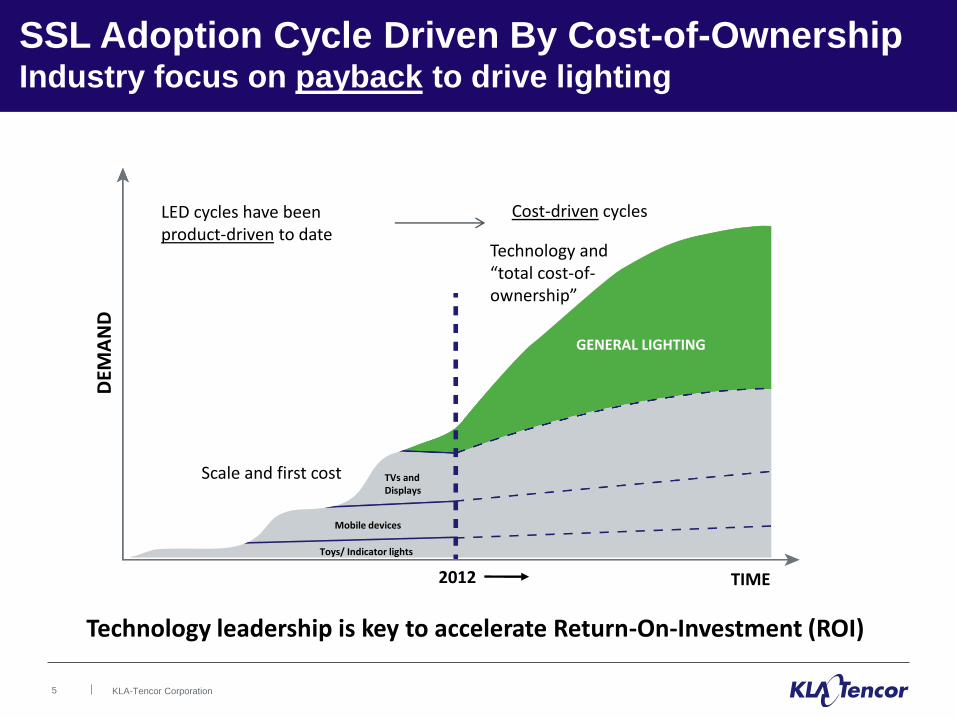
SSL Adoption Cycle Driven By Cost-of-Ownership Industry focus on payback to drive lighting
DEM
AN
D
TIME 2012
GENERAL LIGHTING
TVs and Displays
Mobile devices
Toys/ Indicator lights
LED cycles have been product-driven to date
Cost-driven cycles
Scale and first cost
Technology and “total cost-of-ownership”
Technology leadership is key to accelerate Return-On-Investment (ROI)
6 KLA-Tencor Corporation
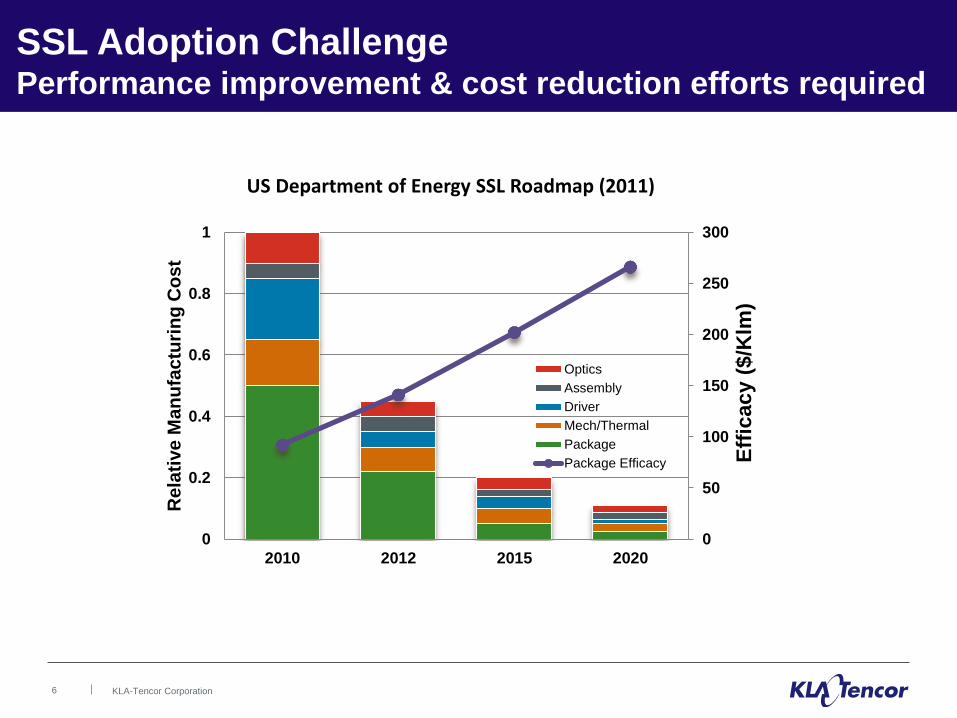
SSL Adoption Challenge Performance improvement & cost reduction efforts required
US Department of Energy SSL Roadmap (2011)
0
50
100
150
200
250
300
0
0.2
0.4
0.6
0.8
1
2010 2012 2015 2020
Eff
icacy (
$/K
lm)
Re
lati
ve
Ma
nu
fac
turi
ng
Co
st
Optics
Assembly
Driver
Mech/Thermal
Package
Package Efficacy
7 KLA-Tencor Corporation
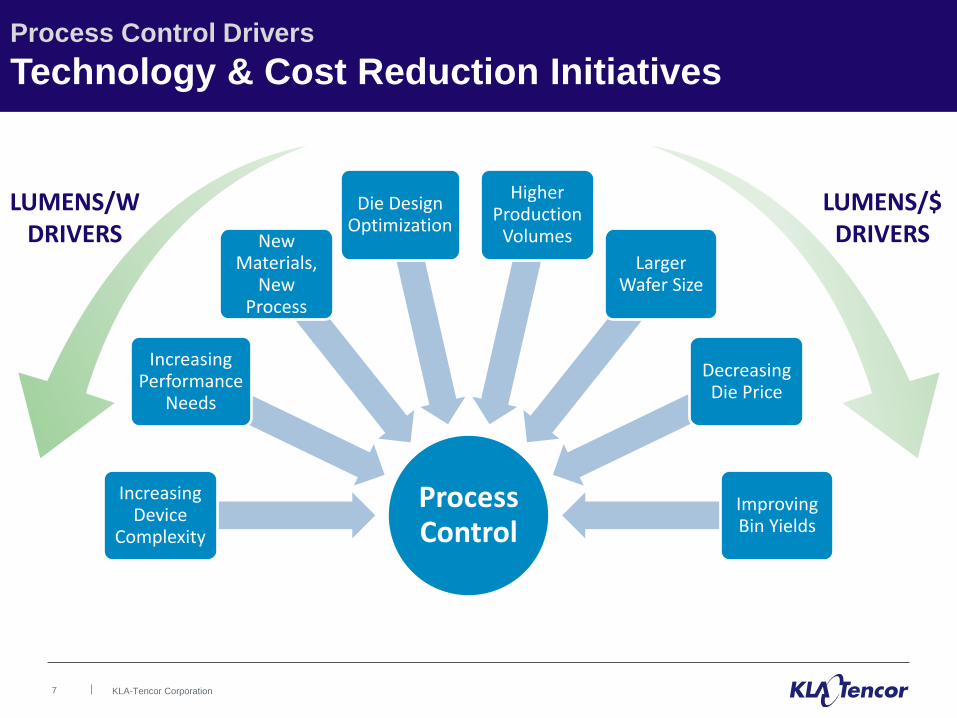
Process Control Drivers
Technology & Cost Reduction Initiatives
Process Control
Increasing Device
Complexity
Increasing Performance
Needs
New Materials,
New Process
Die Design Optimization
Higher Production
Volumes
Larger Wafer Size
Decreasing Die Price
Improving Bin Yields
LUMENS/$ DRIVERS
LUMENS/W DRIVERS
8 KLA-Tencor Corporation
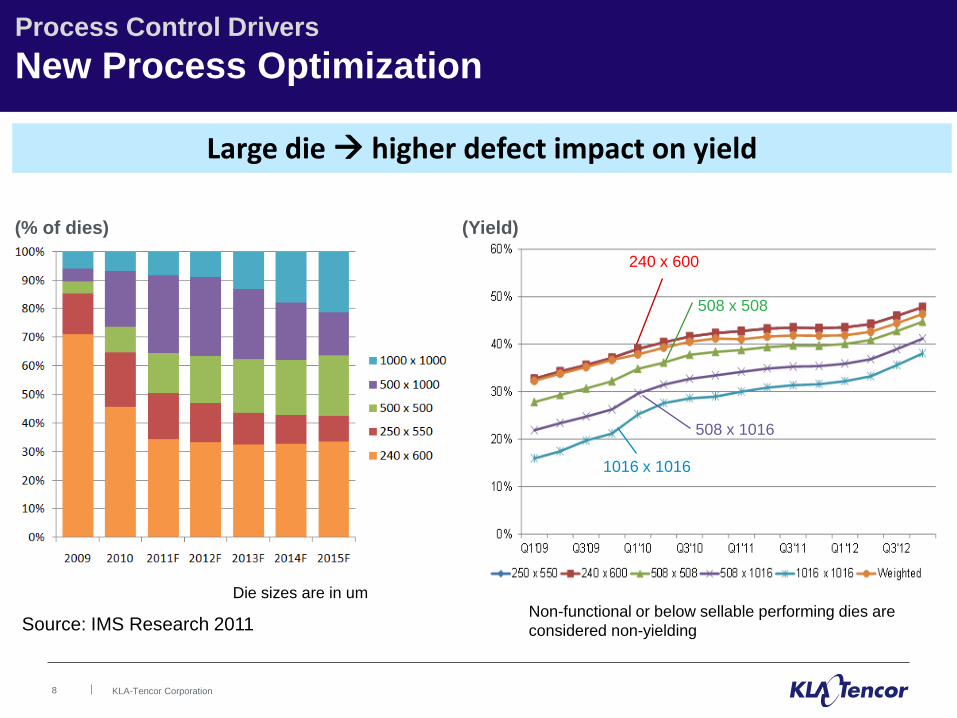
Process Control Drivers
New Process Optimization
(% of dies)
Die sizes are in um
Source: IMS Research 2011
(Yield)
1016 x 1016
508 x 1016
508 x 508
240 x 600
Non-functional or below sellable performing dies are
considered non-yielding
Larger die more area for defects to impact yield Large die higher defect impact on yield
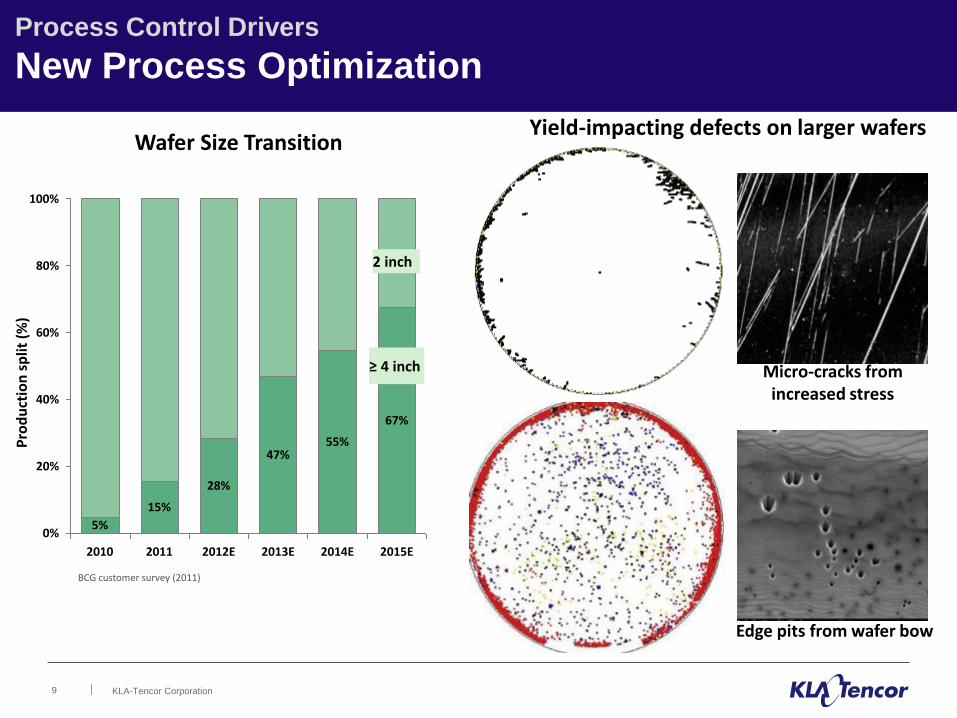
9 KLA-Tencor Corporation
Micro-cracks from increased stress
Yield-impacting defects on larger wafers
Edge pits from wafer bow
100%
80%
60%
40%
20%
0%
≥ 4 inch
2 inch
2015E
67%
2014E
55%
2013E
47%
2012E
28%
2011
15%
2010
5%
Wafer Size Transition
Pro
du
ctio
n s
plit
(%
)
BCG customer survey (2011)
Process Control Drivers
New Process Optimization
10 KLA-Tencor Corporation
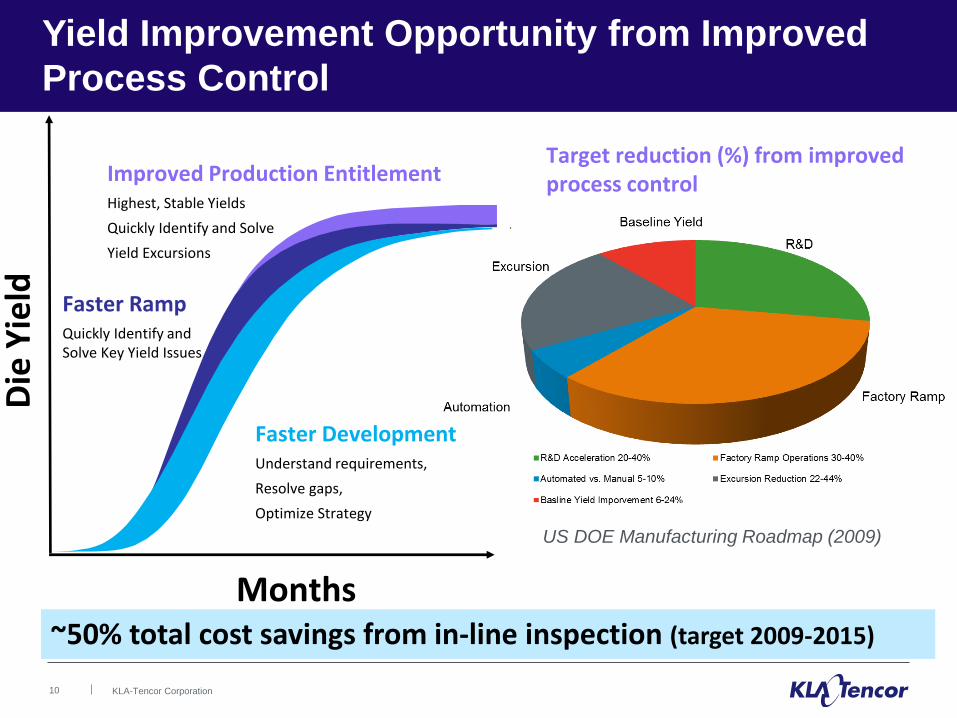
Yield Improvement Opportunity from Improved
Process Control
Months
Faster Development:
Understand requirements,
Resolve gaps,
Optimize Strategy
Faster Ramp
Quickly Identify and Solve Key Yield Issues
Improved Production Entitlement
Highest, Stable Yields
Quickly Identify and Solve
Yield Excursions
Die
Yie
ld
~50% total cost savings from in-line inspection (target 2009-2015)
US DOE Manufacturing Roadmap (2009)
Target reduction (%) from improved process control
11 KLA-Tencor Corporation
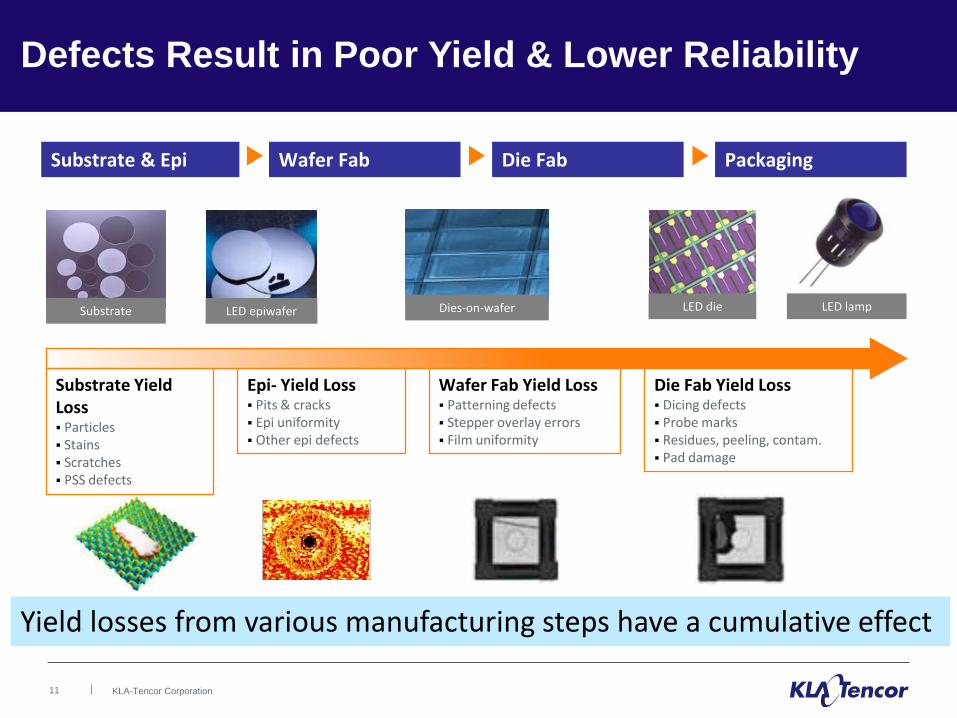
Wafer Fab Die Fab Packaging Substrate & Epi
Substrate LED epiwafer LED die LED lamp
Substrate Yield Loss Particles Stains Scratches PSS defects
Epi- Yield Loss Pits & cracks Epi uniformity Other epi defects
Wafer Fab Yield Loss Patterning defects Stepper overlay errors Film uniformity
Die Fab Yield Loss Dicing defects Probe marks Residues, peeling, contam. Pad damage
Dies-on-wafer
Defects Result in Poor Yield & Lower Reliability
Yield losses from various manufacturing steps have a cumulative effect
12 KLA-Tencor Corporation
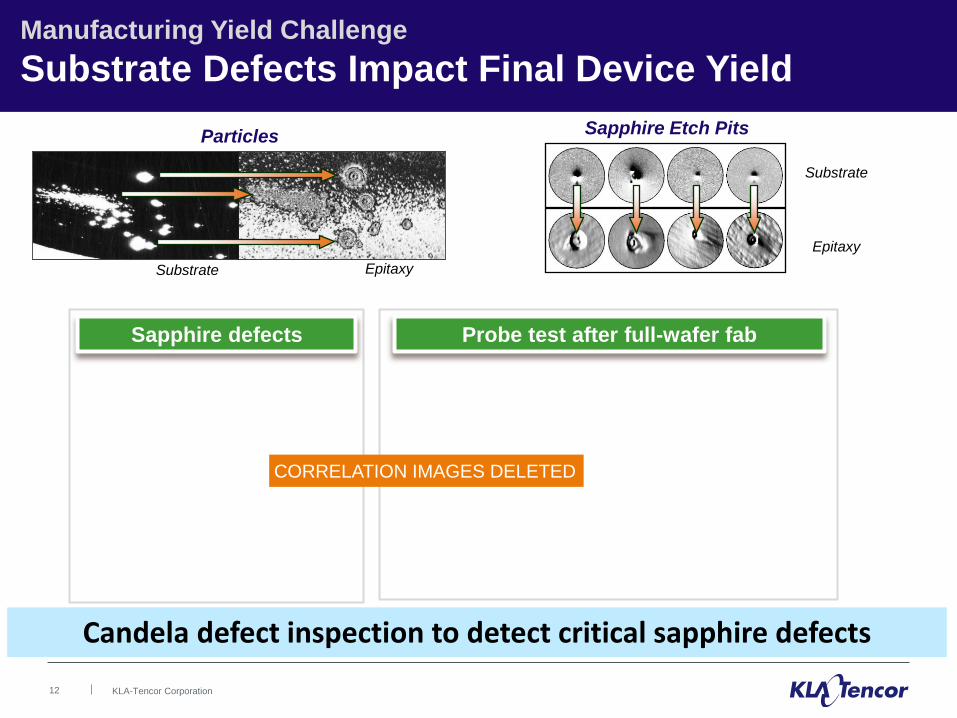
Manufacturing Yield Challenge
Substrate Defects Impact Final Device Yield
Sapphire defects Probe test after full-wafer fab
Particles
Substrate Epitaxy
Substrate
Epitaxy
Sapphire Etch Pits
Candela defect inspection to detect critical sapphire defects
CORRELATION IMAGES DELETED
13 KLA-Tencor Corporation
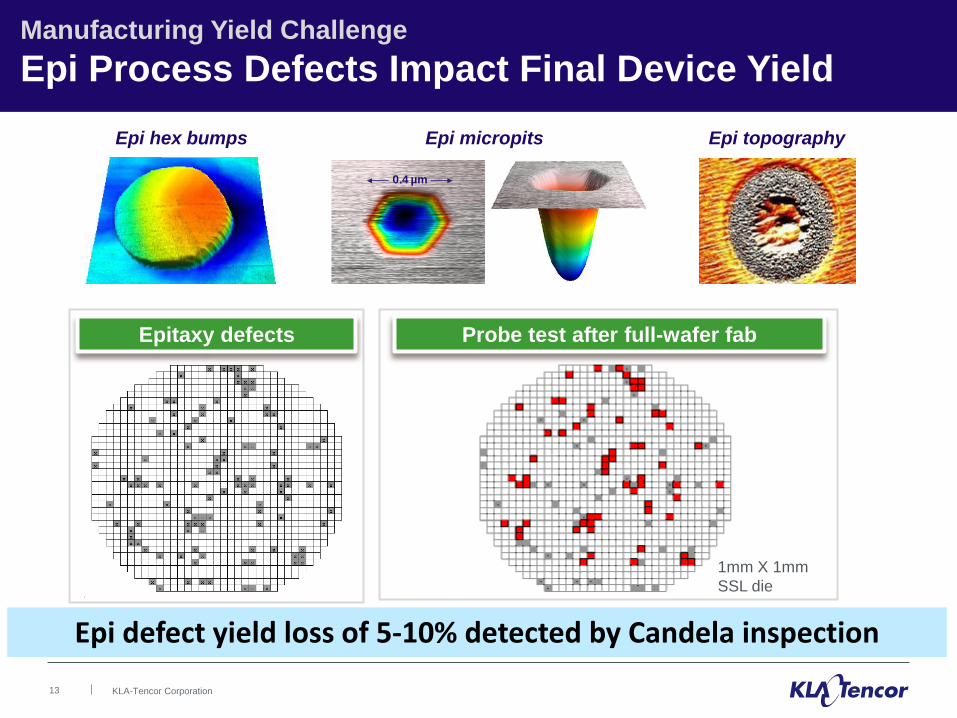
Manufacturing Yield Challenge
Epi Process Defects Impact Final Device Yield
Epi micropits
0.4 µm
Epi hex bumps Epi topography
Probe test after full-wafer fab Epitaxy defects
Epi defect yield loss of 5-10% detected by Candela inspection
1mm X 1mm
SSL die
14 KLA-Tencor Corporation
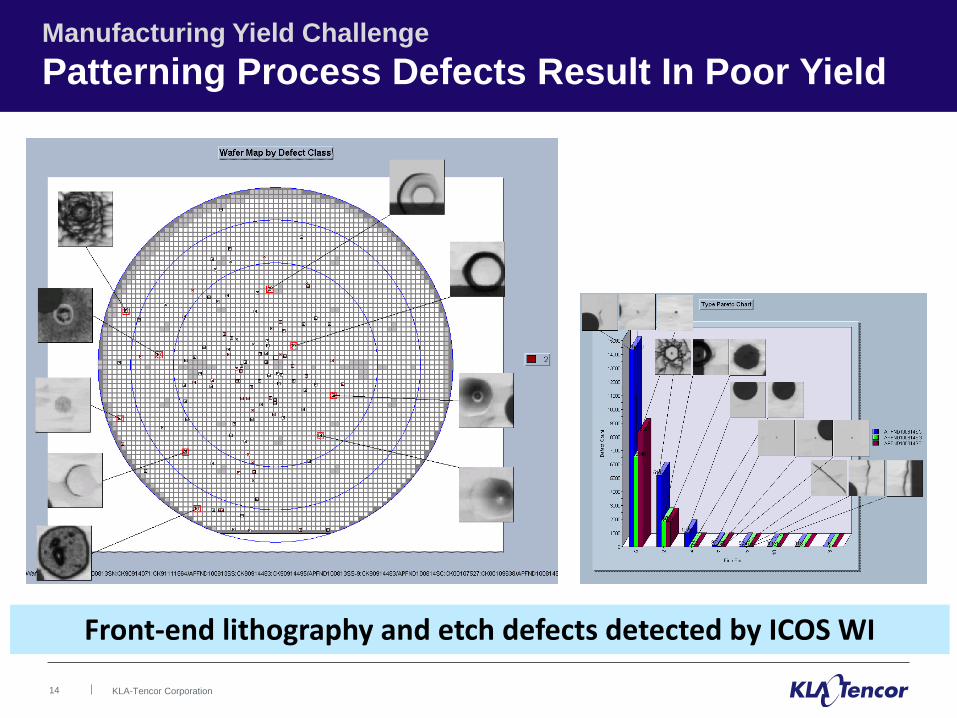
Manufacturing Yield Challenge
Patterning Process Defects Result In Poor Yield
Front-end lithography and etch defects detected by ICOS WI
15 KLA-Tencor Corporation
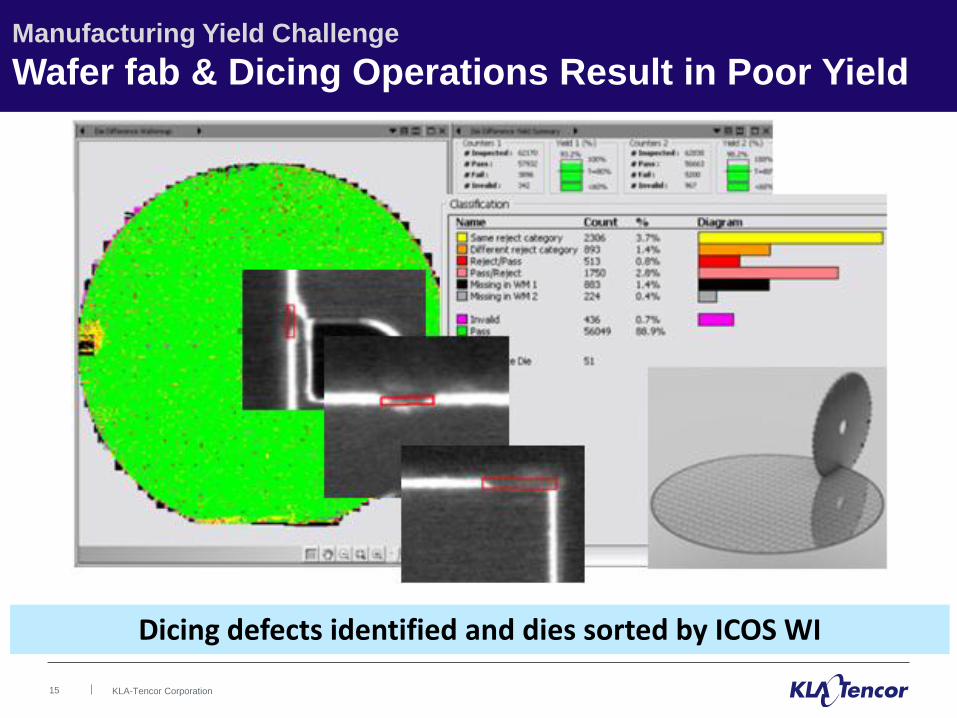
Manufacturing Yield Challenge
Wafer fab & Dicing Operations Result in Poor Yield
Dicing defects identified and dies sorted by ICOS WI
16 KLA-Tencor Corporation
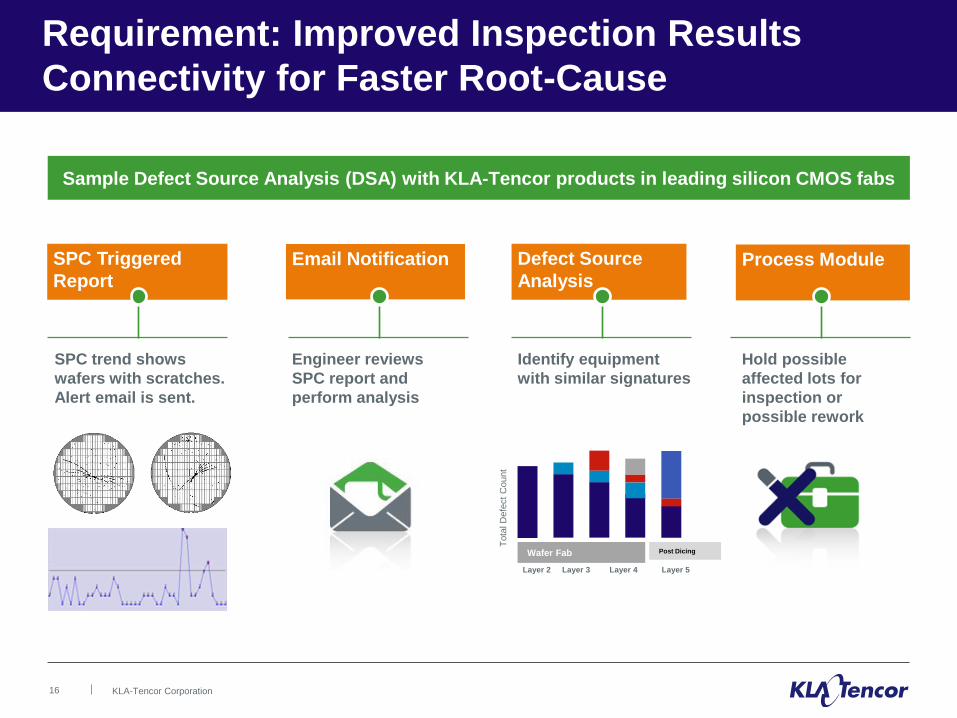
Requirement: Improved Inspection Results
Connectivity for Faster Root-Cause
Sample Defect Source Analysis (DSA) with KLA-Tencor products in leading silicon CMOS fabs
SPC Triggered
Report
Email Notification Defect Source
Analysis Process Module
SPC trend shows
wafers with scratches.
Alert email is sent.
Engineer reviews
SPC report and
perform analysis
Identify equipment
with similar signatures
Hold possible
affected lots for
inspection or
possible rework
Wafer Fab
Layer 2 Layer 3 Layer 4 Layer 5
Post Dicing
Tota
l D
efe
ct
Count
17 KLA-Tencor Corporation
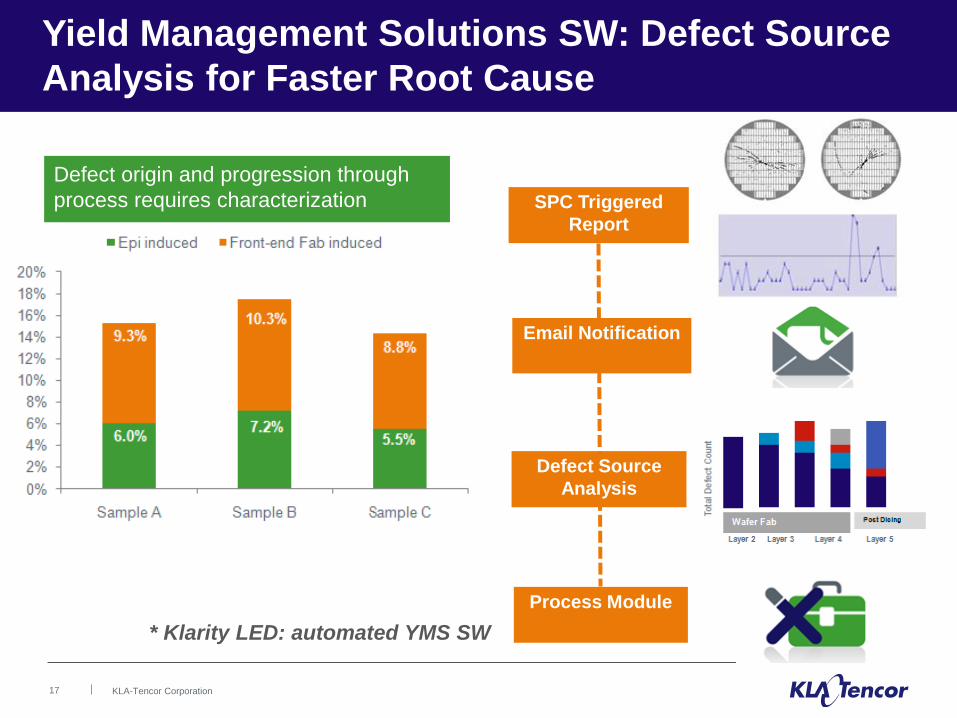
Yield Management Solutions SW: Defect Source
Analysis for Faster Root Cause
SPC Triggered
Report
Email Notification
Defect Source
Analysis
Process Module
* Klarity LED: automated YMS SW
Defect origin and progression through
process requires characterization
18 KLA-Tencor Corporation
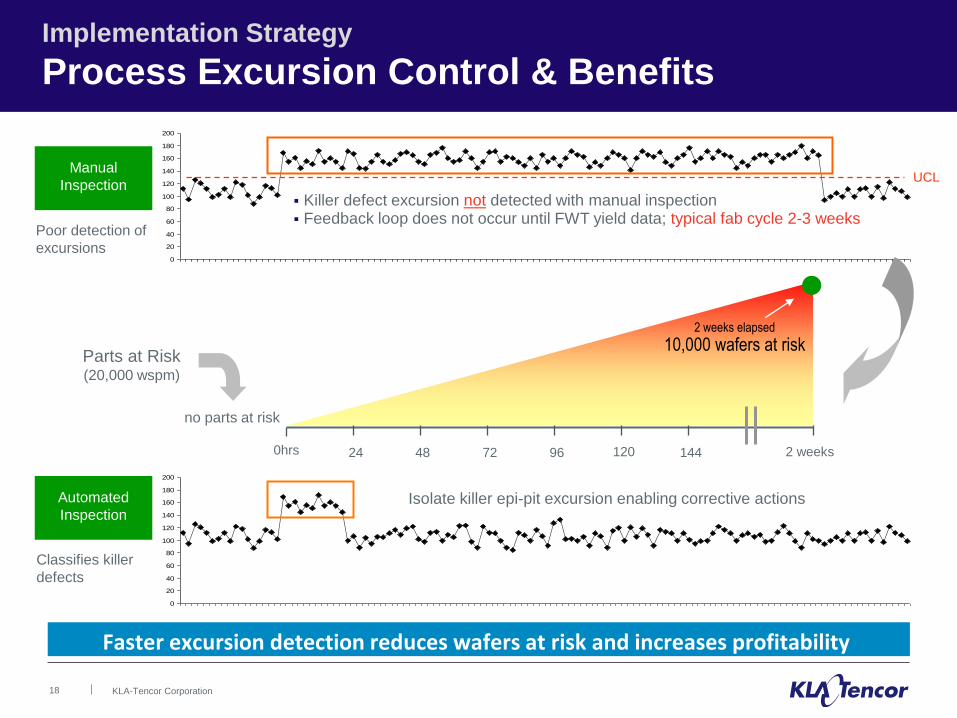
Implementation Strategy
Process Excursion Control & Benefits
0
20
40
60
80
100
120
140
160
180
200
Manual
Inspection
Poor detection of
excursions
UCL
Killer defect excursion not detected with manual inspection Feedback loop does not occur until FWT yield data; typical fab cycle 2-3 weeks
0
20
40
60
80
100
120
140
160
180
200
Classifies killer
defects
Isolate killer epi-pit excursion enabling corrective actions
Parts at Risk (20,000 wspm)
no parts at risk
0hrs 24 48 72 96 120 144 2 weeks
2 weeks elapsed
10,000 wafers at risk
Automated
Inspection
Faster excursion detection reduces wafers at risk and increases profitability
19 KLA-Tencor Corporation
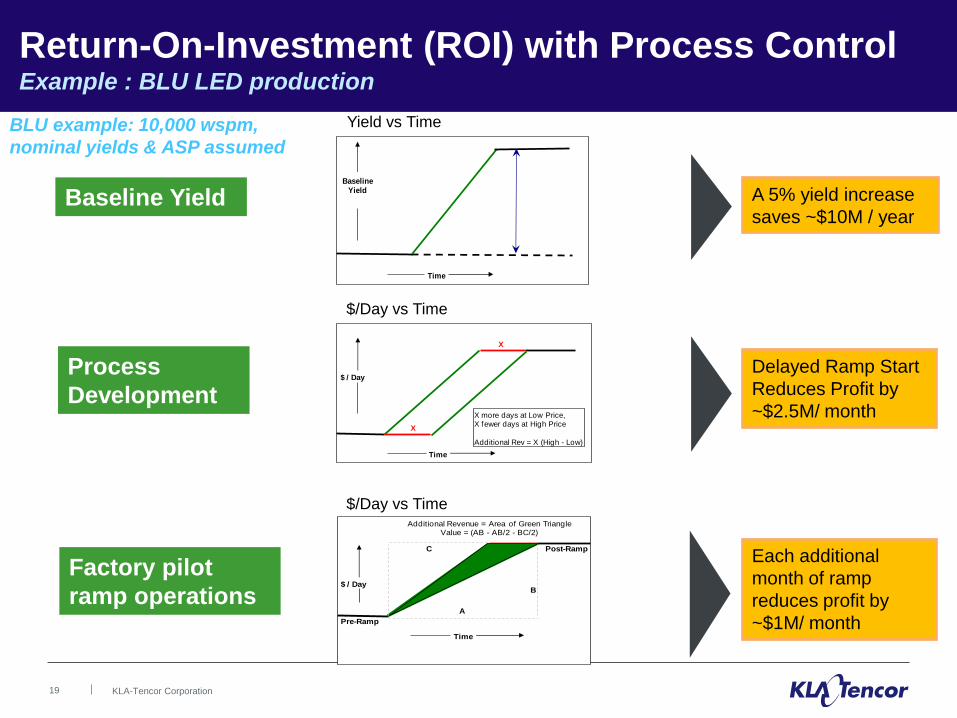
BaselineYield
Time
Yield vs Time
X
X
X more days at Low Price,X fewer days at High Price
Additional Rev = X (High - Low)
$ / Day
Time
$/Day vs Time
A
Additional Revenue = Area of Green TriangleValue = (AB - AB/2 - BC/2)
$ / Day
Time
B
C
Pre-Ramp
Post-Ramp
$/Day vs Time
A 5% yield increase
saves ~$10M / year
Delayed Ramp Start
Reduces Profit by
~$2.5M/ month
Each additional
month of ramp
reduces profit by
~$1M/ month
Baseline Yield
Process
Development
Factory pilot
ramp operations
BLU example: 10,000 wspm,
nominal yields & ASP assumed
Return-On-Investment (ROI) with Process Control Example : BLU LED production
20 KLA-Tencor Corporation
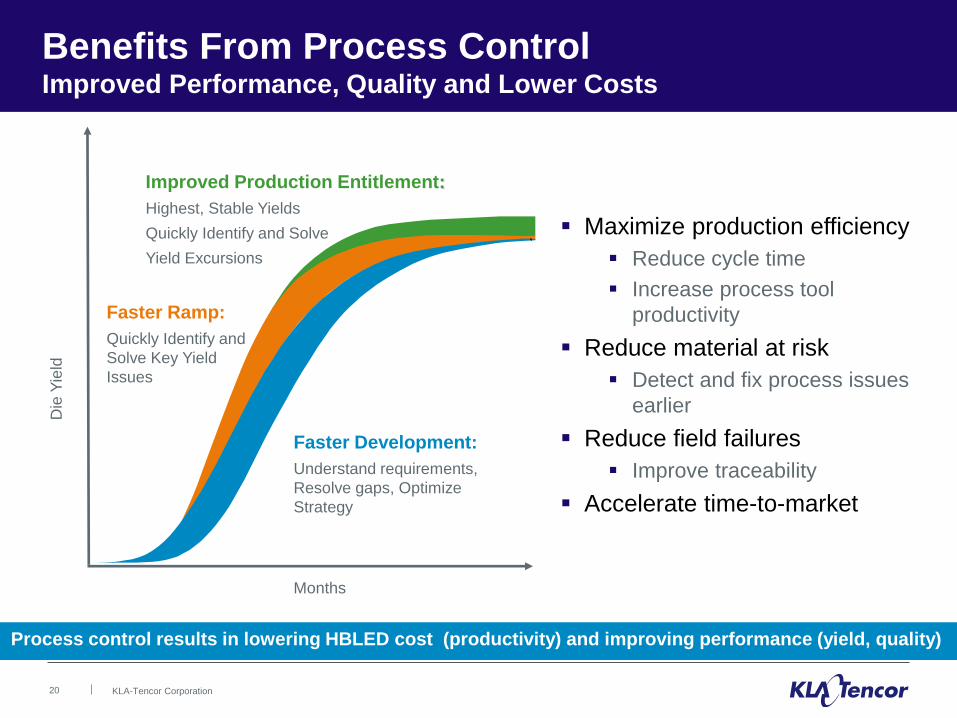
Benefits From Process Control Improved Performance, Quality and Lower Costs
Months
Faster Development:
Understand requirements,
Resolve gaps, Optimize
Strategy
Faster Ramp:
Quickly Identify and
Solve Key Yield
Issues
Improved Production Entitlement:
Highest, Stable Yields
Quickly Identify and Solve
Yield Excursions
Maximize production efficiency
Reduce cycle time
Increase process tool
productivity
Reduce material at risk
Detect and fix process issues
earlier
Reduce field failures
Improve traceability
Accelerate time-to-market
Die
Yie
ld
Process control results in lowering HBLED cost (productivity) and improving performance (yield, quality)
Copyright © 2012 KLA-Tencor Corporation www.kla-tencor.com