IN LINE HVSR MEASURE FOR MICROZONATION STUDY · PDF fileunit weight equal to 19-20 kN/mc, ......
6
IN LINE HVSR MEASURE FOR MICROZONATION STUDY M. Compagnoni, M. Lualdi, F. Pergalani, G. Saccà DICA - Dipartimento di Ingegneria Civile e Ambientale, Politecnico di Milano, Italy Introduction. In the evaluation of the local seismic hazard and risk, the geological and geophysical studies are fundamental to carry out activities of prevention and reconstruction (Seed and Idriss, 1969; Seed et al. , 1988; Kramer, 1996), especially in Italy (Word Institute for Disaster Risk Management, 2004), where the hazard is usually connected to high building (Valente, 2012, 2013) vulnerability and high historic values of the urban centers. The aim of seismic microzonation study is the evaluation of the expected local seismic hazard, related to the geological and geomorphological characteristics of the subsoil (Bard and Bouchon, 1985; Bard and Gabriel, 1986; Jibson, 1993; Ashford and Sitar, 1994; Duncan, 1996; Pitilakis et al. , 1999; Ansal and Tonuk, 2007; Mandrescu et al. , 2007). These multidisciplinary studies can be performed with different levels of detail, in function of the objectives (TC4-ISSMGE, 1999; Mohanty et al. , 2007). The Italian Guidelines for the Seismic Microzonation (ICMS) (GdL MS, 2008) prescribes three approach levels: the Level 1 (L1) (qualitative approach) is dedicated to map the areas that can produce amplification and/or instability phenomena. The Level 2 (L2) (semi-quantitative approach) consist in the definition of the expected amplification factors by abacuses, starting from the definition of soils thickness and the equivalent average share waves velocity. The Level 3 (L3) (quantitative approach) requires a quantitative evaluation of the amplification and instability phenomena through numerical and experimental analyses. L1 is a prerequisite to carry through the successive levels. This cognitive framework necessary to obtain this level is based on pre-existing data collection: geological, geomorphological, geotechnical and geophysical data and some new surveys compatible with a low financial plan available for this step. This level allows to delimit qualitatively the seismic homogenous areas, defined as zones with similar stratigraphy, lithology and morphology, that can produce similar seismic surface effects during an earthquake. The synthesis of all available data allows to create different maps: the surveys one, the geolithotecnic correlated to geo-lithotechnic section and the seismic homogeneous areas map (MOPS). The MOPS can be used for urban planning, but provides also an important information for emergency planning (e.g. damage scenarios, taking into account the local geological and morphological condition) and for project design. In Piemonte Region, north Italy, we conducted the L1 studies in 4 municipalities. The aim of the paper is to describe the choices about the use of HVSR compatible with the low financial plan, to integrate the pre-existent data. HVSR. The HVSR (Horizontal to Vertical Spectral Ratio) technique popularized by Nakamura (1989), based on the spectral analysis of the noise recordings, has been widely used in the past years for seismic microzonation and site effect studies in sedimentary basins. In this framework, the HVSR technique was chosen because: it is not invasive, it is very fast and applicable almost everywhere unlike other seismic method. Assuming to investigate soft deposit above a base seismic bedrock it is possible to establish a relationship between the thickness of the soft layer h, the shear wave velocity (V S ) and fundamental resonance frequency f of the site through the formula (Lanzo and Silvestri, 1999): (1) Through the f 0 value defined by the HVSR survey it is possible to estimate the thickness h or the shear wave velocity of the soft layer. The HVSR technique has been validated with both simulation and earthquake recordings (e.g. Lermo and Chàvez-Garcìa, 1993; Konno and Ohmachi, 1998). It has been tested in different studies (e.g Ibs-von Seht and Wohlenberg 1999; Delgado et al. , 2000a, 2000b; Parolai et al. , 2002; Gosar and Lenart, 2010; Benjumea et al. , 2011) as a fast and efficient way to obtain bedrock geometry. It is not allow to evaluate correctly the real amplitude of the seismic motion (e.g. Bonnefoy-Claudet et al. , 2006; Haghshenas et 480 GNGTS 2013 SESSIONE 2.3
Transcript of IN LINE HVSR MEASURE FOR MICROZONATION STUDY · PDF fileunit weight equal to 19-20 kN/mc, ......
IN LINE HVSR MEASURE FOR MICROZONATION STUDYM. Compagnoni, M. Lualdi, F. Pergalani, G. Saccà DICA - Dipartimento di Ingegneria Civile e Ambientale, Politecnico di Milano, Italy
Introduction. In the evaluation of the local seismic hazard and risk, the geological and geophysical studies are fundamental to carry out activities of prevention and reconstruction (Seed and Idriss, 1969; Seed et al., 1988; Kramer, 1996), especially in Italy (Word Institute for Disaster Risk Management, 2004), where the hazard is usually connected to high building (Valente, 2012, 2013) vulnerability and high historic values of the urban centers. The aim of seismic microzonation study is the evaluation of the expected local seismic hazard, related to the geological and geomorphological characteristics of the subsoil (Bard and Bouchon, 1985; Bard and Gabriel, 1986; Jibson, 1993; Ashford and Sitar, 1994; Duncan, 1996; Pitilakis et al., 1999; Ansal and Tonuk, 2007; Mandrescu et al., 2007). These multidisciplinary studies can be performed with different levels of detail, in function of the objectives (TC4-ISSMGE, 1999; Mohanty et al., 2007).
The Italian Guidelines for the Seismic Microzonation (ICMS) (GdL MS, 2008) prescribes three approach levels: the Level 1 (L1) (qualitative approach) is dedicated to map the areas that can produce amplification and/or instability phenomena. The Level 2 (L2) (semi-quantitative approach) consist in the definition of the expected amplification factors by abacuses, starting from the definition of soils thickness and the equivalent average share waves velocity. The Level 3 (L3) (quantitative approach) requires a quantitative evaluation of the amplification and instability phenomena through numerical and experimental analyses. L1 is a prerequisite to carry through the successive levels. This cognitive framework necessary to obtain this level is based on pre-existing data collection: geological, geomorphological, geotechnical and geophysical data and some new surveys compatible with a low financial plan available for this step. This level allows to delimit qualitatively the seismic homogenous areas, defined as zones with similar stratigraphy, lithology and morphology, that can produce similar seismic surface effects during an earthquake. The synthesis of all available data allows to create different maps: the surveys one, the geolithotecnic correlated to geo-lithotechnic section and the seismic homogeneous areas map (MOPS). The MOPS can be used for urban planning, but provides also an important information for emergency planning (e.g. damage scenarios, taking into account the local geological and morphological condition) and for project design. In Piemonte Region, north Italy, we conducted the L1 studies in 4 municipalities. The aim of the paper is to describe the choices about the use of HVSR compatible with the low financial plan, to integrate the pre-existent data.
HVSR. The HVSR (Horizontal to Vertical Spectral Ratio) technique popularized by Nakamura (1989), based on the spectral analysis of the noise recordings, has been widely used in the past years for seismic microzonation and site effect studies in sedimentary basins.
In this framework, the HVSR technique was chosen because: it is not invasive, it is very fast and applicable almost everywhere unlike other seismic method. Assuming to investigate soft deposit above a base seismic bedrock it is possible to establish a relationship between the thickness of the soft layer h, the shear wave velocity (VS) and fundamental resonance frequency f of the site through the formula (Lanzo and Silvestri, 1999): (1)
Through the f0 value defined by the HVSR survey it is possible to estimate the thickness h or the shear wave velocity of the soft layer. The HVSR technique has been validated with both simulation and earthquake recordings (e.g. Lermo and Chàvez-Garcìa, 1993; Konno and Ohmachi, 1998). It has been tested in different studies (e.g Ibs-von Seht and Wohlenberg 1999; Delgado et al., 2000a, 2000b; Parolai et al., 2002; Gosar and Lenart, 2010; Benjumea et al., 2011) as a fast and efficient way to obtain bedrock geometry. It is not allow to evaluate correctly the real amplitude of the seismic motion (e.g. Bonnefoy-Claudet et al., 2006; Haghshenas et
480
GNGTS 2013 SeSSione 2.3
131218 - OGS.Atti.32_vol.2.sez.3.09.indd 480 07/11/13 16.18
al., 2008; Bindi et al., 2009; Albarello and Lunedei, 2010). The use of the HVSR method as an exploration tool presents some typical limitations: where the ratio of the acoustic impedance among the explored soils is minor than 2 or where seismic noise around the point of measure is relevant is difficult to determine the f0 (SESAME European research project, 2004; Chatelain et al., 2008, Guillier et al., 2008). Furthermore, it is not possible to discriminate if the peak value obtained from the curve HVSR is due to the contact of the soft deposit with the seismic bedrock or with others layers with a high impedance contrast (e.g. ≥2). In order to overcome the HVSR uncertainties we proposed and tested a field methodology compatible whit the limited available budget of the L1 studies. We explored the benefits to make the HVSR measurement in-line to correlate the results of those.
Geological features. The 4 investigated municipalities were: Perosa Argentina, Pinerolo, Sant’Antonino di Susa and Torre Pellice, located in Piemonte, northern Italy. In the following the main geological characteristics of the sites, due to the pre-existent investigations, as geophysical tests MASW, SEV, DH, penetrometric tests, bore-holes, etc. are presented.
Perosa Argentina is characterized by the presence of:• gravel and sand with thickness among 10 and 80 m, the geotechnical parameters are:
unit weight equal to 19-20 kN/mc, frictional angle equal to 35°-40° and cohesion equal to 0-5 kPa, the average value of the Vs is 350 m/s;
• gravel with unit weight equal to 17-20 kN/mc, frictional angle equal to 30°-40° and cohesion equal to 0 kPa;
• silt and clay;• the geological bedrock is, in the study area, marginally outcropping.The main geomorphological aspects are the presence of alluvial fans, slope debris, fluvial
edges high between 10-20 m, a ridge and a man-made deposit.Pinerolo is characterized by the presence of:• gravel and sand with thickness among 10 and 60 m, the geotechnical parameters are:
unit weight equal to 19-20 kN/mc, frictional angle equal to 40°-42° and cohesion equal to 0 kPa, the average value of Vs is 400-500 m/s;
• silt and sand with unit weight equal to 18-19 kN/mc, frictional angle equal to 38°-40° and cohesion equal to 0-10 kPa;
• the geological bedrock is, in the study area, marginally outcropping.The main geomorphological aspects are the presence of alluvial fans, fluvial edges and
morphological scarps high among 10-20 m, the ridges, some landslides and a man-made deposit.
Sant’Antonino di Susa is characterized by the presence of:• gravel and sand with thickness higher than 30 m, the average value of the standard
penetration test is higher than 15 and the average value of the Vs is 250 m/s in the first 10 m and 400 m/s among 10-30 m;
• sand and silt with thickness higher than 30 m, the average value of the standard penetration test is lower than 10 and the average value of the Vs is 250 m/s in the first 5 m, 350 m/s among 5-30 m and 400 m/s among 30-40 m
• the geological bedrock is, in the study area, marginally outcropping.The main geomorphological aspects are the presence of alluvial fans and slope debris.Torre Pellice is characterized by the presence of:• alluvial deposit consisting of gravel and sand with thickness among 10 and 40 m, the
geotechnical parameters are: unit weight equal to 19-20 kN/mc, frictional angle equal to 35°-40° and cohesion equal to 0-5 kPa, the average value of the Vs is 350-400 m/s;
• ancient slope debris consisting of gravel and sand with unit weight equal to 17-19 kN/mc, frictional angle equal to 25°-35° and cohesion equal to 0-5 kPa;
• the geological bedrock is, in the study area, marginally outcropping.
481
GNGTS 2013 SeSSione 2.3
131218 - OGS.Atti.32_vol.2.sez.3.09.indd 481 07/11/13 16.18

The main geomorphological aspects are the presence of alluvial fans, slope debris, fluvial edges high among 10-20 m and a ridge.
The available data required to make some of HVSR tests in all the studied municipalities. Particularly, we identified: 4 measuring points in Perosa Argentina, 7 points in Pinerolo, 4 points in Sant’Antonino di Susa and 4 points in Torre Pellice.
Surveys. It was utilized the tri-directional high sensitivity seismometer Veloget 3D 1 Hz coupled with the Geode of Geometrics with 0.6 Hz minimal possible recording frequency to make the surveys. The sampling frequency of the signal was set to 125 Hz. Every measuring point was georeferred using a GPS (Garmin Etrex Vista). The seismometer was placed on the ground with particularly attention to the coupling. To ensure statistical reliability of the data, for each point the recorded time interval for each acquisition was among minimum of 18 minutes to a maximum of 46 minutes. The open source software Geopsy was applied (http://www.geopsy.org/) to process the data and define the fundamental frequency of the site. In the study area within the municipalities of Perosa Argentina, Pinerolo, Sant’Antonino di Susa, Torre Pellice, were executed HVSR noise measurement to determine the resonance frequency of the site.
In the municipality of Perosa Argentina the surveys were performed in four location. For all the measuring points (except P1) two recordings were carried out. In Fig. 1 all the HVSR curves acquired in Perosa Argentina show one or more clear peak frequency. P2a-P2b identified peaks due to contact of two layers with different acoustic impedance about 3-4 Hz and 8-9 Hz. P3a and P3b about 9-10 Hz. P1, P3a-P3b and P4a-P4b show a frequency peak between 1.5-2 Hz that is not reliable because the peaks are not due to stratigraphic resonance phenomena, but probably by some sources as an electromagnetic or human activities, that affect the quality of the results. In the municipality of Pinerolo the surveys were performed in seven locations. For
Fig. 1 – HVSR curves obtained in: (a) Perosa Argentina, (b) Pinerolo, (c) Sant’Antonino di Susa, (d) Torre Pellice.
482
GNGTS 2013 SeSSione 2.3
131218 - OGS.Atti.32_vol.2.sez.3.09.indd 482 07/11/13 16.18

all the measuring points (except P7) two recordings were carried out. The curves P1b, P6a and P6b exhibit a clear peak about 7.5-8.5 Hz that is due to stratigraphic resonance phenomena. P1a-P1b, P5a-P5b and P7 show a peak around 1.5-2.5 Hz probably due to a variation of impedance contrast. Instead the surveys performed in P2a-P2b and P3a-P3b reveal flat curves that do not identify any clear impedance contrast. In the municipality of Sant’Antonino di Susa the surveys were performed in four locations. In two of them (P1, P4) was carried out one survey more than the other. All HVSR identified a peak due to a high impedance contrast between two layers. In the measuring point P1a-P1b, P3 and P4a-P4b the frequency detected is about 2-2.5 Hz, while in P2 the frequency is about 5 Hz. In the municipality of Torre Pellice the surveys were performed in four locations. For all the measuring points were performed two survey. P1a-P1b, P4a show a peak about 2.5-3.5 Hz due to stratigraphic resonance phenomena. P2a and P3b reveal flat curves that do not identify any clear impedance contrast. P2b and P3a show a peak probably due to electromagnetic or human activities. P4b curve has an irregular trend that no allows to define a unique frequency. Fig. 1 shows all the HVSR curves.
All the data (pre-existing and new investigations) allow to construct the litho-technical maps and the relative cross-sections, showing the different deposits outcropping the geophysical bedrock, defined as a level with VS of 800 m/s. Using the litho-technical maps and the relative cross-sections, the MOPS, for the 4 studied municipalities were produced. All the MOPS (Fig. 2) are characterized by different areas: 1 is classified as stable zone for the presence of the geologic bedrock, the other zone are classified as stable but with amplification effects due to presence of deposits.
In-line HVSR measurements. The microtremor measures made in the previous municipalities and their pre-existing data allow us to define the areas with different seismic
Fig. 2 – MOPS example. The figure shows the different area of Sant’Antonino di Susa and the HVSR in line survey location.
483
GNGTS 2013 SeSSione 2.3
131218 - OGS.Atti.32_vol.2.sez.3.09.indd 483 07/11/13 16.18
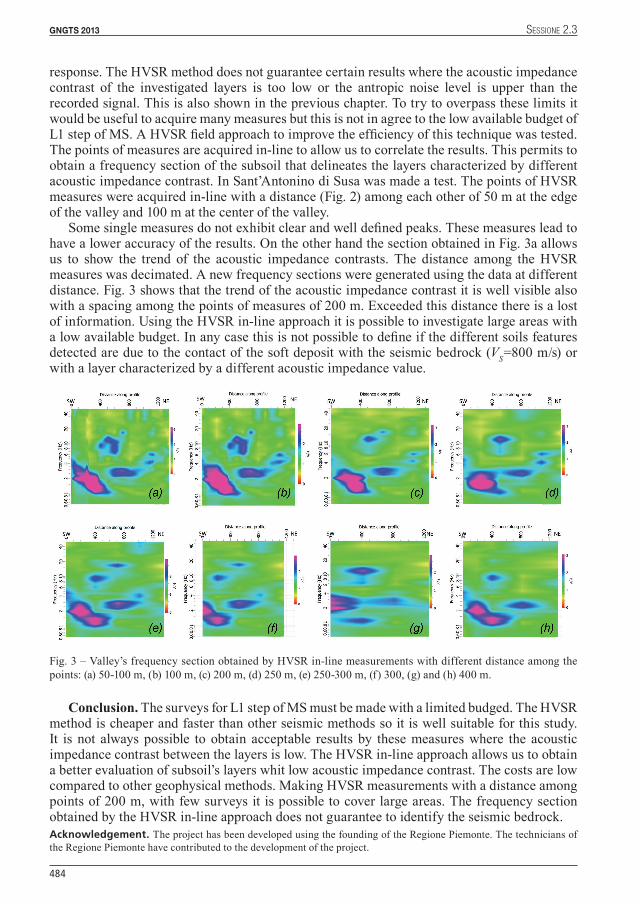
response. The HVSR method does not guarantee certain results where the acoustic impedance contrast of the investigated layers is too low or the antropic noise level is upper than the recorded signal. This is also shown in the previous chapter. To try to overpass these limits it would be useful to acquire many measures but this is not in agree to the low available budget of L1 step of MS. A HVSR field approach to improve the efficiency of this technique was tested. The points of measures are acquired in-line to allow us to correlate the results. This permits to obtain a frequency section of the subsoil that delineates the layers characterized by different acoustic impedance contrast. In Sant’Antonino di Susa was made a test. The points of HVSR measures were acquired in-line with a distance (Fig. 2) among each other of 50 m at the edge of the valley and 100 m at the center of the valley.
Some single measures do not exhibit clear and well defined peaks. These measures lead to have a lower accuracy of the results. On the other hand the section obtained in Fig. 3a allows us to show the trend of the acoustic impedance contrasts. The distance among the HVSR measures was decimated. A new frequency sections were generated using the data at different distance. Fig. 3 shows that the trend of the acoustic impedance contrast it is well visible also with a spacing among the points of measures of 200 m. Exceeded this distance there is a lost of information. Using the HVSR in-line approach it is possible to investigate large areas with a low available budget. In any case this is not possible to define if the different soils features detected are due to the contact of the soft deposit with the seismic bedrock (VS=800 m/s) or with a layer characterized by a different acoustic impedance value.
Conclusion. The surveys for L1 step of MS must be made with a limited budged. The HVSR method is cheaper and faster than other seismic methods so it is well suitable for this study. It is not always possible to obtain acceptable results by these measures where the acoustic impedance contrast between the layers is low. The HVSR in-line approach allows us to obtain a better evaluation of subsoil’s layers whit low acoustic impedance contrast. The costs are low compared to other geophysical methods. Making HVSR measurements with a distance among points of 200 m, with few surveys it is possible to cover large areas. The frequency section obtained by the HVSR in-line approach does not guarantee to identify the seismic bedrock.Acknowledgement. The project has been developed using the founding of the Regione Piemonte. The technicians of the Regione Piemonte have contributed to the development of the project.
Fig. 3 – Valley’s frequency section obtained by HVSR in-line measurements with different distance among the points: (a) 50-100 m, (b) 100 m, (c) 200 m, (d) 250 m, (e) 250-300 m, (f) 300, (g) and (h) 400 m.
484
GNGTS 2013 SeSSione 2.3
131218 - OGS.Atti.32_vol.2.sez.3.09.indd 484 07/11/13 16.18
ReferencesBard, P. Y., and Bouchon, M. (1985). The two-dimensional resonance of sediment-filled valleys. Bulletin of the
Seismological Society of America, 75, 519-541.Bard, P. Y., and Gabriel, J. C. (1986). The seismic response of two-dimensional deposits with large vertical velocity
gradients. Bulletin of the Seismological Society of America, 76, 343-366.Benjumea, B., Macau, A., Gabàs, A., Bellmunt, F., Figueras, S., and Cirés, J. (2011). Integrated geophysical profiles and
H/V microtremor measurements for subsoil characterization. Near Surface Geophysics, 9 (5), 413-425.Chatelain, J.-L., Guillier, B., Cara, F., Duval, A.-M., Atakan, K., and Bard, P.-Y. (2008). Evaluation of the influence of
experimental conditions on H/V results from ambient noise recordings. Bulletin of earthquake engennering, 6, 33-74.Gruppo di lavoro MS, 2008. Indirizzi e criteri per la microzonazione sismica. Conferenza delle Regioni e delle Province
autonome - Dipartimento della protezione civile, Roma, 3 vol. e Dvd.Guillier, B., Atakan, K., Chatelain, J.-L., Havskov, J., Ohrnberger, M., Cara, F., et al. (2008). Influence of instruments on
the H/V spectral ratios of ambient vibrations. Bulletin of earthquake engeneering, 6, 3-31.Haghshenas, E., Bard, P. Y., and Theodulidis, N. (2008). Empirical evaluation of microtremor H/V spectral ratio. Bulletin
of earthquake engineering, 6, 75-108.Konno, K., and Ohmachi, T. (1998). Ground motion characteristics estimated from spectral ratio beetween horizontal and
vertical components of microtremor. Bulletin of the seismological society of America, 88, 228-241.Seed, H. B., and Idriss, I. M. (1969). Influence of soil conditions on ground motion during earthquakes. Journal of the Soil
Mechanics and Foundations Division, 95, 99-138.Seed, H. B., Romo, M. P., Sun, J. I., Jaime, A., and Lysmer, J. (1988). Relationships between soil conditions and heartquakes.
Journal of soil mechanics and foundation division, 4, 687-729.
485
GNGTS 2013 SeSSione 2.3
131218 - OGS.Atti.32_vol.2.sez.3.09.indd 485 07/11/13 16.18