IN FOCUS - ANZCheese Dry Whole Milk Powder Milk, Nonfat Dry Milk, Fluid (RH axis) Source: USDA PSD...
18
IN FOCUS FEBRUARY 2020 THE MILK RUN
Transcript of IN FOCUS - ANZCheese Dry Whole Milk Powder Milk, Nonfat Dry Milk, Fluid (RH axis) Source: USDA PSD...

INFOCUSFEBRUARY
2020
THEMILK RUN

FOREWORD
This is as true for the dairy industry as it is for grain, cattle, beef, cotton, and other sectors. Upstream, each industry continues to see a trend toward fewer farmers, reflected in a growth in the average size of operations, as well as efficiency levels. New developments in technology and farm infrastructure also continue to impact the nature of dairy farming. At the same time, factors such as input prices and labour availability continue to be challenges.
On a broader scale, the dairy production sector has had to face the challenges of growing global competition, particularly from Europe and New Zealand, in a global market which is arguably the most commoditised of any of the major agriculture sectors. Despite this, the potential for dairy processors or even countries to specialise their products or pursue new innovations is better than ever.
Importantly, for the Australian dairy industry, the challenges for producers vary widely by region, particularly due to climatic differences, or the size of regional industry clusters – dairy farming in southern Queensland or Western Victoria are quite different propositions.
Fundamentally, however, the vital factor of the consumption outlook remains very strong. Domestically, while Australia’s population continues to grow, consumer behaviour is increasingly driven by health perceptions. Non-animal dairy products will undoubtedly grow, but mainstream dairy products will always form a major part of a healthy diet. For export markets, there is still enormous growth ahead in the middle class populations of Asia, particularly China.
The Australian dairy industry has been through a period of change and volatility in recent years with major changes amongst the major processors, the milk-price step downs caused by falling global prices and the impact of drought on local production. The result of this tumult in the industry has been a significant decline in milk production and exit from the industry of a growing number of producers. Growing local consumption, export demand and prices all put pressure on the decreasing supply pool and, in turn, processors, to maintain milk supply to meet both local demand and maintain our position in export markets.
As producers continue to exit, and the impact of high input prices, the drought and the recent bushfires becomes clear, the major question facing the industry is how low will production fall, and how much milk is actually needed to sustain both domestic and export markets.
For those producers who are profitable in today’s market, the outlook is good. Lower milk supply and excess manufacturing capacity points towards strong prices as processors look to retain milk supply. While high fodder and water costs are likely to remain a part of the dairy industry landscape for the foreseeable future, efficient producers will build these variables into their individual business strategies, balancing input costs against price forecasts.
For consumers, the outlook for retail milk and dairy product prices is unclear, and will be driven by a number of variables. Changes in sourcing, offtake-pricing and production of milk will likely impact shelf prices, as will strategic and marketing decisions taken by retailers on milk prices and their place in wider supermarket pricing strategies. At the same time, the growing range of new dairy products available to consumers continues to present fresh opportunities for newer and smaller processors.
As the Australian dairy sector looks toward the 2020s, it does not hide from the challenges it faces, nor the changes which some stakeholders will still experience. Importantly, however, the market opportunities which have driven dairy growth and innovation over the past two decades remain as strong as ever.
Mark Bennett Head of Agribusiness & Specialised Commercial, Commercial Banking
@bennett2_mark
Over the past 20 years, every major Australian agricultural sector has gone through a major structural change, right across their
respective supply chains.
PAGE 3

KEY FINDINGS
• The domestic production outlook is flat, with total production reaching just over 9,400ML in 2030 – only slightly up on the most recent production figures;
• A constrained domestic production and ever-increasing demand for milk and dairy products in East Asia is likely to spell future strong prices for those dairy producers remaining in the industry;
• The impact of the recent bushfires, while locally devastating, is unlikely to have a significant impact on national milk supply;
• Australian milk production looks set to continue to be flat for the short term with current trends resulting in production in Queensland continuing to decline, while the primary source of growth would be seen in the southern states, particularly Tasmania, where production would rise by 20 per cent by 2030;
• Lower production in the major production countries should bode well for prices into the future, while many in the industry are concerned that consumers have limited tolerance for higher prices;
• The future of retail milk prices remains uncertain following the end of $1 milk in the major supermarkets. Depending on whether retailers continue to try and keep a lid on prices, the price of a litre of milk could increase at an average of between 1.4 and 2.8 per cent a year until 2030;
• Processors are likely to face the most significant challenges going forward as they look to make best use of manufacturing capacity and growing export markets with lower milk supply and a shifting supply base.
PAGE 4

GLOBAL MARKET UPDATE
The global dairy market finished 2019 with a sharp drop before recovering early in 2020 as the market readjusted after a strong,
negative response to Fonterra’s increase in auction volumes.
The most recent Global Dairy Trade auctions saw the average price rebound as the reality of relatively subdued global production reasserted itself. In the longer term, despite showing some weakness earlier in 2019 and global trade tensions, dairy prices are holding their ground.
A poorer than anticipated production season across the US and EU, as well as Australia’s decline in production has meant that supply has tightened and is expected to grow at a lower than expected rate for the foreseeable future. While slow production growth should bode well for prices, ongoing international trade tensions as well as low global economic growth have, to date, kept a lid on those prices and may continue to do so going forward.
Across the mix of products, cheese prices have remained relatively steady across the year. However recently, US prices have fallen sharply after jumping to over $US4,700/MT in November and now sit on par with Australian and New Zealand and European cheese prices. In contrast, butter prices have come back significantly following the surge in 2017 and 2018, and are now sitting around $US4,000/MT in the EU and Oceania, down from the heights of over $US8,000/MT in 2017 following a strong production response to high prices. Whole milk powder production has fallen from last year and while prices have remained relatively stable throughout the year in the EU and Oceania, the US has exhibited strong and consistent growth. Skim milk powder (SMP) prices have also recovered strongly as the EU continues to run down the last of its stockpile with Oceania SMP prices now sitting around 30 per cent higher than the same time last year. While global SMP demand has remained relatively flat for a number of years, the global stocks to use ratio has now fallen to 12.7 per cent, down from highs of 26.5 per cent in 2016.
In the longer term, there is no indication that production will jump strongly in the near future, suggesting that global milk production is set for a period of relatively low growth. New Zealand dairy farmers are facing an increasingly difficult setting in which to operate as government proposals on greenhouse gas emissions and water management have many in the industry concerned that New Zealand production has reached its peak. In a similar vein, major New Zealand co-operative, Fonterra, has sharply changed its focus back to its New Zealand milk supply and increasingly away from international milk pool. US producers are also facing difficulties, although of a very different nature to New Zealand producers. US producers are looking to expand the industry after prices have stayed stubbornly low since 2014 in the face of a claimed over-supply in milk production. As the US dairy industry has pivoted back towards an export focus and, amongst
Source: USDA PSD
GLOBAL CONSUMPTION OF MILK
180160
140
120
100
80
60
40
20
0
1,00
0,00
0 M
T
1964 1973 1991 20091982 2000 2018
East AsiaEU – 28
North AmericaOceania
South AsiaSE Asia
Other EuropeSouth America
PAGE 7

100
90
80
70
60
50
40
30
20
10
0
%
‘10 ‘19‘18‘17‘16‘15‘14‘13‘12‘11
US Russia MexicoUkraine NZ EU
CanadaBelarus
AustraliaArgentina
25
20
15
10
5
0
1,00
0,00
0 M
T
700
600
500
400
300
200
100
0
1,000,000 MT
1964 1982 2000 2018
ButterCheese
Dry Whole Milk PowderMilk, Nonfat Dry
Milk, Fluid (RH axis)
Source: USDA PSD Source: USDA PSD
GLOBAL CHEESE EXPORTS GLOBAL CONSUMPTION OF DAIRY PRODUCTS
others, increased its share of global exports from 11.1 per cent in 2010 to 18.1 per cent in 2018, they have also become increasingly reliant on global trade to manage domestic prices.
The recent US-China trade ‘deal’ may improve US dairy exports access to China as the Chinese Government has committed to removing a series of health standards that were used to block a variety of American agricultural imports. The Chinese Government has also committed to lowering licensing, inspection and registration rules that the US has viewed as barriers to trade across products including dairy, baby formula, meat, poultry, pet food, seafood, animal feed and biotech. It is yet to be seen whether Australian trade officials can secure a similar deal for Australian agricultural exports as a result of the US-China deal.
Global consumption of dairy products continues to exhibit stable and strong growth, particularly for butter and skim milk powder. Fluid milk, cheese and whole milk powder are showing consistent growth and show low volatility in demand. Developing nations continue to drive the strongest growth in demand, particularly in relation to fluid milk. The Food and Agriculture Organisation (FAO) is forecasting demand for milk and milk products in Asia will reach some 320 million tonnes by 2021. In response, the OECD is forecasting 80 per cent of the increase in production is anticipated to come from developing countries, in particular Pakistan and India, which are expected to jointly account for 32% of total milk production by 2027. However, of that increase in production, most of this additional production will be consumed domestically as fresh dairy products as both India’s and Pakistan’s dairy production is primarily through small herds without access to processing facilities for manufactured dairy products.
As a result, the major markets for Australian exports, particularly cheese, are likely to remain in China, Japan and the rest of Asia. This has been aided by the depreciation of the Australian dollar
compared to the US dollar, which has improved affordability of Australian exports despite the relatively high Australian farm-gate milk price.
The OECD is currently forecasting only slight growth in Australian exports of whole milk powder to 2028 and slight falls in skim milk powder and cheese exports, combined with a large fall in butter exports. However, these forecasts are made on current trends and manufacturing capacity. As Australian production becomes increasingly focused on domestic consumption, Australian exports hold a strong position for continued growth to the Asia region, where demand for both manufactured products and fresh milk continues to grow steadily. In terms of price-competitiveness, compared to the closest dairy exporter, New Zealand, Australian fluid milk and butter are price competitive, while US dairy is highly competitive with both Australia and New Zealand across both categories. Japan and South Korea are both highly lucrative markets for fluid milk, while China is a price competitive purchaser across the range of dairy products, showing the growing demand from the Chinese middle class.
THE RECENT US-CHINA TRADE DEAL COULD
BE SET TO IMPROVE THE COMPETITIVENESS
OF US DAIRY EXPORTS TO CHINA.
PAGE 8

China remains a strongly growing market for dairy exports, particularly in powdered and fluid milk. The OECD is predicting that China will remain the world’s major dairy importer, particularly for whole milk powder. China is also a major importer of fresh milk products and this is expected to grow at 2.7% p.a to 2028. While China gets most of its dairy supply out of the Oceania region through New Zealand and Australia, European exports of butter and skim milk powder have increased strongly, while the impact of the US-China trade deal is yet to be seen.
AS AUSTRALIAN PRODUCTION BECOMES
INCREASINGLY FOCUSSED ON DOMESTIC
CONSUMPTION, AUSTRALIAN EXPORTS
HOLD A STRONG POSITION FOR CONTINUED
GROWTH TO THE ASIA REGION.
‘000
Ton
s
2009 2010 20122011 2013 20152014 2016 201820170
100
200
300
400
500
600
700
800
900
1000
Milk, concentratedMilk, not concentrated
WheyButter
Cheese and curdButtermilk, curdled milk and cream, yogurt
Source: Trademap, ANZ
CHINESE DAIRY IMPORTS
US$
/ton
ne
0
1000
2000
3000
4000
5000
6000
7000
Cheese Butter Milk, conc’ Milk, non-conc’
Australia USA JapanNZ China
Source: TradeMap, ANZ
AVERAGE EXPORT AND IMPORT PRICES, 2018
PAGE 9


CHANGING FACE OF THE AUSTRALIAN DAIRY INDUSTRY
The story in the Australian industry is also one of limited supply, as more and more producers leave the industry.
So where do we go next?
While the total area operated by dairy farming in Australia increased strongly between 2011 and 2013, more recently it has fallen sharply, with dairy farmer numbers hitting historic lows in 2019. As a result, milk production has fallen heavily. In the year to August, milk production in Australian fell 6.9% due to drought conditions, high fodder costs and soaring water prices. Dairy Australia is currently forecasting a decrease of 3–5 per cent in national milk production to 8.3–8.5 billion litres for the season. While the impact of the recent New South Wales and Victorian bushfires remains unclear, dairy processors Bega, Saputo and Fonterra have all stated that the impact on their operations will be temporary and limited.
PRODUCTION AND DAIRY FARM CONSOLIDATION
This decline in production and dairy farm numbers has been driven by two trends: The exit of farmers from the industry and conversion in some dairy farms to other commodities, and the consolidation trend mirrored throughout Australian agriculture as smaller farms are merged into larger operations. In total, the number of dairy farms in Australia has decreased by 46 per cent since 2002. Those losses have been most concentrated in Queensland, South Australia and New South Wales where declines of up to 67 per cent have been felt. In contrast, the southern states of Victoria and Tasmania have seen less dramatic yet still significant declines of 39 and 24 per cent of farms respectively.
Source: ABARESSource: ABARES AgSurf
100 ML
1974 1985 2001 20170
1
2
3
4
5
6
7
8
0
200
400
600
800
1,000
1,200
1,400
1,600
NSW QLD
SAWA
TASVIC ML (RH axis)
100
ML
350
300
250
200
150
100
50
0
16
14
12
10
8
6
4
2
0
Num
ber (’000)
1990 1997 2004 2011 2018
Head/haArea operated (ha) at 30 June per farm
Number of farms (RH axis)
DAIRY FARM POPULATION AND TOTAL AREA OPERATED
MILK PRODUCTION BY STATE
PAGE 11

The consolidation trend in the Australian dairy industry has been more pronounced than in any other broadacre industry, falling 46 per cent since 2002. This is a stark comparison to both the number of sheep farms which has fallen 15 per cent since 2002, and beef farms which have actually increased in number by 3.6 per cent in that time. The only other industry which has experienced similar consolidation has been cropping where the number of farms has fallen 42 per cent since 2002. However, the consolidation for the Australian dairy industry trend has been exacerbated by the continued decline in area under dairy farms in the northern states, and continued decline in the northern dairy industry.
At the same time, total capital invested in the dairy industry has continued to generally trend higher – now sitting 14 per cent higher than in 2002, despite a decline in total capital invested in the industry between 2007 and 2012. However capital investment into dairy has again been split between states with Victoria and Tasmania continuing to attract capital and the other states seeing an overall decline in capital since 2002.
While the Australian dairy industry has gone through significant structural change in recent years in response to deregulation of the industry, the factors motivating consolidation are different from those leading to reduced broadacre farming. While consolidation of broadacre farming has primarily been motivated by the
economies of scale available to larger farmers with access to sufficient capital to invest in machinery and technology, the capital base for most dairy farmers remains similar regardless of size. This is reflected in the return on capital by size for dairy farms which sits at just over 5 per cent for both the largest and smallest decile of dairy farm by turnover. Similarly, output levels are more evenly spread across dairy farms by size, where the average dairy farm in the top decile produces around nine times more output than the average farm in the smallest decile. This not only reflects the capital base of the dairy industry, but also the pricing mechanism in Australian dairy where all farmers receive the same price from the processor regardless of size.
This all suggests that the long-term structural changes and shifts in Australian dairy are a factor of both ongoing consolidation, but also the realignment of the industry and production in response to strong competing commodity prices and a continually increasing cost base making dairy farming less viable in certain locations.
PROCESSING
Australian dairy product manufacturing has also gone through a period of great volatility in recent years, particularly with the sale of the operating assets and operating liabilities of Murray Goulburn and increased demand for the shrinking milk pool.
Num
ber o
f far
ms
Wheat and other croppingMixed livestock
SheepBeef
Dairy
0
5000
10000
15000
20000
25000
30000
1990 1992 1994 1996 1998 2000 2002 2004 2006 2008 2010 2012 2014 2016 2018
Source: ABARES AgSurf
NUMBER OF FARMS BY INDUSTRY
THIS DECLINE IN PRODUCTION AND DAIRY FARM NUMBERS HAS BEEN DRIVEN BY TWO
TRENDS – THE EXIT OF FARMERS FROM THE INDUSTRY AND CONVERSION OF SOME DAIRY
FARMS TO ALTERNATIVE USES, AND THE CONSOLIDATION TREND MIRRORED THROUGHOUT
AUSTRALIAN AGRICULTURE AS SMALLER FARMS ARE MERGED INTO LARGER OPERATORS.
PAGE 12
Source: ABARES AgSurf Source: ABARES
VALUE OF DAIRY LAND AND FIXED IMPROVEMENTS PER HA (BY STATE)
AUSTRALIAN DAIRY PRODUCTS MANUFACTURE
WHILE THE AUSTRALIAN MANUFACTURING
LANDSCAPE CONTINUES TO CHANGE AND
TO CAPTURE THE HIGHER VALUE DOMESTIC
AND EXPORT MARKETS, A LARGE FACTOR IN
THE SHIFT IN MANUFACTURING HAS BEEN
THE FLAT DOMESTIC RETAIL PRICES.
The changes in the Australian dairy processing landscape over the past few years have been well publicised. These have included:
• The events surrounding Murray Goulburn;• The entrance to the market of the Canadian dairy giant
Saputo;• Saputo’s acquisition of Warrnambool Cheese and Butter,
together with the operating assets and operating liabilities of Murray Goulburn;
• The growth of Bega;• The current sale of Lion Dairy and Drinks to China’s
Mengniu;• Mengniu’s acquisition of the infant milk formula producer
Bellamy’s. Capital investment into the dairy industry continues to focus on higher value-add goods such as cheese and yoghurt , as well as an increasing focus on Australia’s export markets where cheese exports made up almost 30 per cent of Australian dairy exports in 2018. This shift in production has also come at the expense of butter and whole milk powder production.
While the Australian manufacturing landscape continues to change and to capture the higher value domestic and export markets, a large factor in the shift in manufacturing has been the flat domestic retail prices. While retail milk prices were increasing rapidly up until the introduction of $1 milk, they have remained below 2007 levels for many years now. Domestic cheese prices also jumped up until 2015 when cheap imports, particularly from New Zealand, pulled growth back. The removal of $1 milk last year has sparked talk in the industry of increases prices and margins for both processors and producers. Given the recent lack of growth in retail prices, there is the potential for consumers to bear a further increase in retail prices, even back to pre-$1 milk prices.
$ pe
r ha
AustraliaNSW Tas
Vic
1990/91 1999/00 2008/09 2017/18
25,000
20,000
15,000
10,000
5,000
0
ktButter ktCheese kt Skim milk powder kt
Whole milk powder kt
1990/91 1999/00 2008/09 2016/170
50
100
150
200
250
300
350
400
450
The pattern of consolidation, change in ownership, and entrance of offshore players in the processing sector has been broadly reflected across other major Australian agribusiness sectors – most notably grain, but also meat processing. It has largely been driven by efficiencies of scale, strategic benefits of new assets, and regulatory requirements.
These changes have undoubtedly impacted producers, who have found themselves with new options for offtake and supply contracts.
However, in broader terms, the changes and the entrance of new players should be seen as a positive for the Australian sector. The new players have made their decision to invest in the Australian market based on a well-researched, long-term, positive outlook for the Australian dairy sector, particularly exports. Fundamental to this is a large and sustainable supplier base. Downstream, at the export market and consumer end, these new players also bring both scale and local expertise in new markets for both product innovation and market penetration.
PAGE 13

Inde
x
Dairy and related productsMilk
CheeseIce cream and other dairy products
Jun ‘89 Jun ‘99 Jun ‘09 Oct ‘1740.0
50.0
60.0
70.0
80.0
90.0
100.0
110.0
120.0
130.0
Source: ABS
RETAIL DAIRY PRODUCT PRICES
THE CHANGES IN THE AUSTRALIAN PROCESSING SECTOR SHOULD BE SEEN AS A POSITIVE
FOR THE AUSTRALIAN SECTOR. THESE INVESTMENTS HAVE BEEN MADE ON A LONG-TERM
POSITIVE OUTLOOK FOR THE INDUSTRY.
PAGE 14

PAGE 15
With dairy producers under increasing pressure from drought conditions, high fodder costs and increasing water prices, milk production has continued to fall as producers
have left the industry.
The major question facing the industry is where is production headed into the future? Has Australian production hit the bottom yet, or is there further to go?
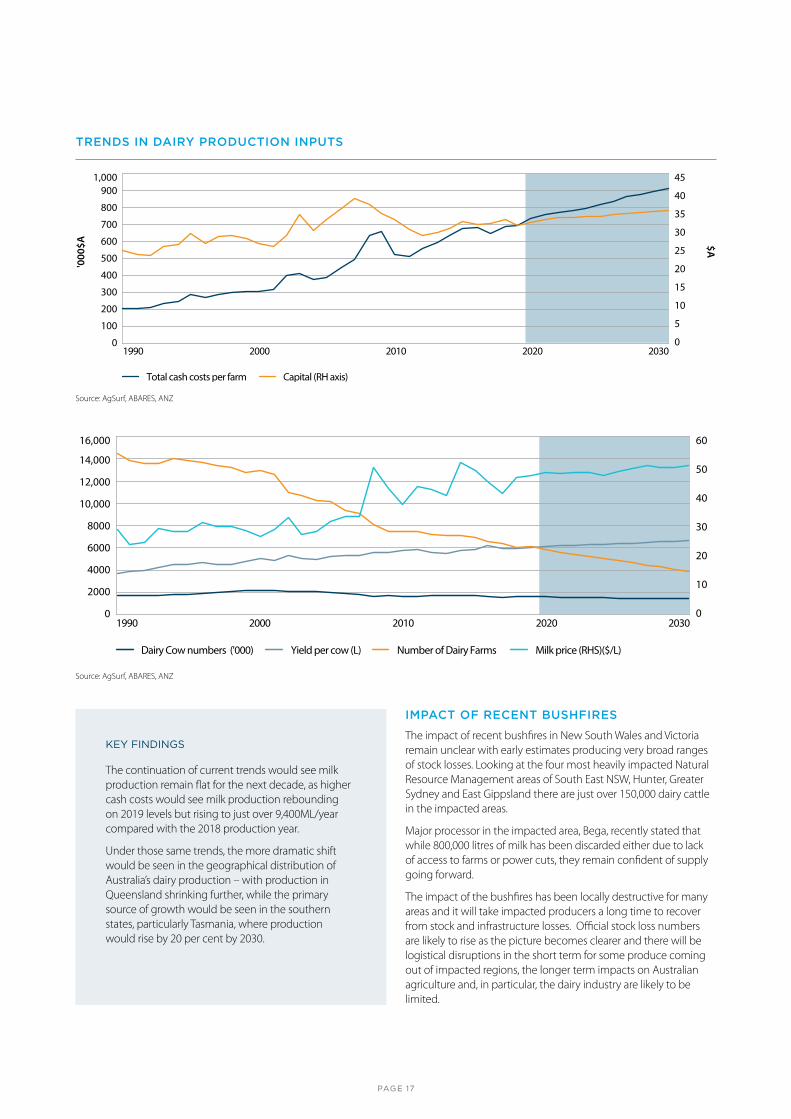
If we look at the current trends in major inputs into dairy farming, we see the continued increase in total capital investment in the industry, which looks set to continue until 2030, albeit not quite back to the heights of 2017. At the same time, cash costs are on a fairly consistent upward trend, which, if it continued, would see farmers facing costs of over $900,000 each year by 2030, an increase of 32 per cent on 2018 costs, while income would increase to $1,080,000 – an increase of 26 per cent. While we don’t expect income and outgoings to continue to follow the
trend of the past 10 years alone, it does show the importance of continuing to grow productivity and efficiency in the dairy sector.
Other major on-farm inputs, including dairy cow numbers, farm numbers and milk yield have all followed a very consistent trend with no indication of a change in direction. The milk price remains the most volatile input, based on global prices and local conditions – however on the trend alone, the farm-gate milk price will flatten out towards 2030 at an average of around 50c/L.
LOOKING TOWARDS 2030
1614
12
10
8
6
4
2
0
108
106
104
102
100
98
96
94
kgL
1990/91 1999/00 2008/09 2017/18
ButterCheese
Australian cheese Market milk (RH axis)Yoghurt
Source: ABARES
DOMESTIC CONSUMPTION OF DAIRY PRODUCTS PER CAPITA
PAGE 16
IMPACT OF RECENT BUSHFIRES
The impact of recent bushfires in New South Wales and Victoria remain unclear with early estimates producing very broad ranges of stock losses. Looking at the four most heavily impacted Natural Resource Management areas of South East NSW, Hunter, Greater Sydney and East Gippsland there are just over 150,000 dairy cattle in the impacted areas.
Major processor in the impacted area, Bega, recently stated that while 800,000 litres of milk has been discarded either due to lack of access to farms or power cuts, they remain confident of supply going forward.
The impact of the bushfires has been locally destructive for many areas and it will take impacted producers a long time to recover from stock and infrastructure losses. Official stock loss numbers are likely to rise as the picture becomes clearer and there will be logistical disruptions in the short term for some produce coming out of impacted regions, the longer term impacts on Australian agriculture and, in particular, the dairy industry are likely to be limited.
Source: AgSurf, ABARES, ANZ
Source: AgSurf, ABARES, ANZ
1,000900
800
700
600
500
400
300
200
100
0
45
40
35
30
25
20
15
10
5
0
'000
$A $A
1990 2000 2010 2020 2030
Total cash costs per farm Capital (RH axis)
16,000
14,000
12,000
10,000
8000
6000
4000
2000
0
60
50
40
30
20
10
01990 2000 2010 2020 2030
Dairy Cow numbers ('000) Yield per cow (L) Number of Dairy Farms Milk price (RHS)($/L)
TRENDS IN DAIRY PRODUCTION INPUTS
KEY FINDINGS
The continuation of current trends would see milk production remain flat for the next decade, as higher cash costs would see milk production rebounding on 2019 levels but rising to just over 9,400ML/year compared with the 2018 production year.
Under those same trends, the more dramatic shift would be seen in the geographical distribution of Australia’s dairy production – with production in Queensland shrinking further, while the primary source of growth would be seen in the southern states, particularly Tasmania, where production would rise by 20 per cent by 2030.
PAGE 17
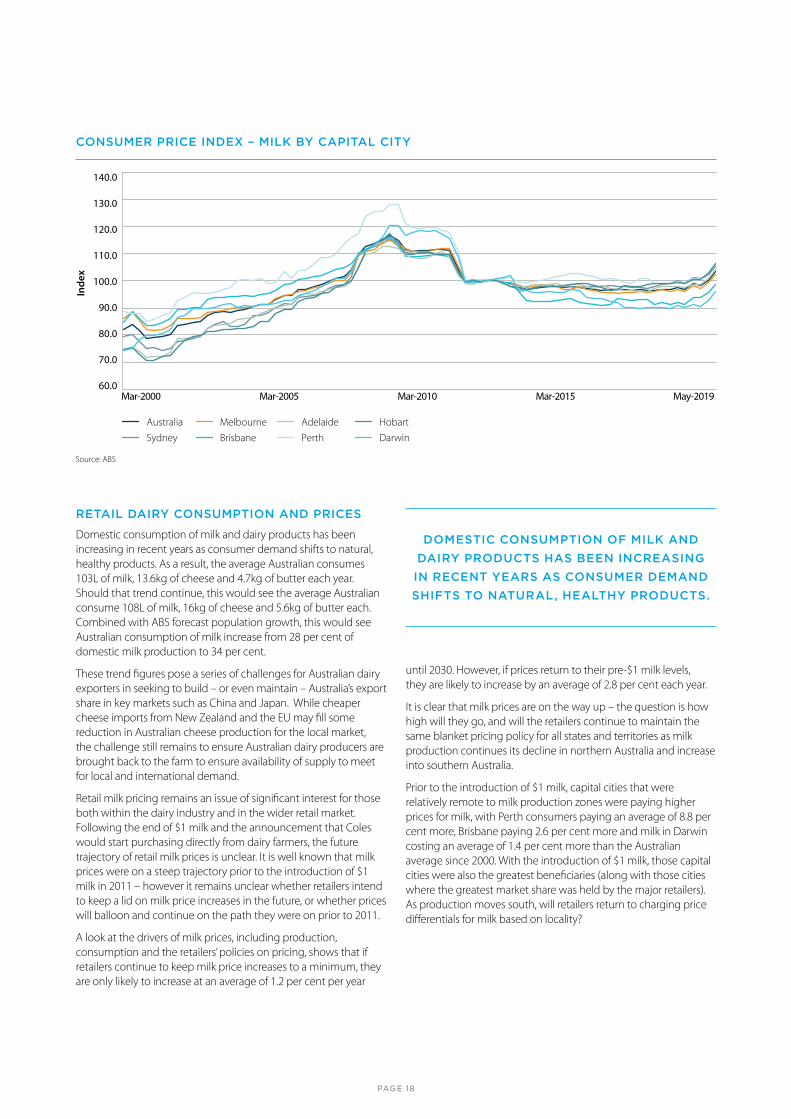
RETAIL DAIRY CONSUMPTION AND PRICES
Domestic consumption of milk and dairy products has been increasing in recent years as consumer demand shifts to natural, healthy products. As a result, the average Australian consumes 103L of milk, 13.6kg of cheese and 4.7kg of butter each year. Should that trend continue, this would see the average Australian consume 108L of milk, 16kg of cheese and 5.6kg of butter each. Combined with ABS forecast population growth, this would see Australian consumption of milk increase from 28 per cent of domestic milk production to 34 per cent.
These trend figures pose a series of challenges for Australian dairy exporters in seeking to build – or even maintain – Australia’s export share in key markets such as China and Japan. While cheaper cheese imports from New Zealand and the EU may fill some reduction in Australian cheese production for the local market, the challenge still remains to ensure Australian dairy producers are brought back to the farm to ensure availability of supply to meet for local and international demand.
Retail milk pricing remains an issue of significant interest for those both within the dairy industry and in the wider retail market. Following the end of $1 milk and the announcement that Coles would start purchasing directly from dairy farmers, the future trajectory of retail milk prices is unclear. It is well known that milk prices were on a steep trajectory prior to the introduction of $1 milk in 2011 – however it remains unclear whether retailers intend to keep a lid on milk price increases in the future, or whether prices will balloon and continue on the path they were on prior to 2011.
A look at the drivers of milk prices, including production, consumption and the retailers’ policies on pricing, shows that if retailers continue to keep milk price increases to a minimum, they are only likely to increase at an average of 1.2 per cent per year
until 2030. However, if prices return to their pre-$1 milk levels, they are likely to increase by an average of 2.8 per cent each year.
It is clear that milk prices are on the way up – the question is how high will they go, and will the retailers continue to maintain the same blanket pricing policy for all states and territories as milk production continues its decline in northern Australia and increase into southern Australia.
Prior to the introduction of $1 milk, capital cities that were relatively remote to milk production zones were paying higher prices for milk, with Perth consumers paying an average of 8.8 per cent more, Brisbane paying 2.6 per cent more and milk in Darwin costing an average of 1.4 per cent more than the Australian average since 2000. With the introduction of $1 milk, those capital cities were also the greatest beneficiaries (along with those cities where the greatest market share was held by the major retailers). As production moves south, will retailers return to charging price differentials for milk based on locality?
DOMESTIC CONSUMPTION OF MILK AND
DAIRY PRODUCTS HAS BEEN INCREASING
IN RECENT YEARS AS CONSUMER DEMAND
SHIFTS TO NATURAL, HEALTHY PRODUCTS.
Inde
x
AustraliaSydney
MelbourneBrisbane Perth
AdelaideDarwinHobart
Mar-2000 Mar-2005 Mar-2010 Mar-2015 May-201960.0
70.0
80.0
90.0
100.0
110.0
120.0
130.0
140.0
Source: ABS
CONSUMER PRICE INDEX – MILK BY CAPITAL CITY
PAGE 18

DISCLAIMER
The distribution of this document or streaming of this video broadcast (as applicable, “publication”) may be restricted by law in certain jurisdictions. Persons who receive this publication must inform themselves about and observe all relevant restrictions.
1. Disclaimer for all jurisdictions, where content is authored by ANZ Research:
Except if otherwise specified in section 2 below, this publication is issued and distributed in your country/region by Australia and New Zealand Banking Group Limited (ABN 11 005 357 522) (“ANZ”), on the basis that it is only for the information of the specified recipient or permitted user of the relevant website (collectively, “recipient”). This publication may not be reproduced, distributed or published by any recipient for any purpose. It is general information and has been prepared without taking into account the objectives, financial situation or needs of any person. Nothing in this publication is intended to be an offer to sell, or a solicitation of an offer to buy, any product, instrument or investment, to effect any transaction or to conclude any legal act of any kind. If, despite the foregoing, any services or products referred to in this publication are deemed to be offered in the jurisdiction in which this publication is received or accessed, no such service or product is intended for nor available to persons resident in that jurisdiction if it would be contradictory to local law or regulation. Such local laws, regulations and other limitations always apply with non-exclusive jurisdiction of local courts. Before making an investment decision, recipients should seek independent financial, legal, tax and other relevant advice having regard to their particular circumstances.
The views and recommendations expressed in this publication are the author’s. They are based on information known by the author and on sources which the author believes to be reliable, but may involve material elements of subjective judgement and analysis. Unless specifically stated otherwise: they are current on the date of this publication and are subject to change without notice; and, all price information is indicative only. Any of the views and recommendations which comprise estimates, forecasts or other projections, are subject to significant uncertainties and contingencies that cannot reasonably be anticipated. On this basis, such views and recommendations may not always be achieved or prove to be correct. Indications of past performance in this publication will not necessarily be repeated in the future. No representation is being made that any investment will or is likely to achieve profits or losses similar to those achieved in the past, or that significant losses will be avoided.
Additionally, this publication may contain ‘forward looking statements’. Actual events or results or actual performance may differ materially from those reflected or contemplated in such forward looking statements. All investments entail a risk and may result in both profits and losses. Foreign currency rates of exchange may adversely affect the value, price or income of any products or services described in this publication. The products and services described in this publication are not suitable for all investors, and transacting in these products or services may be considered risky. ANZ and its related bodies corporate and affiliates, and the
officers, employees, contractors and agents of each of them (including the author) (“Affiliates”), do not make any representation as to the accuracy, completeness or currency of the views or recommendations expressed in this publication. Neither ANZ nor its Affiliates accept any responsibility to inform you of any matter that subsequently comes to their notice, which may affect the accuracy, completeness or currency of the information in this publication.
Except as required by law, and only to the extent so required: neither ANZ nor its Affiliates warrant or guarantee the performance of any of the products or services described in this publication or any return on any associated investment; and, ANZ and its Affiliates expressly disclaim any responsibility and shall not be liable for any loss, damage, claim, liability, proceedings, cost or expense (“Liability”) arising directly or indirectly and whether in tort (including negligence), contract, equity or otherwise out of or in connection with this publication.
If this publication has been distributed by electronic transmission, such as e-mail, then such transmission cannot be guaranteed to be secure or error-free as information could be intercepted, corrupted, lost, destroyed, arrive late or incomplete, or contain viruses. ANZ and its Affiliates do not accept any Liability as a result of electronic transmission of this publication.
ANZ and its Affiliates may have an interest in the subject matter of this publication as follows:
• They may receive fees from customers for dealing in the products or services described in this publication, and their staff and introducers of business may share in such fees or receive a bonus that may be influenced by total sales.
• They or their customers may have or have had interests or long or short positions in the products or services described in this publication, and may at any time make purchases and/or sales in them as principal or agent.
• They may act or have acted as market-maker in products described in this publication.
ANZ and its Affiliates may rely on information barriers and other arrangements to control the flow of information contained in one or more business areas within ANZ or within its Affiliates into other business areas of ANZ or of its Affiliates.
Please contact your ANZ point of contact with any questions about this publication including for further information on these disclosures of interest.
2. Country/region specific information:
Australia. This publication is distributed in Australia by ANZ. ANZ holds an Australian Financial Services licence no. 234527. A copy of ANZ's Financial Services Guide is available at http://www.anz.com/documents/AU/aboutANZ/FinancialServicesGuide.pdf and is available upon request from your ANZ point of contact. If trading strategies or recommendations are included in this publication, they are solely for the information of ‘wholesale clients’ (as defined in section 761G of the Corporations Act 2001 Cth). Persons who receive this publication must inform themselves about and observe all relevant restrictions.
CONTACTS
MARK BENNETT
Head of Agribusiness & Specialised Commercial, Commercial Banking T: +61 3 8655 4097 E: [email protected]
IAN HANRAHAN
Head of Food, Beverage & Agribusiness, Australia – Institutional Banking T: +61 7 3947 5299 E: [email protected]
CONTRIBUTORS
MADELEINE SWAN
Associate Director Agribusiness Research, Commercial Banking T: +61 419 897 483 E: [email protected]

Australia and N
ew Zealand Banking G
roup Limited (A
NZ) A
BN 11 005 357 522. 01.2020 23101
anz.com