
In February 2009 McKinsey was instructed by the … report.pdfIn February 2009 McKinsey was...
124
In February 2009 McKinsey was instructed by the Department to provide advice on how commissioners might achieve world class NHS productivity to inform the second year of the world class commissioning assurance system and future commissioner development. The advice from McKinsey, in the form of the following slides, was provided in March 2009. Department of Health, May 2010
Transcript of In February 2009 McKinsey was instructed by the … report.pdfIn February 2009 McKinsey was...
In February 2009 McKinsey was instructed by the Department to provide advice on how commissioners might achieve world class NHS productivity to inform the second year of the world class commissioning assurance system and future commissioner development. The advice from McKinsey, in the form of the following slides, was provided in March 2009.
Department of Health, May 2010

Achieving World Class Productivity in the NHS 2009/10 – 2013/14: Detailing the Size of the Opportunity
March 2009

Summary
McKinsey & Company 1
Working D
raft -Last Modified 18/03/2009 15:41:52
Printed 18/03/2009 15:36:55
|
▪ The next spending review may well result in significantly lower rates of growth in NHS spending than has been the case for the last 8 years, resulting in a possible funding gap of £10-15bn in 2013/14 or ~ 10% of spend.
▪ The NHS in England could potentially capture efficiencies in health and healthcare services by between 15 and 22% of current spend, or £13–20bn, over the next 3-5 years.
▪ This reduction could come from– technical efficiency savings of £6.0 - 9.2bn found from provider costs– allocative efficiency savings of £4.7 - 6.6bn due to no longer commissioning low value added healthcare
interventions and ensuring compliance with commissioners’ standards– savings of £2.7 - 4.1bn from a shift in the management of care away from hospitals towards more cost effective
out-of-hospital alternatives.
▪ Further savings could come from a greater focus on prevention resulting in lower demand for healthcare services but this would likely not be realised within the next 3-5 years.
▪ Achieving a step change in spend on health and healthcare services will require a compelling case for change; the use of formal mechanisms to drive through efficiency gains; deployment of WCC structures and processes; removal of national barriers to change; introduction of incentives schemes; and an increase in skills and capabilities to drive out costs.
▪ We recommend a nationally-enabled programme delivered through the SHAs and PCTs to drive through efficiency savings. The DH should take direct actions to capture some opportunities e.g. lowering tariffs. And should enable delivery by creating a compelling story, removing barriers, developing frameworks/tools and embedding the drive for efficiency gains within existing mechanisms e.g. WCC.

McKinsey & Company 2
Working D
raft -Last Modified 18/03/2009 15:41:52
Printed 18/03/2009 15:36:55
|
Contents
▪ The challenge and size of the opportunity
▪ Detailing the opportunities
▪ Implications
▪ Making it happen
▪ Backup: Methodology and assumptions

Macroeconomic context has dramatically worsened in the last 12 months
McKinsey & Company 3
Working D
raft -Last Modified 18/03/2009 15:41:52
Printed 18/03/2009 15:36:55
|
-1,0
-0,5
0
0,5
1,0
1,5
2,0
2,5
3,0
3,5
4,0
2006 2007 2008 2009
Bad news is everywhere …… and the numbers confirm the crisis in the real economy
Real GDP growthPercent
Source: BEA, McKinsey analysis

Declines in health care spend are typically observed after a crisis across European countries
McKinsey & Company 4
Working D
raft -Last Modified 18/03/2009 15:41:52
Printed 18/03/2009 15:36:55
|
Oil crisis1
(1980-83)
Negative year-on-year health care growth within two years
Share of European countries experiencing negative year-on-year health care growth within 2 years of negative GDP growthAs percentage
23
77
Post-Soviet destabilization2
(1988-93)
41
59
SOURCE: OECD
1 Austria, Belgium, Denmark, Germany, Iceland, Ireland, Luxembourg, Netherlands, Portugal, Spain, Sweden, Switzerland and UK2 Belgium, Czech Republic, Denmark, Finland, France, Germany, Greece, Hungary, Iceland, Italy, Norway, Poland, Portugal, Spain, Sweden,
Switzerland, UK

McKinsey & Company 5
Working D
raft -Last Modified 18/03/2009 15:41:52
Printed 18/03/2009 15:36:55
|
In the UK, after the private sector recession comes the public sector oneGrowth in public spend in real terms in the UK, %
-10
-5
0
5
10
15
Total government spending
Total government spending less socialsecurity and debt interest
Percentage increase after economy-wide inflation%
2007
-08
2006
-07
2005
-06
2004
-05
2003
-04
2002
-03
2001
-02
2000
-01
1999
-00
1998
-99
1997
-98
1996
-97
1995
-96
1994
-95
1993
-94
1992
-93
1991
-92
1990
-91
1989
-90
1988
-89
1987
-88
1986
-87
1985
-86
1984
-85
1983
-84
1982
-83
1981
-82
1980
-81
1979
-80
1978
-79
1977
-78
1976
-77
1975
-76
1974
-75
1973
-74
1972
-73
1971
-72
1970
-71
1973-74 – Oil crisis
Early 1980s recession
Early 1990s recession
Financial year
Public spend substantially squeezed after recession
years
Source: Institute for fiscal studies

McKinsey & Company 6
Working D
raft -Last Modified 18/03/2009 15:41:52
Printed 18/03/2009 15:36:55
|
50
60
80
90
99/00 01/02 03/04 05/06 07/08 09/10 11/12 13/140
100
110
120
40
70
£ billion. NHS England allocations and expenditure, 1999/2000 to 2013/14 estimated
The next spending review period from 2011/12 will be much tougher with a potential funding gap of £10-15bn.
Assuming funding allocation grows between 0%- 1.5% from 2011/12 and current levels of productivity and demand
Allocations growth 1.5% p.a.
Spend1
Potentialgap £10-15bn
Allocations growth 0% p.a.
1 2.5% inflation, except for drugs 5.5%; activity growth based on 98-06 trend. Assumes spend and allocations balanced in 2009/10 and 2010/11Note: Excludes NHS pensions (£14bn), Capital Expenditure (£4.5bn) and Excludes Personal Social Services (£1.5bn),
Source:Department of Health Annual Reports, Operating Framework 2009/10 and 2010/11, McKinsey analysis

Historically, activity has lagged spend largely due to the labour costs pressure both in acute care and primary care
McKinsey & Company 7
Working D
raft -Last Modified 18/03/2009 15:41:52
Printed 18/03/2009 15:36:55
|
1 Includes acute and mental health care NHS trusts 2 GPD deflator used3 Includes GPs and nursesSOURCE: HES online; Hospital activity statistics; Information centre; IMF; Q-Research, McKinsey analysis
90
100
110
120
130
140
150
160
170
180
190
99/00 00/01 01/02 02/03 03/04 04/05 05/06 06/07
Hospital admissions
OP attendance
Total NHSSpend – real2
Average cost per WTE1
Primary careconsultations3
FCEs
Index 99/00=100

McKinsey & Company 8
Working D
raft -Last Modified 18/03/2009 15:41:52
Printed 18/03/2009 15:36:55
|
Potential scope for improvement (on a recurrent basis) of £13-20bn or 15-22% of the current NHS spend£bn. 2013/14 recurrent potential savings, England.
Total potential efficiencies
13.4 – 19.9
Increased prevention
45%
55%
6.0-9.2
Realise cost efficiencies in all provider services
4.7-6.6
Optimize spendand ensure compliance with standards
2.7 - 4.1
Shift care into more cost effective settings
0
ESTIMATE
% reduction vs. 08/09 NHS spend 6-10% 5-7% 3-4% 15-22%
Technical efficiency
Allocative efficiency
0%
Potential size of the opportunity; part cash, part reinvested in improved care
1-3 years 3-5 years + 5 years
Tariff and other national levers
Non tariff

McKinsey & Company 9
Working D
raft -Last Modified 18/03/2009 15:41:52
Printed 18/03/2009 15:36:55
|
Drive through costs efficiencies in all provider services
The specific opportunities for improvement include the following
Driving acute providerproductivity
11
Optimize spend and ensure compliance with standards
Shift care into more costs effective setting
Driving non -acute providerproductivity
Supply chain and procure-ment
Estates optimisation
Optimising spend within care pathways
Enforcing PCT contracts/ standards
Enhancing self care & chronic disease mgment.
Local health economy reconfigura-tions
22 33 44 55 66 77 88
• Community services
• Mental health and LD providers
• GPs
• Reduce drug spend
• Optimize supply chain and procurement of clinical and non clinical supplies
• PCTs and providers’ estates costs
• PFIschemes
• Stop procedures with no/ limited clinical benefit
• Target most costs effective interventions
• Conduct utilisation reviews
• Unscheduled care
• Shifting acute care to primary/ community/ home care
• Reduce variation in clinical and non-clinical staff productivity

McKinsey & Company 10
Working D
raft -Last Modified 18/03/2009 15:41:52
Printed 18/03/2009 15:36:55
|
Breakdown of the potential through the implementation of the identified opportunities £bn. 2013/14 recurrent potential savings. England
1.9-3.0
Drive acute providers’productivity
1.3-1.9
Driving non-acute providers’productivity
2.3-3.7
Supply Chain/ procure-ment
0.5-0.6
Estates optimisa-tion
3.7-4.9
Optimising spend within care pathways
1.1-1.7
Enforcing PCTs contracts/ standards
1.9-2.5
Enhancing self care and chronic diseases mgment
0.8-1.6
Local health economy reconfigur-ations
13.4-19.9
Total potential
ESTIMATE
Current spend£bn
% reduction vs. 2008/09 spend
22 29 515 63 56
9-14% 8-13% 11-14%8-12% 6-8% 2-3%
19
10-13%
92
15-22%
Programme
24
4-7%
11
2233
4455
6677
88
Programme number

McKinsey & Company 11
Working D
raft -Last Modified 18/03/2009 15:41:52
Printed 18/03/2009 15:36:55
|
Mec
hani
sms
to c
aptu
re
Drive through costs efficiencies in all provider services
The overall effort can be structured around 16 programmes to include both the opportunities and the required enablers
Drive acute providerproductivity
11
GPs/Consultants contracts
Market structure/management
Commissioning tools & enforcing contracts
Applicable to capture the value
Optimize spend and ensure compliance with standards
Shift care into more costs effective setting
Drive non -acute providerproductivity
Supply chain
Estates optimisation
Optimising spend within care pathways
Enforcing PCT contracts/ standards
Enhancing self care and chronic disease mgment.
Local health economy reconfigura-tions
22 33 44 55 66 77 88
Tariff and reimbursements
Personal budgets and financial incentives
Workforce
ITBar
riers
/ en
able
rs
99
1010
1111
1212
1313
1414
1515
Capabilities1616

McKinsey & Company 12
Working D
raft -Last Modified 18/03/2009 15:41:52
Printed 18/03/2009 15:36:55
|
Contents
▪ The challenge and size of the opportunity
▪ Detailing the opportunities– Drive cost efficiencies in all provider services– Optimize spend and ensure compliance with
commissioners' standards– Shift care into more cost-effective settings
▪ Implications
▪ Making it happen
▪ Backup: Methodology and assumptions
McKinsey & Company 13
Working D
raft -Last Modified 18/03/2009 15:41:52
Printed 18/03/2009 15:36:55
|
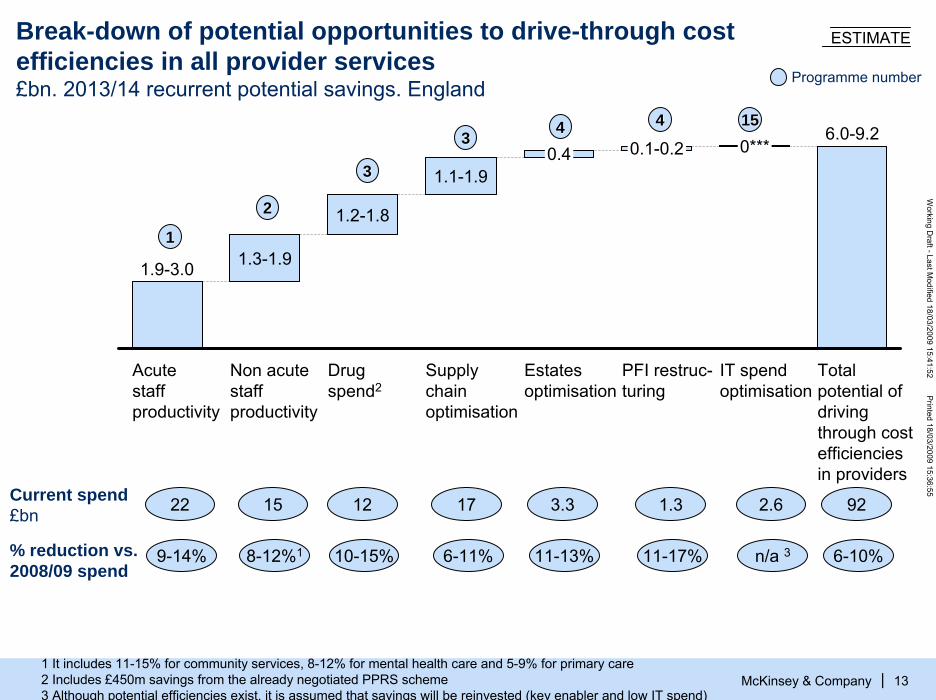
Break-down of potential opportunities to drive-through cost efficiencies in all provider services£bn. 2013/14 recurrent potential savings. England
1.9-3.0
Acute staff productivity
1.3-1.9
Non acute staff productivity
1.2-1.8
Drug spend2
1.1-1.9
Supply chain optimisation
0.4
Estates optimisation
0.1-0.2
PFI restruc-turing
0***
IT spend optimisation
6.0-9.2
Total potential of driving through cost efficiencies in providers
ESTIMATE
Current spend£bn
% reduction vs. 2008/09 spend
22 12 1715 3.3 1.3
9-14% 10-15% 6-11%8-12%1 11-13% 11-17%
2.6
n/a 3
92
6-10%
11
Programme number
22
33
33 44 44 1515
1 It includes 11-15% for community services, 8-12% for mental health care and 5-9% for primary care2 Includes £450m savings from the already negotiated PPRS scheme3 Although potential efficiencies exist, it is assumed that savings will be reinvested (key enabler and low IT spend)

Acute providers – Potential savings of £1.9–3.0b if all providers below the median productivity achieve 50–80% of the potential improvement of stepping up to the median
McKinsey & Company 14
Working D
raft -Last Modified 18/03/2009 15:41:52
Printed 18/03/2009 15:36:55
|SOURCE: The Information Centre for Health and Social Care 2007 – Workforce Census; National Audit Office –Summarised Accounts Care purchased by PCTs; HES Online; McKinsey analysis
1
5.0
3.2
8.1
5.7
22.0
Total acute staff costs
1. 9–3.0
Potential acute staff efficiency
4.4–4.6
2.6–2.8
7.0 –7.4
5.0–5.3
19.0–20.1
Total acute staff costs, acute staff productivity improv.
Non clinical staff
Other non-clinical
Nurses
Doctors
Potential savings
9–14
7–11
11–18
9–14
8–13
Key opportunities▪ Increase nurses
patient-facing time
▪ Increase throughput of diagnostics
▪ Reduce variability of FCEs per doctor (± 50% difference top and bottom quartile)
▪ Standardise pathways
£b, 2008/09. Acute staff costs
£b % of spend
0.4–0.6
0.7–1.1
0.4–0.7
0.4–0.6
1.9–3.0
Pay costs

Acute providers – £1.5–2.4bn savings if all providers below the median of clinical staff productivity achieve 50–80% of the potential improvement of stepping up to the median
McKinsey & Company 15
Working D
raft -Last Modified 18/03/2009 15:41:52
Printed 18/03/2009 15:36:55
|
264Top decile
231Top quartile
204Median
159Bottom quartile
46Bottom decile
Percentile Doctors
93
87
75
61
16
Current productivity levels,FCE/staff member
Nurses
Potential savings from productivity increase, £bn
0.4-0.7 0.7-1.1
284
246
206
148
29
Other clinical staff
0.4-0.6
9–14%* opportunity to
improve productivity
X
50% of budget
X
£33b acute commissioning
spending
=
£1.5–2.4bn
1
* Top of range: bottom performers stepping up to 80% of the median (e.g., for doctors from 159 to 195). Bottom of the range: bottom performers step up to 50% of the median (e.g., for doctors from 159 to 182)
Source: HES data, National Audit Office, McKinsey analysis

Acute providers – In addition, £0.4–0.6bn savings if all providers below the median of non clinical staff productivity achieve 50–80% of reaching the median
McKinsey & Company 16
Working D
raft -Last Modified 18/03/2009 15:41:52
Printed 18/03/2009 15:36:55
|
0,56
0,66
0,79
0,89
1,01Top decile
Top quartile
Median
Bottom quartile
Bottom decile
Percentile
Ratio of non clinical staff to clinical staffIndex 7–11%* opportunity
to improve productivity
X
280,000 non-clinicalstaff
X£20,000/FTE/year
=£0.4–0.6bn
1
* Top of range: bottom performers stepping up to 80% of the median (e.g., for top quartile from 0,89 to 0,81). Bottom of the range: bottom performers step up to 50% of the median (e.g., for top quartile from 0.89 to 0.84 )
Source: HES data, National Audit Office, McKinsey analysis

Acute providers – nurses spend only 41% of their time on patient care
1
% of time spent by nurses on acute and general medicine wards Direct patient care
McKinsey & Company 17
Working D
raft -Last Modified 18/03/2009 15:41:52
Printed 18/03/2009 15:36:55
|
14
126
7
15
16
415
25
100
Available time
Motion Paper work and adminis-tration
Hand-over and coordi-nation
Discus-sionwith other nurses
Medication adminis-tration(away from the patients)
Others Patient care
Psycho-social care of patients
Physical care of patients
Non-patient care time Patient care time
Source: Wards observation

Acute providers – Study across FTs found only 55% of community midwives time is spent on patient facing activities
1
McKinsey & Company 18
Working D
raft -Last Modified 18/03/2009 15:41:52
Printed 18/03/2009 15:36:55
|
100%
Average time worked
3%
Breaks/lunch
17%
Travel time
22%
Admin*
3%
Other
1%
Classes AntenatalPostnatal
22%2.8
55%
Overall mean activity breakdown per day (2006), %100% = 8.6 hours
* Admin also includes phone calls, texting, emails, meetingsSource: Benchmark Trusts, Foundation Trust Network

1 Acute providers – potential to increase CT throughput by 50-100%Number of CT scans per machine per hour of operation. 2006
McKinsey & Company 19
Working D
raft -Last Modified 18/03/2009 15:41:52
Printed 18/03/2009 15:36:55
|
4.03.3
3.8
2.21.91.8
1.4
Hospital X Hospital Y Hospital Z Canadianhospital
U.S. AMCexample
High volumeexample
Theoreticalcapacity
Key levers to increase throughput
• Reduce downtime e.g., scheduling, patient ready• Reduce rework• Standardize process e.g., consistent protocols

Acute providers – Potential to increase usage of the clinical rooms in 80%* of the potential slots
1
Clinical room usage
> 80%50 - 80%< 50%
McKinsey & Company 20
Working D
raft -Last Modified 18/03/2009 15:41:52
Printed 18/03/2009 15:36:55
|
Monday Tuesday Wednesday Thursday Friday Saturday Sunday
Morning 75% 35% 53% 91% 34% 45% 10%
Afternoon 80% 60% 85% 45% 56% 45% 15%
Evening 80% 60% 65% 45% 56% 45% 5%
Morning 75% 35% 53% 91% 34% 45% 10%
Afternoon 80% 60% 85% 45% 56% 45% 15%
Evening 80% 60% 65% 45% 56% 45% 5%
Morning 75% 35% 53% 91% 34% 45% 10%
Afternoon 80% 60% 85% 45% 56% 45% 15%
Evening 80% 60% 65% 45% 56% 45% 5%
Clin
ic ro
om A
Clin
ic ro
om B
Clin
ic ro
om C
* Assumes target utilisation 80% or more

Acute providers – Opportunity to increase day surgery ratesDay cases as proportion of total activity by specialty, %, London
McKinsey & Company 21
Working D
raft -Last Modified 18/03/2009 15:41:52
Printed 18/03/2009 15:36:55
|
42
63
61
84
47
46
45
44
42
42
38
37
86
58
65
76
52
56
51
76
ENT
Total
Urology
Orthopaedic Surgery
Ophthalmology
Head and Neck Surgery
General Surgery
Vascular
Gynaecology
Breast Surgery
Actual rate
Recommended rate
1
Source: HES, British Association of Day Surgery

Acute providers – Variability of sickness rate highlights opportunities for increase staff productivity
McKinsey & Company 22
Working D
raft -Last Modified 18/03/2009 15:41:52
Printed 18/03/2009 15:36:55
|
1 Time lost through absence as percent of total staff type excludes maternity leaves, carers leave and periods of absence agreed
Note: GPs and their staff not included in these figuresSource: NHS Sickness Absence Survey 2005
6.0Ambulance trust
5.3Mental health and community trust
4.6Special health authority
4.4Acute trusts
4.2PCT
2.8SHA
5.3North East
4.3
East Midlands
4.4
4.1
4.8
East of England
4.1South East
4.5
London
South West
West Midlands
North West 5.1
4.6
Yorkshire and the Humber
By organisation type By strategic health authority
Sickness rate1 2005, Percent
England 4.5 4.5
1
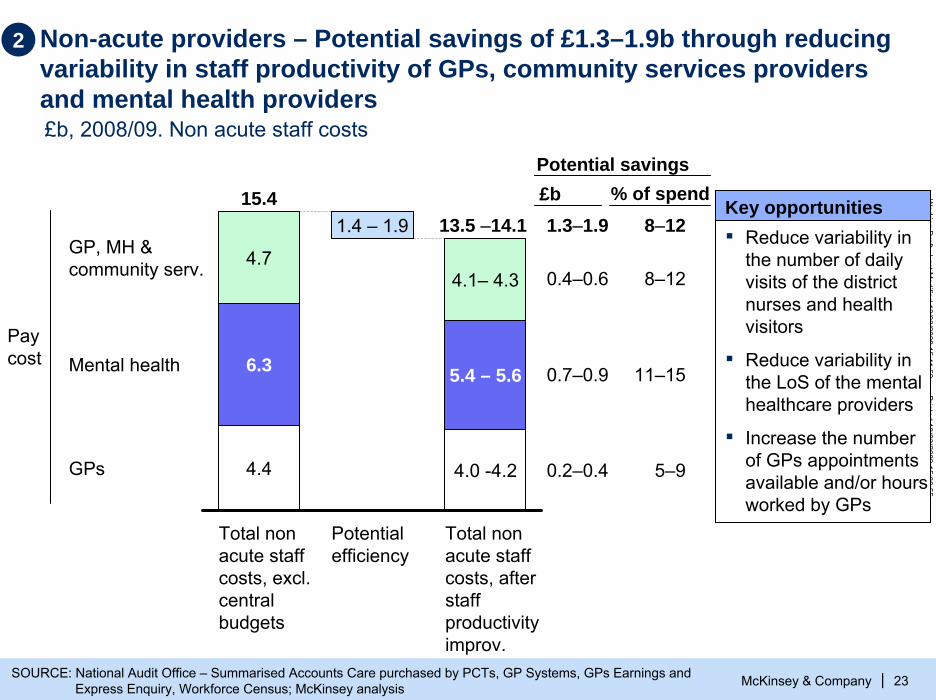
Non-acute providers – Potential savings of £1.3–1.9b through reducing variability in staff productivity of GPs, community services providers and mental health providers
McKinsey & Company 23
Working D
raft -Last Modified 18/03/2009 15:41:52
Printed 18/03/2009 15:36:55
|SOURCE: National Audit Office – Summarised Accounts Care purchased by PCTs, GP Systems, GPs Earnings and Express Enquiry, Workforce Census; McKinsey analysis
2
4.7
6.3
4.4
15.4
Total non acute staff costs, excl. central budgets
1.4 – 1.9
Potential efficiency
4.1– 4.3
5.4 – 5.6
4.0 -4.2
13.5 –14.1
Total non acute staff costs, after staff productivity improv.
GP, MH &community serv.
Mental health
GPs
8–12
8–12
11–15
5–9
Key opportunities▪ Reduce variability in
the number of daily visits of the district nurses and health visitors
▪ Reduce variability in the LoS of the mental healthcare providers
▪ Increase the number of GPs appointments available and/or hours worked by GPs
Paycost
Potential savings£b % of spend1.3–1.9
0.4–0.6
0.7–0.9
0.2–0.4
£b, 2008/09. Non acute staff costs
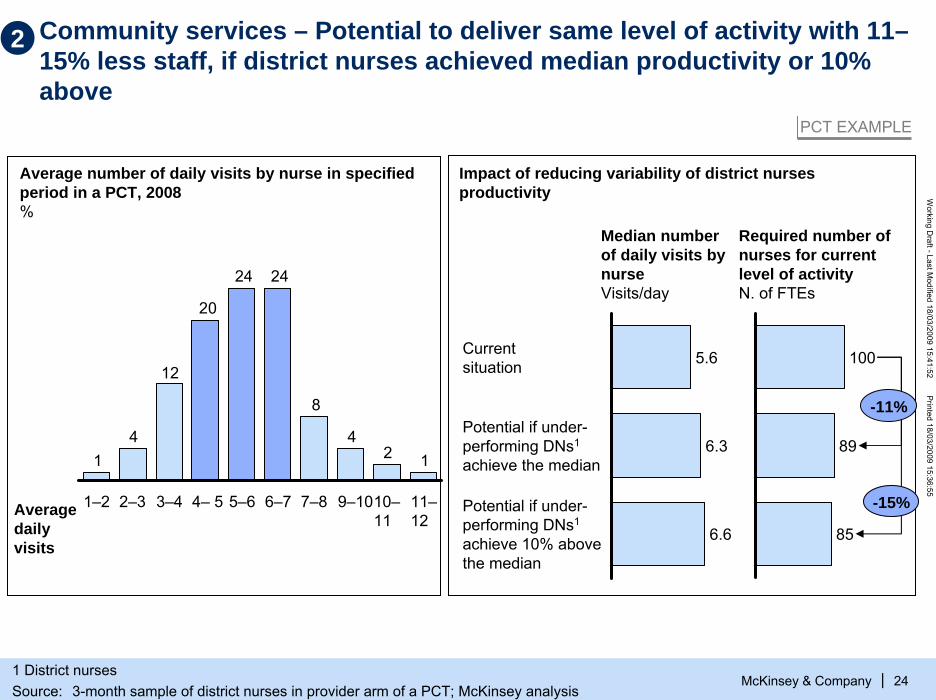
Community services – Potential to deliver same level of activity with 11–15% less staff, if district nurses achieved median productivity or 10% above
McKinsey & Company 24
Working D
raft -Last Modified 18/03/2009 15:41:52
Printed 18/03/2009 15:36:55
|
Average number of daily visits by nurse in specified period in a PCT, 2008%
124
8
2424
20
12
41
6–7 7–8 9–1010–11
11–12
1–2 2–3 3–4 4– 5 5–6
5.6Current situation
6.3Potential if under-performing DNs1
achieve the median
6.6
Potential if under-performing DNs1
achieve 10% abovethe median
Impact of reducing variability of district nurses productivity
100
89
85
Median number of daily visits by nurseVisits/day
Required number of nurses for current level of activityN. of FTEs
Average daily visits
-11%
-15%
PCT EXAMPLE
2
1 District nursesSource: 3-month sample of district nurses in provider arm of a PCT; McKinsey analysis

McKinsey & Company 25
Working D
raft -Last Modified 18/03/2009 15:41:52
Printed 18/03/2009 15:36:55
|
Community services – One PCT has identified a set of initiatives to increase efficiencies of service line services by c. 15%
Efficiency improvement initiatives
Total
Share of savings% of budget 08
Reduce administrative time by employing more admin. staff and intro of lean processes
2 3.3
Reduce management time of lower band staffs3 1.0
Adjust skill-mix of Service line staff1 8.0
5 Reduce data entry team once EMIS Web is fully functional 0.7
4 Streamline travel routes of clinical staff 1.0
6 Replace night sitting agency staff with permanent staff 0.6
14.6
PCT EXAMPLE
2

Mental health – Potential to reduce beddays by 8–12% if providers achieve 50-80% of the potential improvement of stepping down to median ALOS
McKinsey & Company 26
Working D
raft -Last Modified 18/03/2009 15:41:52
Printed 18/03/2009 15:36:55
|
2
112107
10098
8784
80 8077 76
7370 69 68
66 65 65 63 63 62 62 61 61 60 58 5856 56 55 55 54 53 53 52 52 52 51 50 49 49 48 48 47 47 46 44 44
41 4038 38
32
27
ALOS of mental health providers Number of days. England. 2006-07
Note: Excludes data points with fewer than 25 spellsSOURCE: HES 2006/07 – Mental health HRGs codes only (T); McKinsey analysis
Median=56

McKinsey & Company 27
Working D
raft -Last Modified 18/03/2009 15:41:52
Printed 18/03/2009 15:36:55
|
8 weeks after the crisis
6 months after the crisis
59
22
Psychiatric ward
13
19
Crisis House
69
36Overall
67
29
18
24
75
47
Mental health – Crisis resolution teams can reduce the need for admissions by 40–50% based on controlled trials
2
1 Crisis resolution teamSOURCE: BMJ August 2005
Control groupGroup supported by CRT1
260 residents of the Inner London borough of Islington who where experiencing crisis severe enough for hospital admissions to be considered
Compare admission rates and satisfaction of the group of 135 who received care from crisis resolution team (experimental group) vs. the group of 125 who receive the standard inpatients services and community mental health teams support (control group)
Description of randomised controlled trial Admission rates, %
-48% -37%

Mental health providers – Examples of initiatives undertaken by two PCTs to improve the value for money of MH and LD services
McKinsey & Company 28
Working D
raft -Last Modified 18/03/2009 15:41:52
Printed 18/03/2009 15:36:55
|
2
Northamptonshire PCT
Savings identified
Total £m
As percentage of current spend% Key initiatives
▪ Individual Packages of Care (IPCs): enforce a contractual framework with all MH/LD providers and develop direct payment for social care IPCs
▪ Transform block contract into an activity-driven contract and tender services
▪ Develop local MH/LD facilities when cost effective
£11 - 22m 9 -18%
Buckinghamshire PCT
£2 - 2.5m 3 - 4% ▪ Managing MH contract issues and tendering out services to realise savings
▪ Reducing out of area LD placements▪ Quantifying risk in continuing care and improving
procurement and review processes▪ Exploring changes to commissioning to improve
value for money of Head Injury Placements▪ Review joint commissioning of children’s services
and opportunities for savings in PCT provider arm▪ Delivery of LD performance management and S31s
Note: LD: Learning Disabilities; MH: Mental Health
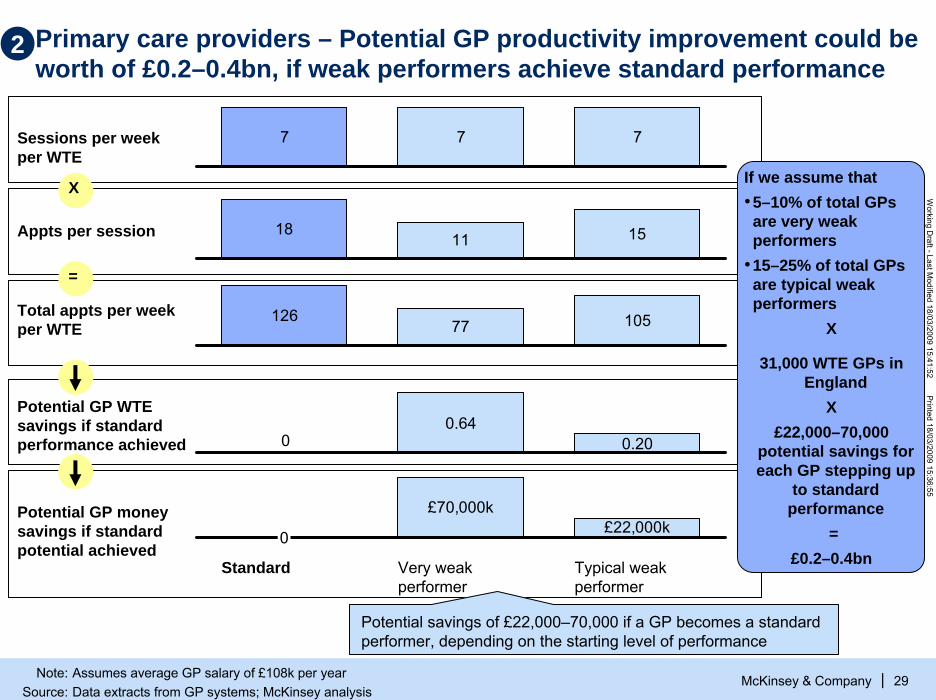
Primary care providers – Potential GP productivity improvement could be worth of £0.2–0.4bn, if weak performers achieve standard performance
McKinsey & Company 29
Working D
raft -Last Modified 18/03/2009 15:41:52
Printed 18/03/2009 15:36:55
|
7 7 7Sessions per week per WTE
Appts per session
Potential GP WTEsavings if standard performance achieved
Total appts per week per WTE
Potential GP money savings if standard potential achieved
1811 15
00.64
0.20
£70,000k£22,000k
0
Standard Very weak performer
Typical weak performer
12677 105
X
=
2
Potential savings of £22,000–70,000 if a GP becomes a standard performer, depending on the starting level of performance
If we assume that•5–10% of total GPs are very weak performers
•15–25% of total GPs are typical weak performers
X
31,000 WTE GPs in England
X£22,000–70,000
potential savings for each GP stepping up
to standard performance
=£0.2–0.4bn
Note: Assumes average GP salary of £108k per yearSource: Data extracts from GP systems; McKinsey analysis

Primary care providers – A low-performing GP can spend less than 30% of their contracted hours actually seeing patients
McKinsey & Company 30
Working D
raft -Last Modified 18/03/2009 15:41:52
Printed 18/03/2009 15:36:55
|
2
8.5
5.0
5.0
2.2
1.9 11.0
18.5
37.5
Contracted hours
Admin CPD
0.5
Appts. lost to tea brks
GP Forum
1.7
Urgent slot, not used
Allocated to appts
Time spent on direct patient care*
Covered by locum
On-call Appts. lost to DNAs
1.7
-71%
-51%
* Not including patients seen whilst on-callSource:Interviews with PCT and practices; McKinsey analysis
Number of hours

McKinsey & Company 31
Working D
raft -Last Modified 18/03/2009 15:41:52
Printed 18/03/2009 15:36:55
|
137
308
329
383
407
385
408398
409
355361
354357
310
285289
244
193
214202
151138
133132
141
112100
71757358
74
515034
413529
191928
14152021
16813666633533334121
33 38 40 41 42 43 44 45 46 47 48 49 50 51 52 53 54 55 56 57 58 59 60 61 62 63 64 65 66 67 68 69 70 71 72 73 74 75 76 77 78 79 80 81 82 83
249
84 8530 87 88 89 90 91 92 9386 95 96 97 98 99 100
% able to make an appointment within 48 hours
94
2
Number of GP practices. 2007/08
Primary care providers – GPs performance in access indicates that c.10% are very weak performers and c.25% are typical weak performers
8% of the GP practices perform 20% worse or more than the median
25% of the GP practices perform 5-20% worse than the median
Median 88%
Source: The Information Centre for Healthcare and Social Care – GP Patient Access Surveys 2007/08; McKinsey analysis
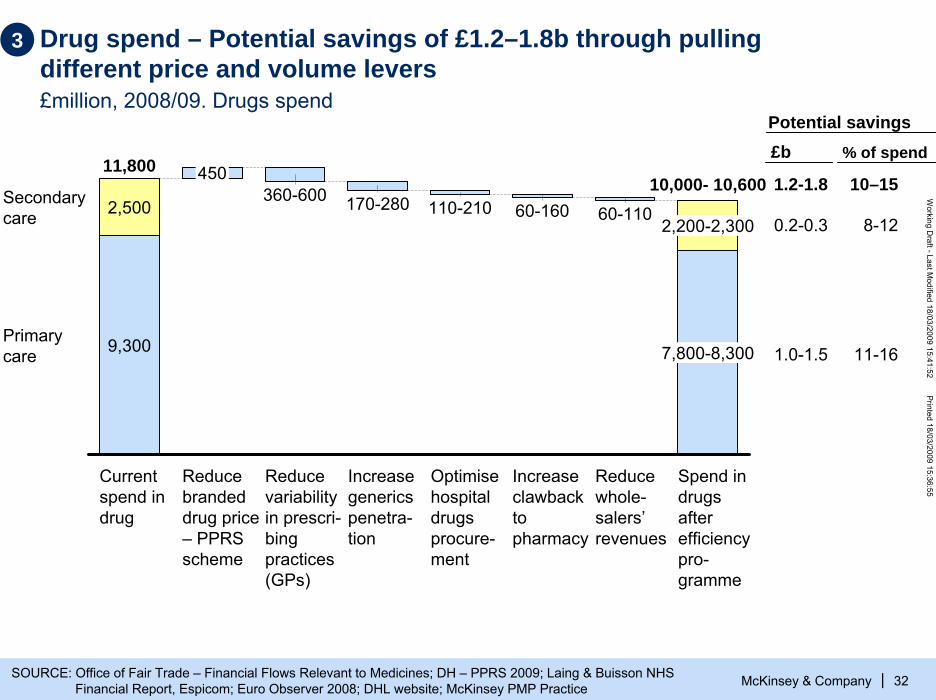
Drug spend – Potential savings of £1.2–1.8b through pulling different price and volume levers£million, 2008/09. Drugs spend
McKinsey & Company 32
Working D
raft -Last Modified 18/03/2009 15:41:52
Printed 18/03/2009 15:36:55
|SOURCE: Office of Fair Trade – Financial Flows Relevant to Medicines; DH – PPRS 2009; Laing & Buisson NHS Financial Report, Espicom; Euro Observer 2008; DHL website; McKinsey PMP Practice
3
110-210
Increase generics penetra-tion
2,200-2,300
Optimise hospital drugs procure-ment
60-160360-600
Increase clawbackto pharmacy
2,500
9,300
60-110
7,800-8,300
11,800
Current spend in drug
Reduce whole-salers’revenues
450
Reduce branded drug price – PPRSscheme
Primarycare
Secondarycare
10,000- 10,600
Reduce variability in prescri-bingpractices (GPs)
Spend in drugs after efficiency pro-gramme
170-28010–15
8-12
11-16
1.2-1.8
0.2-0.3
1.0-1.5
Potential savings£b % of spend
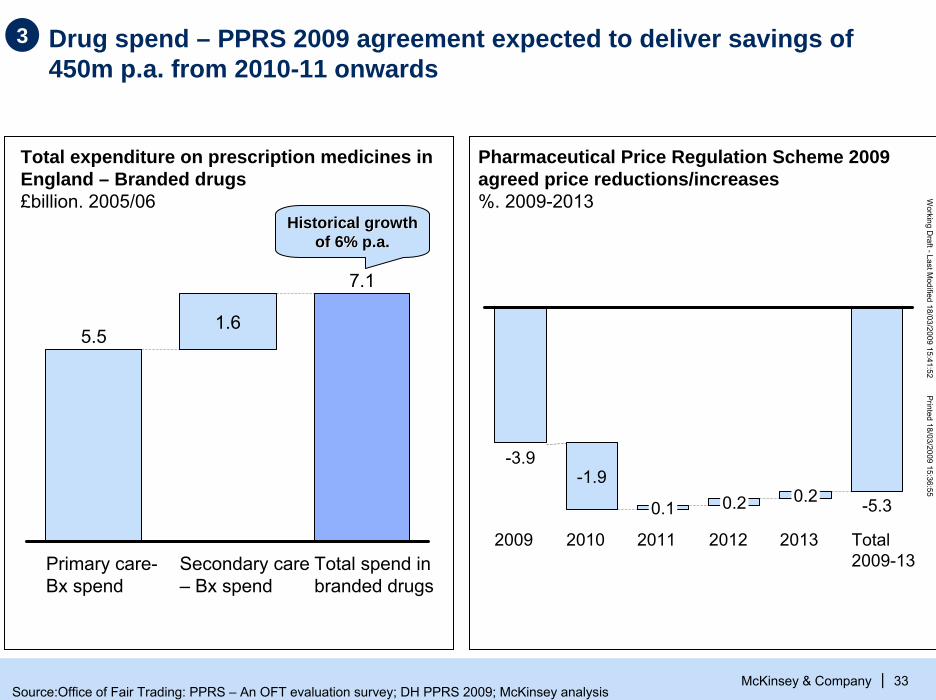
Drug spend – PPRS 2009 agreement expected to deliver savings of 450m p.a. from 2010-11 onwards
McKinsey & Company 33
Working D
raft -Last Modified 18/03/2009 15:41:52
Printed 18/03/2009 15:36:55
|
3
5.5
Primary care-Bx spend
1.6
Secondary care – Bx spend
7.1
Total spend in branded drugs
Total expenditure on prescription medicines in England – Branded drugs£billion. 2005/06
Pharmaceutical Price Regulation Scheme 2009 agreed price reductions/increases%. 2009-2013
Historical growth Historical growth of 6% p.a.of 6% p.a.
0.1
-3.9
2009 2010
-1.9
2012
0.2
2011
0.2 -5.3
Total 2009-13
2013
Source:Office of Fair Trading: PPRS – An OFT evaluation survey; DH PPRS 2009; McKinsey analysis

Drug spend – After the recently negotiated PPRS scheme, the U.K. branded drugs prices would be more aligned with the rest of Europe
McKinsey & Company 34
Working D
raft -Last Modified 18/03/2009 15:41:52
Printed 18/03/2009 15:36:55
|
8484
9595959696100101103
108
Estimated UK after the 2009 PPRSscheme
Germany Ireland Finland UK before 2009 PPRSscheme
France SpainItalyBelgiumNether-lands
Austria
Bilateral comparisons of ex-manufacturer prices, 2005UK = 100 in 2005
3
PPRS scheme recently agreed with the industry with a
• 3.9% reduction in 2009/10• 1.9% additional reduction in 2010/11
Source: OFT Report on PPRS February 2007, McKinsey analysis
McKinsey & Company 35
Working D
raft -Last Modified 18/03/2009 15:41:52
Printed 18/03/2009 15:36:55
|
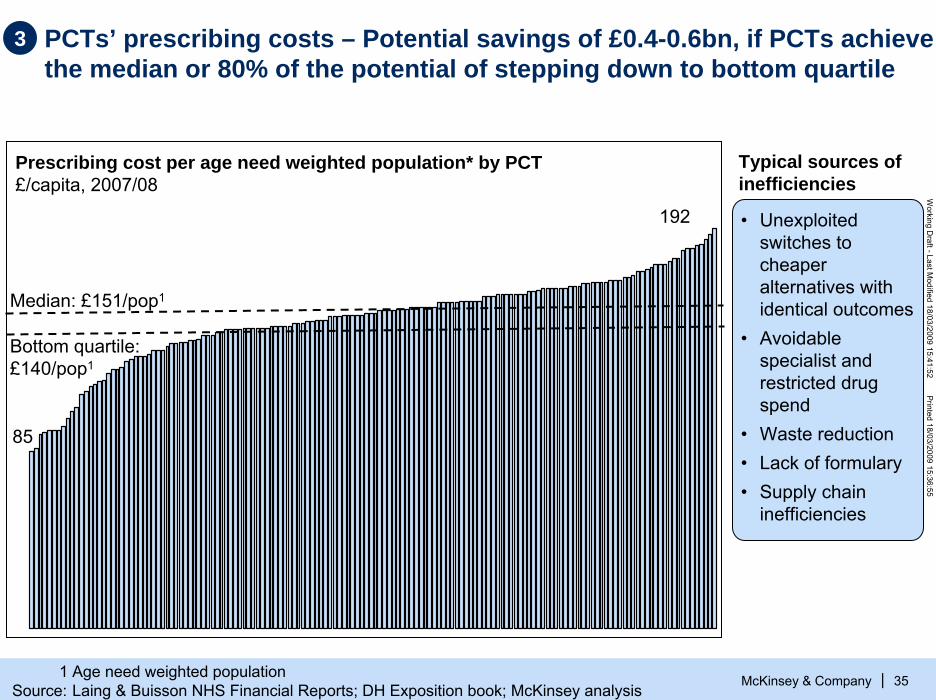
3 PCTs’ prescribing costs – Potential savings of £0.4-0.6bn, if PCTs achieve the median or 80% of the potential of stepping down to bottom quartile
Prescribing cost per age need weighted population* by PCT£/capita, 2007/08
Median: £151/pop1
85
192
Typical sources of inefficiencies
• Unexploited switches to cheaper alternatives with identical outcomes
• Avoidable specialist and restricted drug spend
• Waste reduction • Lack of formulary• Supply chain
inefficiencies
Bottom quartile: £140/pop1
1 Age need weighted populationSource: Laing & Buisson NHS Financial Reports; DH Exposition book; McKinsey analysis

Supply chain/procurement: although significant savings already captured, there is still an opportunity estimated at £1.1–1.9b£million. 2008/09. Clinical and non clinical supplies spend, excl. drugs and estates
McKinsey & Company 36
Working D
raft -Last Modified 18/03/2009 15:41:52
Printed 18/03/2009 15:36:55
|
3
0.7
3.4
4.9
1.7
6.5
17.2
Clinical and non-clinical supplies spend, excl drugs and estates
0.1
Savings on purchases under PASAmanaged contracts
1.0–1.8
Savings on purchases not under PASAmanaged contracts
15.3–16.1
Clinical and non-clinical supplies spend, excl drugs and estates, after efficiency
GP spend in supplies
Central budgets
NHS Trust – Opex
Capital expenditure
PCTs – Opex
Key opportunities▪ Extend the national
procurement contracts to other categories, including central budgets and capital expenditure
▪ Accelerate implementation of collaborative hubs
▪ Enforce PCTs/Trusts to buy through PASA contracts/frameworks
▪ Improve inventory managements
3-5% potential savings
10-15% savings on GP supplies7-12% for the rest
SOURCE: National Audit Office – Summarised Accounts; NHS Purchasing and Supply Annual Report 2007/08, DH –Departmental Report 2008, McKinsey analysis
Clinical and non clinical supplies, excl. drugs & estates costs

McKinsey & Company 37
Working D
raft -Last Modified 18/03/2009 15:41:52
Printed 18/03/2009 15:36:55
|
Microfilming
29
29
27
26
22
22
21
21
20
20
20
30
34
35
40
43
50
Waste removal
Employee food discounts
Filters
Elevator service
Office supplies
IT maintenance
Printing
Clinical engineering
Cardiology products
Business forms
IT programming
Blood products
Electrical/electronic parts
Plumbing supplies
Paint
Computer equipment
14
11
11
10
10
9
8
8
7
6
1
15
15
17
18
19
19Cleaning supplies
Office equipment
Travel
Laboratory services
Telecommunications
Capital equipment
Consultants
Facility maintenance
Postage
Medical and surgical supplies
Miscellaneous hardware
Contract labor
Linen and laundry
Laboratory supplies
Orthopedics
Weighted, average savings
= 13%
Food services
10% to 15% savings on external spend can be typically achieved through a comprehensive procurement projectPercent savings based on 75 projects since 1997
3
Source: McKinsey PSM database

The Supply Chain Excellence Programme aimed and captured £0.5bn savings out of £15bn spend, equivalent to 3% of the spend
McKinsey & Company 38
Working D
raft -Last Modified 18/03/2009 15:41:52
Printed 18/03/2009 15:36:55
|
3
Initial savings estimate - 2004
New targeted savings - 2005
Final savings achieved – 2007/08
National Contracts Procurement1
407240
510 733
Collaborative Procurement Hubs
326270
240
510
270
Total
1 Includes expected savings from Wave 1 and Wave 2
Source: SCEP – Reference Pack for McKinsey- August 2005 –DH Commercial Directorate, NHS supply and procurement agency annual report 2007/08

McKinsey & Company 39
Working D
raft -Last Modified 18/03/2009 15:41:52
Printed 18/03/2009 15:36:55
|
1010
585
500
2,255
3,340
Current estates costs, excluding central agencies
290-305
Acute providers
2,740 - 2,795
145
Acute providers
2,905 – 2,960
PCT Estates costs after optimization and upgrading of facilities
PCT
MH&C
MH&C
Providers
Mental Health & community
95-105
PCTs
160-190380 - 435
Estates optimisation – Potential savings of £0.4b if PCTs and trusts optimise utilisation of their estates£million. 2007/08. Estates costs
4
Savings from estates optimisation1 Additional estates costs from upgrading facilities2
£545-600m. £165m.
1 Calculated as trusts below median reaching median or 80% of top quartile value in sq.m. per bed or sq.m. per WTE. Same assumption applied to capture savings from vacating currently unused space
2 Calculated to reach Condition B (“the asset is sound, operationally safe and exhibits only minor deterioration”) and associated annual estates costs

Potential savings of £130-160*m from vacating current unoccupied space at providers’ and PCTs estates…
McKinsey & Company 40
Working D
raft -Last Modified 18/03/2009 15:41:52
Printed 18/03/2009 15:36:55
|
0
0
Bottom quartile
8.5Bottom decile
Top decile
Top quartile
1.6Median
4.6
0
0
3.0
7.7
11.8
Percentile Acute providers
Vacant space as proportion of total space, %
Mental health and community
Potential savings from release, £m
72-90 28-35
Current vacant space725,000 sq.m. (providers)
and 190,000 sq.m. (PCTs)
X
£172/sq.m.** (providers) and
£183/sq.m.** (PCTs)
=
£100-125 m (providers)and
£28-35 m (PCTs)
4
0
0
14.3
7.5
2.3
PCTs
28-35
Opportunity to optimize space use if providers and PCTs vacate between 80-100% of the unoccupied space
* Range assumes 80% of maximum to maximum possible vacant space is disposed of** Extremely conservative as costs generally taken to be £300-400/sq.m.Source: NHS Information Centre: Estates Returns Information Collection 07/08; McKinsey analysis

… and additional potential savings of £0.4bn from better use of providers’ and PCTs’ estates
McKinsey & Company 41
Working D
raft -Last Modified 18/03/2009 15:41:52
Printed 18/03/2009 15:36:55
|
47Top decile
61Top quartile
70Median
85Bottom quartile
Bottom decile 109 120
93
74
56
18
Percentile Acute providers
Occupied space per bed,Sq.m./bed
Mental health and community
Potential savings from optimization, £bn
0.20-0.21 0.06-0.07
15-16% potential improvement in provider
space utilization and
31-39% improvement in PCT space utilization
X
10.5m sq.m. (providers) and
2.1m sq.m. (PCTs)
X
£172/sq.m.* (providers) and
£183/sq.m.* (PCTs)
=
£0.26-0.28 bn (providers)and
£0.13-0.15 bn (PCTs)
4
Opportunity to optimize space use if all providers step down to median or 80% of top quartile in use of sq.m./bed or sq.m/ WTE
Occupied space per WTE, Sq.m./WTE
9,1
5,9
43.0
14.4
22.6
PCTs
0.13-0.15
* Extremely conservative as costs generally taken to be £300-400/sq.m.Source: NHS Information Centre: Estates Returns Information Collection 07/08; McKinsey analysis

On the other hand, additional estates costs of £165m would be incurred to upgrade current “poor” facilities
McKinsey & Company 42
Working D
raft -Last Modified 18/03/2009 15:41:52
Printed 18/03/2009 15:36:55
|
60
125
45
140
1,520
1,785
Total expected investment in bringing estates up to condition B
1,035
1,140
Total adjusted investment ,assuming vacant space disposed of is the lowest quality
PCTsMental Health& Communities
Providers
1010
145
165
Annual estates costs of upgraded facilities to Condition B
4
Capital expenditure to bring ALL current facilities to Condition B£000
Space to be upgraded to Condition B£ sq.m.
950
1,000
4,000
Additional estates costs of upgrading estates£ sq.m.
Source: NHS Information Centre: Estates Returns Information Collection 07/08; McKinsey analysis

Estates costs – Trusts’ asset utilisation varies sixfold
McKinsey & Company 43
Working D
raft -Last Modified 18/03/2009 15:41:52
Printed 18/03/2009 15:36:55
|
4Revenue to fixed asset by trust*, average 2002/3 – 2004/5. Percent
Least efficient trust
Most efficient trust
0%
50%
100%
150%
200%
250%
300%
350%
400%
450%
20015010050
If all trusts step up to the average or the top quartile £3.3 – 8.3 bn. in assets could be freed up
* Acute and mental health trustsSource: Laing & Buisson financials; National Asset Register 2007; Team analysis

Estates costs – PCTs can also take out estates costs by renting/selling not used site
4PCT EXAMPLE
McKinsey & Company 44
Working D
raft -Last Modified 18/03/2009 15:41:52
Printed 18/03/2009 15:36:55
|
2008, Book Value in £m
> 65% of the land is property either empty or used for services that are planned to be provided at home
Sites empty or with services to be moved to home care
• Review PCT-owned assets and evaluate options to sell/rent vacate sites
• Consolidate sites partially occupied and dispose of surplus assets
• Drive up utilisation of estates, e.g., sharing rooms, hot-desking
• Explore renting vs. ownership options
4.91.22.9
3.64.6
5.6
7.7
35.365.8
Total PCT land book value
Health carecentre A
Commu-nityhospital A
Health care centre B
Health care centre C
Health care centre D
Health care centre E
Health care centre F
Others assets
Examples of key efficiency initiatives
Source: PCT finance department

… and consolidating and driving up utilisation of existing space through increased sharing of space
McKinsey & Company 45
Working D
raft -Last Modified 18/03/2009 15:41:52
Printed 18/03/2009 15:36:55
|
TODAY: primary and community care services provided with a very high fixed cost base and low utilisation and dedicated rooms, e.g., GPs
MORE EFFICIENT MODEL: Consolidate, drive up utilisation, take out costs (and support integration and better quality care)
GP practiceHealth centres, children’s centre
Community hospital Urgent care
centre (24x7)Outpatient clinics
Therapy services
Maternity services
Inpatient care
GP services
Base for community teams
Day case surgery unit
Typical provision for pop’n of ~ 100K
Efficient provision for pop’n of ~ 100K
4

PFI restructuring – renegotiating the interest charges of 80% of the PFIschemes by 2–3bp1 could reduce financing cost by £0.1–0.2b.£ billion. 2008/09 – 2013/14
McKinsey & Company 46
Working D
raft -Last Modified 18/03/2009 15:41:52
Printed 18/03/2009 15:36:55
|1 Basic pointsSOURCE: Treasury; McKinsey analysis
4
Total average book value of PFI schemes (2009–13)
~9.5
Average annual PFIpayments after re-negotiation
1.1–1.2
Potential reduction on interest charges (2–3b.p.1)
0.1–0.21.3
Average annual payments for PFI schemes (2009–13)
Key opportunities▪ Renegotiate interest
rates charges taking advantage of
– Reduction in interest rates (from 5.5% in 2008 to 0,5% in March’09)
– Government guarantee to borrow
– Limited ability of the PFI holders to borrow and need of some for cash
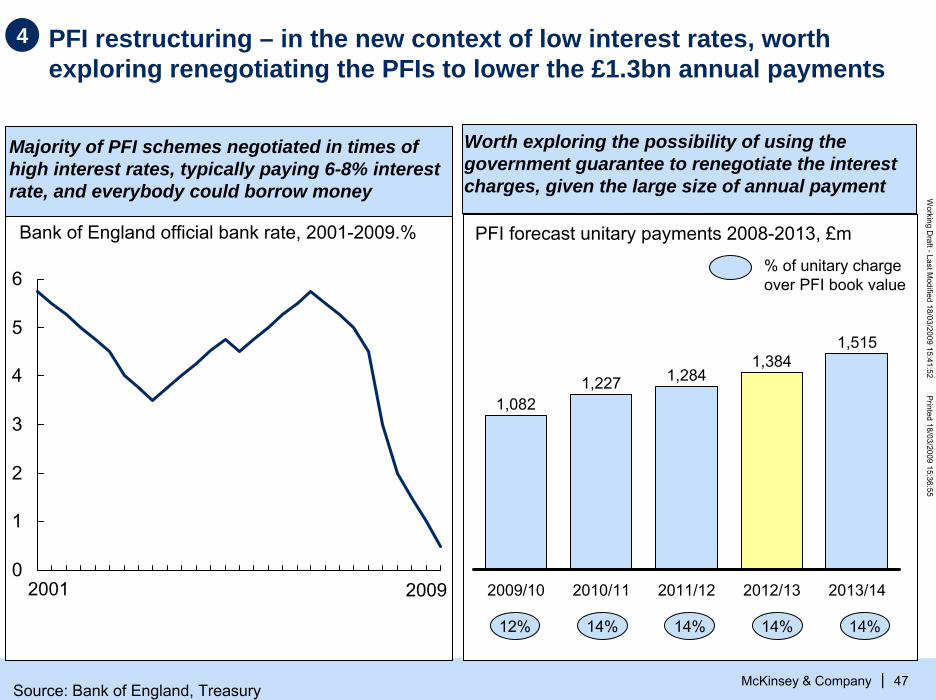
PFI restructuring – in the new context of low interest rates, worth exploring renegotiating the PFIs to lower the £1.3bn annual payments
McKinsey & Company 47
Working D
raft -Last Modified 18/03/2009 15:41:52
Printed 18/03/2009 15:36:55
|
4
Majority of PFI schemes negotiated in times of high interest rates, typically paying 6-8% interest rate, and everybody could borrow money
Worth exploring the possibility of using the government guarantee to renegotiate the interest charges, given the large size of annual payment
Bank of England official bank rate, 2001-2009.% PFI forecast unitary payments 2008-2013, £m
1,082
2009/10
1,227
2010/11
1,284
2011/12
1,384
2012/13
1,515
2013/14
12% 14% 14% 14% 14%
% of unitary charge over PFI book value
0
1
2
3
4
5
6
2001 2009
Source: Bank of England, Treasury

McKinsey & Company 48
Working D
raft -Last Modified 18/03/2009 15:41:52
Printed 18/03/2009 15:36:55
|
Contents
▪ The challenge and size of the opportunity
▪ Detailing the opportunities– Drive cost efficiencies in all provider services– Optimize spend and ensure compliance with
commissioners' standards– Shift care into more cost-effective settings
▪ Implications
▪ Making it happen
▪ Backup: Methodology and assumptions

McKinsey & Company 49
Working D
raft -Last Modified 18/03/2009 15:41:52
Printed 18/03/2009 15:36:55
|
Break-down of potential opportunities to optimise spend and ensure compliance with standards
ESTIMATE
1.1-1.7
0.8–1.5
Stop/reduce procedures with no/limited clinical benefit
2.8–3.4
Target most costs effective interventions
Conduct utilisation reviews
Total potential of optimizing spend and ensuring compliance with standards
4.7–6.6
16 47
5–9% 6–7%
£b, 2013/14 recurrent potential savings, England
Current spend£b
% reduction vs. 2008/09 spend
56
2–3%
92
5–7%
SOURCE: McKinsey analysis
55
Programme number
55
66
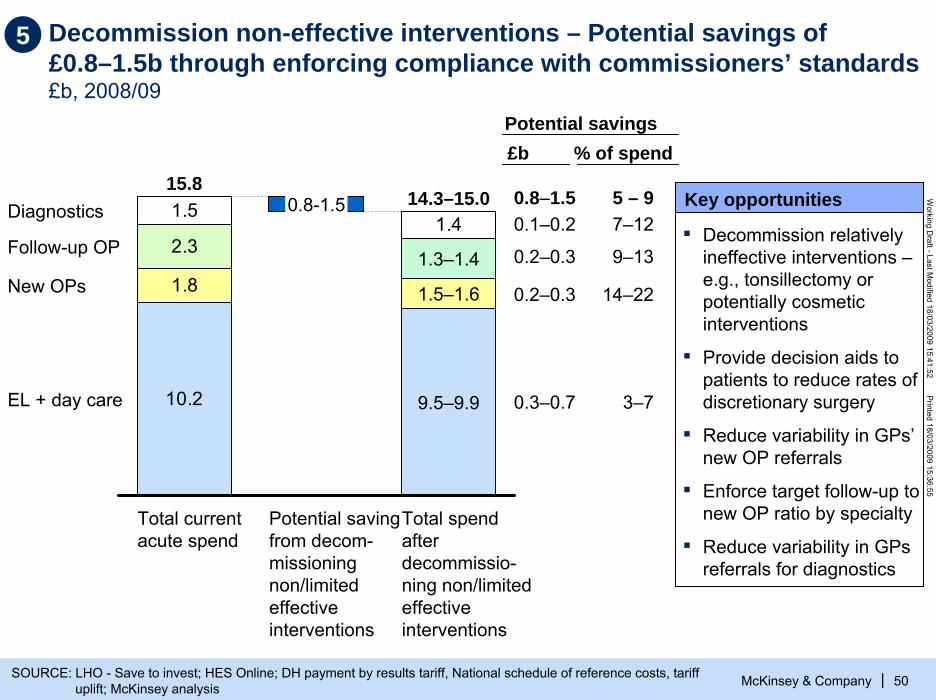
Decommission non-effective interventions – Potential savings of £0.8–1.5b through enforcing compliance with commissioners’ standards£b, 2008/09
McKinsey & Company 50
Working D
raft -Last Modified 18/03/2009 15:41:52
Printed 18/03/2009 15:36:55
|SOURCE: LHO - Save to invest; HES Online; DH payment by results tariff, National schedule of reference costs, tariff uplift; McKinsey analysis
1.51.4
10.2
1.8
2.3
15.8
Total current acute spend
0.8-1.5
Potential saving from decom-missioningnon/limited effective interventions
1.3–1.4
1.5–1.6
9.5–9.9
14.3–15.0
Total spend after decommissio-ning non/limited effective interventions
Diagnostics
Follow-up OP
New OPs
EL + day care
Key opportunities
▪ Decommission relatively ineffective interventions –e.g., tonsillectomy or potentially cosmetic interventions
▪ Provide decision aids to patients to reduce rates of discretionary surgery
▪ Reduce variability in GPs’ new OP referrals
▪ Enforce target follow-up to new OP ratio by specialty
▪ Reduce variability in GPs referrals for diagnostics
5 – 97–12
9–13
14–22
3–7
Potential savings£b
0.8–1.50.1–0.2
0.2–0.3
0.2–0.3
0.3–0.7
% of spend
5

5 De-commission procedures with limited clinical benefit could drive savings of £0.3–0.7bn.1 across England (1/2)
McKinsey & Company 51
Working D
raft -Last Modified 18/03/2009 15:41:52
Printed 18/03/2009 15:36:55
|
Relatively ineffective interventions
A
Potentially cosmetic interventions
£20–115m1
£80–165m1
B
Minimum%
Maximum %
Minimum £m
Maximum £m
Potential reduction Potential savings
▪ Spinal cord stimulation 0 50 0 25.2▪ Back pain – injection and fusion 20 90 5.3 23.7▪ Grommets (surgery for glue ear) 10 90 2.3 20.6▪ Knee washouts 20 90 4.5 20.3▪ Trigger finger 10 33 1.8 5.8▪ Dilation can curettage for women < 40 10 70 0.4 2.5
▪ Tonsillectomy 10 90 5 45.1
▪ Jaw replacement 5 10 0.5 0.9
▪ Minor skin surgery for non-cancer lesions 10 25 29.8 74.4▪ Inguinal, Umbilical and Femoral Hernias 25 50 24.8 49.5▪ Incisional and Ventral Hernias 10 75 3.4 25.5▪ Aesthetic surgery – Breast 50 80 11.2 17.9▪ Varicose Veins 20 80 4.4 17.7▪ Aesthetic surgery – ENT 20 60 3.1 9.2▪ Other Hernia procedures 10 30 1.9 5.8▪ Aesthetic surgery – Plastics 20 95 1.1 5.2▪ Aesthetic surgery – Ophthalmology 20 30 1.8 2.7▪ Orthodontics 5 80 0 0.2
1 Assumes that only 80% of the maximum potential is achievedNote: Cancelled procedures not included in analysis
Source: LHO – Save to invest: Developing criteria-based commissioning for planned health care in London; HES 2006/07; McKinsey analysis

McKinsey & Company 52
Working D
raft -Last Modified 18/03/2009 15:41:52
Printed 18/03/2009 15:36:55
|
5
Effective interventions with a close benefit/ risk balance in mild cases
C
Effective interven-tions where cost effective alternatives should be tried first
De-commission procedures with limited clinical benefit could drive savings of £0.3–0.7bn.1 across England (2/2)
£160–300m1
£18–85m1
D
▪ Knee joint surgery ▪ Primary hip replacement ▪ Hip and knee joint revisions ▪ Cataract surgery ▪ Female genital prolapse/stress
incontinence (surgical)
▪ Dupuytren’s contracture▪ Cochlear implants (inner ear surgery)
▪ Other joint prosthetics/ replacements ▪ Female genital prolapse/stress
incontinence (non-surgical)
▪ Hysterectomy for non-cancerous heavy menstrual bleeding
▪ Carpal tunnel surgery ▪ Elective cardiac ablation ▪ Anal procedures ▪ Bilateral hip surgery
Minimum Maximum Minimum Maximum Reduction, % Potential savings. £m
15 30 59.0 118.015 30 46.2 92.515 30 33.2 66.45 25 11.3 56.6
10 25 6.2 15.6
10 33 2.0 6.70 25 0 4.5
15 30 1.8 3.6
5 25 0.1 0.6
▪ Wisdom teeth extraction 0 24 0 11.0
10 70 11.5 80.6
10 33 4.1 13.55 50 0.9 8.65 15 1.2 3.6
15 30 0.4 0.7
1 Assumes that only 80% of the maximum potential is achievedNote: Cancelled procedures not included in analysis
Source: LHO – Save to invest: Developing criteria-based commissioning for planned health care in London; HES 2006/07; McKinsey analysis
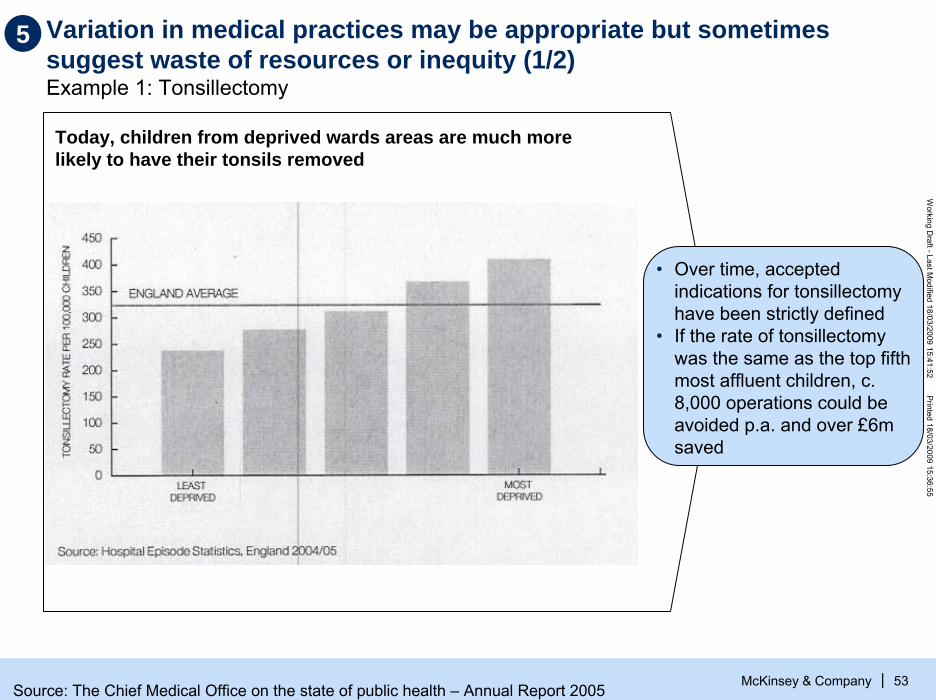
Variation in medical practices may be appropriate but sometimes suggest waste of resources or inequity (1/2)Example 1: Tonsillectomy
McKinsey & Company 53
Working D
raft -Last Modified 18/03/2009 15:41:52
Printed 18/03/2009 15:36:55
|
Today, children from deprived wards areas are much more likely to have their tonsils removed
• Over time, accepted indications for tonsillectomy have been strictly defined
• If the rate of tonsillectomy was the same as the top fifth most affluent children, c. 8,000 operations could be avoided p.a. and over £6m saved
5
Source: The Chief Medical Office on the state of public health – Annual Report 2005

Variation in medical practices may be appropriate but sometimes suggest waste of resources or inequity (2/2)Example 2: London hospitals - hysterectomy
5
McKinsey & Company 54
Working D
raft -Last Modified 18/03/2009 15:41:52
Printed 18/03/2009 15:36:55
|
Royal free HampsteadSt. Mary’s Chelsea and WestminsterHornertonKing’s collegeBarnet and chase farmNewhamSt. George’sWest MiddlesexHammersmithKingstonThe WhittingtonMayday HealthcareLewishamNW London hospitalsNorth MiddlesexEalingHillingdonWhipps crossBarking, Havering and RedbridgeQueen Mary’s SidcupBarts and the LondonUniversity college LondonGuy’s and St.Thomas’Epsom and St HellenBromleyQueen Elizabeth
Patients per 100,0000 10 20 30 40 50 60 70 80 90 100 110
• Clinical studies show that between 5-84% of the hysterectomies were not appropriate
• If the average rate of hysterectomy could be reduced to the rate of the 20% lowest, then 5,900 operations costing £15m could be avoided
Source: HES 2005–06, ONS mid-year female population estimates. Hospital-specific rates are crude rates based on hospital episodes; Trusts with fewer than 10 observations not included; LHO, HSJ

McKinsey & Company 55
Working D
raft -Last Modified 18/03/2009 15:41:52
Printed 18/03/2009 15:36:55
|
0% 25% 50% 75%
CA-Prostatectomy
Coronary bypass*
Hysterectomy
Mastectomy
Mastectomy*
Bphprostatectomy
Standard CareD-Aid
.
RR=0.76 (0.6, 0.9)
Source: O’Connor et al., Cochrane Library, 2007
5 Providing decision aids to patient will be one of the mechanisms to reduce rates of discretionary surgery
Percentage of patients deciding to have a procedure

Reducing variance of GP referrals for new outpatient appointments could lead to savings of £0.2-0.4bn. across England
McKinsey & Company 56
Working D
raft -Last Modified 18/03/2009 15:41:52
Printed 18/03/2009 15:36:55
|
304
232
218
217
208
177
155
154
142
120
110
108
76
68
ENT
Audiological Med
Urology
Oral Surgery
General Med
Trauma & Ortho
Dermatology
General Surgery
Ophthalmology
Pediatrics
Plastic Surgery
Cardiology
Gynecology
Obstetrics
547
355
396
325
291
269
242
222
251
192
158
185
115
102
25.6
9.5
15.7
13.2
13.2
21.0
25.6
14.7
10.9
11.7
12.2
21.4
11.7
12.0
45.9
14.6
28.6
19.8
18.5
31.8
40.0
21.3
19.4
23.6
17.4
36.6
17.8
17.8
Worst GPs to specialty’s mean SAR*
£k saving% apptssaved £k saving
% apptssaved
13.8% £3,652 21.8%Overall* £2,291
* Adjusted Standardized Activity Ratio (SAR) represents the difference between the expected and the actual admissions per population adjusted for deprivation. An SAR value of 100 means the actual number of admissions was the same as the expected number.Source: Doctor Foster 2006-07 data
Worst GPs move to 80% of the specialty’s top quartile SAR*
If this PCT potential savings
from reducing variance in GP
referrals for new outpatients is
extrapolated to all PCTs in England, potential savings
of £240-380m
PCT EXAMPLE
5

Potential savings of £0.2-0.3b, if PCTs achieve the median follow-ups to new OP ratio or 80% of the potential of stepping down to bottom quartile
5
McKinsey & Company 57
Working D
raft -Last Modified 18/03/2009 15:41:52
Printed 18/03/2009 15:36:55
|
Impact of reducing ratio of OP follow-ups to new to the median or 80% of the potential of stepping down to the bottom quartile
3,27
2,46
2,16
1,91
1,50Bottom decile
Bottom quartile
Median
Upper quartile
Upper decile
PercentileFollow-up to new ratio – All acute hospitals in England. 2006-07 9–13%1 reduction
in OP follow-up attendances
X29m. OP follow-up
attendances
X
£79 average price per OP follow-up
=
£200- 300m
1 Top of range: underperformers achieve 80% of the potential improvement of stepping down to bottom quartile. Bottom of the range: underperformers step down to the median
Source: HES data 2006/07, Mckinsey analysis

McKinsey & Company 58
Working D
raft -Last Modified 18/03/2009 15:41:52
Printed 18/03/2009 15:36:55
|
In the US, there is strong evidence that physician self-referral leads to inappropriate utilization of diagnostics
1 Based on analysis of 60,000 episodes of outpatient care by 6,400 physicians 2 Urography, cystography, or ultrasonographySource: BJ Hillman et al., “Frequency and costs of diagnostic imaging in office practice – a comparison of self-referring and radiologist-referring physicians,” 323 NEJM (Dec. 6, 1990);
JM Mitchell & E Scott, “Physician ownership of physical therapy services. Effect on charges, utilization, profits, and service characteristics,” 268 JAMA (October 1992)
Self-referring vs. radiologist-referring physicians1
4.2
6.2Acute upperrespiratory symptoms
4.5
7.5Pregnancy
4.5
4.8Low back pain
4.0
4.4Difficulty urinating (men)
Relative frequency of doing an imaging examination
Imaging charges per episode of care (ratio)
Condition
Chest x-ray
Imaging examination
Obstetric ultrasound
Lumbar spine X-ray
Excretory study2
In general, self-referrals led to four times more use of imaging examination and a total cost of diagnostics per episode of care that would be between 4.4 and 7.5 times more
5

Potential savings of £95-140m by reducing variation in three types of diagnostic referrals
McKinsey & Company 59
Working D
raft -Last Modified 18/03/2009 15:41:52
Printed 18/03/2009 15:36:55
|
35.7Top decile
39.8Top quartile
46.6Median
52.9Bottom quartile
64.4Bottom decile
20.1
23.3
25.9
29.3
34.3
Percentile CT scans
Number of diagnostics per 1,000 weighted population
MRI scans
Potential savings, £m
27 - 42 40 -53
Potential improvement if PCTs step down to median or 80% of the top quartile in the number of diagnostics per 1,000 weighted population
% improvement 11-16 10-13
Ultrasounds
27- 46
9-16
58.1
67.1
80.0
93.1
103.0
9 – 16% potential improvement in
these three investigations
X
8m. diagnostics
X
£70 – 295 per diagnostics
=
£95 – 140m savings
5
Source: Department of Health Diagnostic Waiting List Returns; DH Exposition book 07/08
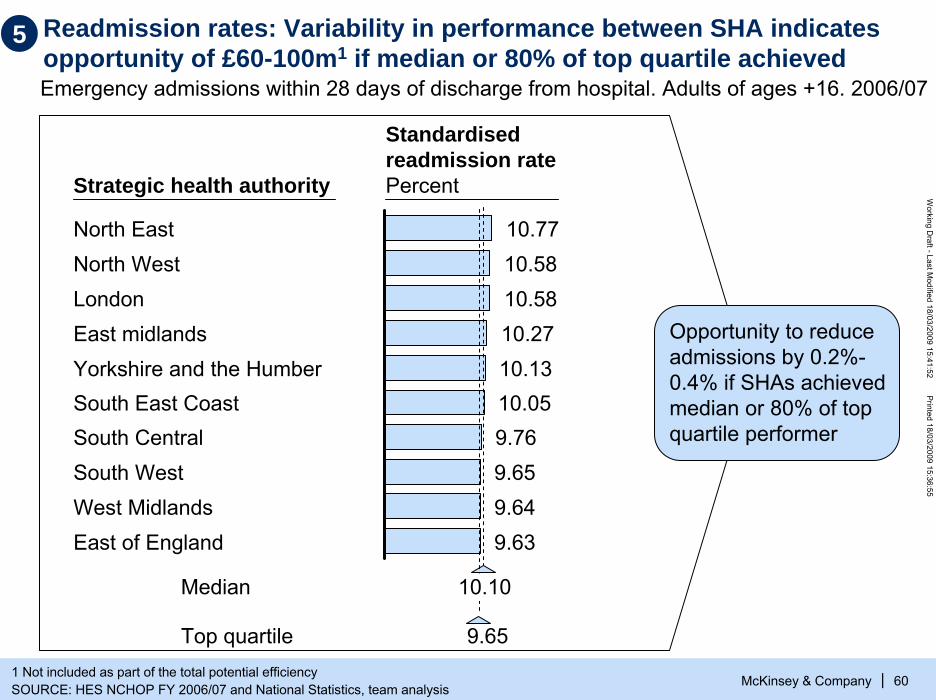
Readmission rates: Variability in performance between SHA indicates opportunity of £60-100m1 if median or 80% of top quartile achieved
McKinsey & Company 60
Working D
raft -Last Modified 18/03/2009 15:41:52
Printed 18/03/2009 15:36:55
|1 Not included as part of the total potential efficiencySOURCE: HES NCHOP FY 2006/07 and National Statistics, team analysis
Strategic health authority
North East
Yorkshire and the Humber
South Central
West Midlands
LondonEast midlands
South West
South East Coast
East of England
North West10.7710.5810.5810.2710.1310.059.769.659.649.63
Standardised readmission ratePercent
Emergency admissions within 28 days of discharge from hospital. Adults of ages +16. 2006/07
Median
Top quartile 9.65
10.10
Opportunity to reduce admissions by 0.2%-0.4% if SHAs achieved median or 80% of top quartile performer
5

Targeting most cost-effective interventions could lead to savings of £2.8-3.4bnExample: congestive heart failure (CHF) pathway in a PCT of ~1 million population
5
McKinsey & Company 61
Working D
raft -Last Modified 18/03/2009 15:41:52
Printed 18/03/2009 15:36:55
|
PCT spend£m
Life years gained/lostNumber of
years
Decommission less cost-effective interventions
-1.5
Commission more cost-effective interventions
0.5
Impact of decommissioning less costs effective interventions
-8.200+8.200
Net impact on PCT spend
-1.0
Impact of commissioning more cost-effective interventions
Net impact on life years gained
0
If we assume that PCTs can optimize 10-15% of their spend targeting the most cost-effective interventions1, potential reduction in spend without any change in the life years of the population is estimated at £2.8-3.4bn. (6-7% of current PCTs spend2)
1 Based on CHF example, assumption is that PCTs can target interventions 3 times more cost-effectively2 Includes total PCT commissioning spend excluding drugs, estates costs and clinical and non clinical supplies spend

It is feasible to prioritise interventions… Example: congestive heart failure
5
McKinsey & Company 62
Working D
raft -Last Modified 18/03/2009 15:41:52
Printed 18/03/2009 15:36:55
|
Most effective Interventions
Eligible population
Diuretic 3,3908
ACE inhibitor 3,3909
B blocker 3,39010
Spironolactone 40713
Digoxin 40714
Smoking cessation
1,46825
Community monitoring
6,11828
Vaccination 6,11826
Exercise 6,11829
Severe/ refractory
Initial treatment
Secondary prevention
Current perf., %
Target perf., %
90 95
78 90
55 75
85 95
83 95
10 50
50 75
75 95
50 90
4,296-5,949
LYG*Cost to PCT £k
1,148 66
808 152
1,501 327
111 -60
0 -53
2,166 390
0 n.a.
227
5,065 4,725
Calculat-ed cost/ LYG*, £
58
188
218
0
0
180
0
38-53
933
Rank
2
4
5
3
1
6
* Life years gainedSource: Mckinsey analysis

McKinsey & Company 63
Working D
raft -Last Modified 18/03/2009 15:41:52
Printed 18/03/2009 15:36:55
|
DiureticsSmokingcessation
ACEB blocker Exercise1,0000
6,000
8,000
Life years gained
Vaccination£k
2,000
16,000
14,000
12,000
4,000
06,0005,5001,500
10,000
£500,000
8,247 life years gained
It is feasible to identify which interventions will deliver maximum return in order to de-commission less cost effective interventionsExample: congestive heart failure
Decommission or reduce commissioning of the lowest
cost interventions…
… and increase commissioning of most costs effective intervention in line with the
best practices standards
5

Conduct utilisation reviews – potential savings of £1.1–1.7b, equivalent to 2–3% of current commissioning spend£b, 2007/08
McKinsey & Company 64
Working D
raft -Last Modified 18/03/2009 15:41:52
Printed 18/03/2009 15:36:55
|1 Mental health and learning disabilitiesSOURCE: McKinsey experience in U.S., Germany and U.K. National Audit Office – PCT Care purchased by PCTs; Office
Fair Trade – Financial Flows relevant to medicines, ERIC, McKinsey analysis
9.5
8.4
33.7
19.2
70.8
Total PCTs’revenue allocation
11.8
Spend in drugs (primary & secondary care)
3.3
Estate costs (PCTs and providers)
55.7
PCT spend subject to utilisation reviews
1.1-1.7
Potential savings from conducting utilisation reviews
54.0-54.6
PCT spend after utilisation reviews
MH and LD1
Community serv.
Acute care
Primary care services
U.S.. German and UK experiences indicates potential of 3–5% of total spend
6

Conduct utilisation reviews: Application of protocols in a trust resulted in identification of c40%* patients who did not require admission
McKinsey & Company 65
Working D
raft -Last Modified 18/03/2009 15:41:52
Printed 18/03/2009 15:36:55
|
Community resources needed (Carer, Home
equip etc.) = 36
150 Patients not requiring admission (39%*)
Sub acute or Skilled care on discharge= 31
Just go home= 13Refuse Discharge = 9
In hospital test/ therapy delays= 38
Discharge to a lower level (NH) of care needed= 1
Direct admit from GP =1
Admission: social reasons, risk factors= 7
6
* Total sample of 383Source: Interqual (McKesson)

Reduce upcoding: Typical areas of upcoding challenge and/or requiring utilisation review
McKinsey & Company 66
Working D
raft -Last Modified 18/03/2009 15:41:52
Printed 18/03/2009 15:36:55
|
▪ Excess Bed Days
▪ Daycare instead of regular day attender(excluding Respiratory)
▪ Same day readmissions EL
▪ Outpatient procedures instead of DC tariffs
▪ Excess charges for high-cost drugs (IPPD drugs spend in excess of plan)
▪ Excess Bed Days
▪ Increase in NEL Short Stay after CDUcapacity increase
▪ NEL Readmissions within 14 days
▪ Inappropriate CDU/PEAU/AMU stays
▪ Short Stay Tariff not applied
▪ Same day Readmissions NEL
▪ Patients admitted more than once on same T-code
▪ Unbundled tariff
Elective/ other challenges Non-elective challenges
6

McKinsey & Company 67
Working D
raft -Last Modified 18/03/2009 15:41:52
Printed 18/03/2009 15:36:55
|
Contents
▪ The challenge and size of the opportunity
▪ Detailing the opportunities– Drive cost efficiencies in all provider services– Optimize spend and ensure compliance with
commissioners' standards– Shift care into more cost-effective settings
▪ Implications
▪ Making it happen
▪ Backup: Methodology and assumptions
McKinsey & Company 68
Working D
raft -Last Modified 18/03/2009 15:41:52
Printed 18/03/2009 15:36:55
|
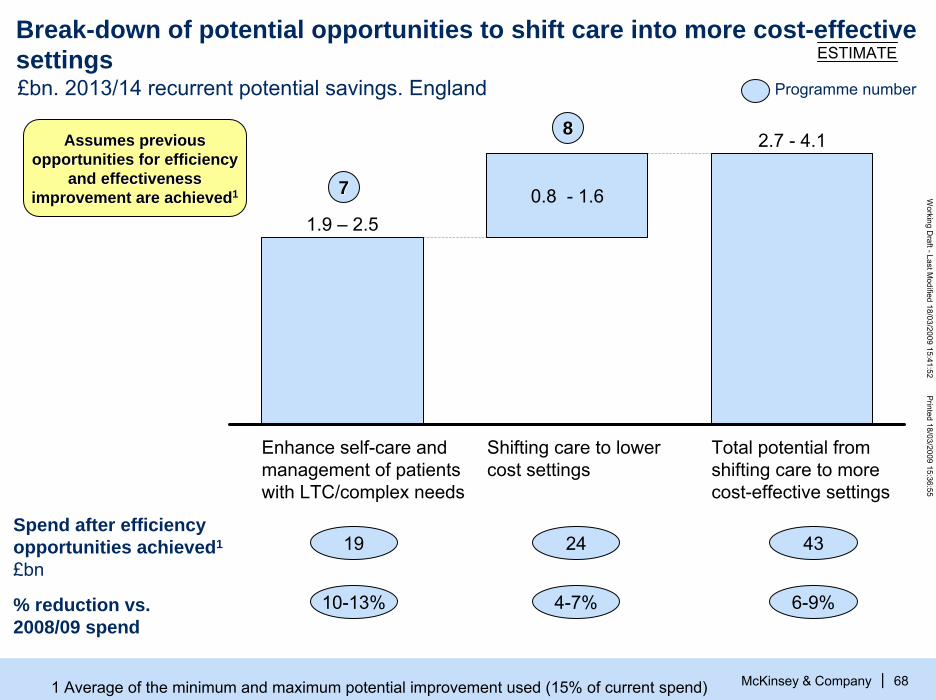
Break-down of potential opportunities to shift care into more cost-effective settings ESTIMATE
Enhance self-care and management of patients with LTC/complex needs
0.8 - 1.61.9 – 2.5
Shifting care to lower cost settings
Total potential from shifting care to more cost-effective settings
2.7 - 4.1
19 24
10-13% 4-7%
Spend after efficiency opportunities achieved1
£bn
% reduction vs. 2008/09 spend
£bn. 2013/14 recurrent potential savings. England
43
6-9%
Assumes previous Assumes previous opportunities for efficiency opportunities for efficiency
and effectiveness and effectiveness improvement are achievedimprovement are achieved11
Programme number
77
88
1 Average of the minimum and maximum potential improvement used (15% of current spend)

McKinsey & Company 69
Working D
raft -Last Modified 18/03/2009 15:41:52
Printed 18/03/2009 15:36:55
|
Chronic disease management: £1.9 – 2.5bn savings could be achieved through enhanced programmes£b, 2007/08
1 Driving through productivity improvements in all providers and optimizing spend (average savings assumed)SOURCE: British Heart Association; Cancer Reform Strategy DH; DH Publications Diabetes; British Lung Association,
Healthcare Commission Facts about COPD
0.50.8
4.6
4.6
12.0
22.5
Total current spend in chronic diseases
3.3
Cost reduction from efficiencies already identified1
19.2
Spend in chronic diseases after efficiencies already identified1
1.9-2.5
Potential savings through self care and enhanced programmes
16.8-17.3
Spend in chronic diseases after efficiency improv.
COPDAsthmaCancer
Diabetes
CVD
Key opportunities▪ Increase self care
e.g. patient information, blood pressure test at home, …
▪ Enhanced chronic disease management
– Patient database
– Incentives for enrolment and commitment
– Targeted contacts
Assumes 10Assumes 10--13% potential 13% potential savings based on experiences savings based on experiences
in US and Germanyin US and Germany
7

Integrated systems like Kaiser Permanente are 20% more cost effective than other competing systems
McKinsey & Company 70
Working D
raft -Last Modified 18/03/2009 15:41:52
Printed 18/03/2009 15:36:55
|
5
12
16
19
21
23
24
Georgia
Northern California
Ohio
Southern California
Colorado
Mid Atlantic states
North West
▪ By creating a continuum of care, integrated systems are more cost effective because– Providers do not have an
incentive to overtreat patientsbut rather to keep them healthy
– Providers focus on preventive measures and therapies that are most cost effective
– Tests/procedures are not needlessly duplicated or competing treatments prescribed
Overall cost advantage = 19%
SOURCE: Hewitt’s Health Value Initiative (HHiV) – evaluating financial efficiency and plan performance
Kaiser Permanente cost advantage vs. all plans (including HMOs PPO and POS plans)% of cost advantage
7
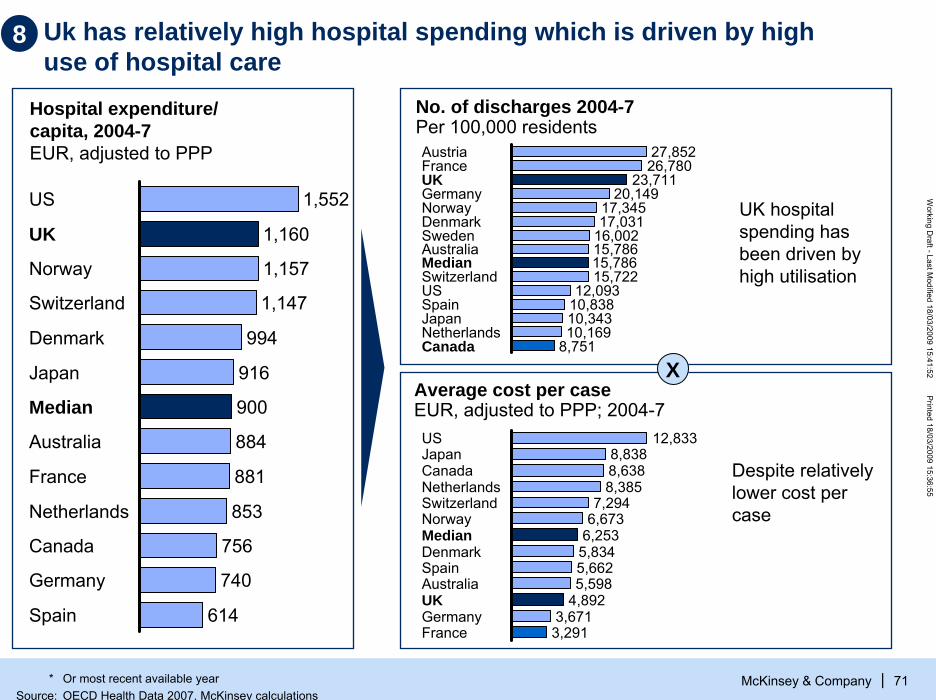
Uk has relatively high hospital spending which is driven by high use of hospital care
McKinsey & Company 71
Working D
raft -Last Modified 18/03/2009 15:41:52
Printed 18/03/2009 15:36:55
|
UK hospital spending has been driven by high utilisation
Hospital expenditure/capita, 2004-7EUR, adjusted to PPP
X
1,552US
1,160UK
1,157Norway
1,147Switzerland
994Denmark
916Japan
900Median
884Australia
881France
853Netherlands
756Canada
740Germany
614Spain
27,852Austria26,780France
23,711UK20,149Germany
17,345Norway17,031Denmark
16,002Sweden15,786Australia15,786Median15,722Switzerland
12,093US10,838Spain10,343Japan10,169Netherlands
8,751Canada
12,833US8,838Japan8,638Canada8,385Netherlands
7,294Switzerland6,673Norway
6,253Median5,834Denmark5,662Spain5,598Australia
4,892UK3,671Germany3,291France
Despite relatively lower cost per case
No. of discharges 2004-7 Per 100,000 residents
Average cost per caseEUR, adjusted to PPP; 2004-7
8
* Or most recent available yearSource: OECD Health Data 2007, McKinsey calculations

Shifting to lower cost settings – Potential savings of £0.8-1.6b through transforming unscheduled care and shifting care to primary care£b, 2008/09
McKinsey & Company 72
Working D
raft -Last Modified 18/03/2009 15:41:52
Printed 18/03/2009 15:36:55
|
22.0-22.8
15.0-15.5
Potential savings from shifting to lower cost settings2
27.7
4.1 23.6
Total spend after shifting to lower cost settings
16.1
Cost reduction from efficiencies already identified1
Total spend that could be shifted to primary care/home settings after identified efficiencies
7.0-7.3
8.8 0.8-1.6
Unscheduledcare
7.5
Total spend that could be shifted to lower cost setting
18.9
OP + Day case+ RA and diagnostics
Key opportunities▪ 45% of A&E
attendances are minors
▪ Admissions for ACS conditions (those that should not require an admission) account for 10-15% of non-elective spend
▪ Significant number of OP attendances, day-cases and diagnostics could be delivered in GP surgeries or polyclinic
4–7
2–7
4–7
Potential savings
£b
0.8–1.6
0.2–0.5
0.6–1.1
% spend
1 Driving through productivity improvements in all providers and optimizing spend2 Net savings after the cost of providing the care in the new settingsSOURCE: HES online, National Audit Office – Summarized Accounts Care Purchased by PCTs, McKinsey analysis
8
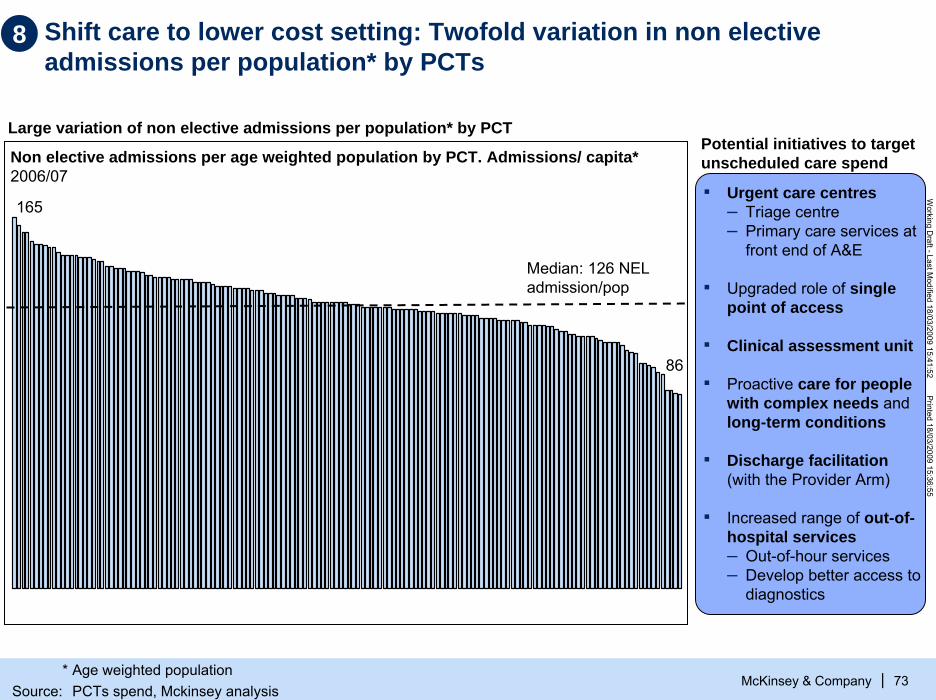
Shift care to lower cost setting: Twofold variation in non elective admissions per population* by PCTs
McKinsey & Company 73
Working D
raft -Last Modified 18/03/2009 15:41:52
Printed 18/03/2009 15:36:55
|
Non elective admissions per age weighted population by PCT. Admissions/ capita*2006/07
Median: 126 NELadmission/pop
86
165
Potential initiatives to target unscheduled care spend
▪ Urgent care centres– Triage centre– Primary care services at
front end of A&E
▪ Upgraded role of single point of access
▪ Clinical assessment unit
▪ Proactive care for people with complex needs and long-term conditions
▪ Discharge facilitation(with the Provider Arm)
▪ Increased range of out-of-hospital services – Out-of-hour services– Develop better access to
diagnostics
Large variation of non elective admissions per population* by PCT
8
* Age weighted populationSource: PCTs spend, Mckinsey analysis

Shift care to lower cost setting: Reducing unscheduled care spend…
McKinsey & Company 74
Working D
raft -Last Modified 18/03/2009 15:41:52
Printed 18/03/2009 15:36:55
|
A&E attendances
▪ ~45% of A&Eattendances are minors
Emergency admissions
▪ ~30% of emergency admissions are short stays (0 days LOS) and ~10% are for people with complex health needs/frequent users (4+ admissions per year)
▪ Admissions for ACS conditions (those that should not require an admission) account for 10-15% of non-elective spend
Excess bed days ▪ The average
excess bed days is ~10 days
8
SOURCE: PCT analysis, 2006/7

… through a combined portfolio of 7 initiatives targeting the 3 main areas of spend in unscheduled care
McKinsey & Company 75
Working D
raft -Last Modified 18/03/2009 15:41:52
Printed 18/03/2009 15:36:55
|
Emergency admissions avoidance
Reduce A&EattendancesInitiatives
Excess bed days
Impact
▪ Increased range of out-of-hospital services – Out-of-hour services– Expand range of services in practices– Develop better access to diagnostics
7
▪ Discharge facilitation (in conjunction with Provider Arm), e.g., through unique care model pilot
( )* ( )*6
▪ Clinical assessment unit (CAU)5
▪ Proactive care for people with complex needs and long-term conditions (LTCs) (includes frequent fliers)
4
▪ Rapid response services3
▪ Upgraded role of single point of access2
▪ Urgent care centers– Triage center– Primary care services at front end of A&E– Multidisciplinary primary care services at
A&E to take care of ambulatory patients
( )*1• These initiatives must be implemented simultaneously to maximize their impact
• Failure to implement one or more initiatives has a direct impact on the savings to be captured by the implemented initiatives
8
* ( ) indirect effect Source: Team analysis

Estimated savings from transforming provisioning of unscheduled care estimated at £0.6-1.1bn£b.
McKinsey & Company 76
Working D
raft -Last Modified 18/03/2009 15:41:52
Printed 18/03/2009 15:36:55
|
Total net savings from shifting the unscheduled care to lower cost settings
0.6 – 1.1
0.3 - 0.5
Avoided A&Eattendances –treated in UCC/ walk-in clinics/ GPs
0.7 - 1.2
Avoided non-elective admissions
1.0 - 1.7
Cost of providing inthe lower costs setting
0.4 - 0.6
Total savings from shifting unsche-duled care to lower costs settings – before reprovisioningcosts
Comissioning costs after productivity improve-ments achieved £bn
1.5
20-32%
15
5-8%% of potential cost savings
35% of savings
Assumes previous Assumes previous opportunities for efficiency opportunities for efficiency
and effectiveness and effectiveness improvement are achievedimprovement are achieved11
8
Source: National Audit Office Summarized Accounts; HES online, team analysis

Shifting day and OP care from acute to primary/community care is more cost effective even factoring costs of building new facilities
Annual impact of shifting OP and day care. £m at today’s prices.
McKinsey & Company 77
Working D
raft -Last Modified 18/03/2009 15:41:52
Printed 18/03/2009 15:36:55
|
New model of care efficiencies
Additional costs to upgrade facilities of existing services*
1.4
Net impact onI&E
PCTI&E
5.8
0
2.9
1.5
Additional cost:▪ Diagnostics
at the LCCs▪ Consultant
travel time▪ Additional
community services
Net savings from shifting care out of hospital(assuming not upgrading of estates)
4.3
Equivalent to Equivalent to 22--7% savings 7% savings
of the care of the care shifted to the shifted to the
polyclinicpolyclinic
8
* Includes upgrading of facilities for GPs, community services, team bases, mental health trust moving to new polyclinSource:OBC models, team analysis

Assuming similar potential savings for all other PCTS, potential savings from shifting acute care to primary care of £0.2-0.5bn£bn
McKinsey & Company 78
Working D
raft -Last Modified 18/03/2009 15:41:52
Printed 18/03/2009 15:36:55
|
Cost reduction from identified efficiency1
opportunities
Total spend that could be shifted to lower cost setting, after identified efficiency opportunities
1.3 7.5
4.1
Current spend in day case
4.1
Current spend in OP attendances
0.6
Current spend in regular attenders
8.8
Total current spend that could be shifted to lower cost setting
Potential net savings –after repro-visioning costs
0.2-0.5 7.0-7.3
Total spend after shifting care to lower cost setting
Assumes previous opportunities Assumes previous opportunities for efficiency and effectiveness for efficiency and effectiveness
improvement are achievedimprovement are achieved11
8
1 Driving through productivity improvements in all providers and optimizing spendSource:OBC models, team analysis

McKinsey & Company 79
Working D
raft -Last Modified 18/03/2009 15:41:52
Printed 18/03/2009 15:36:55
|
Contents
▪ The challenge and size of the opportunity
▪ Detailing the opportunities
▪ Implications
▪ Making it happen
▪ Backup: Methodology and assumptions

Implementation of all programmes will have the largest impact in acute and community services spend (1/2)£bn. 2008/09. Mid point of maximum and minimum size of the opportunity.
McKinsey & Company 80
Working D
raft -Last Modified 18/03/2009 15:41:52
Printed 18/03/2009 15:36:55
|1 Optimisation of spend allocate proportionally to current spend between primary, community, mental and acute careSOURCE: McKinsey analysis
Optimise spend
8.3
17.6
8.3
8.1
12.8
30.1
8.5
84.9
8.4
13.1
92.5
12.8
7.0
17.0
9.6
Current spend 2008/09
79,2
7.6
Spent after driving productivity through all providers
8.8
33.7
6.4
19.2
5.7
12.8
Shift care to lower cost setting
Other & PCToverheads
Central budgets
Mental Health and LD
26.5
Acute care
Spend after drive through productivity and optimise spend
Spend after all 3 areas of opportunity
Primary care
6.4Communitycare
3.4
17.0
8.3
23.1
75.8
Drive productivity through all providers
8.1
• Doesn’t consider that unit cost are now lower Considers that
previous savings achieved
Reduction vs. 2008/09 spendPercent
2%2%
4%4%
15%15%
31%31%
23%23%
11%11%
18%18%

McKinsey & Company 81
Working D
raft -Last Modified 18/03/2009 15:41:52
Printed 18/03/2009 15:36:55
|
Implementation of all programmes will have the largest impact in acute and community services spend (2/2)Percentage reduction vs. 2008/09 commissioning spend. Cumulative1
! Range indicates the low and maximum potential identified SOURCE: McKinsey analysis
Cumulative savings vs. current spend 2008/09. Percent
Optimise spend
Drive through productivity
Shift to lower cost settings
1-2 1-2 1-2
3-5 3-5 3-5
7-10 13-18 13-18
8-13 17-26 25-38
13-20 19-28 19-28
5-8 9-13 9-13
6-10 12-17 15-22
Primary care
Community care
Acute Care
Mental Health and LD
Others and PCT overheads
Central budgets
Total

McKinsey & Company 82
Working D
raft -Last Modified 18/03/2009 15:41:52
Printed 18/03/2009 15:36:55
|
25% of the potential savings are driven by tariff or other national levers£bn. 2013/14 recurrent potential savings. England
60
80
1.9-3.0
0.5-0.6
Drive acute providers’productivity
1.3-1.915
20
Estates optimisa-tion
2.3-3.7
Driving non-acute providers’productivity
3.7-4.9
Optimising spend within care pathways
0.8-1.6
1.1-1.7
13.4-19.9
Enforcing PCTs contracts/ standards
Enhancing self care and chronic diseases mgment
Total potential
Local health economy reconfigur-ations
1.9-2.5
Supply Chain/ procure-ment
ESTIMATE
11
22
33
44
55
66
77
88
Programme number
Tariff and other national levers
Non tariff
25

McKinsey & Company 83
Working D
raft -Last Modified 18/03/2009 15:41:52
Printed 18/03/2009 15:36:55
|
In the best case, headcount will have to be maintained flat; if savings of £20bn are required, headcount will need to be 10% lower
110 110110 990
Growth in WTEs 08/09 -13/14 in line with activity growth1
1.210
Productivity gain to achieve £10bn savings
1.100
2013/14 NHS forecast WTEsassuming savings of £10bn achieved
Additional productivity to achieve £20bn savings
1.100
2008/09 NHS number of WTEs
2013/14 NHS forecast WTEsassuming savings of £20bn achieved
2013/14 NHS forecast WTEsassuming current productivity levels
ESTIMATE
SOURCE: The information centre for social and community care, NHS staff 1997–2007; McKinsey analysis
Number of WTE ‘000. NHS England.

Need to decide early on the mechanisms to minimize the “pain” to the workforce
McKinsey & Company 84
Working D
raft -Last Modified 18/03/2009 15:41:52
Printed 18/03/2009 15:36:55
|
Description of current situation
▪ Consider a reduction of the training positions, starting next academic year, to avoid further oversupply in 5 years from now, given new scenario
Align training Align training positions with positions with
reviewed fundingreviewed funding
▪ Medical school places grew ~8% per year between 2000 and 2005, above the expected growth in activity of 5.5%
Introduce an early Introduce an early retirement retirement
programmeprogramme
▪ Design an attractive and cost efficient early retirement programme to be implemented in the next 2 years
▪ 30-40% of the GPs and 50% of community nurses are above 50 years old1
▪ Multiple companies and industries have used early retirement programmes to cope with recessions while ensuring “new blood/talent” keeps coming into the system
Potential actions in next 6 months
Limit introduction of Limit introduction of mandatory staffing mandatory staffing
ratiosratios
▪ Review current plans to introduce mandatory staffing costs or investments in quality of care requiring an increase of the staffing levels
▪ Some Royal Colleges are recommending introduction of mandatory staffing ratios on safety grounds that will lead to increases in staff required above the activity growth e.g ratio of 1/28 per midwife
▪ Certain service reviews are also recommending more staff is required e.g. stroke, children
Introduce a staff Introduce a staff hiring freezehiring freeze
▪ Current average NHS leaving rate is 10.5% for medical staff and 10.1% for not medical staff although it varies widely by skill e.g. nurses and HCA 14% and 22% respectively, consultants 7.2%
▪ Evaluate options and timing of introducing a staff hiring freeze in the next 2 years, even if funding available
1 – King’s Fund – NHS workforce – 2005SOURCE: Kings Fund – NHS Workforce 2005; Information Centre for Social and Community Care

Implementation costs are estimated at £1.2-1.8bn over 3 years, equivalent to ~9% of potential annual savings
McKinsey & Company 85
Working D
raft -Last Modified 18/03/2009 15:41:52
Printed 18/03/2009 15:36:55
|
240-320
105-310
165
60-100
40-55
Yr 3
Redundancy costs1
Double running costs2
CAPEX to upgrade facilities3
Implementation teams4, externalSupport and training
10-25
165
15-30
230-270
Yr 1
120-160
60-180
165
80-120
425-625
Yr 2
570-895
ESTIMATED
£mCumulative imple-mentation costs. £m
1,2201,220--1,7901,790
400400--530530
175175--515515
495495
155155--250250
1 Assumes 6-8 months wages as redundacy pay, 11% normal turnover, and 80% of turnover used to capture necessary redundancies2 Assumes 10-20% costs doubled for 4-6 months, with 5% care shifted in 1st year, 40% shifted in second year and 100% in thrid year3 See page 394 Includes the Central Productivity Unit (see page 96) and the PCTs and SHAs central teams as perNote: Does not include IT spend

McKinsey & Company 86
Working D
raft -Last Modified 18/03/2009 15:41:52
Printed 18/03/2009 15:36:55
|
Life expectancy at birth (male and female)2006. Years
Total healthcare spend as % of GDP age adjusted2006. Percentage
France
Netherlands 9.6
10.8
4.2Singapore
7.5Finland
8.4Italy
8.4*UK 2006*
8.5Sweden
8.5Spain
8.7Norway
7.5%UK- if £10bn. in efficiencies released in cash
80
79
81
80
81
81
If £10bn were released in cash to close the potential funding gap, England would be one of the most cost effective countries, starting from a low base2006
79*
80
81
* Healthcare spend as % of GDP age adjusted is for UK, Life expectancy is for England Note: Calculations based on 2006 to ensure comparability with other countries.
Source: WHO Statistical Information System, United Nations Statistics Division

McKinsey & Company 87
Working D
raft -Last Modified 18/03/2009 15:41:52
Printed 18/03/2009 15:36:55
|
Contents
▪ The challenge and size of the opportunity
▪ Detailing the opportunities
▪ Implications
▪ Making it happen
– Mechanisms to capture value and enablers
– Overall programme architecture
▪ Backup: Methodology and assumptions

McKinsey & Company 88
Working D
raft -Last Modified 18/03/2009 15:41:52
Printed 18/03/2009 15:36:55
|
Mec
hani
sms
to c
aptu
re
Drive through costs efficiencies in all provider services
8 of the 16 programmes would focus on mechanisms and enablers necessary to capture the identified opportunities
Drive acute providerproductivity
11
GPs/Consultants contracts
Market structure/management
Commissioning tools & enforcing contracts
Applicable to capture the value
Optimize spend and ensure compliance with standards
Shift care into more costs effective setting
Drive non -acute providerproductivity
Supply chain
Estates optimisation
Optimising spend within care pathways
Enforcing PCT contracts/ standards
Enhancing self care and chronic disease mgment.
Local health economy reconfigura-tions
22 33 44 55 66 77 88
Tariff and reimbursements
Personal budgets and financial incentives
Workforce
ITBar
riers
/ en
able
rs
99
1010
1111
1212
1313
1414
1515
Capabilities1616

McKinsey & Company 89
Working D
raft -Last Modified 18/03/2009 15:41:52
Printed 18/03/2009 15:36:55
|
Contents
▪ The challenge and size of the opportunity
▪ Detailing the opportunities
▪ Implications
▪ Making it happen
– Mechanisms to capture value and enablers
– Overall programme architecture
▪ Backup: Methodology and assumptions

Key questions when designing the overall programme
McKinsey & Company 90
Working D
raft -Last Modified 18/03/2009 15:41:52
Printed 18/03/2009 15:36:55
|
Which process will be used to develop implementation plans at SHAs, PCT and provider level?How will targets be cascaded down to the system?How existing programmes e.g. WCC, PCT performance regime will be used to support the delivery of the programme?
Case for changeCase for change
Facilitate changeFacilitate change
Support Support development of development of
skills/capabilitiesskills/capabilities
▪ Which tools/methodologies can the Productivity Unit and/or the SHAs develop to support development of capabilities and skillse.g. productive ward, utilisation reviewing, market management?
▪ What would be the resources required to provide this support?▪ Which pilots could be used to test tools/methodologies and show
early success to build momentum?
▪ Which barriers to change need to be removed e.g., workforce mobility, incentives for M&A
▪ Which success examples of improved efficiency without compromising quality could be shared?
▪ Which will be the key messages of the case for change?– Why do we need this programme?– How much is needed and by when? Impact on quality?– What will happen if we don’t deliver?
▪ How and when this case for change will be communicated?
Plan deliveryPlan delivery
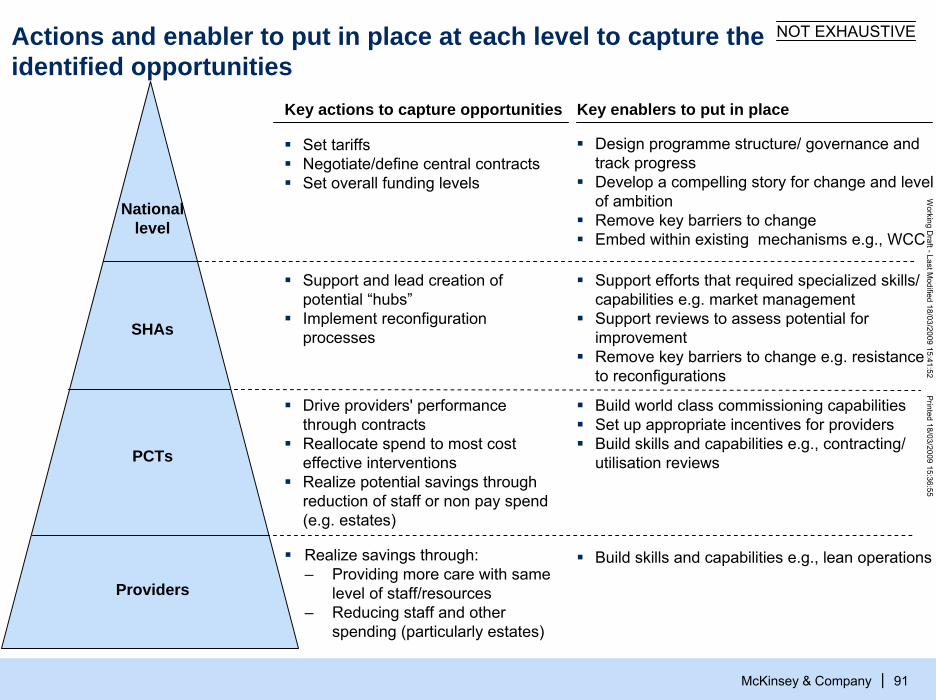
McKinsey & Company 91
Working D
raft -Last Modified 18/03/2009 15:41:52
Printed 18/03/2009 15:36:55
|
Actions and enabler to put in place at each level to capture theidentified opportunities
National level
SHAs
PCTs
Key actions to capture opportunities
Support and lead creation of potential “hubs”Implement reconfiguration processes
Drive providers' performance through contractsReallocate spend to most cost effective interventionsRealize potential savings through reduction of staff or non pay spend (e.g. estates)
Set tariffsNegotiate/define central contractsSet overall funding levels
Providers
Realize savings through:– Providing more care with same
level of staff/resources– Reducing staff and other
spending (particularly estates)
NOT EXHAUSTIVE
Key enablers to put in place
Design programme structure/ governance and track progressDevelop a compelling story for change and level of ambitionRemove key barriers to changeEmbed within existing mechanisms e.g., WCC
Support efforts that required specialized skills/ capabilities e.g. market managementSupport reviews to assess potential for improvementRemove key barriers to change e.g. resistance to reconfigurations
Build world class commissioning capabilitiesSet up appropriate incentives for providersBuild skills and capabilities e.g., contracting/ utilisation reviews
Build skills and capabilities e.g., lean operations

We envision a central programme for which delivery will be driven through the SHAs
McKinsey & Company 92
Working D
raft -Last Modified 18/03/2009 15:41:52
Printed 18/03/2009 15:36:55
|
Key roles ▪ Develop a compelling case for change
and set targets▪ Design the programme structure/
governance and track performance▪ Remove barriers to change and share
best practices/success stories▪ Develop policies/methodologies for
allocative efficiency
Key roles ▪ Drive through local delivery of the
programme▪ Set targets at PCT/provider level▪ Design local programme structure/
governance and allocate resources▪ Lead delivery of SHA-wide opportunities
e.g., service reconfigurations, “hubs”
Strategic Health Authorities (SHA)
Local implemen-tation teams for each programme
Team Acute productivity programme
Team Acute productivity programme
Key roles▪ Deliver identified productivity
improvement opportunities▪ Take out costs maintaining or
increasing quality of care
. . .
Central Productivity Unit
Steering Committee Steering Committee World Class World Class
Productivity Productivity (DH, SHAs (DH, SHAs and Productivity Unitand Productivity Unit

McKinsey & Company 93
Working D
raft -Last Modified 18/03/2009 15:41:52
Printed 18/03/2009 15:36:55
|
Potential key activities of the programme in the first 12 monthsC
ase
for
Cas
e fo
r ch
ange
chan
gePl
an
Plan
pr
ogra
mm
espr
ogra
mm
esR
emov
e R
emov
e ba
rrie
rsba
rrie
rsN
atio
nal
Nat
iona
l su
ppor
tsu
ppor
tN
atio
nal
Nat
iona
l in
itiat
ives
initi
ativ
esPi
lots
Pilo
ts
▪ Create compelling story and set targets
▪ Develop delivery plans for the different programmes at SHA, PCT and provider level
▪ Eliminate current barriers to change, e.g., mandatory workforce ratio, incentives to M&A
▪ Provide support to SHAs– Methodologies/ tools
e.g. productive ward, allocative efficiency
– Skills: PFI reneg.
▪ Execute on the national levers to capture some opportunities, e.g., PPRS, tariff, PASA, clawback
▪ Prove concept and disseminate best practices
Objectives
Track performance (FPO)
ExecuteDevelop communi-cation plan
Execute action plans and track performance
Develop and agree action plans
Agree areas of support with SHAs
Execute actions plans and track performance
Develop and agree action plans
Prioritise levers based on value and ease of capture
Execute action plans and track performance
SHA IBP
Develop arguments: quality, productivity
Agree size of gap and cascade targets
Develop and agree action plans
Prioritise barriers by value and ease to remove
All SHAs cascade IBPsto PCTs/providers
All SHAs develop IBPs
Prioritise support based on value to SHAs and cost to implement
04/’09 04/’10
SHA cascades IBP to PCT/provider level
Pilot SHA to develop an integrated business plan (IBP)
Individual programme pilots x16Individual programme pilots x16
SHAs pilots x2 SHAs pilots x2
Identify areas with upfront investment to save later
Release of NHSOperating plan

Examples of barriers to change to be removed
Workforce • Facilitate workforce mobility (e.g. geographic, setting )• Align workforce plans/forecasts with new context• Relax national central negotiation and planning
McKinsey & Company 94
Working D
raft -Last Modified 18/03/2009 15:41:52
Printed 18/03/2009 15:36:55
|
Reconfiguration processes
• Limit or remove mandatory staffing ratios e.g. 1:28 midwife staffing ratio, when some centres achieve 1:40 and high quality
• Mandatory GP led centres without ensuring full utilisation• Mandatory single tariffs across settings
• Focus consultation on services not on buildings • Simplify consultation process• Support SHAs/ PCTs to manage resistance to
reconfiguration
Performance management
• Need for a clear “failure regime” for providers who are consistently failing clinically and/or financially
• Relax “excessive” focus on some targets e.g. waiting times
Mandatory initiatives
Productivity Unit should prioritise the barriers to tackle first and develop action plans
M&A/ consolidation
• Clarify how the competition framework regime would work• Set up the “right” incentives for M&A/consolidations e.g. FTs

Examples of tools/methodologies that could be developed nationally or at SHA to support the delivery Acute setting dashboard: Version 1 - Can do now with nationally available data
McKinsey & Company 95
Working D
raft -Last Modified 18/03/2009 15:41:52
Printed 18/03/2009 15:36:55
|
▪ DOSA, %
▪ % seen within 4 hours
▪ Weighted LOS▪ % bed days >14▪ % HRG beyond trim
point▪ Bed utilisation (%)▪ DNA and cancellation
▪ DNA and cancellations
▪ DNA, cancellations▪ New to follow-up ratio
▪ Staff satisfaction Turnover Agency + Bank costs(%) Nurse grade mix ▪ Trainee WTEs/Consultant WTEs
▪ 28 day re admissions rate Safety and error rate Mortality (index v 100) SMR
▪ MRSA Infection rate Patient satisfaction/complaints C. Diff Infection rate
▪ FCEs/surgeon (TBD ?)
▪ Outpatient appointments/Clinical WTE (TBD ?)
Prod
uctiv
ityO
ther
KPI
s
Quality
Finance
Access
Externalsystems
Staff
Overallproductivity
Patient Flow
OutpatientTheatreWardA&E Diagnostics
▪ 18 weeks▪ 2 weeks cancer target
£SOURCE: Team analysis
Overhead
▪ Income or EBITDA/WTE R&D income/total income▪ ROCE MPET income/total income
▪ Medical secretaries/ consultant
▪ Clinical coordinators/ 1,000 Ops
▪ Finance staff/ total staff
▪ HR staff/total staff
▪ IT staff/total staff
51-75th percentile
Bottom quartile
26-50th percentile
Top quartile

McKinsey & Company 96
Working D
raft -Last Modified 18/03/2009 15:41:52
Printed 18/03/2009 15:36:55
|
Productivity Unit potential team and how it could evolve over time
Central Productivity Unit Team
Central Productivity Unit Team
Finance
▪ Led implementation e.g. allocativeefficiency
Key rolesPlanning Programme
design
▪ Size funding gap under different scenarios
▪ Set & cascade targets
▪ Review SHAs level of ambition
▪ Track performance against targets
▪ Review targets▪ Identify
financial risks
▪ Define content of the IBP
▪ Review and challenge the SHAs IBP
▪ Complete analytics and problem solve– Prioritise
national barriers, support and initiatives
– Develop actions plans
▪ Overall programme
Finance& Performance
National support programmes
National initiatives
▪ Spread best practices and key lessons
▪ Led implementation e.g. Supply Chain
Knowledge sharing
Resources 8-10 WTEs ▪ 3-4 WTEs ▪ 1-2 WTEs12-16 sub-teams with 2-3 WTEs
8-10 WTEs 30-45 WTEs
First 1First 1--3 months3 months Beyond 4 monthsBeyond 4 months

Each SHA will design its programme delivery structure/governance considering the local opportunities and skills/resources available
McKinsey & Company 97
Working D
raft -Last Modified 18/03/2009 15:41:52
Printed 18/03/2009 15:36:55
|
NON EXHAUSTIVE
SHA-level dedicated team with or without external support
Individual PCT or provider dedicated team with or without external support
Embedded in current targets/responsibilities
Potential options
When most appropriate?
▪ Economies of scale – not economical to replicate for individual PCTs
▪ Implementation requires cross-PCTs or cross-providers collaboration
▪ Opportunity is PCT and provider specific i.e. design or implementation is local
▪ Somehow new or not typically part of the business as usual
▪ Opportunity is part of the business as usual of the PCT/provider
▪ Type of opportunity
Potential spectrum of options for SHA programme delivery structure
▪ Opportunity requires building new or specialised skills
▪ Economies of scale
▪ Capturing opportunity requires skills that should be core to PCTs/providers competencies but – Have not been built
before/ are new– Not successful before
▪ Capturing opportunities requires skills that are within current job description skills/experience
▪ Skills/experience
▪ Collaborative ‘hubs’ ▪ Service reconfigurations▪ PFI renegotiation
▪ Reducing variability in referrals or prescribing practice
▪ Estates optimisation
▪ Conduct utilisation reviews ▪ Optimising theatre utilisation
▪ Examples

McKinsey & Company 98
Working D
raft -Last Modified 18/03/2009 15:41:52
Printed 18/03/2009 15:36:55
|
SHAsSHAs
Central Productivity Unit
How the governance of the programme between the Central Productivity Unit and the SHA could work
Set targets
Productivity unit key roles
Monitor/track performance
Develop policies/ methodologies
Remove barriers/ enable change
Potential governance
▪ Quarterly Steering Committee to discuss performance/progress– 2-3 representatives of DH Board – 2-3 representatives of the SHA board– 1-2 representatives of the Central and SHA Productivity Units
▪ Identify jointly root causes of under- delivery and jointly agree corrective actions plans and support from Productivity Unitl
▪ Led by Productivity Unit team who will engage SHAs ad hoc to: – Prioritise areas to develop/address first– Input on drafts of policies/methodologies
▪ Led by the Productivity Unit who will engage SHAs ad hoc to– Prioritise barriers to remove first/ enablers to put in place– Discuss most appropriate actions to remove barriers
▪ Productivity unit sets overall level of ambition by SHA and set financial envelop
▪ Each SHA develops a business plan detailing opportunities, expected size of the opportunity and required resources
▪ Productivity unit and SHAs discuss and agree final targets and resources
SHAs
Governance of DH/ SHArelationship for NHS World Class Productivity programme?
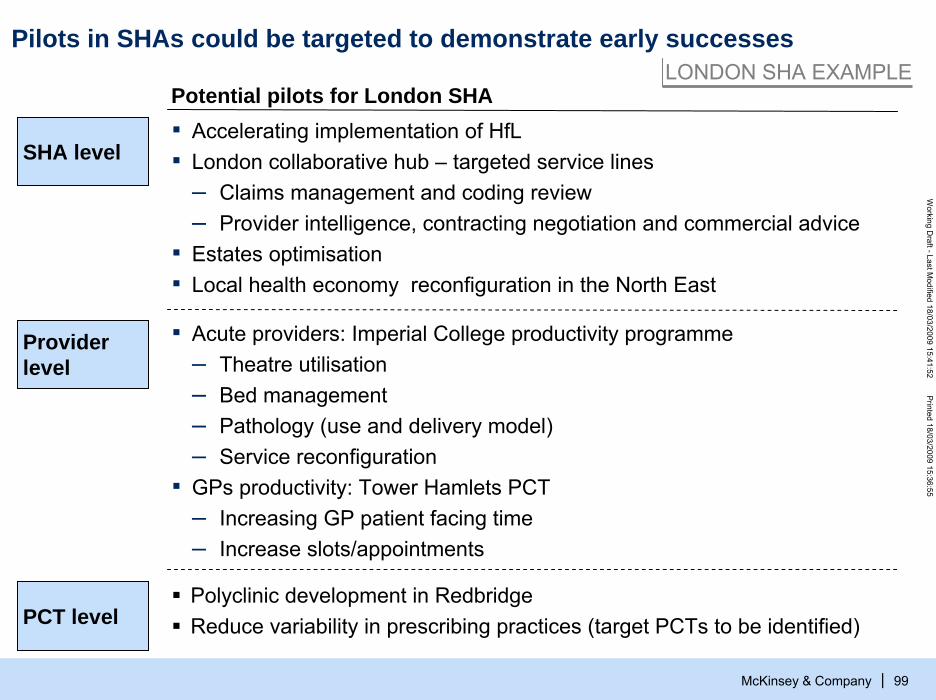
Pilots in SHAs could be targeted to demonstrate early successes
McKinsey & Company 99
Working D
raft -Last Modified 18/03/2009 15:41:52
Printed 18/03/2009 15:36:55
|
Provider level
SHA level
LONDON SHA EXAMPLE
▪ Acute providers: Imperial College productivity programme– Theatre utilisation– Bed management– Pathology (use and delivery model)– Service reconfiguration
▪ GPs productivity: Tower Hamlets PCT– Increasing GP patient facing time– Increase slots/appointments
PCT levelPolyclinic development in RedbridgeReduce variability in prescribing practices (target PCTs to be identified)
▪ Accelerating implementation of HfL▪ London collaborative hub – targeted service lines
– Claims management and coding review– Provider intelligence, contracting negotiation and commercial advice
▪ Estates optimisation▪ Local health economy reconfiguration in the North East
Potential pilots for London SHA

What does this mean for an average PCT?
McKinsey & Company 100
Working D
raft -Last Modified 18/03/2009 15:41:52
Printed 18/03/2009 15:36:55
|
▪ Review of PCT strategy to identify and incorporate opportunities for productivity improvements whilst still maintaining strategic direction
▪ Renegotiation of GP and provider arm contracts to drive down unit costs of non-tariff providers
▪ Support providers in restructuring in response to tariff reduction▪ Active performance and contract management to ensure productivity
and quality targets are being met▪ Evaluation of all clinical pathways to identify non-effective
interventions, and replace in favour of high-impact interventions▪ Comprehensive redesign of care pathways to shift activity to out-of-
hospital settings
Activities
▪ New team created within existing staff with sole focus on implementing productivity improvements
People
▪ Specific training to improve commissioning and negotiating skills▪ Information and data analysis augmented by upgraded management
information systems
Skills

What does this mean for an average Provider?
▪ Review of patient contact time and processes involved in ward rounds and clinics
▪ Recalculation of staffing rotas
Activities
McKinsey & Company 101
Working D
raft -Last Modified 18/03/2009 15:41:52
Printed 18/03/2009 15:36:55
|
▪ Focussed communication and training to underline need for and goals of productivity improvement and implied impact on status quo
▪ Reduction in headcount equivalent to 35 FTEs from a clinical staff of 3001:– 2 Consultants– 1 Registrar– 10 Nurses– 10 Healthcare Assistants– 3 Allied Health Professionals– 8 Non-clinical staff
People
▪ Specific training on change management skills▪ Review of costs and rationalisation of all services to meet new tariffs▪ Information and data analysis augmented by upgraded management
information systems
Skills
1 Based on reduction in headcount proportional to estimated potential for productivity improvement (see methodology) against current staffing ratios from NHS Information Centre Staff Numbers Mar 2008

For each of the 16 identified programmes and geographies, need and type of external support would have to be defined
McKinsey & Company 102
Working D
raft -Last Modified 18/03/2009 15:41:52
Printed 18/03/2009 15:36:55
|
ILLUSTRATIVE
Areas of oppor-tunity
Mech-anisms/ enablers
22 Improve non-acute providers’ productivity
33 Supply chain
44 Estates optimisation
55 Optimising spend within the care pathways
66 Enforcing PCTs contracts/ standards
77 Enhancing self-care and chronic disease management
11 Improve acute providers’ productivity
88 LHE* reconfigurations
1010 Tariffs and reimbursements
1111 GP/ Consultant contracts
1212 Personal budgets and financial incentives
99 Market structure/ management
1313 Commissioning tools and enforcing standards
1414 Workforce
RequiredNot required
External support
SHA 2SHA 10
SHA 1Identify approaches/ develop tools
Draw up actions/ measures
Put re-sources/ enablers in place
Implement action plan
Make goals plausible/ identify specific opportunities
Capture potential
IT1515
Skills/capabilities building1616

McKinsey & Company 103
Working D
raft -Last Modified 18/03/2009 15:41:52
Printed 18/03/2009 15:36:55
|
▪ Potential to tender support to design overall programme
▪ Decide the type of skills required (e.g., management consultants to review strategy and identify opportunities, implementa-tion specialists to drive shop-floor change, IT consultants to deliver enabling IT architectures, health insurers with payment and contracting expertise)
There are different options for the procurement strategy of this external supportTender support for all programmes Tender support by SHA
Tender support by programme /group of programmes
Tender support by programme and SHAor a combination
Programme 2
Programme 1
Programme 15
SHA 2SHA 1 SHA 10. . .
A single provider/consortium
Programme 2
Programme 1
Programme 15
SHA ‘B’SHA ‘A’ SHA 10. . .
Provider/consor-tium 1
Programme 2
.
.
.
Programme 1
Programme 15
SHA 2SHA 1 SHA 10. . .
Provider/consortium 1
Provider/consortium 2
Provider/consortium ‘n’
Programme 2......
Programme 1
Programme 15
SHA ‘B’SHA ‘A’ SHA ‘N’. . .
Provider 1 Provider 2 Provider 3
Provider 4 Provider 5 Provider 6
Provider 7 Provider 8 Provider 10
.
.
.
.
.
.
Provider/consor-tium 2
Provider/consor-tium 10
.
.
.

McKinsey & Company 104
Working D
raft -Last Modified 18/03/2009 15:41:52
Printed 18/03/2009 15:36:55
|
Contents
▪ The challenge and size of the opportunity
▪ Detailing the opportunities
▪ Implications
▪ Making it happen
▪ Examples of successful implementation
▪ Backup:
– Methodology and assumptions
– NHS spend breakdown and forecast assumptions

McKinsey & Company 105
Working D
raft -Last Modified 18/03/2009 15:41:52
Printed 18/03/2009 15:36:55
|
Acute staff productivity
▪ Clinical staff– All acute trusts below the median of FCEs by doctor, nurse and other clinical staff achieve
50%-80% of the potential productivity improvement of stepping up to the median– Clinical costs account for 50% of acute costs
▪ Non-clinical staff– All acute Trusts above the median of non-clinical staff to clinical staff ratio achieve 50%-80%
of the potential productivity improvement of stepping down to the median– Average total earnings of non-clinical staff of 20,000/year
1.5 – 2.4
0.4 – 0.6
9 – 14
7 – 11
Non-acute staff productivity
– Estimate potential productivity improvement by reducing variability in distinct nurses daily visits. Assumes underperformers achieve the median or 10% above the median (based on one PCT)
– Typical potential savings identified in the provisioning of community services in different PCTs
▪ Community services 1b 0.7 – 0.9 11 – 15
Methodology and assumptions – Drive-through cost efficiencies in all providers’ services (1/2)
ESTIMATE
Methodology/assumptionPotential size of opportunity, £b
Implied productivity/ savings, %
1a
1
▪ Mental health providers – All trusts above the median ALOS achieve 50%-80% of the potential improvement of stepping
down to the median ALOS– Reduction of beddays if crisis resolution teams’ effectiveness increase by 10% (TBC)
▪ Primary care providers– 5–10% pf the GPs are very weak performers and 15–25% are weak performers in the number
of appointments offered per week– Weak and very weak GP performers achieve the standard performance– GPs staff costs account for 60% of the total GP practice costs
0.5 – 0.6
0.2 – 0.4
10 – 12
5 – 9
Reduce drug expenditure
1c 0.45 5
0.36 – 0.60 5 – 8
▪ Reduce brand drugs price– Agreed Pharmaceutical Price Regulatory Scheme 2009 (PPRS) includes an overall price
reduction of 5.3% for the next 5 years– No additional price reduction beyond the 2009 PPRS agreement as UK BX prices would be in
line with EU countries with the exception of Spain and Italy (10% higher after PPP1)
▪ Reduce variation in prescribing practices– PCTs can reduce variability in current prescribing costs per age need weighted population– Specifically, assume that PCTs can achieve the median spend or 80% of the bottom quartile
1 Purchase Power Parity

Methodology and assumptions – Drive-through cost efficiencies in all providers’ services (2/2)
McKinsey & Company 106
Working D
raft -Last Modified 18/03/2009 15:41:52
Printed 18/03/2009 15:36:55
|
ESTIMATE
Methodology/assumptionPotential size of opportunity, £b
Implied productivity/ savings, %
1
Reduce drug expenditure (continued)
1c
▪ Outsource hospital drug supply chain– 3 – 5% savings based on the DHL 10-years outsourcing contract which targets 4.5% savings – 50 - 80% of the hospital drug spend is outsourced
0.06 – 0.16 7 – 18
0.08 – 0.11 3 – 4.5
▪ Increase clawback to pharmacies– Clawback is increased from current 9.3% (c £900m) to 10-11% (typical discounts received
currently by pharmacies are c. 10.5% for branded and higher for generics)
▪ Build scale in procurement of hospital drugs– Top 50 Bx drugs: current discounts of 12.3% could be increased by 50–80%– Rest of Bx: current discounts of 9.3% could be increased by 30–40% – Generics: limited scope for increase in discounts as already part of PASA managed contracts
0.04 – 0.10 1.5 – 4
▪ Reduced wholesalers’ revenues– Current wholesalers’ revenues average 8.5% of Bx ex-manufacture price and 10.5% for Gx– UK wholesalers’ revenues are reduced to become closer to Spain (7.6%) and Italy (7.1%)
wholesalers’ revenues
0.06 – 0.11 8 – 14
Supply chain optimisation
▪ Clinical and non clinical supplies, capital expenditure and central budgets– 7-12% cost savings for purchases not under PASA managed contracts– 3-5% costs savings for purchases under PASA managed contracts– 10-15% cost savings of GP supplies purchases; GPs supplies costs account for 10% of the
total GP practice costs
1d 1.1 – 1.9 6 – 11
Estates optimisation
1e ▪ 10–15% potential reduction on estates costs ▪ Estates costs include amortisation, depreciation, capital charges and premises costs but exclude
impairments and loss/gain from sale of assets
0.5 – 0.8 10 – 15
▪ On 80% of the PFI schemes, government can renegotiate interest rates down by 2–3 b.p.▪ PFIs holders need the cash and cannot renegotiate in same conditions as government
Restructuring PFI
1f 0.1 – 0.2 11 – 17
▪ Increase generics penetration– Generics penetration in value grows from 29% in 2007 to 32-33% in 2013 based on the
assumption that penetration continues growing at a pace that is 50-80% that of the last 3 years – Gx prices are on average 80% lower than the originators’ 3 years after their introduction
0.17 – 0.29 1.5 – 2.5
1 Purchase Power Parity

Sources– Drive-through cost efficiencies in all providers' services (1/4)
McKinsey & Company 107
Working D
raft -Last Modified 18/03/2009 15:41:52
Printed 18/03/2009 15:36:55
|
1
Source YearMetric used in calculations Data used
▪ The Information Center for Health and Social Care 2007 – Workforce census ▪ Sept 2007
▪ N. of nurses by acute provider (FTEs) ▪ ~15k▪ N. of other clinical staff by acute provider FTEs) ▪ 80k▪ N. of other non-clinical staff by acute prov. (FTEs) ▪ 280k
▪ N. of doctors by acute provider (FTEs) ▪ 78k
▪ Total staff by acute provider (FTEs) ▪ 375k
Acute staff productivity
1a
▪ Total number of FCEs by acute provider ▪ 14 million ▪ HES online ▪ 2007/08
▪ Average total earnings of non-clinical staff ▪ 20,000 p.a. ▪ Information Center for Health and Social Care 2008 – NHS staff median total earnings/FTE
▪ 2008
▪ % of clinical staff costs over total acute costs ▪ 50% ▪ Stephen Dorgan memo ▪ N.a.
▪ Total acute commissioning costs ▪ £ 33 billion ▪ National Audit Office Summarized Accounts – Care purchased by PCTs
▪ 2007/08
▪ National Audit Office Summarized Accounts – Care purchased by PCTs
▪ 2007/08▪ Community services and others costs ▪ £ 8.4 billion
▪ Assumption based on one PCT Provider Arm ▪ 2007/08▪ % of staff costs over total costs ▪ 75%
▪ Assumption – reduction of variability in DNproductivity; experience in community services
▪ N.a.▪ % of potential staff productivity improvement ▪ 11–15%
▪ Polyclinic model; the Information Center for Health and Social Care 2008; workforce census
▪ 2007▪ % of GPs staff costs over total costs ▪ 60%
▪ Typical practice ▪ N.a.▪ Sessions per week per GP WTE ▪ 7
▪ Data extracts from GP systems – one PCT ▪ 2008▪ GP appointments per sessions per GP ▪ 11–18
▪ The Information Center for Health and Social Care 2007– GPs earnings and expenses enquiry
▪ Tariff inflation 2.5% (07/08) and 2.3% (08/09)
▪ 2006/07▪ Average GP salary ▪ £ 108,000
Non-acute staff productivity
1b
▪ National Audit Office Summarized Accounts – Care purchased by PCTs
▪ 2007/08▪ GMS, PMS, AMPS and PCTMS contract costs ▪ £ 7.2 billionPrimary care services
Community care services
▪ The Information Center for Health and Social Care 2007 - Workforce census
▪ Sept 2007▪ Number of GPs in England ▪ 31,000
1 Weighted average of the growth in spend of branded drugs (6% p.a.) and generics (12% p.a.)

Sources– Drive-through cost efficiencies in all providers' services (2/4)
McKinsey & Company 108
Working D
raft -Last Modified 18/03/2009 15:41:52
Printed 18/03/2009 15:36:55
|
1
Reduce drug expenditure
1cSource YearMetric used in calculations Data used
▪ £7.1bn. ▪ Office of Fair Trade – Annexe D: Financial Flows relevant to medicines Dec. 2007
▪ 2005Reduce brand drug price▪ Total expenditure in branded medicines
▪ 6% p.a. ▪ Office of Fair Trade: PPRS – An OFT study ▪ 2005-07▪ % annual growth in Bx spend 2005-07
▪ Bx price reduction in PPRS for next 5 years ▪ 5.3% ▪ DH - PPRS 2009 ▪ Dec.’08Reduce variation in prescribing practices
▪ £7.5bn. ▪ Laing & Buisson NHS Financial Report ▪ 2007/08▪ Total prescribing costs by PCT▪ 50.5m. ▪ DH Exposition book ▪ 2006/07▪ Age need weighted population by PCT
Increase generics penetration▪ £2.4bn ▪ Office of Fair Trade – Annexe D: Financial
Flows relevant to medicines Dec. 2007▪ 2005▪ Total spend in generics
▪ 12% p.a. ▪ Office of Fair Trade: PPRS – An OFT study ▪ 2005-07▪ % annual growth in Gx spend 2005-07▪ 3.4% p.a. ▪ Espicom ▪ 2004-07▪ Historical growth in generics penetration in value ▪ 80% ▪ Euro Observer 2008 based on 12 molecules ▪ 2008▪ Price gap between originator and Gx product
Increase clawback to pharmacies▪ 9.3% ▪ Office of Fair Trade – Annexe D: Financial
Flows relevant to medicines Dec. 2007▪ 2005▪ Current clawback to pharmacies
▪ £7.5bn.▪ Total spend on medicines in primary care▪ 8% p.a.1▪ Growth on spend on medicines in primary care ▪ Office of Fair Trade: PPRS – An OFT study ▪ 2005-07
Build scale in procurement of hospital drugs▪ 12.3%▪ Current hospital discounts on top 50 Bx drugs▪ 9.3%▪ Current hospital discounts on rest of Bx drugs▪ 2.5bn▪ Total spend in Bx medicines in secondary care
▪ Office of Fair Trade: PPRS – An OFT study ▪ 2008
Outsource hospital drug supply chain▪ DHL outsourcing contract expected savings ▪ 4.5% p.a. ▪ DHL website – Presss release 2006 ▪ 2006
Reduce wholesalers’ revenues▪ 8.5%▪ Current wholesalers' revenues as % of price: Bx ▪ Mckinsey pharmaceutical practice▪ 10.5%▪ Current wholesalers' revenues as % of price: Gx▪ 7.6%▪ Wholesalers' revenues as % of price in Spain▪ 7.1%▪ Wholesalers' revenues as % of price in Italy
▪ 9.3%
▪ Regulated margins from manufacturers▪ Regulated margins from manufacturers
▪ 2008▪ 2008

Sources – Drive-through cost efficiencies in all providers' services (3/4)
McKinsey & Company 109
Working D
raft -Last Modified 18/03/2009 15:41:52
Printed 18/03/2009 15:36:55
|
1
Source YearMetric used in calculations Data used
▪ National Audit Office Summarized Accounts ▪ 2007/08
▪ Clinical and non clinical supplies1 – FTs ▪ £2.1bn
▪ Assumption - 10% savings already captured ▪ N.a.▪ % of potential costs savings for PASA managed contracts ▪ 3-5%
Supply chain optimisation
1d
▪ Clinical and non clinical supplies1 – NHS Trusts
▪ Clinical and non clinical supplies1 – PCTs
▪ PASA total value of contracts managed
▪ % of PASA managed contracts related to drugs
▪ £4.4bn
▪ £1.7bn
▪ £4.6bn ▪ NHS Purchasing and Supply Agency –Annual report and Accounts 2006/07
▪ 2007/08
▪ 40% ▪ Assumption ▪ N.a.
▪ Assumption ▪ N.a.▪ % potential costs savings for non PASA managed contracts▪ 7-12%
▪ National Audit Office Summarized Accounts – Care purchased by PCTs
▪ 2007/08▪ GMS, PMS, AMPS and PCTMS contract costs ▪ £ 7.2bn
▪ Assumptions – based on typical GP practice ▪ N.a.▪ % of supplies costs as % of total GPs contract costs ▪ 10%
▪ DH – Departmental report 2008 ▪ 2008/09▪ Capital investment ▪ £4.9bn
PCTs – NHS Trusts - OPEX
Primary care - OPEX
CAPEX
▪ NHS Information Centre – Estates Returns Information Collection 2007/08
▪ 2007/08▪ £0.5bn
▪ £0.6bn
▪ £2.3bn
▪ Estates costs – PCTs
▪ Estates costs – Trusts
▪ Estates costs – Mental health and community services3
▪ Space utilisation – PCT sq.m./WTE ▪ 17.1 ▪ National Audit Office – Improving the efficiency of central government’s office property
▪ 2007
Estates optimisation
1e
▪ Assumption based on previous experiences ▪ N.a.▪ % of potential costs savings on CAPEX procurement ▪ 10-15%▪ DH – Departmental report 2008, assumptions ▪ 2008/09▪ Central budgets – non pay2 ▪ £3.4bn
▪ Space utilisation – Providers sq.m./bed ▪ 61.4 ▪ NHS Information Centre – Estates Returns Information Collection 2007/08 – top quartile
▪ 2007/08
▪ Total risk-adjusted backlog ▪ Var. ▪ NHS Information Centre – Estates Returns Information Collection 2007/08
▪ 2007/08
1 Includes supplies and services (general and clinical), consultancy services, auditors fees and other 2 Includes training, R&D, ALB, Contingency, Ophthalmology, DH admi., Welfare Foods and others. Excludes NHS Litigations, CfH, EEA Medical
Costs, Pharmacy, Vaccines and Pandemic Flu

Sources – Drive-through cost efficiencies in all providers' services (4/4)
1
Source YearMetric used in calculations Data used
▪ Average 2009-2013 annual unitary payments for PFIsRestructuring PFI
1f
▪ Potential reduction in interest rates
▪ Treasury – Signed PFI schemes▪ £1.2bn
▪ 2-3 b.p. ▪ Assumption – based on interest rates trend
▪ Nov’08
▪ N.a.▪ % of PFI schemes renegotiated ▪ 80% ▪ Assumption▪ N.a.
McKinsey & Company 110
Working D
raft -Last Modified 18/03/2009 15:41:52
Printed 18/03/2009 15:36:55
|1 Includes supplies and services (general and clinical), consultancy services, auditors fees and other 2 Includes training, R&D, ALB, Contingency, Ophthalmology, DH admi., Welfare Foods and others. Excludes NHS Litigations, CfH, EEA Medical
Costs, Pharmacy, Vaccines and Pandemic Flu

McKinsey & Company 111
Working D
raft -Last Modified 18/03/2009 15:41:52
Printed 18/03/2009 15:36:55
|
Stop/reduce procedures with no/limited clinical benefit
▪ EL procedures– Use London Healthcare Observatory (LHO) and the Chief Medical Officer report 2007
to identify the HRGs&OPCS with no/limited clinical benefit– Apply the LHO percentages of potential minimum and maximum reduction for those
HRGs/OPCS to England overall activity and costs, assuming that only 80% of the maximum potential could be achieved
0.3–0.7 3–7
Target most costs effective interventions
▪ 10–12% of PCTs commissioning spend can be optimised by reallocating to interventions that are 3 times more cost-effective
▪ PCT spend impacted £c38m. – includes spend in GPs, community services, acute care (except NEL and A&E) and mental health care
2b 2.8–3.3 7–9
Methodology and assumptions – Optimise spend and ensure compliance with commissioners’ standards
ESTIMATE
Methodology/assumptionPotential size of opportunity, £b
Implied productivity/ savings, %
2a
2
▪ New OP attendances– PCT estimated savings of 14–22% of new OP attendances through reducing the variability
in GP referrals for new OP (SAR1) – assumed underperformers GPs achieve the median or 80% of the potential improvement of stepping down to bottom quartile
– Apply the 14–22% identified opportunity to England total spend in new OP attendances
0.2–0.4 14–22
▪ OP follow-up attendances– Underperforming acute hospitals achieve the median FU/new OP ratio or 80% of the
potential improvement of stepping down to the bottom quartile ratio
0.2–0.3 9–13
▪ Diagnostics– 10–16% potential reduction in direct access diagnostics (DAD)– £~10m spend in DAD per PCT (???)
0.1–0.2 10–16
Conduct utilisation reviews
2c ▪ 2–3% potential savings on current PCT commissioning spend (c70b) based on experience in Germany and US where savings of 3–5% have been achieved at the end of a 2-year programme
1.5–2.0 2–3
1 Adjusted standardized activity ratio

Sources – Optimise spend and ensure compliance with commissioners’ standards
McKinsey & Company 112
Working D
raft -Last Modified 18/03/2009 15:41:52
Printed 18/03/2009 15:36:55
|
2
Source YearMetric used in calculations Data used
Stop/reduce procedures with no/limited clinical benefit
2a
Target most cost-effective interventions
2b
Conduct utilisation reviews
2c
▪ HES online
▪ HES online
▪ National schedule of reference costs ▪ Tariff uplift
▪ 2006/07
▪ 2006/07
▪ 2006/07▪ 2007/08
▪ Total follow-up OP attendances by specialty and by acute trust
▪ Total new OP attendances by specially and by acute trust
▪ Follow-up OP average price
▪ 29m attendances
▪ 13m attendances
▪ £79/attendance
Follow- up OP attendances
Diagnostics▪ Department of Health Diagnostic Waiting
List Returns; DH Exposition book▪ 07/08▪ Diagnostics per weighted population ▪ Varies by
diagnostic test
▪ HES online
▪ HES online
▪ LHO – Save to invest: Developing criteria-based commissioning for planned healthcare in London
▪ 2006/07
▪ 2006/07
▪ 2007
▪ Activity for each of the 34 HRG and OPCS identified by LHO
▪ Commissioning costs for each of the 34 HRG and OPCS identified by LHO
▪ % of potential minimum and maximum reduction through decommissioning of limited/no clinical benefit activity
▪ 1.1m spells
▪ £2.1bn.
▪ Varies by HRGand OPCS
EL procedures
New OP attendances▪ HES online ▪ DH payment by results tariff▪ Tariff uplift – DH
▪ 2006/07▪ 2006/07▪ 2007/08
▪ Total commissioning spend in new OP attendances
▪ £1.7bn
▪ National Audit Office NHS Summarised Accounts
▪ Assumption▪ Assumption based on CHD pathway
analysis
▪ 2007/08
▪ n/a▪ 2008
▪ Total commissioning spend for which allocation could be optimised1
▪ % of PCT spend that can be optimised▪ Difference between procedures most cost
effective and less cost effective
▪ £38bn.
▪ 10–12%▪ 3 times
▪ National Audit Office NHS Summarised Accounts
▪ Assumption based on U.S. and Germany experiences (3–5%)
▪ 2007/08
▪ n/a
▪ Total PCT commissioning spend, excluding prescribing costs
▪ % potential reduction in spend
▪ £63b
▪ 2–3%
1 Includes spend on GPs, community services, acute care (except NEL and A&E) and mental health

McKinsey & Company 113
Working D
raft -Last Modified 18/03/2009 15:41:52
Printed 18/03/2009 15:36:55
|
Enhance self care and management of people with LTCs and complex needs
▪ Calculate current direct costs to the NHS of CVD, diabetes, cancer, asthma and COPD
▪ Assume current costs of LTCs are reduced by the achievement of the productivity improvement opportunities identified in 1 and 2
▪ Use U.S. and German experience in savings achieved in LTCs using more self care and disease management programmes (20%) as a reference of potential in England
1.9 – 2..5 10 – 13%
Methodology and assumptions – Optimise spend and ensure compliance with commissioners’ standards
ESTIMATE
Methodology/assumption
Potential size of opportunity£bn
Implied productivity/ savings, %
2
▪ Unscheduled care– Calculate current spend in A&E and Non Elective assuming that
productivity improvement identified in 1 and 2 have been achieved– A&E attendances – clinical evidence on % of minor, standard and
major attendances that can be provided in alternative settings indicates potential savings of 20 – 40%.
– Avoided NEL admission avoided based on clinical evidence and experience of some PCTs reconfiguring unscheduled care
– Cost of reprovision: – costs of reprovision typically equivalent to 35% of the potential savings based on bottom-up costing of the required alternative services e.g. UCC, CAU
– Only 80% of the maximum potential is achieved
0.3 – 0.5 20 – 32%Shift care to lower care settings
3b
3a
0.7 – 1.2 5 – 8%
( 0.4 – 0.6) n/a
▪ OP, day care and diagnostics to polyclinics/ GP surgeries– Calculate current spend assuming that productivity improvements identified
in 1 and 2 have been achieved– Clinical evidence on % of potential OP, day cases and simple diagnostics
that can be shifted to primary/community/home care settings– Use-bottom-up costing of providing the care in primary/community/home
setting of a specific business case – conservative modelling– Assume 80% of the maximum potential is achieved
0.2 – 0.6 2 – 7%

Methodology and assumptions – Prevent people from becoming ill through increased prevention
McKinsey & Company 114
Working D
raft -Last Modified 18/03/2009 15:41:52
Printed 18/03/2009 15:36:55
|
4
Smoking
Assumptions Source
▪ www.ic.nhs.uk• Based on 11m current smokers with an average cost to the NHS of £150 per smoker per year and a one-time off cost per quitter of £173
• Assumes 30% reduction in number of smokers and reduction of health burden by 50% per quitter
• Benefit will accrue over many years but the calculation of net benefit cost of intervention is assumed to be spread over 5 years.
Obesity
▪ Based on 2015 additional costs of obesity in case of no additional intervention is taken
▪ Assumes DH undertakes announced pledge to return to 2000 levels of obesity by 2020 with an initial an investment of c.£370m over 3 years.
▪ 2007 Foresight Tackling Obesities: Future Choices Report
Alcohol
▪ Currently the total cost to NHS of alcohol misuse is £2.7bn ▪ £1 invested in tackling alcohol misuse saves £1.30-£1.70
in health service cost▪ Assumes £0.5bn investment in tackling alcohol misuse of
▪ DH website▪ U.K. alcohol treatment Trial (BMJ)
Flu vaccination
▪ Increasing vaccination rates within at-risk groups in the UK from current level of 45-75% (DH website) assumed to be close to cost neutral
▪ Mullolly et al study (Kaiser Permanente Center for Health Research) which showed that for the elderly population overall the net saving per person were $1.10
Breastfeeding
▪ Impact extrapolated from the US to UK assuming– Both countries have similar starting positions – Proportional to population sizes
▪ Assumes cost of implementation campaign to be 20%
▪ US Dept of Agriculture Food Assistance and Nutrition Report no 13 founds that $3.6bn could be saved by increasing US breastfeeding

Assumptions used to estimate the percentage of savings by national/central levers
McKinsey & Company 115
Working D
raft -Last Modified 18/03/2009 15:41:52
Printed 18/03/2009 15:36:55
|
% of acute trust income based on tariff
Assumes centrally providers force to use PASA vs. today optional policy
Assumes productivity can be driven by GP contracts
Assumes centrally providers force to use PASA vs. today optional policy
Part compliance part central policies, e.g., allowing pharmacist to substitute
McKinsey & Company 116
Working D
raft -Last Modified 18/03/2009 15:41:52
Printed 18/03/2009 15:36:55
|
Contents
▪ The challenge and size of the opportunity
▪ Detailing the opportunities
▪ Implications
▪ Making it happen
▪ Examples of successful implementation
▪ Backup
– Methodology and assumptions
– NHS spend breakdown and forecast assumptions

NHS resources 2008–09
McKinsey & Company 117
Working D
raft -Last Modified 18/03/2009 15:41:52
Printed 18/03/2009 15:36:55
|
NHS revenue settlement Total NHS capital
13.1
Centrally managed budgets
78.0
PCT allocations*
1.4
SHA
92.5
Total NHS revenue
2.7
NHS trust and FT
0.8
PCT allocations
1.4
Central budgets
4.9
Total NHS capital
£bn
* Includes initial loans limits (£74.2b), direct allocations (£1.7b) and density (£2.1b)Source: Department of Health – Departmental report 2008

Breakdown of the centrally managed budgets – Revenues 2008/09
McKinsey & Company 118
Working D
raft -Last Modified 18/03/2009 15:41:52
Printed 18/03/2009 15:36:55
|
4.5
Training
1.2
NHS litigation authority
1.2
Con-necting for health
0.8
R&D
0.8
EEAmedical costs
0.8
ALB
0.7
Phar-macy
3.1
Others*
13.1
Total NHS revenue
£bn
* Includes contingency (£0.4b), ophthalmology (£0.4b), substance misuse (£0.4b), Vaccines (£0.3b), DH administration (£0.3b), welfare foods (£0.2b), pandemic flu (£0.1b) and others (£1.1b)
Source: Department of Health – Departmental report 2008

Breakdown of PCTs revenues allocations 2007/08
McKinsey & Company 119
Working D
raft -Last Modified 18/03/2009 15:41:52
Printed 18/03/2009 15:36:55
|
GPs contract
2.4
Dental services
0.4
Other primary care
30.2
Other secondary care
2.0
A&E
1.7
Maternity
1.8
Community health care services
6.3
Mental health and LD
9.6
General and acute secondary care
PCTs non commissioned health care costs
75.9
Total PCTs revenue
9.1
Prescribing and pharma-ceuticalservices
7.2
5.2 (TBC)
£bn
Total primary care – £19.1b Total secondary care – £51.6b
Source: National audit office, NHS summarized account 2007/08

Breakdown of the forecast increase in NHS spend
McKinsey & Company 120
Working D
raft -Last Modified 18/03/2009 15:41:52
Printed 18/03/2009 15:36:55
|
52,6
39,8
65,5
50,5
2013/14 NHS spend forecast at current level of efficiencies
0.7 0.51.2
92.4
2008/09 NHS spend
7.06.9
13.9
Growth dueto inflation only
3.25.38.5
Growth due to activity only
116.0
Growth due to mix impact of inflation and activity
Non-pay
Pay
CAGR 2009/10–2013/14%
Pay 9.5%
Non-Pay 4.8%
Total
2.5%
3.3%
2.8%
2.0%
1.5%
1.8% 4.6%
ESTIMATE
£bn
–
–
–

Key assumptions on activity, inflation and mix of pay and non-pay to develop NHS spend forecastCommissioning spend, PCTs budget
McKinsey & Company 121
Working D
raft -Last Modified 18/03/2009 15:41:52
Printed 18/03/2009 15:36:55
|
Current spend2007/08, £b
% pay vs. total costs
% Inflation rate p.a.
% activity growth p.a.
▪ GMS, PMS, APMS, and PCTMS 2.5 3.0▪ Prescribing costs 5.5 0.5
▪ Pharmaceutical services 5.5 0.5
▪ New pharmacy contract 2.5 0.5
▪ Contractor led GDS and PDS 2.5 3.0
▪ General Ophthalmology services 2.5 0.5
▪ Learning disabilities 2.5 2.1
▪ Mental illness 2.5 2.1
▪ Acute services 2.5 1.9
▪ A&E 2.5 1.9
▪ Community services 2.5 3.0
▪ Other
7.17.6
1.2
0.3
2.3
0.4
2.4
7.2
33.7
1.7
6.3
11.0 2.5 1.9
2008/09–(2013–14) forecast
0
0
65
65
6565
65
60
65
65
65
65
Total 79.4 58 2.9 2.0
SOURCE: National Audit Office of Annual Accounts; HES historical data 2003–07; McKinsey analysis

Key assumptions on activity, inflation and mix of pay and non-pay to develop NHS spend forecast (CONTINUED)
Central budgets
McKinsey & Company 122
Working D
raft -Last Modified 18/03/2009 15:41:52
Printed 18/03/2009 15:36:55
|
0.52.54.5▪ Training0.52.51.2▪ NHS litigations 0.52.51.2▪ CfH0.52.50.8▪ R&D0.52.50.8▪ EEA medical costs0.52.50.8▪ ALB0.55.50.7▪ Pharmacy0.52.50.4▪ Contingency0.52.50.4▪ Ophthalmology0.52.50.4▪ Substances misuse0.52.50.3▪ Vaccines
02.50.3▪ DH Administration0.52.50.2▪ Welfare foods0.55.50.1▪ Pandemic flu 0
0
0
00
2550
65
5065
65
8065
75
65
0.52.5▪ Others 1.013.1 52 2.8 0.5
Current spend£b
% pay vs. total costs
% Inflation rate p.a.
% activity growth p.a.
2008/09–(2013–14) forecast
Total