In China’s Wake: Has Asia Gained from China’s Growth? · IN CHINA’S WAKE: HAS ASIA GAINED...
28
ECONOMICS IN CHINA’S WAKE: HAS ASIA GAINED FROM CHINA’S GROWTH? by Peter E Robertson Business School The University of Western Australia and Jessica Y Xu Australian Government The Treasury DISCUSSION PAPER 10.15
Transcript of In China’s Wake: Has Asia Gained from China’s Growth? · IN CHINA’S WAKE: HAS ASIA GAINED...
ECONOMICS
IN CHINA’S WAKE: HAS ASIA GAINED FROM CHINA’S GROWTH?
by
Peter E Robertson Business School
The University of Western Australia
and
Jessica Y Xu Australian Government
The Treasury
DISCUSSION PAPER 10.15
IN CHINA’S WAKE:
HAS ASIA GAINED FROM CHINA’S GROWTH?
Peter E. Robertson* The University of Western Australia
Jessica Y. Xu Australian Government
The Treasury
June 2010 China’s growth has been rapid but the value of China's international trade has grown even faster.
This trade-biased growth is bringing both challenges and opportunities for Asian economies that are
highly integrated with Chinese trade networks. Moreover in ASEAN countries such as Indonesia
and Malaysia, China’s success has been seen as a threat to its existing trade and manufacturing base.
We use an historical simulation analysis to examine the impacts of China’s growth on Asian
economies. We find that a decade of China’s growth has raised GDP per capita in the developed
Asian economies by around 16%. The effect on the ASEAN-4 economies is not as strong but still
large, the GDP of the ASEAN-4 economies increased by approximately 7%. The main source of
these gains is found to be lower durable goods import costs which induce accumulation of
machinery and equipment capital.
Keywords: Economic Growth, China, Trade Costs.
JEL: O4, O1, F11, F43
* Corresponding author: Peter E. Robertson, Economics, School of Business, University of Western Australia, Perth.
Email: [email protected]. Funding from AusAID ADRA Grant RA/1/818/7 is gratefully acknowledged. The
views expressed here are those of the authors and do not necessarily reflect those of the Australian Treasury, and are not
related to the work of the author at the Treasury.

1
1. Introduction
In thinking about the impacts of China’s growth on the world economy, two facts stand out. First,
China’s growth is an exceptionally high rate of growth – on par with the highest growth rates
attained by Japan in the 1960s and the Newly Industrialised Economies (NIEs) of South Korea,
Taiwan, Singapore and Hong Kong in the 1970s. Second, China’s growth has been extremely
biased. Though GDP has increased by around 100% between 1995 and 2005, China's international
trade flows have far outstripped its GDP growth. Over the same period for example exports relative
to GDP grew by 62 percent (World Bank 2010). 1
But these two facts, China’s high rate of GDP growth and even faster export growth, are not
necessarily sufficient to guarantee that China is having a dramatic impact on the global economy.
Standard trade models suggest that this depends on a countries ability to affect world prices which in
turn depends upon the bias in the pattern of growth and how this affects world relative supplies.2
They also suggest that the effects of China’s growth on other countries may be positive or negative
depending on the similarity of their trade patterns. Thus there is considerable concern among the
developing Asian economies, such as the ASEAN group, that China’s growth is having a
detrimental effect on their terms of trade (Coxhead 2007).
There is, however, very little analytical work that attempts to relate China’s growth to its trade flows
and to the economic impacts on China’s trading partners. Much of the work that does exist moreover
is based on gravity models. These look at the effects of one countries trade flows on another
countries trade flows, but do not tell us how this impacts on important economic outcomes such as
wages, incomes and inequality.
The aim of this paper therefore is to undertake a quantitative assessment of the broad stylized facts
regarding China's growth and trade bias focusing in particular on their impacts on the developed
Asian economies of Japan and the NIEs, and the ASEAN-4 economies of Malaysia, Indonesia,
Thailand and Philippines.
To do this we use a calibrated open economy growth model of the Chinese and the regional Asian
1 See Amiti and Freund (2008) for a recent discussion of China’s export growth and characteristics. 2For example, in the Heckscher-Ohlin trade model, growth in one country will have no impact on the rest of the world,
irrespective of how large the country is or how fast the growth rate is, unless it is biased towards one sector.
2
economies. The model incorporates inter-temporal optimization with respect to physical and human
capital accumulation, and consumption decisions. It also incorporates multiple traded and non-
traded sectors. This multi-sector approach is crucial as the effects of China’s growth on other
countries will be mediated through changes in trade – specifically the terms of trade. These trade-
growth linkages that we wish to explore can only be analysed in a multi-sector model.
We limit our attention to comparative steady state analysis of the long run effects of China’s growth.
The model is solved with exogenous productivity parameters, including traded sector specific
productivity growth, in order to reproduce the stylized facts of China's growth and trade bias.
Specifically, the exogenous productivity growth has the interpretation of sector specific falling trade
costs. This solution is compared with a counterfactual benchmark where China’s per capita growth
is only growing at the world average of around 2% per year.
The simulations show that trade biased growth has a large impact on both the developed Asian and
ASEAN-4 economies. A decade of China’s growth is found to have increased GDP per capita in the
developed Asian economies by about 17%. The impact on the ASEAN-4 economies is also large at
7%. Both values represent a significant contribution to regional growth. The contribution of China’s
growth to Japan and the NIEs is truly remarkable, being equivalent to 1.5 percentage points of
growth per year over a decade.
The remainder paper is organized as follows. Section 2 establishes some stylized facts regarding
China's growth patterns and its integration with the Asian region. Section 3 describes the model
structure. Section 4 discusses the experiment designs and the results are reported in Section 5.
Section 6 concludes by summarizing the main findings.
2. China’s Growth and Integration with Asia
2.1 Growth in China
The structure of China’s economy has changed profoundly since the implementation of a
comprehensive set of economic reforms to liberalise and open its economy to foreign trade in 1978.
It has shifted from an agriculture based economy to an economy with a massive industrial sector and
a large services sector. According to Bosworth and Collins (2008), over the period 1979 to 1995,
China grew at 6.4% per year but in the decade 1995 to 2005 the growth rate accelerated to 8.9% per
year. China is now the world’s third largest economy when its output is measured at the market
3
exchange rates and accounts for over 7% of the global trade flows.
Though it is widely believed that growth in China will have large economic impacts on its trading
partners, trade theory tells us that the impacts are ambiguous and may be completely neutral.
Specifically, in a Heckscher-Ohlin model, growth that increases the output of all sectors at the same
rate, will have no impact on the terms of trade, and hence no impact on other countries.
It is important therefore that, as noted above, China’s export sector grew much faster than GDP with
the exports to GDP ratio rising by 59% over the decade 1995 to 2005 (Harris et al. 2010). Moreover,
the composition of China’s exports has diversified away from light manufacturing commodities
towards capital- and skill-intensive products. The exports of China were mainly concentrated on
labour intensive products in the early 1990s but since then a growing proportion of exports has
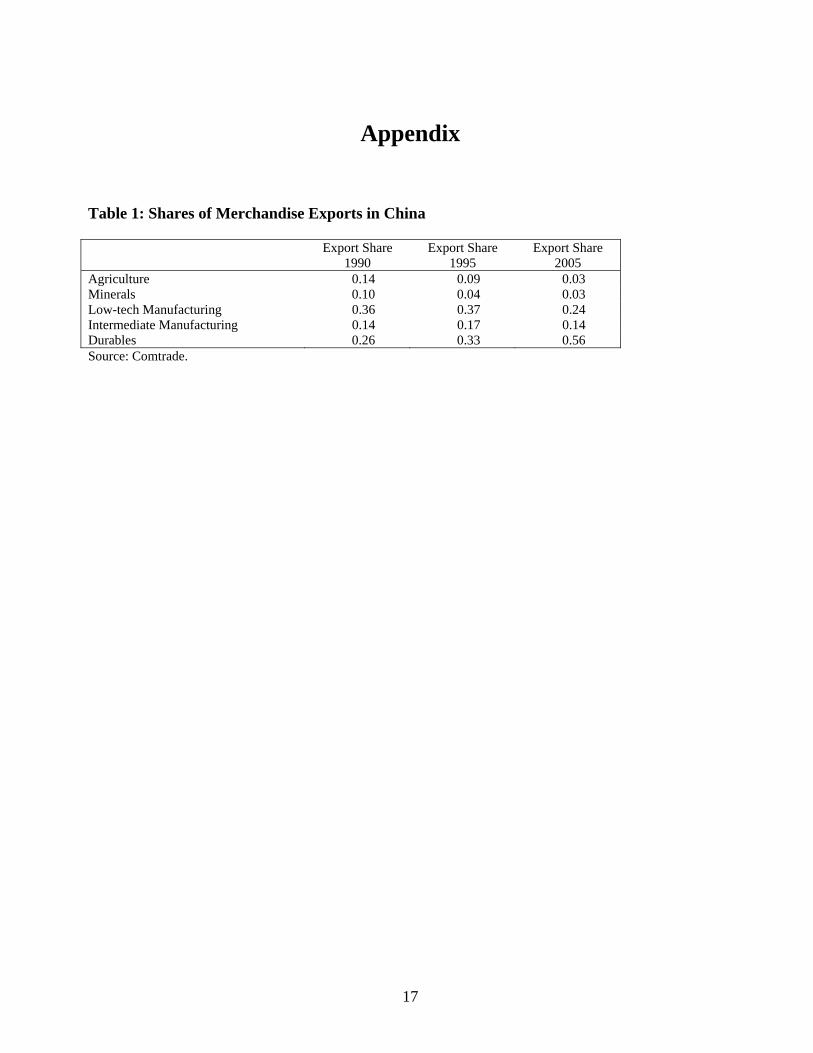
become more capital- and skill-intensive. This is shown in Table 1 which reports the changes in
China’s export bundle over time. It shows that, between 1990 and 2005, the share of durables goods
more than doubled whereas the shares of all other sectors declined. As emphasized by Schott (2006),
Rodrik (2006), and Amiti and Freund (2008), China's export bundle has become increasingly
sophisticated.
[Table 1 about here]
Part of this expansion for both the changing level and pattern of trade is likely to be due to falling
trade barriers. Rumbaugh and Blancher (2004) report that the average (unweighted) tariff rates in
China fell from 55.6% in 1982 to 12.3% in 2002. At the same time, the Chinese government has
also reduced the non-tariff barriers and introduced special privileges for export processing firms
including all foreign owned and jointly owned firms.
Nevertheless, the exceptionally strong growth in the durables sector points to some form of sector
specific, or export specific, technological change. Indeed, there is some evidence that productivity
growth has been higher in the export sectors (Perkins 1997; Amighini 2005). One possible source of
this is the falling trade costs and the rise of global fragmentation of the production process which
has been pronounced in the Asian region (Athukorala 2009; Branstetter and Lardy 2006).
Unfortunately, as noted by Anderson and van Wincoop (2004), the evidence on how trade costs
have fallen over time and the relationship to global fragmentation is very limited. According to
Branstetter and Lardy (2006) and Lardy (2003), foreign investment has been largest in the durable
goods sector, suggesting that international technology spillovers have been important.
4
2.2 Regional Integration
The impacts of China’s growth on other countries depend on the strength of their international trade
linkages. Since we are concerned with historical Chinese growth between 1995 and 2005, the
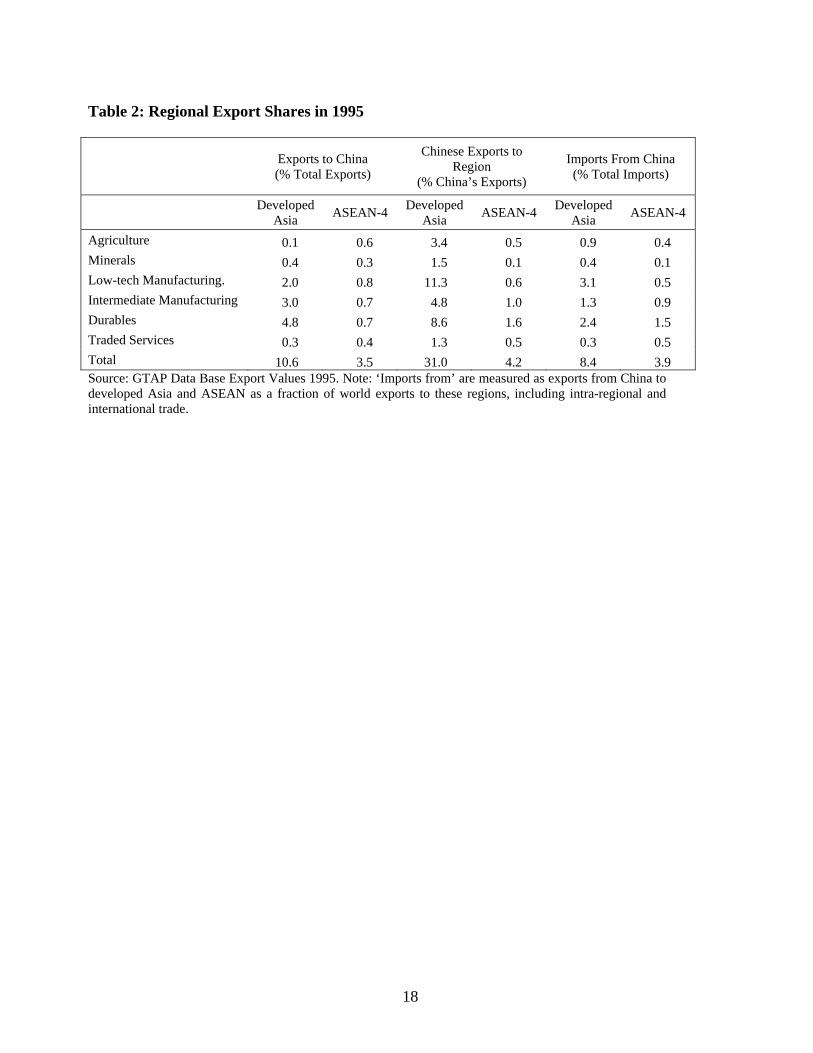
relevant measures of integration are those that existed at the start of this period in 1995. Table 2
provides a summary of the level of integration between China and its Asian neighbours as it existed
then. Columns 1 and 2 report the shares of China destined exports from the two Asian regions.
Exports to China accounted for 10.6% of all exports from Japan and the NIEs (including intra-
regional trade). Exports to China accounted for 3.5% of ASEAN-4’s exports. Thus, the former
region is much more integrated with China in terms of its export markets. ASEAN-4’s main export
to China is low-tech manufacturing goods whereas for the developed Asian region, durable goods
sector is the main export category.
Table 2 also shows China’s export patterns (Columns 3 to 6). As destination countries, Japan and
the NIEs accounted for 31.0% of China’s exports. Around one-third of this is low-tech
manufacturing goods. ASEAN-4 accounted for a much smaller fraction of China’s exports. Columns
5 and 6 report the same Chinese export values, but this time expressed as a fraction of world exports
to each region. Thus, they correspond approximately to the Chinese sourced import shares for
developed Asian and ASEAN-4 economies. It can be seen that for example 8.4% of world exports
to developed Asia are from China whereas only 3.9% of world exports to the ASEAN-4 economies
are from China. Thus, circa 1995, Japan and the NIEs were much more integrated with the Chinese
economy than the ASEAN-4 economies.
[Tables 2 & 3 about here]
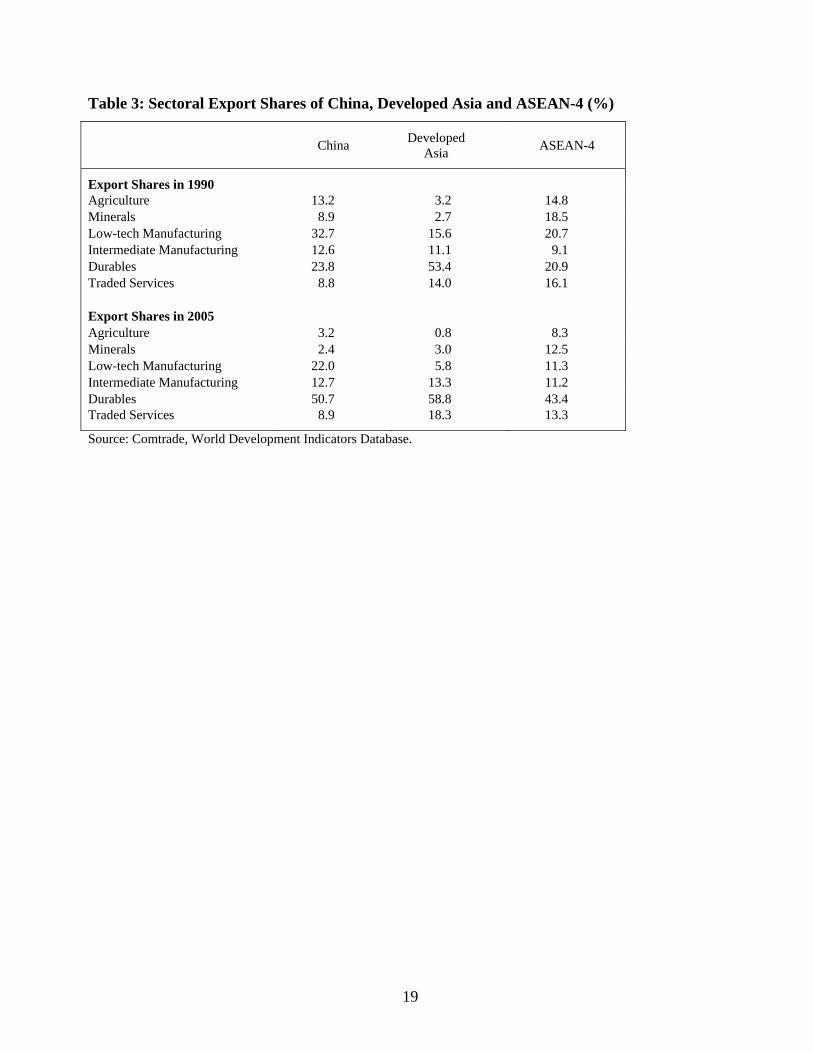
The trade structure of China and the ASEAN-4 economies are similar. Table 3 shows the
distribution of exports by commodity sectors for China, developed Asia and the ASEAN-4
economies. The composition of exports for the developed Asian region have remained relatively
unchanged during 1990 to 2005, exports were dominated by the durables sector. Both China and the
ASEAN-4 economies observed a decline in the importance of the low-tech manufacturing sector in
exports while that of the durables sector increased between 1990 and 2005.
2.3 Policy Debates
China’s rapid growth has given rise to concern among the Asian economies that China has been
5
crowding out their manufacturing export industries (Lall and Albaladejo 2004; Eichengreen et al.
2007). China’s export share for the US market, for example, increased from 3.1% in 1990 to 15.0%
in 2005, whereas the market shares of Japan and the NIEs have fallen. The concern over world trade
and investment shares seems to be particularly acute for Asian economies that have lower income
levels and a trade structures that are less complementary to that of China (Weiss and Gao 2003; Chia
2006; Ravenhill 2006; Coxhead 2007).
Lall and Albaladejo (2004) attempt to classify the exports of China’s neighbours into five levels of
“threat”.3 According to their definition, most of the exports of the NIEs and the ASEAN-4
economies are under some form of threat from China’s exports. A more sophisticated approach is to
employ the gravity model to measure the partial effect of China’s exports on other countries export
patterns. Ahearne et al. (2003), Eichengreen et al. (2007), Greenaway et al (2008) and Athukorala
(2009) examine the effects of China’s export growth on the exports of other Asian countries using
this approach. Ahearne et al. (2003) find no significant effects but Eichengreen et al. (2007) and
Greenaway et al (2008) find that China’s exports tend to “crowd out” the exports of Asian
neighbours in third country markets. The crowding out is felt more strongly in the developing Asian
economies than in the industrialised Asian economies. Eichengreen et al. (2007) also find that
China’s growth has a positive effect on the exports high income Asian economies, that are
significant exporters of capital goods, and a strong negative effect on low income Asian countries
that are dependent on the production and exports of consumer goods. A more recent study by
Athukorala (2010), however, finds little evidence to indicate that increases in China’s exports reduce
the market shares of other Asian economies in third country markets. To the contrary, he finds that
China’s exports to third country markets have had complimentary effects on Asian exports.
These mixed results are also reflected in simulation studies that have looked at the effects of China’s
WTO accession on other regional Asian economies, for example Ianchovichina and Walmsley
(2005) and Roland-Holst and Weiss (2005). There is some evidence from these studies that
developed Asian countries stood to gain from China’s WTO accession with an expansion in their
trade and an improvement in their terms of trade. But developing countries with an endowment
structure similar to China, such as Southeast Asia, face keener competition in their exports and
lower prices for their products. Roland-Holst and Weiss (2005), however, dismiss the apprehension 3 For example, Lall and Albaladejo (2004) define “threat” as being if China gains export market share and the other
countries lose, and “no threat” is where both China and the other economy gain market share, but with China growing
more slowly.
6
of China’s growing world trade shares arguing that there is no convincing evidence that China’s
trading partners are losing comparative advantage in higher value added or more skill-intensive
activities.
As yet, there has been no analysis of the long run effects of China’s growth per se. China’s
accession to the WTO, for example, is only a very small part of China’s overall reform process.
Moreover, the changes in trade patterns and increased trade flows arising from China’s growth
miracle, vastly exceed the changes implied by trade reforms alone. Though the gravity model
literature recognises the impact of changes in countries GDP on trade flows, these studies only
explain trade flows and fall short of telling us how changes in China’s growth affect incomes,
consumption and wages in other countries. The weak theoretical foundations of these models mean
that that it is difficult to make any inferences regarding economic policy responses from these
results.
3. The Model
The aim is to use a simulation model to undertake controlled experiments of the effects of China’s
growth on other Asian economies. To allow for trade-growth interactions we introduce long run
neoclassical steady state factor accumulation conditions into an open economy growth model. The
model includes eleven sectors (six traded and five non-traded) and three separate regions. The focus
of the model is to see how commodity price changes can affect factor prices - the Stolper-Sameulson
effects - and how these in turn affect physical and human capital accumulation decisions in each
region. Both regions are modeled as small open economies with respect to the Rest of the World
(ROW), but not with respect to each other. Growth in China, for example, will have an impact on
prices in the developed Asian and ASEAN-4 economies and this in turn will induce growth effects
through capital accumulation as well as gains in consumption through terms of trade improvements.
3.1 Structure of the Model
We consider a model with three regions, China, Asia and the ROW. In one application, Asia will be
an aggregate of Japan and the NIEs. In a second application, Asia will be the ASEAN economies of
Malaysia, Indonesia, Thailand and Philippines. We employ a small open economy framework with
respect to the two regions of interest, China and Asia. Thus we assume that these regions face a
constant world price for goods exported to the ROW. However, China and Asia are not assumed to
be small with respect to each other. Domestic prices in China and Asia are determined by domestic
7
demand and export supplies from each region.
To allow for trade, and specifically terms of trade, effects our growth model is disaggregated both at
the sectoral level and at the factor input level. The model combines standard growth and trade
theory, and contains eleven goods, and seven factors of production. Six of the eleven goods are
traded. In what follows we give a brief overview of the main features of the model.4
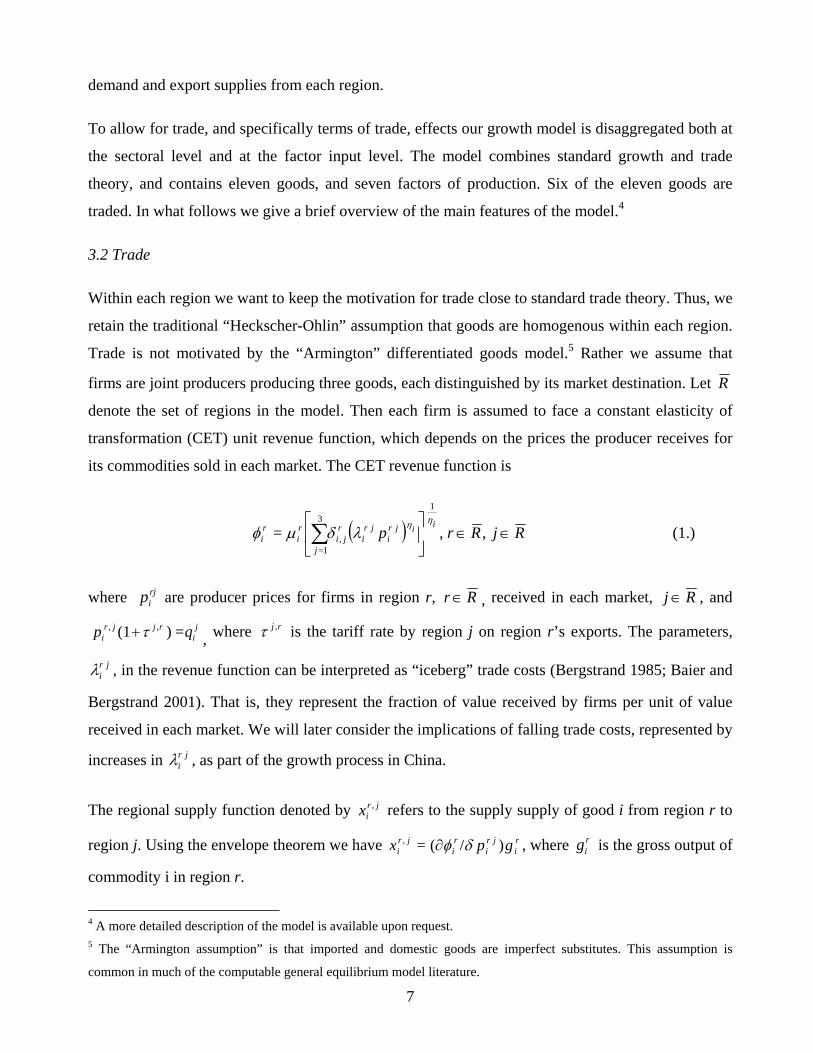
3.2 Trade
Within each region we want to keep the motivation for trade close to standard trade theory. Thus, we
retain the traditional “Heckscher-Ohlin” assumption that goods are homogenous within each region.
Trade is not motivated by the “Armington” differentiated goods model.5 Rather we assume that
firms are joint producers producing three goods, each distinguished by its market destination. Let R
denote the set of regions in the model. Then each firm is assumed to face a constant elasticity of
transformation (CET) unit revenue function, which depends on the prices the producer receives for
its commodities sold in each market. The CET revenue function is
RjRrpiijr
ijr
ir
jij
ri
ri
,,=
1
,
3
1=
(1.)
where rjip are producer prices for firms in region r, Rr , received in each market, Rj , and
ji
rjjri qp =)(1 ,, , where rj , is the tariff rate by region j on region r’s exports. The parameters,
jri , in the revenue function can be interpreted as “iceberg” trade costs (Bergstrand 1985; Baier and
Bergstrand 2001). That is, they represent the fraction of value received by firms per unit of value
received in each market. We will later consider the implications of falling trade costs, represented by
increases in jri , as part of the growth process in China.
The regional supply function denoted by jrix , refers to the supply supply of good i from region r to
region j. Using the envelope theorem we have ri
jri
ri
jri gpx )/(=, , where r
ig is the gross output of
commodity i in region r.
4 A more detailed description of the model is available upon request. 5 The “Armington assumption” is that imported and domestic goods are imperfect substitutes. This assumption is
common in much of the computable general equilibrium model literature.
8
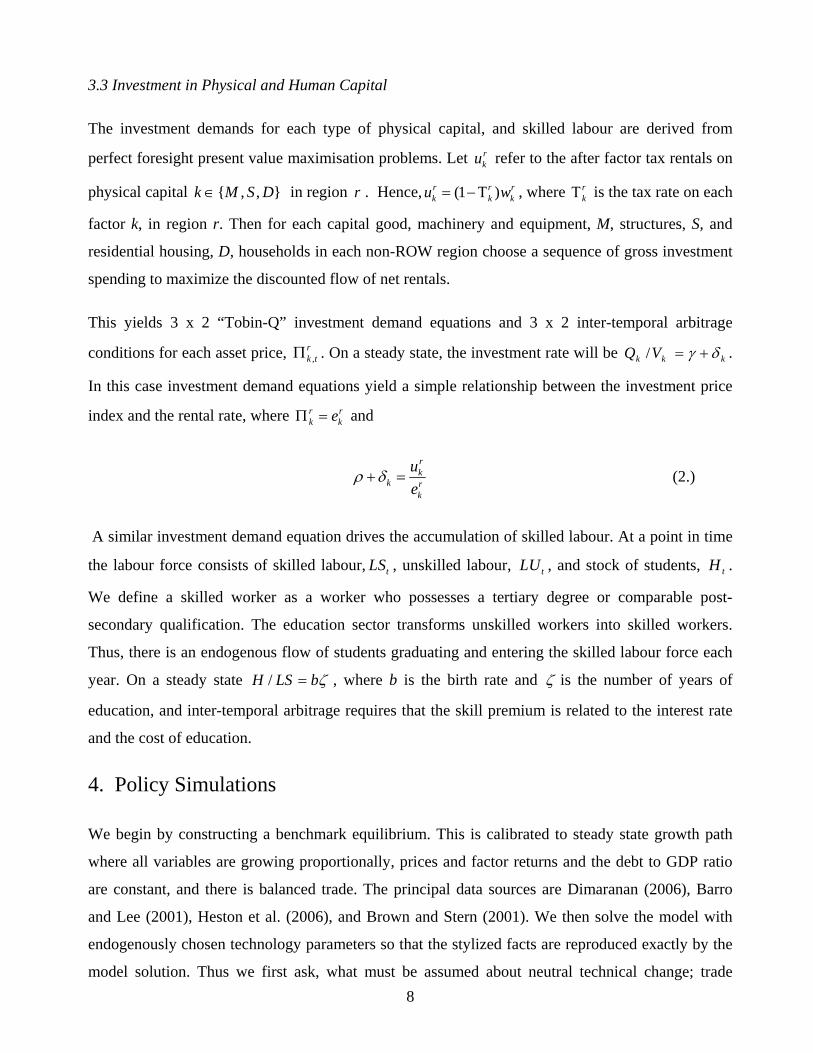
3.3 Investment in Physical and Human Capital
The investment demands for each type of physical capital, and skilled labour are derived from
perfect foresight present value maximisation problems. Let rku refer to the after factor tax rentals on
physical capital },,{ DSMk in region r . Hence, (1 )r r rk k ku w , where r
k is the tax rate on each
factor k, in region r. Then for each capital good, machinery and equipment, M, structures, S, and
residential housing, D, households in each non-ROW region choose a sequence of gross investment
spending to maximize the discounted flow of net rentals.
This yields 3 x 2 “Tobin-Q” investment demand equations and 3 x 2 inter-temporal arbitrage
conditions for each asset price, ,rk t . On a steady state, the investment rate will be kkk VQ / .
In this case investment demand equations yield a simple relationship between the investment price
index and the rental rate, where r rk ke and
rk
k rk
u
e (2.)
A similar investment demand equation drives the accumulation of skilled labour. At a point in time
the labour force consists of skilled labour, tLS , unskilled labour, tLU , and stock of students, tH .
We define a skilled worker as a worker who possesses a tertiary degree or comparable post-
secondary qualification. The education sector transforms unskilled workers into skilled workers.
Thus, there is an endogenous flow of students graduating and entering the skilled labour force each
year. On a steady state bLSH / , where b is the birth rate and is the number of years of
education, and inter-temporal arbitrage requires that the skill premium is related to the interest rate
and the cost of education.
4. Policy Simulations
We begin by constructing a benchmark equilibrium. This is calibrated to steady state growth path
where all variables are growing proportionally, prices and factor returns and the debt to GDP ratio
are constant, and there is balanced trade. The principal data sources are Dimaranan (2006), Barro
and Lee (2001), Heston et al. (2006), and Brown and Stern (2001). We then solve the model with
endogenously chosen technology parameters so that the stylized facts are reproduced exactly by the
model solution. Thus we first ask, what must be assumed about neutral technical change; trade
9
sector biased technical change, and reduction in trade barriers - to reproduce different aspects of
China's growth experience.
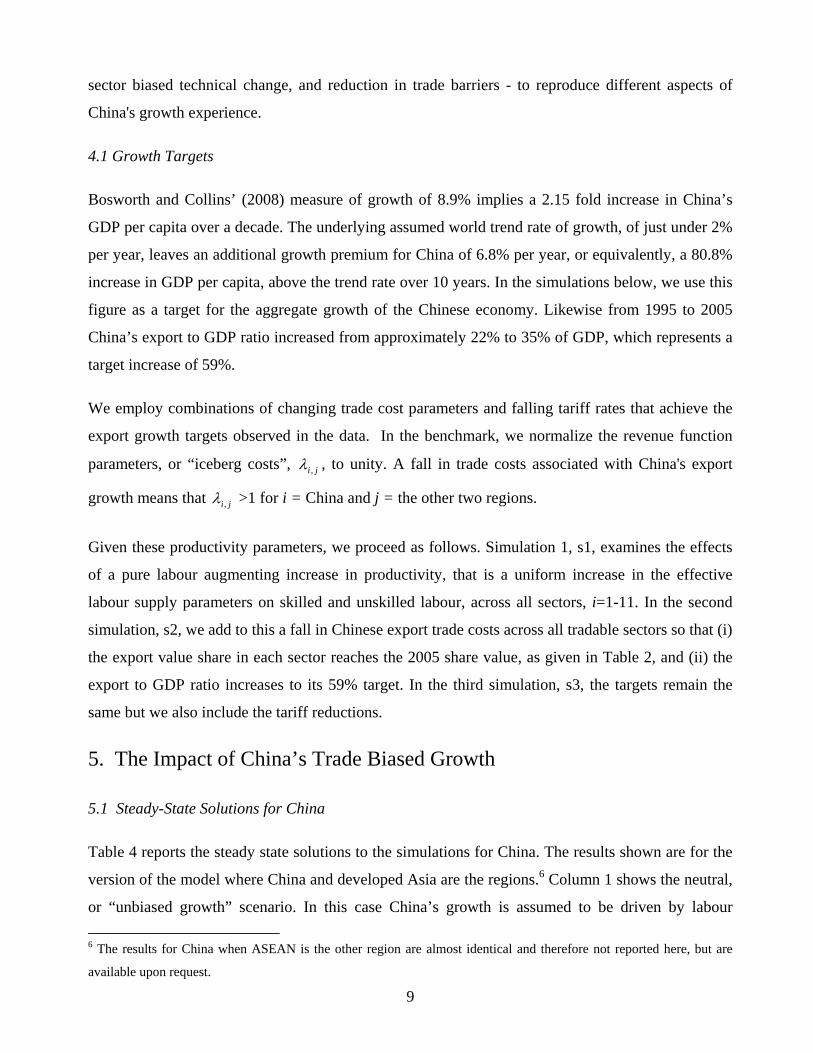
4.1 Growth Targets
Bosworth and Collins’ (2008) measure of growth of 8.9% implies a 2.15 fold increase in China’s
GDP per capita over a decade. The underlying assumed world trend rate of growth, of just under 2%
per year, leaves an additional growth premium for China of 6.8% per year, or equivalently, a 80.8%
increase in GDP per capita, above the trend rate over 10 years. In the simulations below, we use this
figure as a target for the aggregate growth of the Chinese economy. Likewise from 1995 to 2005
China’s export to GDP ratio increased from approximately 22% to 35% of GDP, which represents a
target increase of 59%.
We employ combinations of changing trade cost parameters and falling tariff rates that achieve the
export growth targets observed in the data. In the benchmark, we normalize the revenue function
parameters, or “iceberg costs”, ji, , to unity. A fall in trade costs associated with China's export
growth means that ji, >1 for i = China and j = the other two regions.
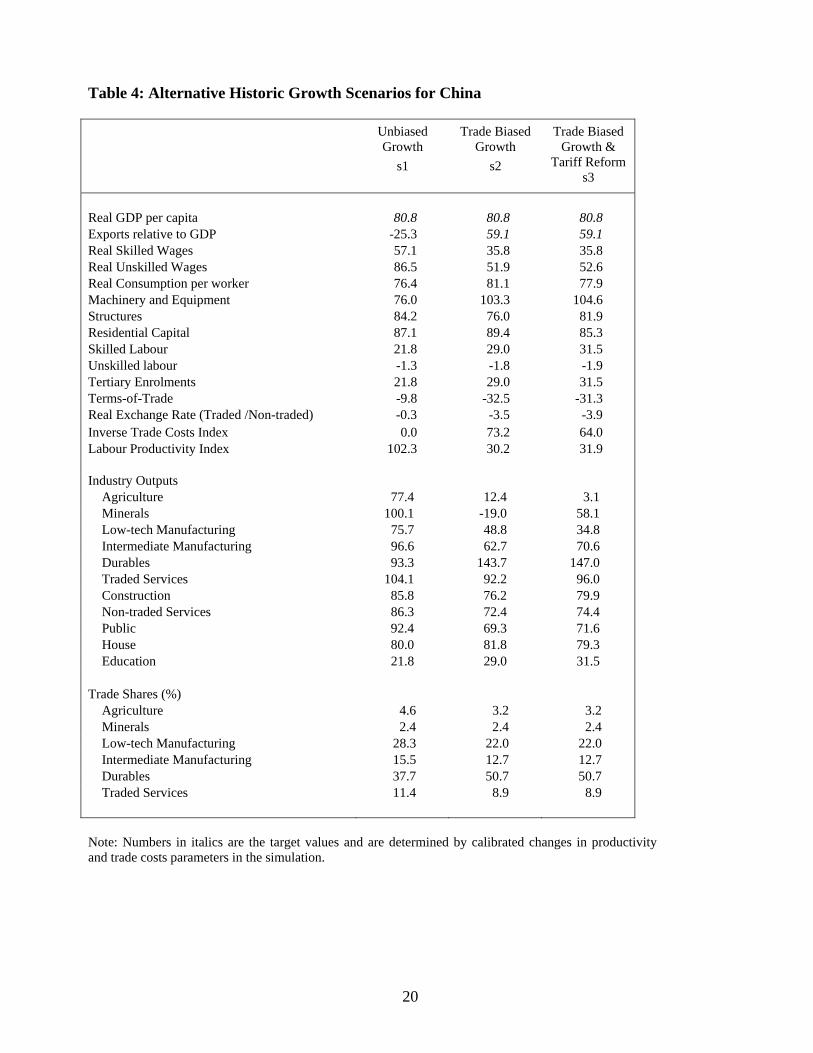
Given these productivity parameters, we proceed as follows. Simulation 1, s1, examines the effects
of a pure labour augmenting increase in productivity, that is a uniform increase in the effective
labour supply parameters on skilled and unskilled labour, across all sectors, i=1-11. In the second
simulation, s2, we add to this a fall in Chinese export trade costs across all tradable sectors so that (i)
the export value share in each sector reaches the 2005 share value, as given in Table 2, and (ii) the
export to GDP ratio increases to its 59% target. In the third simulation, s3, the targets remain the
same but we also include the tariff reductions.
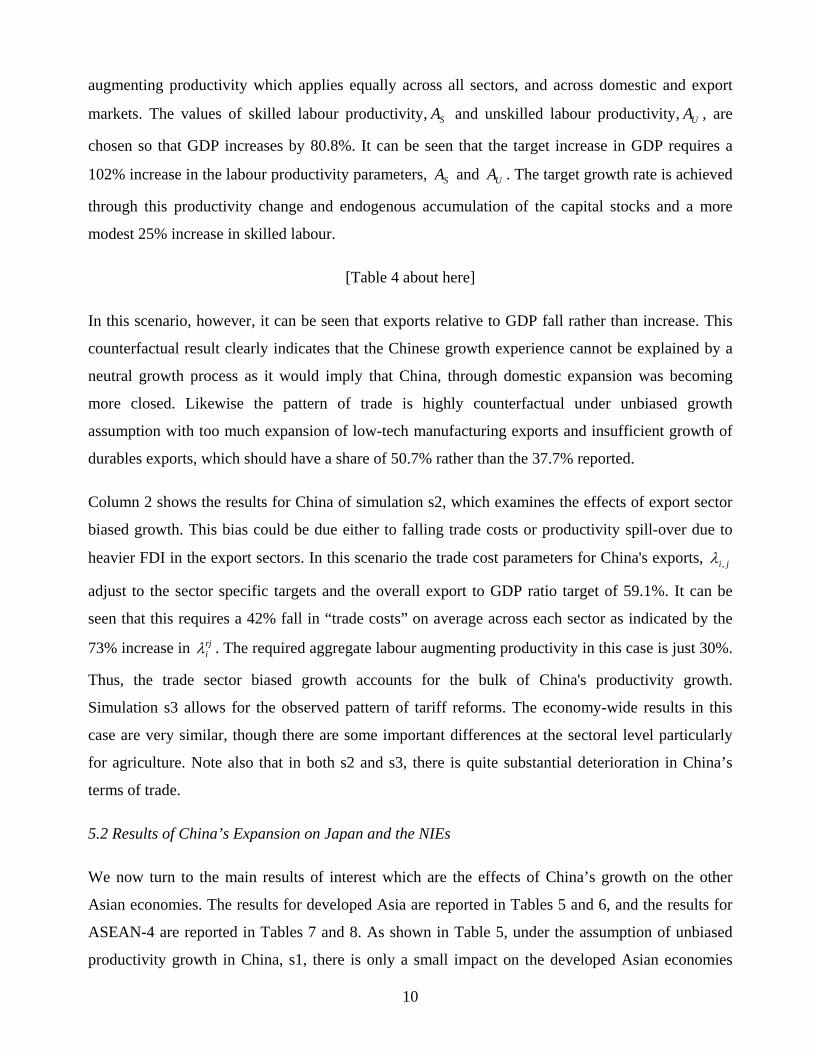
5. The Impact of China’s Trade Biased Growth
5.1 Steady-State Solutions for China
Table 4 reports the steady state solutions to the simulations for China. The results shown are for the
version of the model where China and developed Asia are the regions.6 Column 1 shows the neutral,
or “unbiased growth” scenario. In this case China’s growth is assumed to be driven by labour
6 The results for China when ASEAN is the other region are almost identical and therefore not reported here, but are
available upon request.
10
augmenting productivity which applies equally across all sectors, and across domestic and export
markets. The values of skilled labour productivity, SA and unskilled labour productivity, UA , are
chosen so that GDP increases by 80.8%. It can be seen that the target increase in GDP requires a
102% increase in the labour productivity parameters, SA and UA . The target growth rate is achieved
through this productivity change and endogenous accumulation of the capital stocks and a more
modest 25% increase in skilled labour.
[Table 4 about here]
In this scenario, however, it can be seen that exports relative to GDP fall rather than increase. This
counterfactual result clearly indicates that the Chinese growth experience cannot be explained by a
neutral growth process as it would imply that China, through domestic expansion was becoming
more closed. Likewise the pattern of trade is highly counterfactual under unbiased growth
assumption with too much expansion of low-tech manufacturing exports and insufficient growth of
durables exports, which should have a share of 50.7% rather than the 37.7% reported.
Column 2 shows the results for China of simulation s2, which examines the effects of export sector
biased growth. This bias could be due either to falling trade costs or productivity spill-over due to
heavier FDI in the export sectors. In this scenario the trade cost parameters for China's exports, ji,
adjust to the sector specific targets and the overall export to GDP ratio target of 59.1%. It can be
seen that this requires a 42% fall in “trade costs” on average across each sector as indicated by the
73% increase in rji . The required aggregate labour augmenting productivity in this case is just 30%.
Thus, the trade sector biased growth accounts for the bulk of China's productivity growth.
Simulation s3 allows for the observed pattern of tariff reforms. The economy-wide results in this
case are very similar, though there are some important differences at the sectoral level particularly
for agriculture. Note also that in both s2 and s3, there is quite substantial deterioration in China’s
terms of trade.
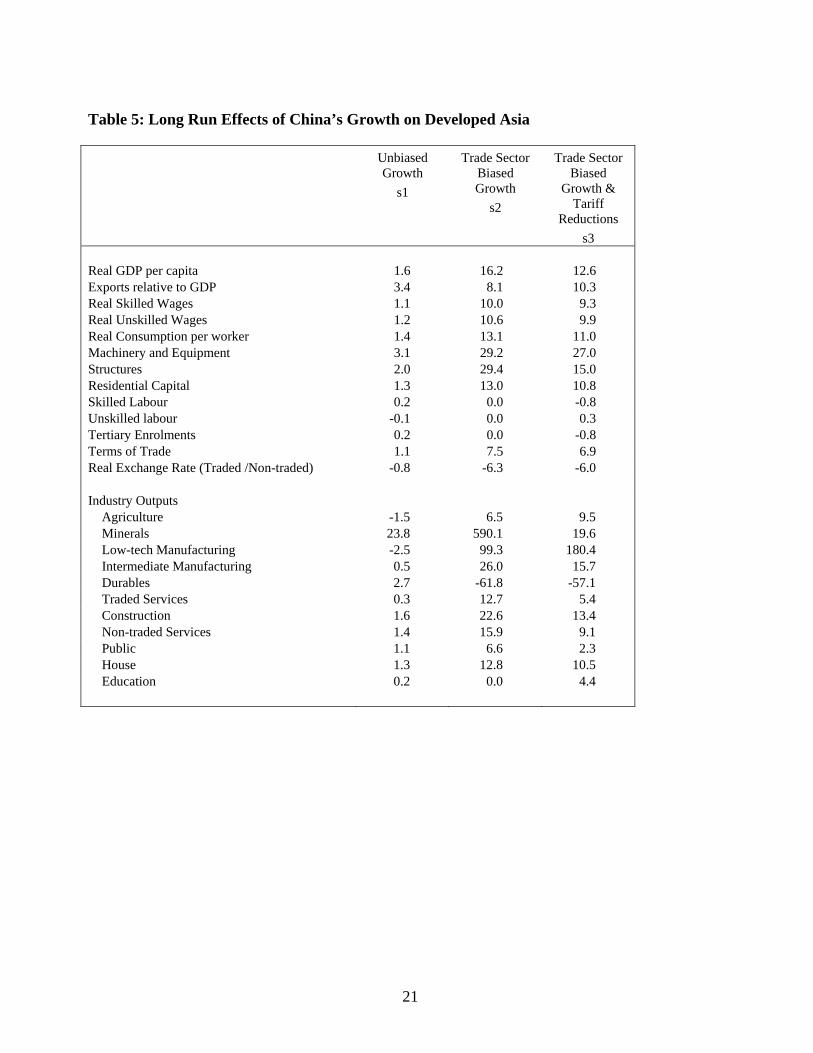
5.2 Results of China’s Expansion on Japan and the NIEs
We now turn to the main results of interest which are the effects of China’s growth on the other
Asian economies. The results for developed Asia are reported in Tables 5 and 6, and the results for
ASEAN-4 are reported in Tables 7 and 8. As shown in Table 5, under the assumption of unbiased
productivity growth in China, s1, there is only a small impact on the developed Asian economies
11
with GDP per capita increasing by just 1.6%. Allowing for biased trade patterns in s2, however,
generates a massive 16.2% improvement in GDP per capita in developed Asia, and a similar 13%
increase in consumption per worker.
[Tables 5 & 6 about here]
This translates to a growth elasticity of approximately 0.25. That is for every additional percentage
point of biased growth in China, developed Asia gains approximately 0.25 percentage points of
annual growth. This emphasises the importance of the pattern of bias in Chinese growth process.
Neutral growth in China would have little impact on it trading partners. The gains are similar once
China’s tariff reductions are included (s3), though not quite as large with a 12.6% increase in GDP
and an 11% increase in consumption.
The sources of this growth are the terms of trade improvement of 7.5%, and the induced effects of
factor accumulation. In particular there is a 29% increase in both machinery and equipment, and
structural capital. The gains in developed Asia are driven primarily by the lower cost of capital,
generating increased capital deepening via the steady state asset pricing equation (2). China’s
growth also causes developed Asia to become more open with the export to GDP ratio increasing by
8%.7
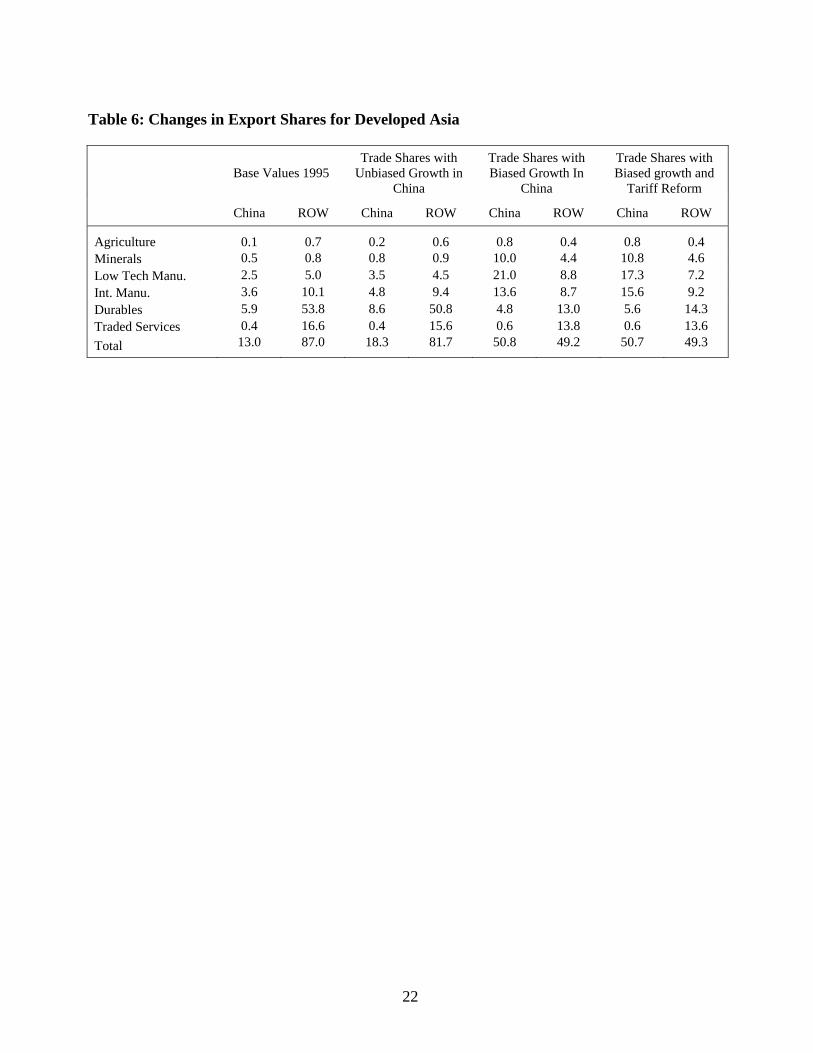
Crowding out effects are, however, notable at the sectoral level. China’s growth implies a large fall
in developed Asia’s durables sector. More detailed results on the pattern of trade are shown in Table
6. Rising openness is driven by increasing trade with China at the expense of the ROW. Under the
biased growth scenario, s2, China’s share rises from 13% of developed Asia’s export market in the
base, to over 50.7% of developed Asia’s export market. Particularly notable is the expansion of
intermediate (components) and low-tech manufactured goods exports to China.
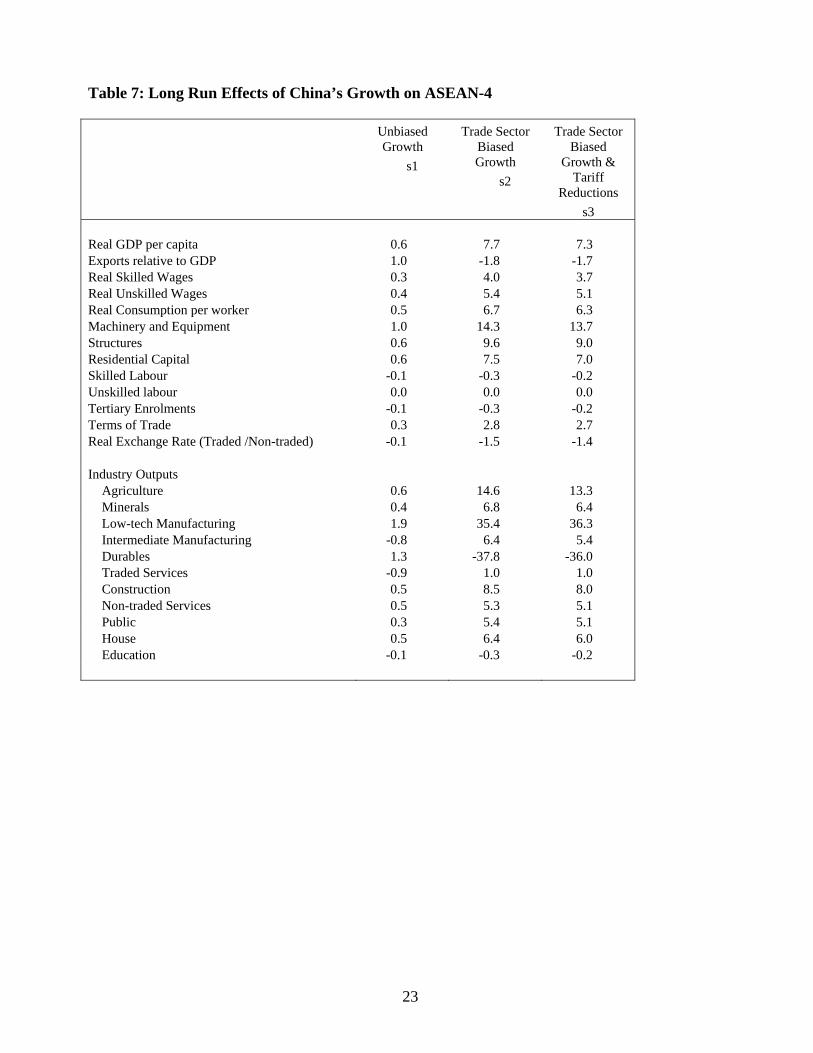
5.3 Results of China’s Expansion on ASEAN-4
Next we consider the results for the ASEAN-4 economies in Tables 7 and 8. It can be seen that the
effects on per capita incomes in the ASEAN-4 economies are much more modest, at 7.7% in s2 and
7.3% in s3, this primarily reflects ASEAN-4’s lower level of integration with China in terms of
ASEAN-4’s import shares from China. Interestingly, China’s growth does cause the ASEAN-4
countries to become more closed, relatively speaking, with trade to GDP ratio declining. Hence
7 Since trade is balanced in equilibrium this also implies an identical increase to import—GDP ratio for the USA.
12
trade flows, though growing, do not grow quite as fast in ASEAN-4 as the non-traded sector. Real
consumption increases are 6.3 to 6.7%, and real wages rise by around 4 to 5% in each of the trade
biased simulations, with little change in the ratio of skilled to less skilled worker wage incomes.
Most of the growth effects come from increased rate of capital accumulation due to falling prices of
capital inputs, particularly for machinery and equipment.
[Tables 7 & 8 about here]
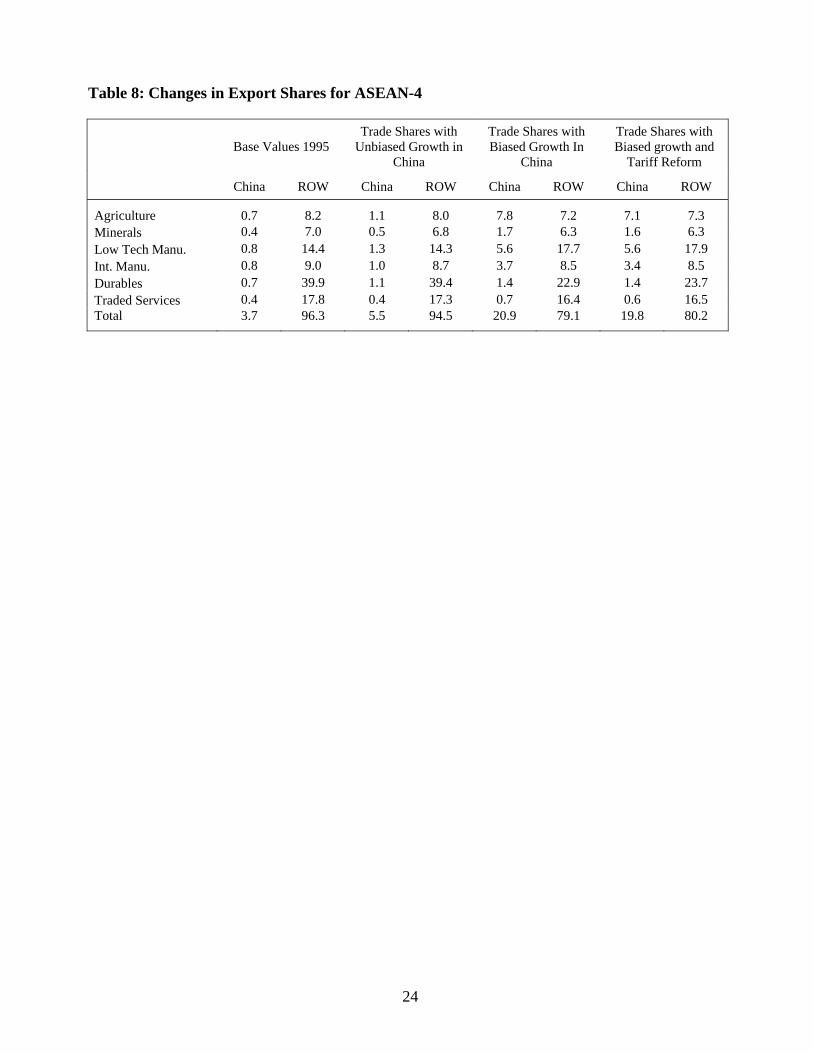
Table 8 shows that China becomes a much more important export destination for ASEAN-4, as a
result of China’s growth. China’s share of ASEAN-4’s exports rises from 3.7% in the base case, to
around 20% of ASEAN-4’s exports in s2 and s3. By far the largest growth on a sector basis occurs
in the low-tech manufacturing sector. As a whole this sector expands by 35 to 36% in s2 and s3.
Conversely there is a dramatic decline in the ASEAN-4’s durables sector. Table 7 shows that there
is a decline in durables output of 36%. As shown in Table 8, the durables sector’s share of exports to
the ROW declines from 39.9% of all exports in the base, to approximately 23% of exports in s2 and
s3. This crowding out of the durables sector is induced by China’s exports to ASEAN-4 which
drives down domestic durables prices. Despite this, however, it can be seen that the durables sector’s
export shares to China increase from 0.7 to 1.7% of exports. Indeed there is an increase in exports to
China across all sectors, but particularly in agriculture and low-tech manufacturing. China’s share of
ASEAN-4’s export market increases from 3.7 to 20%, which in proportional terms is a much larger
change than was found for the developed Asian economies.
Thus China’s growth, in these experiments indeed is shown to cause a sharp change in ASEAN-4
countries’ trade patterns, crowding out the higher end sectors such as durables and causing ASEAN-
4’s production patterns towards greater specialisation in agriculture and low tech sectors. However,
we also found substantial growth benefits, rising wages and no significant impact on skill
accumulation for the ASEAN-4 economies.
6. Conclusion
The principal conclusion from these simulations is that the impact of China’s growth on its Asian
neighbours has not only been positive, but also very substantial. This is particularly so for the more
industrialised Asian economies of Japan and the NIEs. As a group, a decade of China’s growth is
shown to generate a 16% increase in GDP with similar gains in consumption. The gains to Japan
13
and the NIEs concord with the general conclusions from the WTO accession literature, and also with
the gravity model literature. Our results emphasis the substantial magnitude of income gains from
China’s growth on this region and also the mechanism by which these income and consumption
gains are achieved.
For the ASEAN-4 economies, the existing literature on the impacts of China’s trade is mixed, with
some studies showing positive effects and others showing negative or ambiguous effects. The
ASEAN-4 economies, circa 1995, tended to be less open and less integrated with China. Moreover,
its pattern of trade is less complementary with China than the more developed Asian countries.
Nevertheless, we find that the ASEAN-4 economies also experience gains in the order of 7 to 8% of
GDP, from a decade of China’s growth. The gains are smaller than those of Japan and the NIEs, for
the reasons cited, but are, nevertheless, also large.
The income gains are long run steady state results, and hence incorporate increased incomes from
capital deepening. Nevertheless, the income gains for the developed Asian and ASEAN-4
economies are far larger than typical models would predict from complete trade liberalization or
similar tax reforms. The overall conclusion for these countries is that growth rates over the last
several decades would have substantially smaller in the absence of China’s growth.
The sources of this growth are the terms of trade improvements. The Asian economies benefit from
higher export prices to the Chinese market. Moreover, the lower relative import prices, particularly
from imports of Chinese durable goods, induce substantial accumulation of machinery and
equipment capital. Such gains do not come without significant economywide adjustments and the
results also point to large crowding out effects in durables manufacturing, under competition from
the rapidly growing Chinese durables export sector. In the short run, the adjustment costs could be
large. These adjustments are necessary for the gains to be realised. The results suggest that
protectionist policies, or policies that offset the changes in industry composition will limit the
potential long run benefits from China’s growth miracle.
14
References
Ahearne, Alan G., Fernald, John G., Loungani, Prakash and Schindler, John W. (2003) “China and
emerging Asia: Comrades or competitors?”, International Finance Discussion Paper no. 789.
Board of Governors, Federal Reserve System.
Amighini, Alessia (2005) “China in the International Fragmentation of Production: Evidence from
the ICT industry”, The European Journal of Comparative Economics, 2, 2, 203-219.
Amiti, Mary and Freund, Caroline (2008) “The Anatomy of China's Export Growth”, The World
Bank, Policy Research Working Paper 4628.
Anderson, James E. and van Wincoop, Eric (2004) “Trade Costs”, NBER Working Paper 10480.
Athukorala, Prema-chandra (2010) “The Rise of China and East Asian Export Performance: Is the
Crowding-Out Fear Warranted?” The World Economy 32, 2, 234-266.
Baier, Scott L. and Bergstrand, Jeffrey H. (2001) “The growth of world trade: tariffs, transport costs,
and income similarity”. Journal of International Economics 53, 1, 1-27.
Barro, Robert J. and Lee, Jong-Wha (2001) “International Data on Educational Attainment: Updates
and Implications”, Oxford Economic Papers, 53, 3, 541-563.
Bergstrand, J.H. (1985) “The gravity equation in international trade: Some microeconomic
foundations and empirical evidence”, Review of Economics and Statistics 67,3, 474–481.
Bosworth, Barry and Collins, Susan M. (2008) “Accounting for Growth: Comparing China and
India”, Journal of Economic Perspectives, 22, 1, 45-66.
Branstetter, Lee and Nicholas, Lardy (2006) “China's Embrace Of Globalization”, NBER Working
Paper 12373.
Brown, Drusilla. K. and Robert, M. Stern (2001) “Measuring and Modelling the Effects of Trade
and Investment Barriers in Services”, Review of International Economics, 9, 2, 262-286.
Chia, Siow Ye and Sussangkarn, Chalongphob (2006) “The Economic Rise of China: Challenges
and Opportunities for ASEAN”, Asian Economic Policy Review 1, 1, 102-128.
15
Chow, G. C. (2002) “China's Economic Transformation”, Malden, MA, Blackwell Publishers.
Coxhead, Ian ( 2007) “A New Resources Curse? Impacts of China’s Boom on Comparative
Advantage and Resource Dependance in Southeast Asia”, World Development 35, 7 1099-
1119.
Dimaranan, Betina V. (2006) “Global Trade, Assistance, and Production: The GTAP 6 Data Base”,
Center for Global Trade Analysis, Purdue University.
Eichengreen, Barry, Rhee, Yeongseop and Tong, Hui (2007) “China and the Exports of Other Asian
Countries”, Review of World Economics , 143, 2, 201-26.
Greenaway, David, Aruneema Mahabir and Chris Milner (2008) “Has China displaced Other Asian
Countries Exports” China Economic Review, 19, 152-169.
Harris, Richard G. and Robertson, Peter E. (2009) “Trade, wages and Skill Accumulation in the
Emerging Giants”, University of Western Australia, Economics Discussion Paper 09.19.
Heston, Alan,Summers, Robert and Allen, Bettina (2006) “Penn World Tables Version 6.2”, Center
for International Comparisons of Production, Income and Prices at the University of
Pennsylvania, September 2006.
Ianchovichina, E. and Walmsley, T. (2005) “Impact of China’s WTO Accession on East Asia”,
Contemporary Economic Policy, 23, 2, 261–277.
Lall, S. and Albaladejo, M. (2004) “China’s competitive performance: a threat to East Asian
manufactured exports”, World Development, 32, 9, 1441–66.
Lardy, Nicholas R. (2003) Trade Liberalization and its Role in Chinese Economic Growth,
International Monetary Fund and National Council of Applied Economic Research Conference
A Tale of Two Giants: India's and China's Experience with Reform and Growth New Delhi,
November 14-16.
Perkins, F. C. (1997) “Export Performance and Enterprise Reform in China's Coastal Provinces”,
Economic Development and Cultural Change, 45, 3, 501-539.
Ravenhill, John (2006) “Is China an Economic Threat to Southeast Asia?”, Asian Survey, 46, 5 653-
674.
16
Rodrik, Dani (2006) “What's So Special About China's Exports?”, China and The World Economy,
4 5, 1-19.
Roland-Holst, D. and Weiss, J. (2005) “People’s Republic of China and its neighbours: evidence on
regional trade and investment effects”, Asian-Pacific Economic Literature, 19, 2, 18-35.
Rumbaugh, Thomas and Blancher, Nicholas (2004) “International Trade and the Challenges of
WTO Accession”. In Prasad, Eswar (Ed), China's Growth and Integration into the World
Economy: Prospects and Challenges, IMF Occasional Paper 232, Washington DC.
Ren, Ruoen (1995) “China's Economic Performance in International Perspective”, manuscript, Paris:
OECD Development Centre.
Schott, Peter K. (2006) “The Relative Revealed Competitiveness of China's Exports to the United
States vis à vis Other Countries in Asia, the Caribbean, Latin America and the OECD”,
Occasional Paper 39, Inter-American Development Bank, Integration and Regional Programs
Development.
UNESCO (2002) “Financing Education - Investments and Returns: Analysis of the World Education
Indicators”, UNESCO Institute for Statistics and OECD, World Education Indicator
Programme.
Weiss, John and Gao, Shanwen (2003) “People’s Republic of China’s Export Threat to ASEAN:
Competition in the US and Japanese Markets”, ADBI Institute Discussion Paper No.2, Tokyo:
Asian Development Bank Institute.
17
Appendix
Table 1: Shares of Merchandise Exports in China
Export Share 1990
Export Share 1995
Export Share 2005
Agriculture 0.14 0.09 0.03 Minerals 0.10 0.04 0.03 Low-tech Manufacturing 0.36 0.37 0.24 Intermediate Manufacturing 0.14 0.17 0.14 Durables 0.26 0.33 0.56 Source: Comtrade.
18
Table 2: Regional Export Shares in 1995
Exports to China (% Total Exports)
Chinese Exports to Region
(% China’s Exports)
Imports From China (% Total Imports)
Developed
Asia ASEAN-4
Developed Asia
ASEAN-4 Developed
Asia ASEAN-4
Agriculture 0.1 0.6 3.4 0.5 0.9 0.4 Minerals 0.4 0.3 1.5 0.1 0.4 0.1 Low-tech Manufacturing. 2.0 0.8 11.3 0.6 3.1 0.5 Intermediate Manufacturing 3.0 0.7 4.8 1.0 1.3 0.9 Durables 4.8 0.7 8.6 1.6 2.4 1.5 Traded Services 0.3 0.4 1.3 0.5 0.3 0.5 Total 10.6 3.5 31.0 4.2 8.4 3.9 Source: GTAP Data Base Export Values 1995. Note: ‘Imports from’ are measured as exports from China to developed Asia and ASEAN as a fraction of world exports to these regions, including intra-regional and international trade.
19
Table 3: Sectoral Export Shares of China, Developed Asia and ASEAN-4 (%)
China Developed
Asia ASEAN-4
Export Shares in 1990 Agriculture 13.2 3.2 14.8 Minerals 8.9 2.7 18.5 Low-tech Manufacturing 32.7 15.6 20.7 Intermediate Manufacturing 12.6 11.1 9.1 Durables 23.8 53.4 20.9 Traded Services 8.8 14.0 16.1 Export Shares in 2005 Agriculture 3.2 0.8 8.3 Minerals 2.4 3.0 12.5 Low-tech Manufacturing 22.0 5.8 11.3 Intermediate Manufacturing 12.7 13.3 11.2 Durables 50.7 58.8 43.4 Traded Services 8.9 18.3 13.3
Source: Comtrade, World Development Indicators Database.
20
Table 4: Alternative Historic Growth Scenarios for China
Unbiased Growth
s1
Trade Biased Growth
s2
Trade Biased Growth &
Tariff Reform s3
Real GDP per capita 80.8 80.8 80.8 Exports relative to GDP -25.3 59.1 59.1 Real Skilled Wages 57.1 35.8 35.8 Real Unskilled Wages 86.5 51.9 52.6 Real Consumption per worker 76.4 81.1 77.9 Machinery and Equipment 76.0 103.3 104.6 Structures 84.2 76.0 81.9 Residential Capital 87.1 89.4 85.3 Skilled Labour 21.8 29.0 31.5 Unskilled labour -1.3 -1.8 -1.9 Tertiary Enrolments 21.8 29.0 31.5 Terms-of-Trade -9.8 -32.5 -31.3 Real Exchange Rate (Traded /Non-traded) -0.3 -3.5 -3.9 Inverse Trade Costs Index 0.0 73.2 64.0 Labour Productivity Index 102.3 30.2 31.9
Industry Outputs
Agriculture 77.4 12.4 3.1 Minerals 100.1 -19.0 58.1 Low-tech Manufacturing 75.7 48.8 34.8 Intermediate Manufacturing 96.6 62.7 70.6 Durables 93.3 143.7 147.0 Traded Services 104.1 92.2 96.0 Construction 85.8 76.2 79.9 Non-traded Services 86.3 72.4 74.4 Public 92.4 69.3 71.6 House 80.0 81.8 79.3 Education 21.8 29.0 31.5
Trade Shares (%)
Agriculture 4.6 3.2 3.2 Minerals 2.4 2.4 2.4 Low-tech Manufacturing 28.3 22.0 22.0 Intermediate Manufacturing 15.5 12.7 12.7 Durables 37.7 50.7 50.7 Traded Services 11.4 8.9 8.9
Note: Numbers in italics are the target values and are determined by calibrated changes in productivity and trade costs parameters in the simulation.
21
Table 5: Long Run Effects of China’s Growth on Developed Asia
Unbiased Growth
s1
Trade Sector Biased Growth
s2
Trade Sector Biased
Growth & Tariff
Reductions
s3 Real GDP per capita 1.6 16.2 12.6 Exports relative to GDP 3.4 8.1 10.3 Real Skilled Wages 1.1 10.0 9.3 Real Unskilled Wages 1.2 10.6 9.9 Real Consumption per worker 1.4 13.1 11.0 Machinery and Equipment 3.1 29.2 27.0 Structures 2.0 29.4 15.0 Residential Capital 1.3 13.0 10.8 Skilled Labour 0.2 0.0 -0.8 Unskilled labour -0.1 0.0 0.3 Tertiary Enrolments 0.2 0.0 -0.8 Terms of Trade 1.1 7.5 6.9 Real Exchange Rate (Traded /Non-traded) -0.8 -6.3 -6.0
Industry Outputs
Agriculture -1.5 6.5 9.5 Minerals 23.8 590.1 19.6 Low-tech Manufacturing -2.5 99.3 180.4 Intermediate Manufacturing 0.5 26.0 15.7 Durables 2.7 -61.8 -57.1 Traded Services 0.3 12.7 5.4 Construction 1.6 22.6 13.4 Non-traded Services 1.4 15.9 9.1 Public 1.1 6.6 2.3 House 1.3 12.8 10.5 Education 0.2 0.0 4.4
22
Table 6: Changes in Export Shares for Developed Asia
Base Values 1995 Trade Shares with
Unbiased Growth in China
Trade Shares with Biased Growth In
China
Trade Shares with Biased growth and
Tariff Reform
China ROW China ROW China ROW China ROW
Agriculture 0.1 0.7 0.2 0.6 0.8 0.4 0.8 0.4 Minerals 0.5 0.8 0.8 0.9 10.0 4.4 10.8 4.6 Low Tech Manu. 2.5 5.0 3.5 4.5 21.0 8.8 17.3 7.2 Int. Manu. 3.6 10.1 4.8 9.4 13.6 8.7 15.6 9.2 Durables 5.9 53.8 8.6 50.8 4.8 13.0 5.6 14.3 Traded Services 0.4 16.6 0.4 15.6 0.6 13.8 0.6 13.6
Total 13.0 87.0 18.3 81.7 50.8 49.2 50.7 49.3
23
Table 7: Long Run Effects of China’s Growth on ASEAN-4
Unbiased Growth
s1
Trade Sector Biased Growth
s2
Trade Sector Biased
Growth & Tariff
Reductions
s3 Real GDP per capita 0.6 7.7 7.3 Exports relative to GDP 1.0 -1.8 -1.7 Real Skilled Wages 0.3 4.0 3.7 Real Unskilled Wages 0.4 5.4 5.1 Real Consumption per worker 0.5 6.7 6.3 Machinery and Equipment 1.0 14.3 13.7 Structures 0.6 9.6 9.0 Residential Capital 0.6 7.5 7.0 Skilled Labour -0.1 -0.3 -0.2 Unskilled labour 0.0 0.0 0.0 Tertiary Enrolments -0.1 -0.3 -0.2 Terms of Trade 0.3 2.8 2.7 Real Exchange Rate (Traded /Non-traded) -0.1 -1.5 -1.4
Industry Outputs
Agriculture 0.6 14.6 13.3 Minerals 0.4 6.8 6.4 Low-tech Manufacturing 1.9 35.4 36.3 Intermediate Manufacturing -0.8 6.4 5.4 Durables 1.3 -37.8 -36.0 Traded Services -0.9 1.0 1.0 Construction 0.5 8.5 8.0 Non-traded Services 0.5 5.3 5.1 Public 0.3 5.4 5.1 House 0.5 6.4 6.0 Education -0.1 -0.3 -0.2
24
Table 8: Changes in Export Shares for ASEAN-4
Base Values 1995 Trade Shares with
Unbiased Growth in China
Trade Shares with Biased Growth In
China
Trade Shares with Biased growth and
Tariff Reform
China ROW China ROW China ROW China ROW
Agriculture 0.7 8.2 1.1 8.0 7.8 7.2 7.1 7.3 Minerals 0.4 7.0 0.5 6.8 1.7 6.3 1.6 6.3 Low Tech Manu. 0.8 14.4 1.3 14.3 5.6 17.7 5.6 17.9 Int. Manu. 0.8 9.0 1.0 8.7 3.7 8.5 3.4 8.5 Durables 0.7 39.9 1.1 39.4 1.4 22.9 1.4 23.7 Traded Services 0.4 17.8 0.4 17.3 0.7 16.4 0.6 16.5 Total 3.7 96.3 5.5 94.5 20.9 79.1 19.8 80.2
25
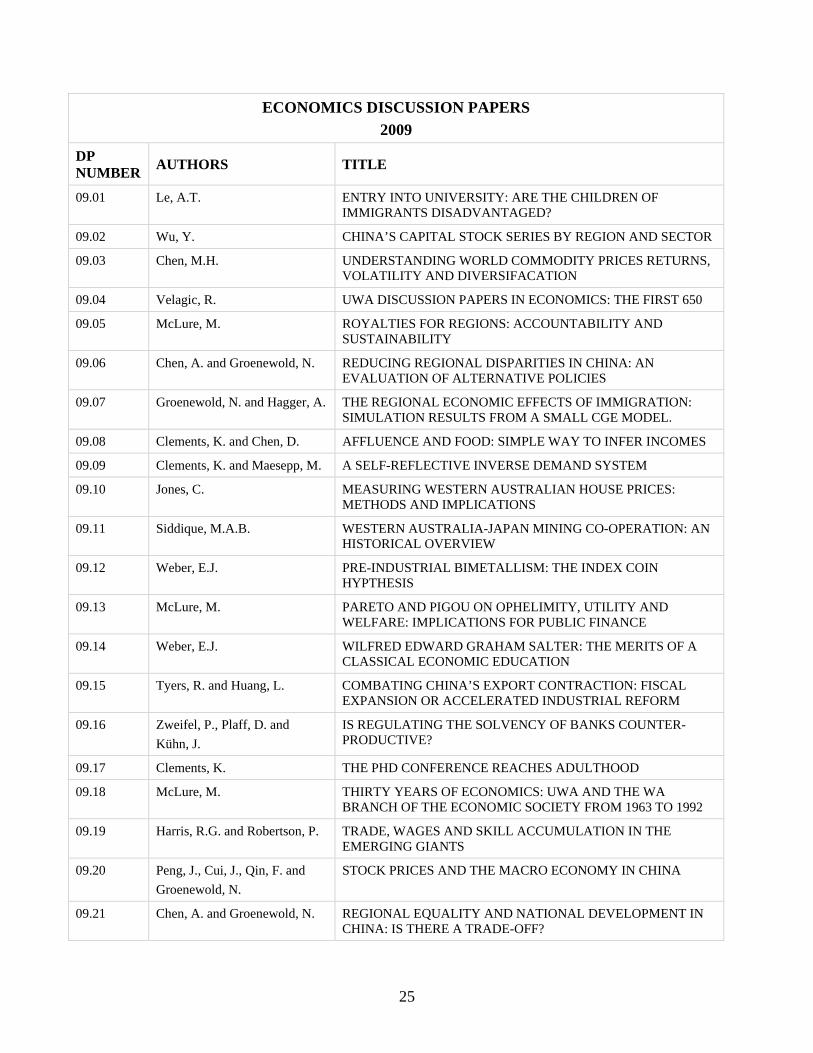
ECONOMICS DISCUSSION PAPERS
2009
DP NUMBER
AUTHORS TITLE
09.01 Le, A.T. ENTRY INTO UNIVERSITY: ARE THE CHILDREN OF IMMIGRANTS DISADVANTAGED?
09.02 Wu, Y. CHINA’S CAPITAL STOCK SERIES BY REGION AND SECTOR
09.03 Chen, M.H. UNDERSTANDING WORLD COMMODITY PRICES RETURNS, VOLATILITY AND DIVERSIFACATION
09.04 Velagic, R. UWA DISCUSSION PAPERS IN ECONOMICS: THE FIRST 650
09.05 McLure, M. ROYALTIES FOR REGIONS: ACCOUNTABILITY AND SUSTAINABILITY
09.06 Chen, A. and Groenewold, N. REDUCING REGIONAL DISPARITIES IN CHINA: AN EVALUATION OF ALTERNATIVE POLICIES
09.07 Groenewold, N. and Hagger, A. THE REGIONAL ECONOMIC EFFECTS OF IMMIGRATION: SIMULATION RESULTS FROM A SMALL CGE MODEL.
09.08 Clements, K. and Chen, D. AFFLUENCE AND FOOD: SIMPLE WAY TO INFER INCOMES
09.09 Clements, K. and Maesepp, M. A SELF-REFLECTIVE INVERSE DEMAND SYSTEM
09.10 Jones, C. MEASURING WESTERN AUSTRALIAN HOUSE PRICES: METHODS AND IMPLICATIONS
09.11 Siddique, M.A.B. WESTERN AUSTRALIA-JAPAN MINING CO-OPERATION: AN HISTORICAL OVERVIEW
09.12 Weber, E.J. PRE-INDUSTRIAL BIMETALLISM: THE INDEX COIN HYPTHESIS
09.13 McLure, M. PARETO AND PIGOU ON OPHELIMITY, UTILITY AND WELFARE: IMPLICATIONS FOR PUBLIC FINANCE
09.14 Weber, E.J. WILFRED EDWARD GRAHAM SALTER: THE MERITS OF A CLASSICAL ECONOMIC EDUCATION
09.15 Tyers, R. and Huang, L. COMBATING CHINA’S EXPORT CONTRACTION: FISCAL EXPANSION OR ACCELERATED INDUSTRIAL REFORM
09.16 Zweifel, P., Plaff, D. and
Kühn, J.
IS REGULATING THE SOLVENCY OF BANKS COUNTER-PRODUCTIVE?
09.17 Clements, K. THE PHD CONFERENCE REACHES ADULTHOOD
09.18 McLure, M. THIRTY YEARS OF ECONOMICS: UWA AND THE WA BRANCH OF THE ECONOMIC SOCIETY FROM 1963 TO 1992
09.19 Harris, R.G. and Robertson, P. TRADE, WAGES AND SKILL ACCUMULATION IN THE EMERGING GIANTS
09.20 Peng, J., Cui, J., Qin, F. and
Groenewold, N.
STOCK PRICES AND THE MACRO ECONOMY IN CHINA
09.21 Chen, A. and Groenewold, N. REGIONAL EQUALITY AND NATIONAL DEVELOPMENT IN CHINA: IS THERE A TRADE-OFF?
26
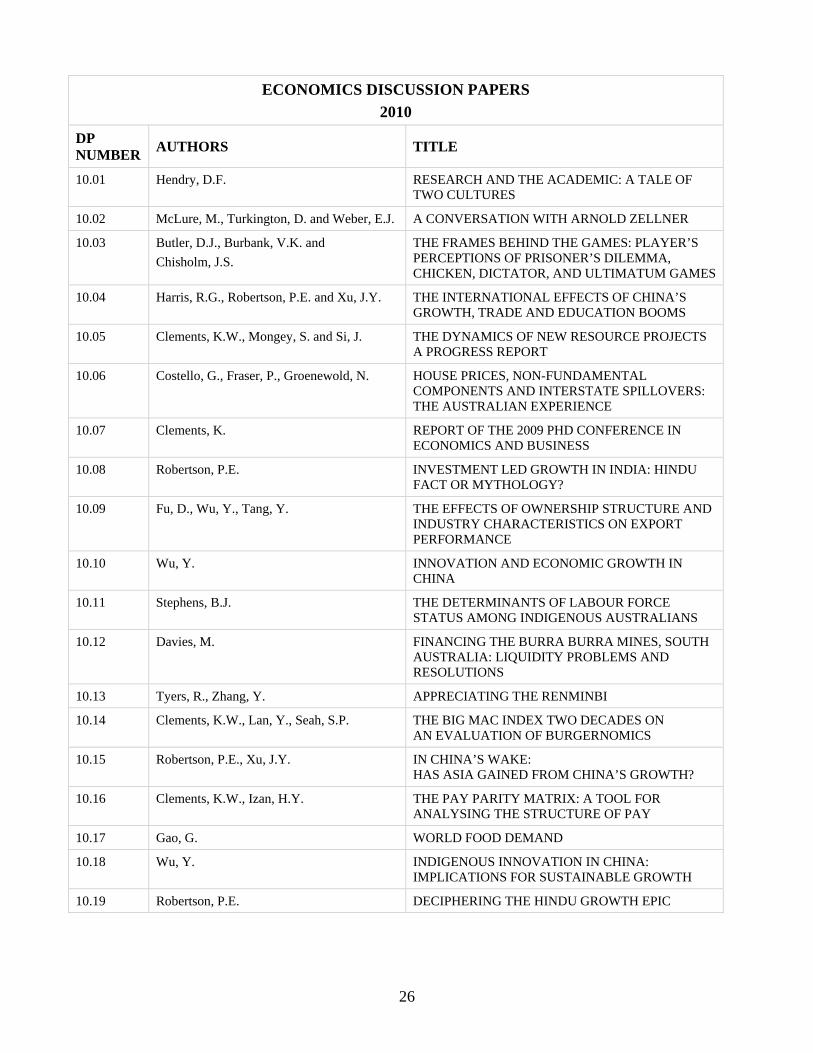
ECONOMICS DISCUSSION PAPERS
2010
DP NUMBER
AUTHORS TITLE
10.01 Hendry, D.F. RESEARCH AND THE ACADEMIC: A TALE OF TWO CULTURES
10.02 McLure, M., Turkington, D. and Weber, E.J. A CONVERSATION WITH ARNOLD ZELLNER
10.03 Butler, D.J., Burbank, V.K. and
Chisholm, J.S.
THE FRAMES BEHIND THE GAMES: PLAYER’S PERCEPTIONS OF PRISONER’S DILEMMA, CHICKEN, DICTATOR, AND ULTIMATUM GAMES
10.04 Harris, R.G., Robertson, P.E. and Xu, J.Y. THE INTERNATIONAL EFFECTS OF CHINA’S GROWTH, TRADE AND EDUCATION BOOMS
10.05 Clements, K.W., Mongey, S. and Si, J. THE DYNAMICS OF NEW RESOURCE PROJECTS A PROGRESS REPORT
10.06 Costello, G., Fraser, P., Groenewold, N. HOUSE PRICES, NON-FUNDAMENTAL COMPONENTS AND INTERSTATE SPILLOVERS: THE AUSTRALIAN EXPERIENCE
10.07 Clements, K. REPORT OF THE 2009 PHD CONFERENCE IN ECONOMICS AND BUSINESS
10.08 Robertson, P.E. INVESTMENT LED GROWTH IN INDIA: HINDU FACT OR MYTHOLOGY?
10.09 Fu, D., Wu, Y., Tang, Y. THE EFFECTS OF OWNERSHIP STRUCTURE AND INDUSTRY CHARACTERISTICS ON EXPORT PERFORMANCE
10.10 Wu, Y. INNOVATION AND ECONOMIC GROWTH IN CHINA
10.11 Stephens, B.J. THE DETERMINANTS OF LABOUR FORCE STATUS AMONG INDIGENOUS AUSTRALIANS
10.12 Davies, M. FINANCING THE BURRA BURRA MINES, SOUTH AUSTRALIA: LIQUIDITY PROBLEMS AND RESOLUTIONS
10.13 Tyers, R., Zhang, Y. APPRECIATING THE RENMINBI
10.14 Clements, K.W., Lan, Y., Seah, S.P. THE BIG MAC INDEX TWO DECADES ON AN EVALUATION OF BURGERNOMICS
10.15 Robertson, P.E., Xu, J.Y. IN CHINA’S WAKE: HAS ASIA GAINED FROM CHINA’S GROWTH?
10.16 Clements, K.W., Izan, H.Y. THE PAY PARITY MATRIX: A TOOL FOR ANALYSING THE STRUCTURE OF PAY
10.17 Gao, G. WORLD FOOD DEMAND
10.18 Wu, Y. INDIGENOUS INNOVATION IN CHINA: IMPLICATIONS FOR SUSTAINABLE GROWTH
10.19 Robertson, P.E. DECIPHERING THE HINDU GROWTH EPIC