in a Changing Ocean: Seawater Pacific Northwest Shellfish ... · Association (PCSGA) Represents...
64
Farming Shellfish in a Changing Ocean: Understanding the Effects of Acidified Seawater on the Pacific Northwest Shellfish Industry
Transcript of in a Changing Ocean: Seawater Pacific Northwest Shellfish ... · Association (PCSGA) Represents...

Farming Shellfish in a Changing Ocean:
Understanding the Effects of Acidified Seawater on the Pacific Northwest Shellfish Industry

Pacific Northwest Shellfish Industry
• Commercial harvest of shellfish in the Pacific Northwest dates from the 1860s
• Currently provides over 3000 family wage jobs for workers in WA, OR, CA, AK, and Hawaii
• Farm gate value of $110 million per year, representing a total contribution of $278 million annually to rural coastal communities

Pacific Coast Shellfish Growers Association (PCSGA)
Represents shellfish growers inOregon, Washington, Alaska,California, and Hawaii
Over 100 member companiesgrowing Pacific and Kumomotooysters, Manila and Geoduck Clams,and mussels
Oysters 94 million lbs/yrManila clams 8.5 million lbs/yr.

Pacific Coast Shellfish Growers Association (PCSGA)

Oyster Farming in Willapa Bay

Adapting to a changing ocean
Farmers like Brian Sheldon, whose family has relied on natural recruitment for three generations, are now being forced to look for new sources of seed
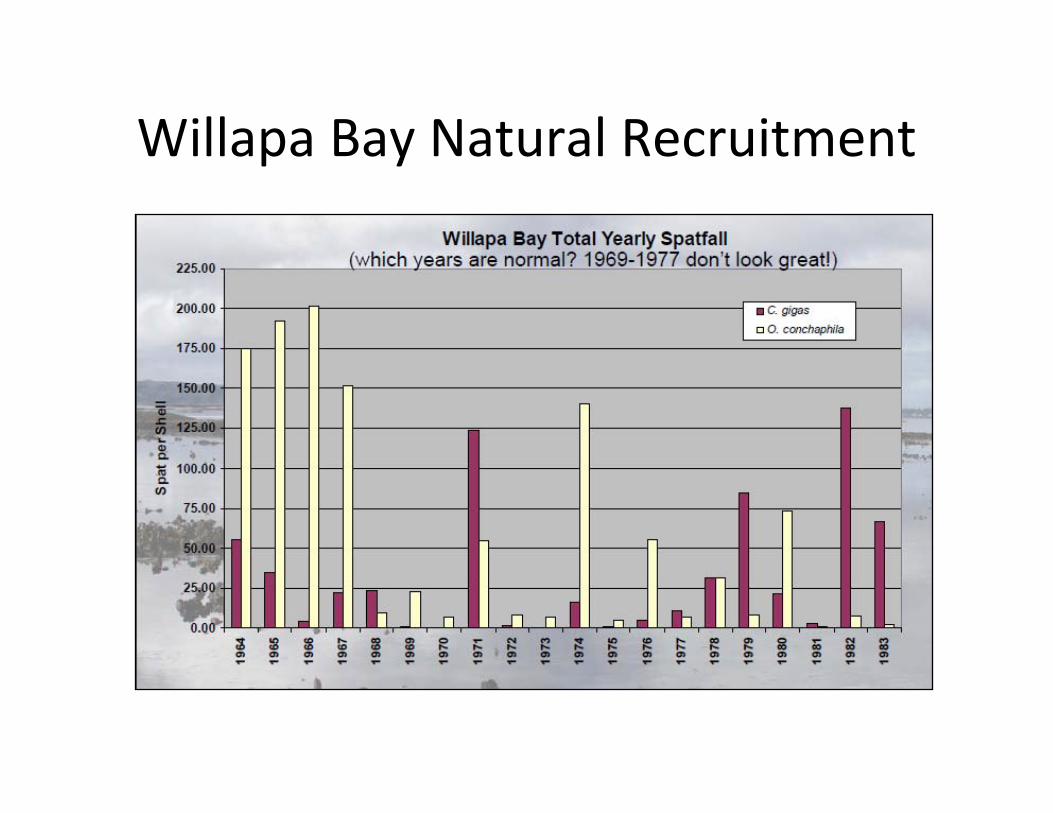
Willapa Bay Natural Recruitment

Commercial Hatchery Production
• Three major commercial hatcheries in the Pacific NW
‐ Two are located in close proximity in Hood Canal, WA
‐Whiskey Creek Shellfish Hatchery in Netarts Bay, OR
• Whiskey Creek Shellfish Hatchery
‐ 30 year history of consistent production
‐ Produces 75‐80% of all oyster larvae sold to independent
growers in the Pacific NW
‐ Experienced losses in 2007‐2008 that reduced production
to 25% of normal levels

Understanding the causes of larval mortality at Whiskey Creek
• Initial efforts focused on the marine bacterium vibrio tubiashii as the sole source of mortality in the hatchery
• In 2008, shifted focus to understanding the effects of low pH, upwelled seawater on larval survival and growth
>106 cfu/ml in seawatersamples from Netarts Bay
Estes, et al 2004

Arrows show the wind speed and direction
the longer the arrow,the stronger the wind
Winds from the North produceUpwelling of cold seawater
Colors show the Sea SurfaceTemperature (SST)
Blue ~ 14 deg CPurple ~ 10 deg C(upwelled seawater)

As noted, the North Pacific aragonite saturation horizons are among the shallowest in the global ocean (3). The uptake of anthropogenic CO2 has caused these horizons to shoal by 50 to100 m since preindustrial times so that they are within the density layers that are currently being upwelled along the west coast of North America.
These results indicate that the upwelling process caused the entire water column shoreward of the 50‐m bottom contour to become undersaturated with respect to aragonite, a condition that was not predicted to occur in open ocean surface waters until 2050 (5).
Feely et al 2008

Ca2+][CO32‐]
sp
Saturation State‐ the ‘Magic Number’ for dissolving shell
> 1 animals can make shell >>1 easier to make shell (Langdon & Atkinson, 2005) < 1 shell dissolves
Adult oyster shell ‐ calcite small Ksp harder to dissolve Larval oyster shell ‐ aragonite bigger Ksp easier to dissolve
Young oyster larvae ‐ ACC really big Ksp really easy to dissolve(Carriker & Palmer, 1979 Weiss et al 2002)

• Scenario 1 ‐ Direct Effects of Upwelling ‐ Slow growth and mass mortality of small larvae after 10‐12 days‐ Initial survival and swimming behavior of small larvae is often quite normal‐ Elevated pCO2 concentrations (and lower pH)‐ NO vibrio blooms in the bay‐ NO major mortality events with larger larvae
Upwelling ‐> Death of small larvae
• Scenario 2 ‐ Indirect Effects of Upwelling‐Mortality of larvae of all sizes in the hatchery ‐ Extremely high pCO2 concentrations (values >2500 uatm observed)‐ Persistent Upwelling leads to Hypoxia‐ Decaying organic matter supports bacteria blooms
Upwelling ‐> Algae Blooms ‐> Dieoff ‐> Decay ‐> Low O2 ‐> Death
Defining the problem

Tracking the Performance of Small Larvae in the Hatchery
GROWTH‐ days required to reach 120 umwhen larvae reach 120 microns and begin forming
an umbone, they are ‘out of the woods’
hatchery maintains detailed growth records
‐larvae are measured at each water change
SURVIVAL‐ tanks of DH → tanks of +100 screencoarse indicator of survival from DH past 120 microns
Normal‐ 4 tanks DH produces 6 tanks +100 larvae
Bad Water‐ 4 tanks DH yields 1 tank of +100 larvae
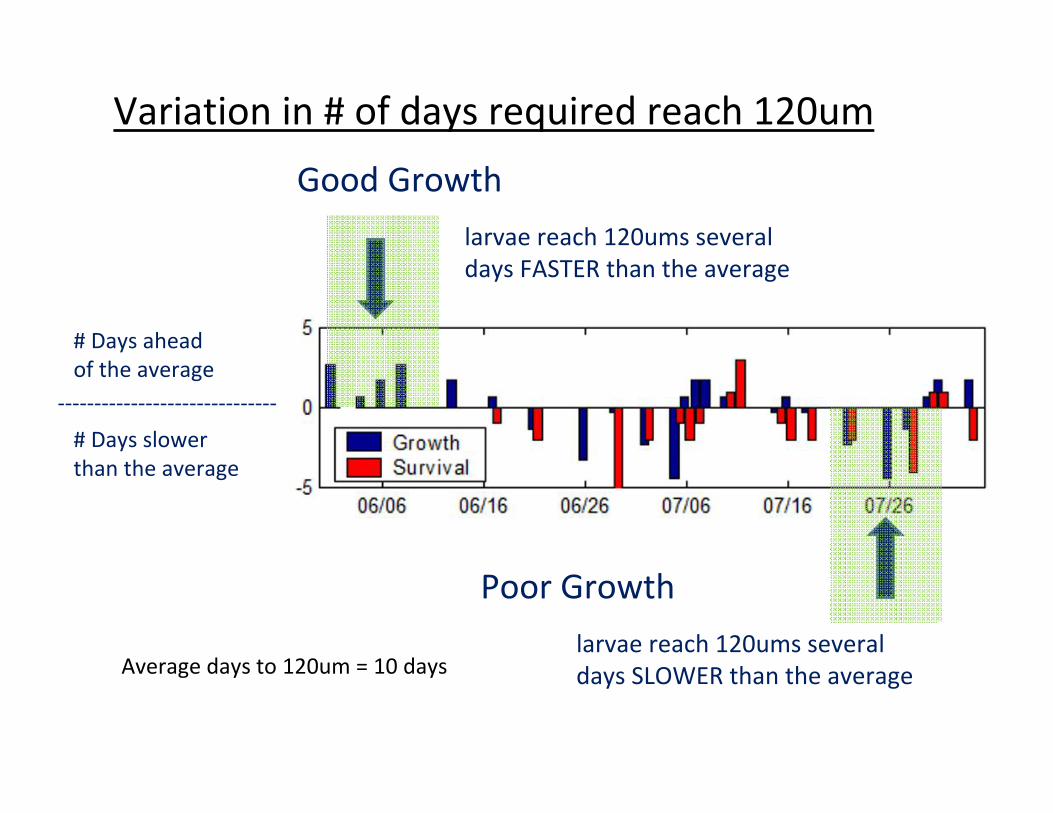
Good Growth
larvae reach 120ums severaldays FASTER than the average
Poor Growth
larvae reach 120ums severaldays SLOWER than the average
# Days aheadof the average
# Days slowerthan the average
Average days to 120um = 10 days
Variation in # of days required reach 120um
‐‐‐‐‐‐‐‐‐‐‐‐‐‐‐‐‐‐‐‐‐‐‐‐‐‐‐‐‐‐

Good Survival
more tanks of +100screen larvae than we started with
Poor Survival
less tanks of +100 screenlarvae than we started with
Gaining tanks
Losing tanks
‐‐‐‐‐‐‐‐‐‐‐‐‐‐‐‐‐
Variation in # tanks from DH to +100 screen

06/06 06/16 06/26 07/06 07/16 07/26-15
0
15
N S
win
d (m
/s)
06/06 06/16 06/26 07/06 07/16 07/2628
30
32
34
Sal
inity
(ppt
)
06/06 06/16 06/26 07/06 07/16 07/26-5
0
5P
erfo
rman
ce o
f Sm
all
Larv
ae (<
120
mic
rons
)
Growth Survival
06/06 06/16 06/26 07/06 07/16 07/260.5
1
1.5
2
2.5
A
rago
nite
Sat
urat
ion
Sta
te
N/S Winds
Salinity
Performance of Small Larvae
Ω – AragoniteSaturation State

Winds from the South
Lower Salinity28‐30 ppt
Fast Growth ofSmall Larvae
Ω > 1.7
06/06 06/16 06/26 07/06 07/16 07/26-15
0
15
N S
win
d (m
/s)
06/06 06/16 06/26 07/06 07/16 07/2628
30
32
34
Sal
inity
(ppt
)
06/06 06/16 06/26 07/06 07/16 07/26-5
0
5P
erfo
rman
ce o
f Sm
all
Larv
ae (<
120
mic
rons
)
Growth Survival
06/06 06/16 06/26 07/06 07/16 07/260.5
1
1.5
2
2.5
A
rago
nite
Sat
urat
ion
Sta
te
Winds from the North
High Salinity>33 ppt
Poor Growth and Survival of Small Larvae
Ω < 1 in AMShell dissolves

Winds from the South
Lower Salinity30‐31 ppt
Fast Growth andGood Survival of Small Larvae
Ω > 2Easy to form shell
06/06 06/16 06/26 07/06 07/16 07/26-15
0
15
N S
win
d (m
/s)
06/06 06/16 06/26 07/06 07/16 07/2628
30
32
34
Sal
inity
(ppt
)
06/06 06/16 06/26 07/06 07/16 07/26-5
0
5P
erfo
rman
ce o
f Sm
all
Larv
ae (<
120
mic
rons
)
Growth Survival
06/06 06/16 06/26 07/06 07/16 07/260.5
1
1.5
2
2.5
A
rago
nite
Sat
urat
ion
Sta
te

Winds from the South
High Salinity>33.5 ppt
Slow Growth andPoor Survival of Small Larvae
Ω < 1Shell dissolves
06/06 06/16 06/26 07/06 07/16 07/26-15
0
15
N S
win
d (m
/s)
06/06 06/16 06/26 07/06 07/16 07/2628
30
32
34
Sal
inity
(ppt
)
06/06 06/16 06/26 07/06 07/16 07/26-5
0
5P
erfo
rman
ce o
f Sm
all
Larv
ae (<
120
mic
rons
)
Growth Survival
06/06 06/16 06/26 07/06 07/16 07/260.5
1
1.5
2
2.5
A
rago
nite
Sat
urat
ion
Sta
te

06/06 06/16 06/26 07/06 07/16 07/26-15
0
15
N S
win
d (m
/s)
06/06 06/16 06/26 07/06 07/16 07/2628
30
32
34
Sal
inity
(ppt
)
06/06 06/16 06/26 07/06 07/16 07/26-5
0
5
Per
form
ance
of S
mal
lLa
rvae
(<12
0 m
icro
ns)
Growth Survival
06/06 06/16 06/26 07/06 07/16 07/260.5
1
1.5
2
2.5
A
rago
nite
Sat
urat
ion
Sta
te
South winds produce downwelling
Lower salinityΩ>>1 (easy to form shell)Fast growth and good survival of small larvae
North winds produce upwelling
Higher salinityΩ <= 1 (difficult or impossible to build shell)Poor growth and mass mortality of small larvae

Daily Variability in pH and Ω
Daily minimum pH – 7.65
6:00‐7:00 AM
Daily maximum pH – 8.6
1:00‐3:00 PM
Average AM Ω = 1.14
Average PM Ω = 1.60
*for all paired samples May‐Sept 2009

Managing around the problem
• Put small larvae into tanks filledin the afternoon or overnight
‐Works if the suns out
• 24 hour notice‐ Upwelling takes a day or two to start up, so when winds from the North, fill tanks late in the day and spawn like crazy
SPAWN!
DON’TSPAWN!

Managing around the problem
• Put small larvae into tanks filledin the afternoon or overnight
‐Works if the suns out
• 24 hour notice‐ Upwelling takes a day or two to start up, so when winds from the North, fill tanks late in the day and spawn like crazy
SPAWNLOTS!
DON’TSPAWN!

Continuous pCO2 data –the ‘Burkilator’
• Installed in April 2010
• Provides real‐time pCO2 measurements of incoming seawater
• Threshold for normal early development of small larvae:
≤ 300 uatm at 14° C
Burke Hales, Jesse Vance – OSU COAS

Egg Development – delayed mortality
Treated Seawater Control(buffered and degassed) (untreated)
pCO2= 349uatm @ 25°C, pCO2=759uatm @25°C
pH=8.25, tCO2=2580.97 pH=7.80, tCO2=2159.54
Initial Survival– 76.7% 65.8%
Survival at Day 10‐ 66.0% 0%
*Seawater conditions were manipulated for egg development ONLYAfter the first water change (t=48hrs), all larvae in the experiment were stored in
untreated seawater, and both groups saw identical water conditions until day 10The Control larvae in this experiment were irreparably damaged during egg development,
but mortality was not observed until day 10Data shown are average values from two replicate 6000 gallon tanks per treatment

Prolonged effects of seawater treatment on small larvae
Treated Seawater Control(buffered and degassed) (untreated)
pCO2= 350‐370uatm @ 25°C pCO2=650‐900uatm @25°C
Initial Survival– 64.2% 71.5%
Survival at Day 12‐ 58.2% 27.2%
Size class at Day 12‐ 41.0% 31.9%(% of larvae ≥ +100um screen)
*Treatment of seawater continued throughout the 12 day experiment Data shown are average values from three replicate 6000 gallon tanks per treatment

PCSGA monitoring program
• Experiments and equipment upgrades in commercial hatcheries
• Network of monitoring stations in commercially important bays
‐ Continuous pCO2 data‐ Continuous monitoring of pH, temp., salinity, DO, etc.‐ Dicrete samples – weekly AM/PM samples for DO,
carbonate chemistry, nutrients, and bacteria levels‐ Larval performance data
• Funds supplied by NOAA through Sen. Maria Cantwell last only until October 2011

Bellingham, WA‐ Lummi Hatchery
Dabob Bay, WA‐ Taylor Shellfish Hatchery
Gray’s Harbor, WA‐ setting stations
Willapa Bay, WA‐Tokeland, Bay Center, andNahcotta monitoring stations
Netarts Bay, OR‐Whiskey Creek Shellfish Hatchery
2011 Monitoring Stations

Dabob Bay, WA‐ Taylor Shellfish Hatchery
NOAA, UW, PCSGA, PSRF partnershipNewton, Feely, Sabine,etc.
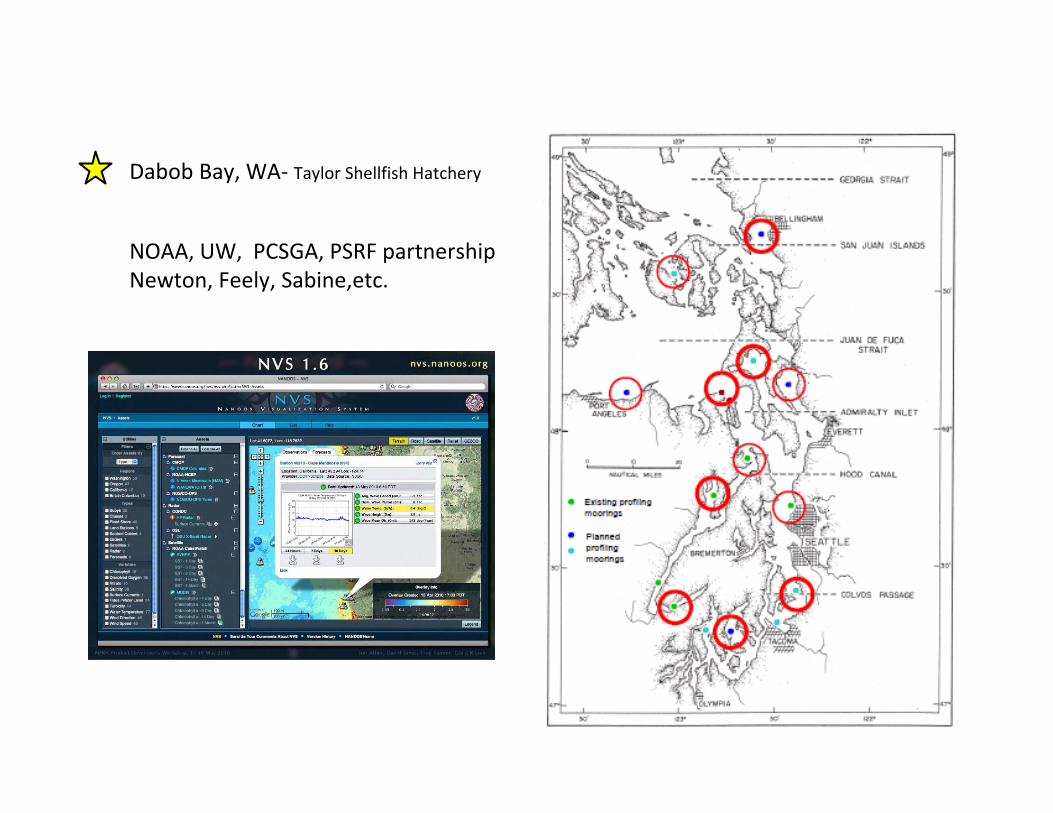
Dabob Bay, WA‐ Taylor Shellfish Hatchery
NOAA, UW, PCSGA, PSRF partnershipNewton, Feely, Sabine,etc.

Willapa Bay, WA‐Tokeland, Bay Center, andNahcotta monitoring stations
UW,PSI,WDFW,WRF partnershipTrimble,Suhrbier,Kaufman, etc.

Thanks to:
• NOAA and Senator Maria Cantwell’s office
• Chris Langdon and the Molluscan Broodstock Program
• Burke Hales, Jesse Vance, George Walbusser, and Joe Jennings (COAS)
• Richard Feely, Chris Sabine, and Jan Newton (UW,NOAA)
• Alan Trimble (UW), Andy Suhrbier (PSI), and Bruce Kaufman (WDFW)
• Ralph Elston (Aquatechnics), Claudia Hase (OSU), Carolyn Friedman, Steven Roberts, and Brent Vadopalas (UW)
Addressing Ocean Acidification throughAddressing Ocean Acidification through Research and Policy at the NOAA Aquaculture Programq g
December 2, 2010Ocean Acidification Task ForceOcean Acidification Task Force
Dr. Michael RubinoManager, NOAA Aquaculture ProgramManager, NOAA Aquaculture Program

Today’s TalkToday’s Talk
• Overview of US marine aquacultureO i f OAA’• Overview of NOAA’s Program
• Ocean Acidification Research
2

NOAA’s Definition of Aquaculture
Aquaculture is … qthe propagation and rearing of aquatic
i i ll d R t tiFinfish Farming
organisms in controlled or selected aquatic environments for any
Restorationg
ycommercial, recreational, or public purpose. Hatchery
Technology
3
Shellfish Farming Technology

Major U.S. Commercial Marine Farmed Speciesp
Shrimp Farming
Mussel FarmingOyster Farming
Mussel Farming
Salmon Farm
4Shellfish (Oysters, Clams & Mussels), Salmon & Marine ShrimpShellfish (Oysters, Clams & Mussels), Salmon & Marine Shrimp
Oyster Farming Salmon FarmSalmon Farming

Stock Enhancement & Restoration Aquaculture Supporting…
Commercial Fisheries – Salmon, oysters, king crabRecreational Fisheries Pacific rockfishesRecreational Fisheries – Pacific rockfishes, Gulf redfish, California white seabassHabitat – Oysters, grassesHabitat Oysters, grasses
5
Pacific Rockfish SalmonSalmonClamsKing Crab Chesapeake Oysters

Maine
6

New HampshireNew Hampshire
7

New England
8

Mussel culture projects underway In RI and MA, Northeast US
9

Rhode Island, Massachusetts,
10

Marylandy
11

VirginiaVirginia
12

North Carolina
13
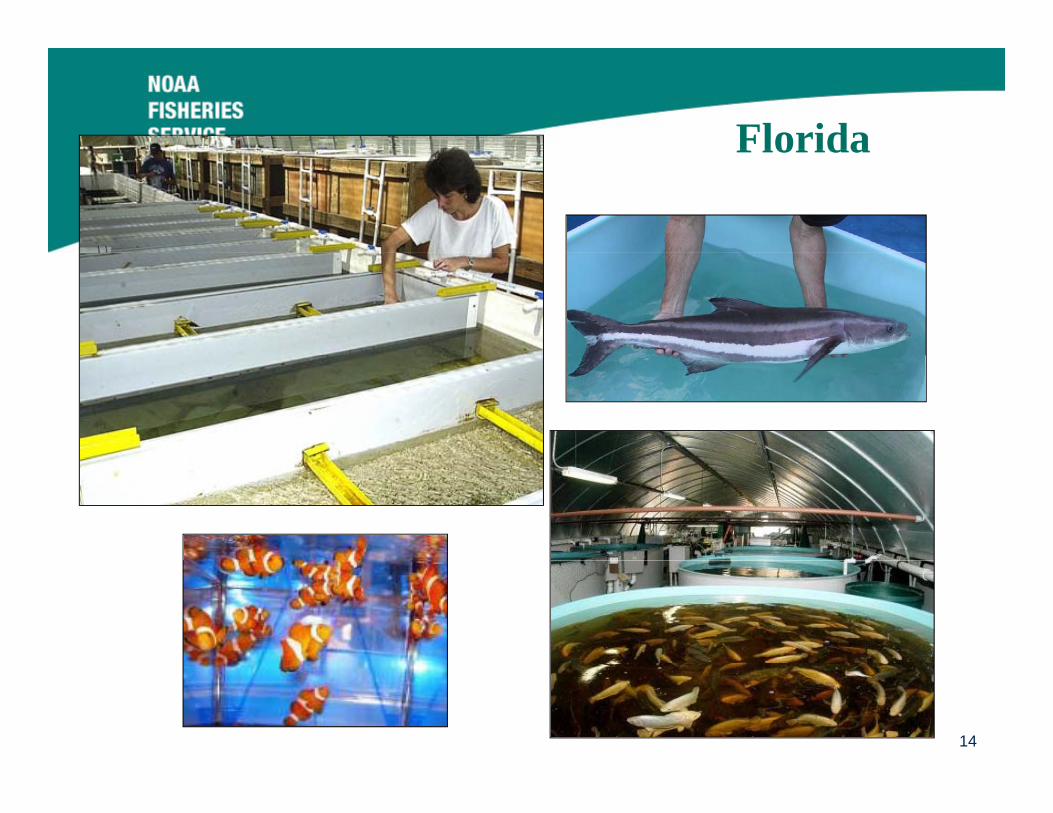
FloridaFlorida
14

Louisiana
15

C if iCalifornia
16

Washington Stateg
17

AAlaska
18

Hawaii
19

Common Features of Commercial U.S. Marine Aquacultureq
• Owner/operators: U.S. fishermen, seafood businesses
• Local, regional approaches and supportand support
• Working waterfronts• Range of technologiesg g• Synergies with commercial
and recreational fishing
20
• Innovative, sustainable

21

NOAA’s Aquaculture Program
• Regulation, Policy• Science, Innovation• Outreach and EducationOutreach and Education• International
22

Call for New NOAA Aquaculture Policy
“We will develop a national policy that focuses on the protection of ocean resources and marine ecosystemsprotection of ocean resources and marine ecosystems, addresses the fisheries management issues posed by aquaculture, and allows U.S. aquaculture to proceed in a sustainable way”
~ Dr. Jane Lubchenco, September 3, 2009 Dr. Jane Lubchenco, September 3, 2009
23

The New Policy will …
Address all forms of marine aquaculture – on land, coastal,
d ti
Address environmental, regulatory, and public outreach
t f ltopen ocean, production, enhancement, and restoration.
Enable sustainable aquaculture.
aspects of aquaculture.
Include principles for permitting aquaculture in federal waters.q
Protect ocean resources and marine ecosystems.
q
Include ample opportunity for public comment preceding the d l t f d ft li d
Address fisheries management issues posed by aquaculture.
development of a draft policy and once the draft is released.
24

Major Themes from Listening Sessions
• Advance science knowledge (incl. ocean acidification)• More aquaculture produced under U.S. laws rather than
importing most of our seafood• More closely align interests of fishing and aquaculture to
support working waterfrontssupport working waterfronts• Develop and refine innovative/sustainable forms of
aquaculture• Develop alternative feeds• Expand shellfish farming and restoration
25
• Mixed views on aquaculture in federal waters

Pacific Northwest Oyster Emergency
• Failure of larval oyster recruitments in recent years
• Hatchery failure threatens $100M industry• Hatchery failure threatens $100M industry
• Ocean acidification a potential factor in failures
• Larval oyster may be “canary in coal mine” for nearshore acidification
d i i d f d ($ )• NOAA administered emergency funds ($500K) to Pacific Coast Shellfish Growers Association for equipment and monitoring of water quality at oyster hatcheries in OR & WA
26
hatcheries in OR & WA

Northwest Fisheries Science Center –Ocean Acidification Research
• Experimental equipment to test effect of acidified conditions on shellfishacidified conditions on shellfish
• Field monitoring
• Advising shellfish industry and academic partners on research and monitoring efforts to assess seawater chemistry and i t ti ith i bi l thinteractions with microbial pathogens (vibrios).
27

NE Fisheries Science CenterNE Fisheries Science Center –Ocean Acidification Research
• Competition between different phytoplankton under ocean acidification scenarios – how doesunder ocean acidification scenarios how does acidification affect the food web?
• What shellfish species show the most• What shellfish species show the most susceptibility to changing pH? (evaluating hemocyte recovery rate after in vitro acidification)acidification)
• On what species and to what degree does acidification impact finfish & shellfish larvae?
28
acidification impact finfish & shellfish larvae?pH and calcium in hemocytes can be quantified using fluorescent probes

For More Information
NOAA’s National Aquaculture Program Office1315 East West Hwy1315 East-West Hwy
Silver Spring MD 20910Phone: (301) 713-9079Phone: (301) 713 9079
Contact: Dr. Michael Rubino, ManagerChris Botnick, Outreach Specialist
Email: [email protected]: http://aquaculture.noaa.gov
29

Questions?
Seafood ProductionSeafood Production
Science Knowledge/Innovation
Jobs
30
Habitat Restoration