IMS Performance Analyzer for z/OS IMS Problem Investigator for z/OS … · 2015-02-23 · IMS...
40
Insert Custom Session QR if Desired. IMS Performance Analyzer for z/OS IMS Problem Investigator for z/OS Updates Session 16720 Jim Martin March 2, 2015
Transcript of IMS Performance Analyzer for z/OS IMS Problem Investigator for z/OS … · 2015-02-23 · IMS...

InsertCustomSessionQR ifDesired.
IMS Performance Analyzer for z/OSIMS Problem Investigator for z/OS
UpdatesSession 16720
Jim Martin
March 2, 2015
Agenda
• IMS Performance Analyzer 4.4 Updates
• IMS Problem Investigator 2.4 Updates
• Other Key Features
2

IMS Performance Analyzer for z/OSVersion 4.4 Updates
3

Support Improvements
• IMS support
– Support for IMS Versions 13 and 14
• Inflight transaction support for IMS Log reports
– Transaction information that was previously incomplete dueto a log switch is now complete
• Region PST increased from 3 to 4 bytes
– Region PST field size increased due to an increase in themaximum partition specification table (MAXPST) limit to4095
4

Form-based reporting enhancements
• BMP treatment option
– New option to report each BMP syncpoint interval as a singletransaction
• Shared queues option
– New option to only report transactions that were processed onthe input Logs from included subsystems
• Program switches option
– New option to either report all transactions independently, or togroup transactions associated with a program switchsequence
1 of 2
5

Form-based reporting enhancements
• Additional reporting of CPU time as service units
– The service unit normalizes the reporting of CPU time to allowfor performance comparisons
• New value in QTYPE form field
– Form-field QTYPE has a new value, LOCALF, that indicatesthe shared queue transaction was processed ‘local-first’
• New region occupancy form field
– Form field “REGOCCUP” reports the elapsed time thetransaction occupies in a message region
2 of 2
6
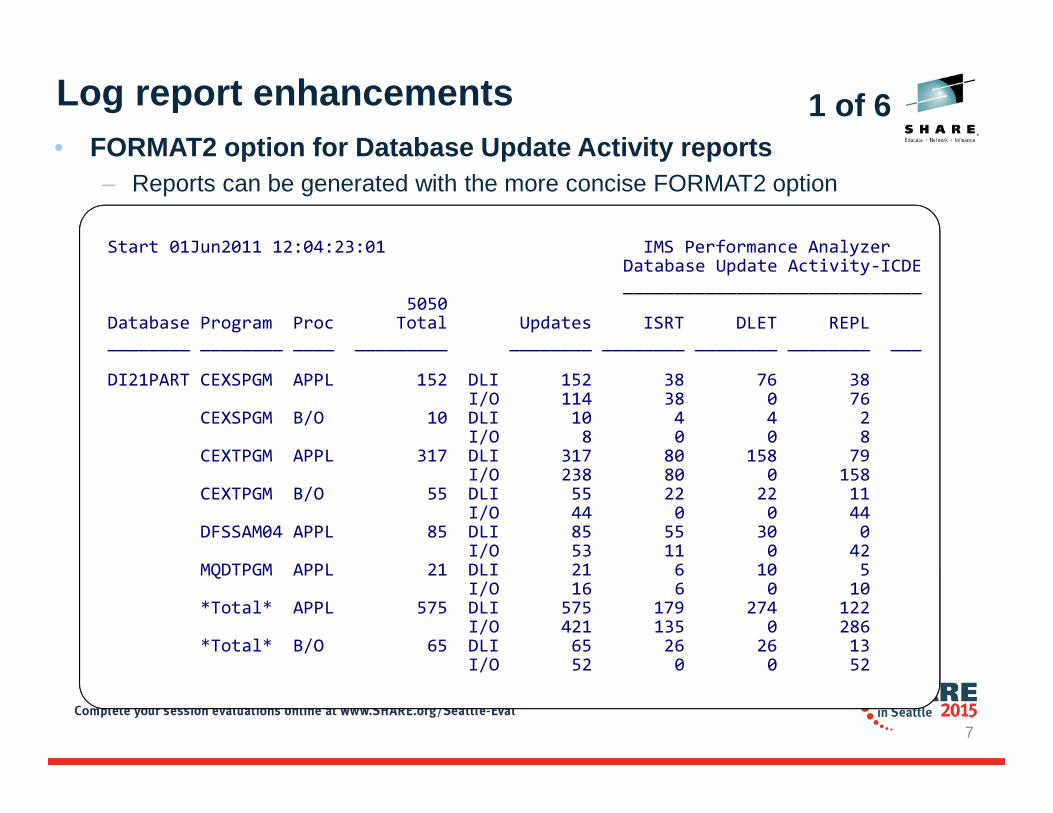
Start 01Jun2011 12:04:23:01 IMS Performance AnalyzerDatabase Update Activity-ICDE_____________________________
5050Database Program Proc Total Updates ISRT DLET REPL________ ________ ____ _________ ________ ________ ________ ________ ___
DI21PART CEXSPGM APPL 152 DLI 152 38 76 38I/O 114 38 0 76
CEXSPGM B/O 10 DLI 10 4 4 2I/O 8 0 0 8
CEXTPGM APPL 317 DLI 317 80 158 79I/O 238 80 0 158
CEXTPGM B/O 55 DLI 55 22 22 11I/O 44 0 0 44
DFSSAM04 APPL 85 DLI 85 55 30 0I/O 53 11 0 42
MQDTPGM APPL 21 DLI 21 6 10 5I/O 16 6 0 10
*Total* APPL 575 DLI 575 179 274 122I/O 421 135 0 286
*Total* B/O 65 DLI 65 26 26 13I/O 52 0 0 52
Log report enhancements
• FORMAT2 option for Database Update Activity reports
– Reports can be generated with the more concise FORMAT2 option
1 of 6
7
Log report enhancements
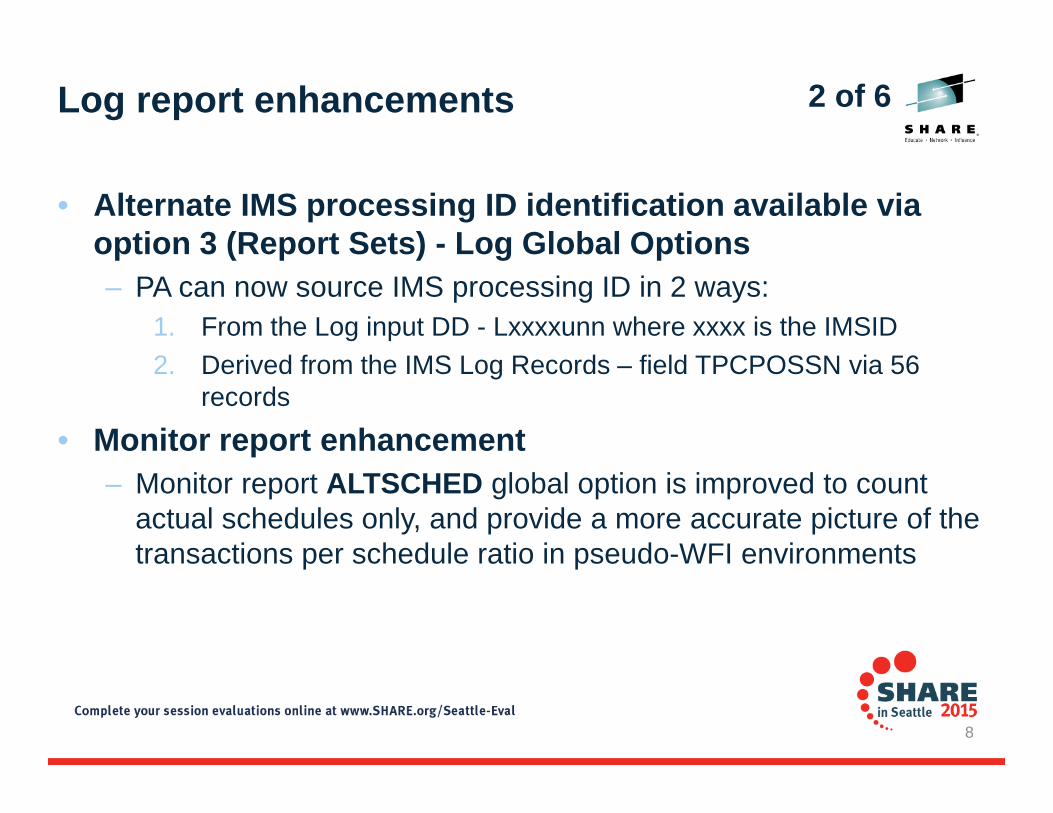
• Alternate IMS processing ID identification available viaoption 3 (Report Sets) - Log Global Options
– PA can now source IMS processing ID in 2 ways:
1. From the Log input DD - Lxxxxunn where xxxx is the IMSID
2. Derived from the IMS Log Records – field TPCPOSSN via 56records
• Monitor report enhancement
– Monitor report ALTSCHED global option is improved to countactual schedules only, and provide a more accurate picture of thetransactions per schedule ratio in pseudo-WFI environments
2 of 6
8

ATF - Record TraceSpecify report options.
Reports Required: Report Output DDnames:Trace Overview TRACE001Trace Detail TRACE002Trace Detail (Expanded) TRACE003
Report Options:Include Monitor events
Selection Criteria:Object Type Inc/Exc Object + List Validation Warning
Transaction CodeUser IDIMS Subsystem IDProgram
• OMEGAMON ATF Trace Report Enhancement
– Provides additional transaction characteristics
– Provides reporting detail for DB2 SQL and WebSphere MQ events
Log report enhancements 3 of 6
When selecting TraceDetail reports, include
Monitor events forgreater details
9

CEXGARPT - Gap AnalysisCommand ===>
Specify report options. ————— Report Interval ——————YYYY/MM/DD HH:MM:SS:TH
Report Output DDname GAPS FromTo
Processing Options:Gap Threshold . . . 1.500000 seconds (s.thmiju)
• Quickly identify potential performance issues by locatingperiods of time when log records are not being written
– Requires IMS Connect Extensions archive journals
• User customizable Gap threshold lets you choose what an“acceptable” gap really is.
Log report enhancements
IMS Connect Gap Analysis Report
4 of 6
10

• LOGINFO operand
– Use IMSPALOG LOGINFO batch command to generateLog Info report without Running a report set.
Log report enhancements
Code Count MCNT Recs/Sec Avg len Max Len Byte/Sec MB %
01 IN 21,342 0 1,725 3,240 96 36.8 6.3 IMS Message
INPUT 15,072 0 1,727 3,240 67 26.0 4.5 Input message
MSC FE 134 0 1,032 1,912 0 0.1 0.0 MSC front end
MSC BE 3,418 0 1,193 3,240 10 4.0 0.7 MSC back end
CONTINUE 2,718 0 2,417 3,240 17 6.5 1.1 Continuation record
03 OUT 15,256 0 2,081 3,240 82 31.7 5.4 IMS Message
OUTPUT 14,602 0 2,138 3,240 81 31.2 5.3 Output message
MSC BE 137 0 1,749 2,672 0 0.2 0.0 MSC back end
MSG SWI 517 0 551 800 0 0.2 0.0 Message switch
07 41,039 50,985 0 456 456 48 18.7 3.2 Program schedule end
MPP 32,753 34,446 0 456 456 38 14.9 2.6 MPP
QUICK 8,190 16,463 0 456 456 9 3.7 0.6 MPP quick reschedule
FALSE 12 0 0 456 456 0 0.0 0.0 MPP false schedule
BMP 15 0 0 456 456 0 0.0 0.0 BMP
ABEND 69 76 0 456 456 0 0.0 0.0 Abended transaction
08 41,040 0 148 148 15 6.0 1.0 Program schedule start
MPP 32,835 0 148 148 12 4.8 0.8 MPP
QUICK 8,190 0 148 148 3 1.2 0.2 MPP quick reschedule
5 of 6
11

• Gap Analysis Report
– New option to ignore type x’6D’ surveillance records that canmask periods of system inactivity
• Fast Path Region Occupancy Report
– Exploits the new type x’5904’ record to provide a clearerbreakdown of occupied versus idle time
• Internal Resource Usage (IRUR) Report
– Enhanced to support the new statistics provided by IMS versions12, 13 and 14
Log report enhancements 6 of 6
12

IMS Problem Investigator for z/OSVersion 2 Release 4 Updates
13

Support Improvements:
• IMS Version 14 support
– Supports new and changed log record types introducedin IMS V14.
• DB2® Version 11 support
– Support for DB2 logs in extended 10-byte RBA andLRSN format
– Improved DB2 log record type recognition
14

Command ===> TIMEOUT 15 Scroll ===> CSRForwards / Backwards . . 00.03.00.000000 Time of Day . .Code Description Date 2013-11-20 Wednesday LSN
/ ———— —————————————————————————————————————————————————————— ————————————————01 Input Message TranCode=MQATREQ1 000000000000544F31 DLI GU TranCode=MQATREQ1 Region=0001 00000000000054505600 Sign-on to ESAF Region=0001 SSID=MQP1 00000000000054515600 Thread created for ESAF SSID=MQP1 0000000000005452
Log Browser “Timeout” settings
• Use TIMEOUT primary command to avoid delays whenbrowsing large log files.
– set timeout values of 1 - 99 seconds, or 0 for no timeout.
15

——————————————————————————————————————————————————————————————————————————————BROWSE IPI000.QADATA.WGNIMS01.VC10.ICDE001 + FINDLIM ReachedCommand ===> Scroll ===> CSR
Navigate < 00.00.01.000000 > Date/Time 2011-06-01 12.04.23.008757/ ———— Tracking ———————————————————————— Wednesday 2011-06-01 Time (LOCAL)
01 Input Message TranCode=CEXTCONV 12.04.27.14492035 Input Message Enqueue TranCode=CEXTCONV 12.04.27.14596431 DLI GU TranCode=CEXTCONV Region=0002 12.04.27.146473
New reasons for not reaching “Bottom of Data”
• If the log browser does not reach the end of the selected files, thelabel now offers one of the following reasons:
– FINDLIM reached (find limit)
– ATTN interrupt
– TIMEOUT reached (timeout value)
– DURATION reached (time slice duration)
16

Forwards / Backwards . . 00.03.00.000000 Time of Day . .Code Description Date 2013-11-20 Wednesday Time (GMT)
/ ———— —————————————————————————————————————————————————————— ————————————————01 Input Message 04.04.59.944276
UTC=12.04.59.935300 TranCode=MQATREQ1 Userid=IPI2 LTerm=IPI2Terminal=VAPIPI2B OrgUOWID=IDDF/CC4A42B41B604B06
————————————————————————————————————————————————————————————————————————————31 DLI GU 04.04.59.944287
UTC=12.04.59.944283 TranCode=MQATREQ1 Region=0001OrgUOWID=IDDF/CC4A42B41B604B06 RecToken=IDDE/0000019500000000
| Display Settings || || Show separation line between log records (in expanded view): || 1 1. Always || 2. Only when the file changes || 3. Only when the file changes and tracking is active || 4. Never |
New Display Options
• Control the visibility of the expanded view record separator line
1 of 4
17

Code Description Date 2008-01-25 Friday LSN/ ———— —————————————————————————————————————————————————————— ————————————————
CA01 Transaction TranCode=MQATREQ1 Region=0001 IMS-00000000000101 Input Message TranCode=MQATREQ1 IMS-0000000006E835 Input Message Enqueue TranCode=MQATREQ1 IMS-0000000006E931 DLI GU TranCode=MQATREQ1 Region=0001 IMS-0000000006EA5E SB Handler requests Image Capture Region=0001 IMS-0000000006EB5050 Database REPL Database=DI21PART Region=0001 IMS-0000000006EC5050 Database DLET Database=DI21PART Region=0001 IMS-0000000006ED5052 Database insert into KSDS Database=DI21PART IMS-0000000006EF5600 Sign-on to ESAF Region=0001 SSID=DB3A IMS-0000000006F10020 Begin UR DB2-00000291A8040600 Update in-place in a data page DB2-00000291A8940600 Savepoint DB2-00000291A8DA0600 Delete from a data page DB2-00000291A909
| —————————————————————————————————————————————————————————————————— || Display Settings || || Display LSN (Log Sequence Number): || 2 1. Always, and prepend the merge file number e.g. 1-nnn, 2-nnn || 2. Always, and prepend the record type e.g. IMS-nnn, DB2-nnn || 3. Never (only Time will be displayed) |·—————————————————————————————————————————————————————————————————————·
New Display Options
Control thedisplay andformat of thelog sequencenumber(LSN)
2 of 4
18
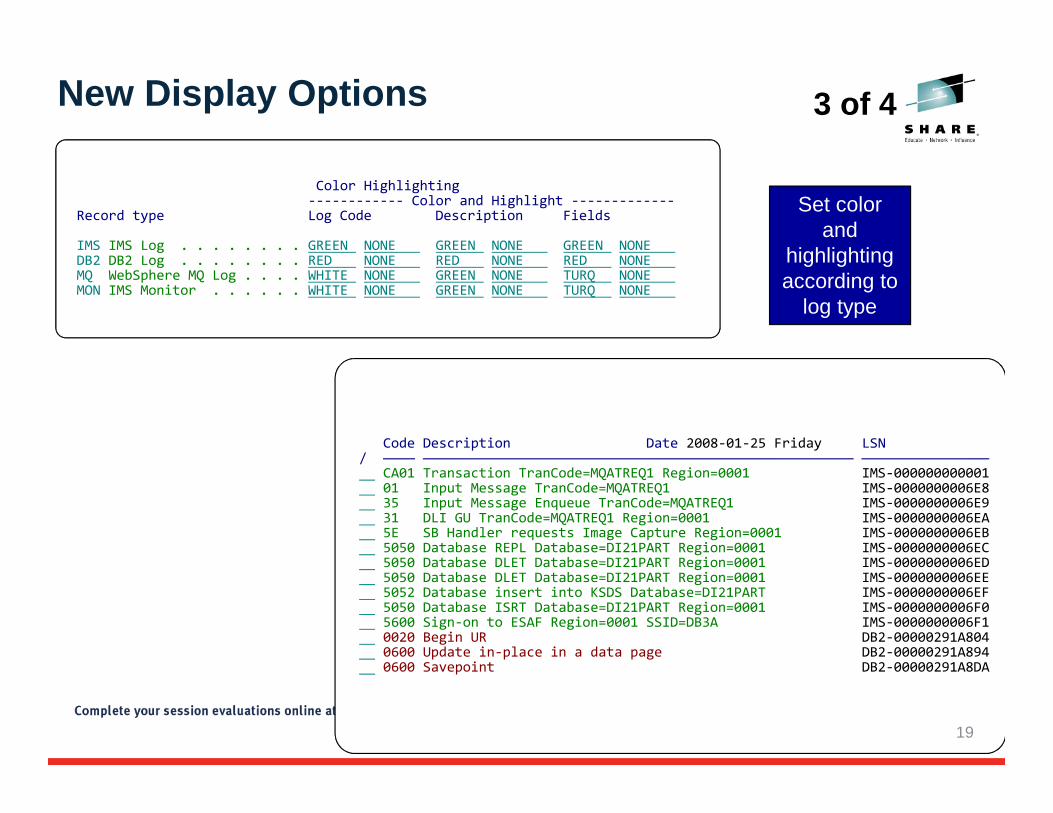
Code Description Date 2008-01-25 Friday LSN/ ———— —————————————————————————————————————————————————————— ————————————————
CA01 Transaction TranCode=MQATREQ1 Region=0001 IMS-00000000000101 Input Message TranCode=MQATREQ1 IMS-0000000006E835 Input Message Enqueue TranCode=MQATREQ1 IMS-0000000006E931 DLI GU TranCode=MQATREQ1 Region=0001 IMS-0000000006EA5E SB Handler requests Image Capture Region=0001 IMS-0000000006EB5050 Database REPL Database=DI21PART Region=0001 IMS-0000000006EC5050 Database DLET Database=DI21PART Region=0001 IMS-0000000006ED5050 Database DLET Database=DI21PART Region=0001 IMS-0000000006EE5052 Database insert into KSDS Database=DI21PART IMS-0000000006EF5050 Database ISRT Database=DI21PART Region=0001 IMS-0000000006F05600 Sign-on to ESAF Region=0001 SSID=DB3A IMS-0000000006F10020 Begin UR DB2-00000291A8040600 Update in-place in a data page DB2-00000291A8940600 Savepoint DB2-00000291A8DA
Color Highlighting------------ Color and Highlight -------------
Record type Log Code Description Fields
IMS IMS Log . . . . . . . . GREEN NONE GREEN NONE GREEN NONEDB2 DB2 Log . . . . . . . . RED NONE RED NONE RED NONEMQ WebSphere MQ Log . . . . WHITE NONE GREEN NONE TURQ NONEMON IMS Monitor . . . . . . WHITE NONE GREEN NONE TURQ NONE
New Display Options
Set colorand
highlightingaccording to
log type
3 of 4
19

Command ===> EXTRACT 'JM3.IMS.TEST' MOD Scroll ===> extrForwards / Backward Time of Day . .Code Description Date 2008-01-25 Friday LSN
/ ———— —————————————————————————————————————————————————————— ————————————————CA01 Transaction TranCode=MQATREQ1 Region=0001 IMS-00000000000E01 Input Message TranCode=MQATREQ1 IMS-00000000083135 Input Message Enqueue TranCode=MQATREQ1 IMS-00000000083231 DLI GU TranCode=MQATREQ1 Region=0001 IMS-000000000833
New Display Options
• Time of day remembered for each file in the Process list
– Log file in the process list now remembers its last date andtime position in the log file.
• MOD option for EXTRACT primary command
– Append new records to an existing extract data set using theEXTRACT primary command and the MOD option.
4 of 4
20

Code Description LSN/ ———— —————————————————————————————————————————————————————— ————————————————
5050 Database REPL Database=DI21PART Region=0001 IMS-0000000006EC5050 Database DLET Database=DI21PART Region=0001 IMS-0000000006ED5050 Database DLET Database=DI21PART Region=0001 IMS-0000000006EE5052 Database insert into KSDS Database=DI21PART IMS-0000000006EF5050 Database ISRT Database=DI21PART Region=0001 IMS-0000000006F05051 Database change unsuccessful IMS-0000000007075050 Database DLET Database=DI21PART Region=0001 IMS-0000000007085050 Database DLET Database=DI21PART Region=0001 IMS-0000000007095052 Database insert into KSDS Database=DI21PART IMS-00000000070A5050 Database ISRT Database=DI21PART Region=0001 IMS-00000000070B5050 Database REPL Database=DI21PART Region=0001 IMS-00000000071F
IMS log type x’50’ database update enhancements
• IMS type x’50’ database update record is now split into 3 subtypes toimprove understanding of the update taking place
21

Data Set Name . . : JM3.IMS.TEST
The IMS transaction index is not sorted in transaction start timesequence. When indexes are built, the records are written as soon aspossible after the transaction completes.
Sorting the index into start time sequence has the followingadvantages:
1. The transactions will be displayed in the order that they arrivein IMS.
2. Tracking against the index, when merged with its associated IMSlog, will show the index record at the top (start of thetransaction).
Use the SORT line action from the process list to sort the index.
Do not show me this message again
Detect unsorted Transaction Index and issue warning message
22

Schedule Tracking and Time Zone Checking
• TX or TU line command against CA01 for a non-messagedriven BMP invokes “schedule tracking”
– Tracks all the units of recovery within a single programschedule
• Time Zone Checking option
– Issues a message when the time zone detected in the logfile differs from the time zone being used to process the file
23

Mobile Workload Pricing using IMSPI
IMS Problem Investigator forz/OS version 2.3 APAR PI23921/ PTF UI20951 makes it simplerfor you to create a CSV thatcontains IMS transaction CPUusage information. The CSV canthen assist you to measure yourmobile workload for IBM MobileWorkload Pricing for z/OS.
A simple one-step commandCSV FORM(MWP) produces:
24

Other Key Features toConsider
25

LOGINFO – what am I collecting in my IMS log?
• Provides a quick recap of the type and volume of records in the IMS log
• This report is always produced when you run IMS PA and PI
V4R3M0 IMS Performance Analyzer - Log Information
Log data From 2014-06-29 14:58:00.941667 To 2014-06-29 15:12:39.354269 Duration 14:38.412602
-------------------------------------- In ---------------------------------------Code Count MCNT Recs/Sec Ave len Max Len Byte/Sec MB %01 IN 21,342 24 1,725 3,240 41,942 36.8 6.3 IMS MessageINPUT 15,072 17 1,727 3,240 29,655 26.0 4.5 Input messageMSC FE 134 0 1,032 1,912 157 0.1 0.0 MSC front endMSC BE 3,418 3 1,193 3,240 4,644 4.0 0.7 MSC back end01 OUT 291 0 1,410 3,157 467 0.4 0.1 IMS MessageMSC FE 149 0 1,486 2,325 252 0.2 0.0 MSC front endMSG SWI 142 0 1,331 3,157 215 0.1 0.0 Message switch03 IN 97,160 110 2,176 3,240 240,902 211.5 36.2 IMS MessageINPUT 25,643 29 1,218 3,240 35,597 31.2 5.3 Program switchMSC FE 7,661 8 3,235 3,240 28,234 24.7 4.2 MSC front endMSC BE 11,236 12 807 3,240 10,337 9.0 1.6 MSC back endCONT 52,620 59 2,782 3,240 166,731 146.3 25.0 Continuation03 OUT 15,257 17 2,081 3,240 36,166 31.7 5.4 IMS MessageOUTPUT 14,603 16 2,138 3,240 35,568 31.2 5.3 Output messageMSC BE 137 0 1,749 2,672 272 0.2 0.0 MSC back endMSG SWI 517 0 551 800 324 0.2 0.0 Message switch07 41,039 50,985 46 456 456 21,314 18.7 3.2 Program schedule endMPP 32,753 34,446 37 456 456 17,010 14.9 2.6 MPPQUICK 8,190 16,463 9 456 456 4,253 3.7 0.6 MPP quick rescheduleFALSE 12 0 0 456 456 6 0.0 0.0 MPP false scheduleBMP 15 0 0 456 456 7 0.0 0.0 BMPABEND 69 76 0 456 456 35 0.0 0.0 ABEND08 41,040 46 148 148 6,917 6.0 1.0 Program scheduleMPP 32,835 37 148 148 5,534 4.8 0.8 MPPQUICK 8,190 9 148 148 1,380 1.2 0.2 MPP quick rescheduleBMP 15 0 148 148 2 0.0 0.0 BMP
26
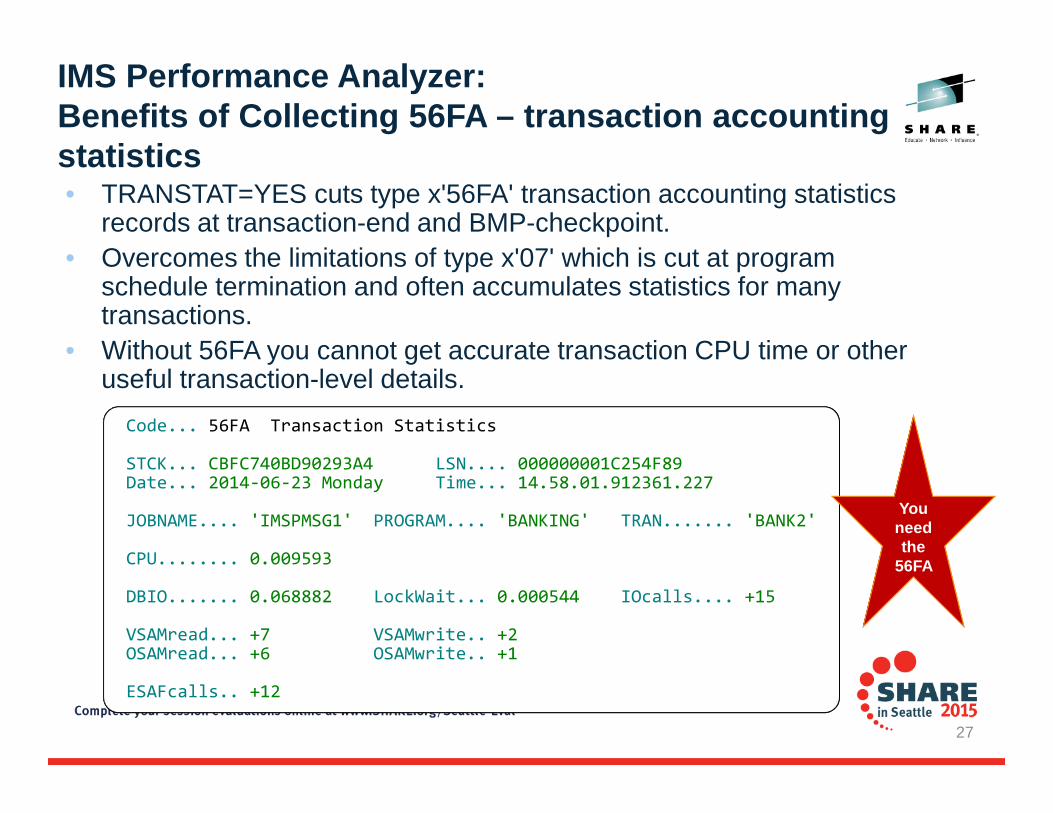
Code... 56FA Transaction Statistics
STCK... CBFC740BD90293A4 LSN.... 000000001C254F89Date... 2014-06-23 Monday Time... 14.58.01.912361.227
JOBNAME.... 'IMSPMSG1' PROGRAM.... 'BANKING' TRAN....... 'BANK2'
CPU........ 0.009593
DBIO....... 0.068882 LockWait... 0.000544 IOcalls.... +15
VSAMread... +7 VSAMwrite.. +2OSAMread... +6 OSAMwrite.. +1
ESAFcalls.. +12
IMS Performance Analyzer:Benefits of Collecting 56FA – transaction accountingstatistics• TRANSTAT=YES cuts type x'56FA' transaction accounting statistics
records at transaction-end and BMP-checkpoint.
• Overcomes the limitations of type x'07' which is cut at programschedule termination and often accumulates statistics for manytransactions.
• Without 56FA you cannot get accurate transaction CPU time or otheruseful transaction-level details.
Youneedthe
56FA
27

IMS Performance Analyzer - IMS transaction index
IMSPerformanceAnalyzer
IMSProblemInvestigator
IMS PA batch job condensesall IMS log records forone IMS transaction intoone Transaction Index record
Save processing time by usingTransaction Index as inputto IMS PA instead of IMS log
Transaction Index contains performanceinformation (such as response time) derivedfrom IMS log fields, enabling more intelligentfiltering and analysis in IMS PI
IMS log
TransactionIndex
Whether Full or Exception, all the accumulated information from the IMS log about eachtransaction is condensed into a single transaction index record.
Use the transaction index as input into:
IMS PA reporting - Instead of re-processing large SLDS log files
IMS PI analysis - To enable more intelligent problem detection“Inflight” option allows
for continuous logprocessing without
missing a beat.
28

IMS Performance Analyzer: Distributions and ServiceLevels
Once you have an index (or straight from the log) you can start to get answers:
Ensure transactions are performing according to management-definedservice levels
User-defined thresholds, for example - <0.1, 01 to 0.5, >0.5 seconds etc.
Report as either a percentage (of all transactions) or as a countResponse Time Distribution
Min Avg Max <0.01 <0.05 <0.10 <0.20 <0.50 >=0.50 >=0.50
Tran Total Total Total Total Total Total Total Total Total Total
Trancode Count IMS Time IMS Time IMS Time IMS Time IMS Time IMS Time IMS Time IMS Time IMS Time IMS Time
BALANCE 89 0.045362 0.119435 1.493757 1.12% 31.46% 85.39% 91.01% 93.26% 6.74% 6
LOGON 92 0.028291 0.158065 1.667653 1.09% 31.52% 72.83% 85.87% 93.48% 6.52% 6
ORDER 95 0.017040 0.117309 0.833115 0.00% 35.79% 80.00% 86.32% 94.74% 5.26% 5
PAY 936 0.004527 0.019000 0.358372 33.76% 94.87% 98.18% 99.47% 100.00% 0.00% 0
STOCK 98 0.025835 0.103145 0.812622 0.00% 29.59% 83.67% 89.80% 95.92% 4.08% 4
TRANSFER 78 0.015636 0.118776 0.765933 0.00% 44.87% 78.21% 80.77% 96.15% 3.85% 3
WITHDRAW 105 0.026213 0.110366 1.556585 0.00% 29.52% 75.24% 89.52% 96.19% 3.81% 4
Service Level dictates that 95% of transactions must have response time less than 0.5 seconds, then…PAY, STOCK, TRANSFER, WITHDRAW do meet the required level of service – OKBALANCE, LOGON, ORDER do not meet the required level of service – Fail
29

IMS Syncpoint Analysis using IMS Performance Analyzer:How is it affecting response times?
Syncpoint analysis
Process CPU DB Syncpt Phase 1 Phase 2 Phase 2 OTHREADTrancode Count Time Time Calls Time Time Time FP Time Time
BANK1 18 0.041045 0.006635 8 0.014769 0.000030 0.014739 0.014739 0.000980BANK2 26 0.051985 0.005922 8 0.000071 0.000032 0.000039 0.000039 0.001107BANK3 280 0.048873 0.004889 23 0.000038 0.000018 0.000019 0.000019 0.001203ORDERS 299 0.044485 0.004687 23 0.000034 0.000017 0.000017 0.000017 0.001200MOBILE1 316 0.040288 0.004833 23 0.000789 0.000019 0.000771 0.000028 0.000789MOBILE2 307 0.057567 0.004862 23 0.000037 0.000018 0.000019 0.000019 0.001195MOBILE3 282 0.033802 0.004694 23 0.000036 0.000019 0.000016 0.000016 0.001191WEBORDER 19 0.039227 0.007359 9 0.000076 0.000034 0.000043 0.000043 0.001057STOCK1 21 0.036017 0.006329 9 0.000070 0.000031 0.000039 0.000039 0.001034STOCK2 15 0.299056 0.020897 21 0.000053 0.000036 0.000016 0.000016 0.000983STOCK3 16 0.372236 0.020957 21 0.000056 0.000039 0.000017 0.000017 0.001064Total 18,243 0.089237 0.010805 11 0.000116 0.000027 0.009074 0.000012 0.001106
Are you using external subsystems and DASD mirroring? These mightaffect the time it takes for your transactions to commit:• Total syncpoint time• Phase 1• Phase 2• Phase 2 attributable to Fast Path database only• OTHREAD time to complete (asynchronous – not part of SYNCPT)
30

IMS Performance Analyzer - Shared queues AnalysisLocal-first and false scheduling
Shared queues transaction performance
Avg Avg Avg Avg >1.0 >1.0 Avg Max >0.1
Queue Tran InputQ Process OutputQ Total InputQ Process CPU CPU CPU
IMS ID Type Count Time Time Time Time Time Time Time Time Time
IMS1 GLOBAL 493 0.152755 0.353057 0.111123 0.613036 4.26% 11.76% 0.018737 0.199393 5.77%
IMS1 LOCAL 222 0.164432 0.567554 0.000162 0.732051 4.05% 21.62% 0.028475 0.199393 7.37%
IMS1 LOCALF 8701 0.003339 0.056002 0.208816 0.249786 0.10% 0.92% 0.007174 15.15835 0.32%
IMS2 GLOBAL 472 0.157556 0.432707 0.000675 0.590806 4.45% 15.89% 0.023619 0.236885 6.86%
IMS2 LOCAL 224 0.234427 0.457905 0.000130 0.692367 7.14% 16.52% 0.022103 0.208415 5.58%
IMS2 LOCALF 8131 0.002857 0.065651 0.190159 0.242889 0.00% 0.97% 0.012947 31.13607 0.47%
Total 18243 0.015950 0.089237 0.186943 0.276655 0.42% 2.07% 0.010805 31.13607 0.87%
Region overview
MPP ******* DLI Calls ******* WFI **** Schedule Distribution ****Total CPU Sched Trans DB DC Other SUBQ6 Quick =0 =1 >1
------- ------- ------- ------- ------- ------- ------- ------- ----- ------- ------- -------Total 181858 4636 16842 178088 41165 24530 41556K 6279 Sched 1408 2131 1097/Sched 39 1.0 3.6 38.4 8.9 5.3 8963 1.4 Tran 0 2365 14477/Tran 10 0.3 1.0 10.6 2.4 1.5 2467 Tr/Sch 0 1 13/Minute 30309 772.7 2807.0 29681.3 6860.8 4088.3 6926016 1046.5 Sc/Min 234.7 355.2 182.8% Total 100.00 100.00 100.00 100.00 100.00 100.00 100.00 100.00 %Sched 30.37 45.97 23.66
1. IMS workload broken down by queue type: GLOBAL – shared queues where transactions came in on another system
LOCAL – shared queues where transactions came in on this system
LOCALF – local-first where shared queue was bypassed
2. False schedule and WFI analysis:
31

IMS Performance Analyzer - Program Switch AnalysisFollowing the Trail of Transactions
Transaction BANK0001 originated from lterm NEWYORK at 14.58.02.023922It switched to trancode BANK0010Trancode BANK0010 then switched to BANK0011Four (4) further switches to Trancode BANK0015 completed the sequenceThe overall transaction response time is always reported against theoriginating transaction – 4.467306 seconds – from when the originatingtransaction arrived on the message queue to when a response was sent backto the terminalThe last transaction in the sequence responded back to the terminal – you cantell because it has an output queue timeNotice the long switch times for the last 2 transactions – this contributed toalmost 0.5 seconds of the response time
32
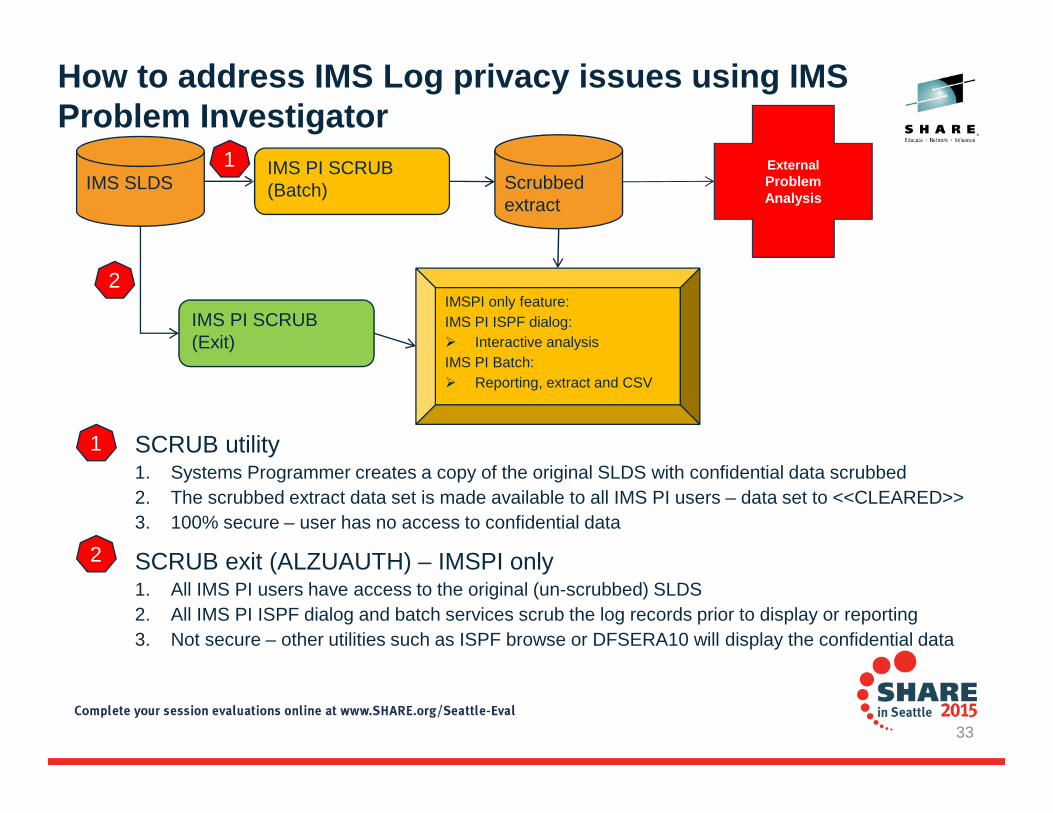
How to address IMS Log privacy issues using IMSProblem Investigator
IMS SLDSIMS PI SCRUB(Batch) Scrubbed
extract
IMSPI only feature:
IMS PI ISPF dialog:
Interactive analysis
IMS PI Batch:
Reporting, extract and CSV
IMS PI SCRUB(Exit)
1
2
1 SCRUB utility1. Systems Programmer creates a copy of the original SLDS with confidential data scrubbed
2. The scrubbed extract data set is made available to all IMS PI users – data set to <<CLEARED>>
3. 100% secure – user has no access to confidential data
SCRUB exit (ALZUAUTH) – IMSPI only1. All IMS PI users have access to the original (un-scrubbed) SLDS
2. All IMS PI ISPF dialog and batch services scrub the log records prior to display or reporting
3. Not secure – other utilities such as ISPF browse or DFSERA10 will display the confidential data
2
External
ProblemAnalysis
33

IMS Problem Investigator batch reporting
Code Description Date 2011-06-17 Friday Time Elapsed LSN Rec#
---- ------------------------------------------------------ ------------------- --------------- ---------------- ---------
01 Input Message 21.57.00.950009.909 0.078041 0000000005AD82B0 9752
TranCode=CDB41PDS Userid=EVHWBUDR LTerm=4012 Terminal=4012
OrgUOWID=BUDR/C7EF90B3BC1BD08C Port=4012 LogToken=C7EE6AA5E342DC08
SSN=087124 Socket=PERS CM=1 SL=0 Source=Connect
35 Input Message Enqueue 21.57.00.950025.284 0.000015 0000000005AD82B1 9753
TranCode=CDB41PDS Userid=EVHWBUDR LTerm=4012 Terminal=4012
OrgUOWID=BUDR/C7EF90B3BC1BD08C Port=4012 LogToken=C7EE6AA5E342DC08
SSN=087124 Socket=PERS CM=1 SL=0
08 Application Start 21.57.00.950310.565 0.000285 0000000005AD82B2 9754
TranCode=CDB41PDS Region=000F RecToken=BUDR/0021DB9C00000000
RegTyp=MPP TClass=2D TPrty=01
5607 Start of UOR 21.57.00.950310.627 0.000000 0000000005AD82B3 9755
Program=CDB41PT Region=000F IMSID=BUDR RecToken=BUDR/0021DB9C00000000
31 DLI GU 21.57.00.950329.127 0.000018 0000000005AD82B4 9756
TranCode=CDB41PDS Region=000F OrgUOWID=BUDR/C7EF90B3BC1BD08C
RecToken=BUDR/0021DB9C00000000
5600 Sign-on to ESAF 21.57.01.048592.688 0.098263 0000000005AD82B5 9757
Region=000F IMSID=BUDR RecToken=BUDR/0021DB9C00000000 SSID=DSBR
SHORT batch report mode – similar to the ISPF dialog view
34

Using IMS Problem Investigator Forms and BatchReporting for SYSGEN clean-up – removing unuseddefinitions
Uses checkpoint records:
4004=Transactions, 4006=Databases, 4007=Programs
For databases:
Start of checkpoint interval Date=2014-06-26 Thursday Time=17.51.31
DDIR DDIROPEN DDIRDA CHKWOPN DDIRGOPN Used?-------- -------- ------ ------- -------- -----ACCOUNTS 40 20 00 00 YESBANKING 00 00 00 00 NOORDERS 00 00 00 00 NOSTOCK 40 20 00 00 YES
DDIR Database nameDDIROPEN At least one DCB is openedDDIRDA DMB has been dynamically allocatedCHKWOPN DB was openDDIRGOPN GBLSTATUS = OPENUsed? YES – at least one of the above is set, DB is in use or has been used
NO – none of the above are set, DB has not been used
35

003C Prepare READ Socket 13.59.04.7962360041 Message sent to OTMA Type=Transaction +0.00067801 Input Message TranCode=JLMTRAN1 Source=Connect +0.00234435 Input Message Enqueue TranCode=JLMTRAN1 +0.00237308 Application Start TranCode=JLMTRAN1 Region=0001 +0.0973705607 Start of UOR Program=JLMPGM01 Region=0001 +0.09737131 DLI GU TranCode=JLMTRAN1 Region=0001 +0.097420003C Prepare READ Socket +7.8345640041 Message sent to OTMA Type=Command +7.8348986701 YOUT Sync callout message sent +7.8356200042 Message received from OTMA Type=Data +7.8358670058 IMS Hold Queue Compensation +7.835888004A WRITE Socket +7.8361680041 Message sent to OTMA Type=Response, Resp=ACK +7.8380836701 YACK Received ACK +7.8382020045 OTMA Time-out +7.848143004A WRITE Socket +7.8483070048 Trigger Event for SYNCHPT +7.8483230041 Message sent to OTMA Type=Command +7.848379003C Prepare READ Socket +8.8510810047 Session Error +8.8513410048 Trigger Event for CLOSE +8.8515016701 YRSP Sync callout response received +8.85204803 Output Message Response LTerm=7901 Source=Connect +8.85291131 Message GU for APPC LTerm=7901 +8.8529335610 Syncpoint Start of Phase 1 Region=0001 +8.853035
Synchronous call-out Analysis using IMS ProblemInvestigator
From the perspective of IMS connect and the IMS log:
Also, you can measure synch callout time as part of response timeanalysis using IMSPA.
36

IMS Problem Investigator - IMS Trace Record Analysis/DLI Trace
DLI Trace events in IMS log:67FF SNAP Trace when transaction abends67FA /TRACE SET ON TABLE DL/I , LOCK etc
See every DLI call,then associate withthe database updates(50’s)
IMS Trace Table records are now interpreted, and can be tracked against the problem transaction:
1 of 2
TX
Transaction Index
37

IMS Problem Investigator - IMS Trace Record Analysis/TRACE SET ON TABLE LOCK
Locking events, includingSUSPEND and RESUMEand any Associated Delays
• Dispatcher• DLI and Lock• Log Router• Scheduler• Queue Manager
• Latch• LU 6.2 (APPC)• Fast Path• RRS
• DASD log• External Subsystem• OTMA• Storage Manager
2 of 2
{{{
38

39

More information
• IBM DB2 and IMS Tools website:www.ibm.com/software/data/db2imstools/
• Jim Martin, US Representative, Fundi Software:[email protected]
• James Martin, US Representative, Fundi Software:[email protected]
40
Jmartin
Stamp