IMS Health Real World Evidence Access Point
78
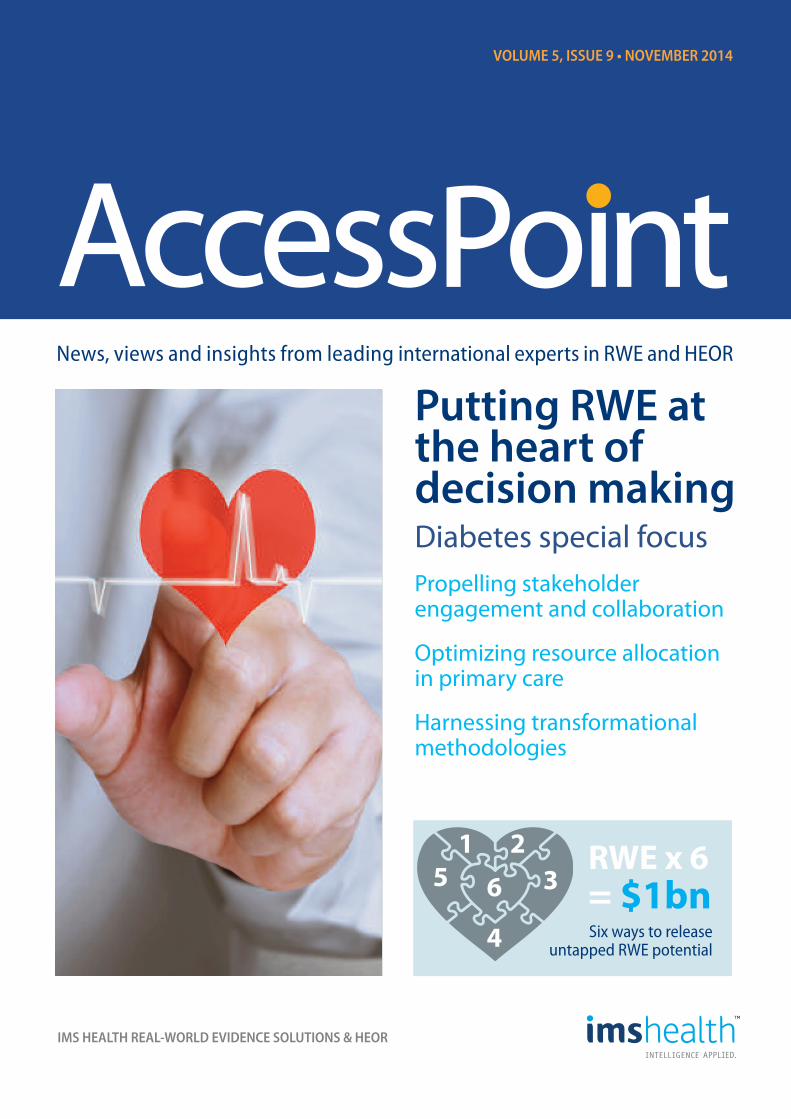
IMS HEALTH REAL-WORLD EVIDENCE SOLUTIONS & HEOR Putting RWE at the heart of decision making Diabetes special focus Propelling stakeholder engagement and collaboration Optimizing resource allocation in primary care Harnessing transformational methodologies VOLUME 5, ISSUE 9 • NOVEMBER 2014 News, views and insights from leading international experts in RWE and HEOR RWE x 6 = $1bn 6 1 2 3 4 5 Six ways to release untapped RWE potential
-
Upload
ims-health-asia-pacific -
Category
Healthcare
-
view
1.636 -
download
3
description
News, views and insights from leading international experts in RWE and HEOR
Transcript of IMS Health Real World Evidence Access Point
IMS HEALTH REAL-WORLD EVIDENCE SOLUTIONS & HEOR
Putting RWE at the heart ofdecision makingDiabetes special focusPropelling stakeholderengagement and collaboration
Optimizing resource allocationin primary care
Harnessing transformationalmethodologies
VOLUME 5, ISSUE 9 • NOVEMBER 2014
News, views and insights from leading international experts in RWE and HEOR
RWE x 6= $1bn6
1 23
4
5
Six ways to releaseuntapped RWE potential

HeadlineHeadline
IMS HEALTH REAL-WORLD EVIDENCE SOLUTIONS & HEOR
InsIghts ???????????“We have observed several important trends that could shape theway companies create or use RWE, which will be of importance toour industry moving forward.”
"RWE is transforming a broadunderstanding in diabetes withreal insights into differentialpatient cohort responses, basedon powerful clinical and evengenomic data."
WelcomeWelcome to our latest AccessPoint as we continue to explore thedynamics shaping the HEOR and real-world evidence (RWE) landscape.In our last edition, we highlighted our evolving understanding ofoncology innovations and outcomes and the role of RWE in these areas.
This time, we expand that lens to another important disease,diabetes, where stakeholders are seeking much deeper knowledge oftreatment outcomes in patient subgroups. RWE is transforming abroad understanding with real insights into differential cohortresponses, based on powerful clinical and even genomic data toevaluate benefits and risks. We also take a broader look at trends inRWE and spotlight ongoing advances in real-world data (RWD),methodologies and RWE applications.
We have focused this edition around these three topics
• RWE research reveals new insights into more effective ways ofresearching diabetes, assessing outcomes and understandingthe implications for broader care provision. Although the quantityof diabetes-related patient data is significant, gaps in thecompleteness of datasets have impeded researchers. Now, newmixed methods approaches such as we describe in Germany, andanalytic innovations including the IMS CORE Diabetes Model,make research for this critical condition easier to conduct withincreased confidence and scientific rigor. A UK analysis of utilityvalues provides a basis for improving diabetes modeling and a recentstudy in Canada shows how RWE analysis can pinpoint the resourcedrivers requiring policy and clinical practice changes. This is a hopefultime in diabetes.
• We have observed several important trends that could shapethe way companies create or use RWE, which will be ofimportance to our industry moving forward. New ways ofthinking about RWD strategies are emerging, leading us topropose a disease-centric framework to help guide those efforts.We also comment on how involving commercial colleagues inRWE is driving substantial value for companies that enable thisapproach. And we look forward to seeing continuedcollaborations with external stakeholders, namely payers, and innew geographies, specifically Asia Pacific.
• Advancements continue to derive more value from RWE,including improved data sourcing, methodologies andstakeholder engagement. Predictive modeling is increasing RWEaccuracy with demonstrated benefits in risk stratification. We areseeing leaders leverage the richness of Scandinavian data toenable new disease-level insights. RWE also continues to supportvalue demonstration, such as showing the impact of adherence onmortality, readmission risk and costs in ACS. And it is helpingcompanies move ‘beyond the pill’ by creating even more valuethrough enabling care management services.
At IMS Health, we are committed to providing insights to help advancehealth and improve patient outcomes across all care settings globally.We hope you find this edition particularly useful in your RWE journey.
AccessPoint is published twice yearly by the IMS Health Real-World Evidence (RWE) Solutions and Health Economics & Outcomes Research (HEOR) team. VOLUME 5, ISSUE 9. PUbLISHEd NOVEMbER 2014.
IMS HEALTH 210 Pentonville Road, London N1 9JY, UK Tel: +44 (0) 20 3075 4800 • www.imshealth.com/[email protected]
©2014 IMS Health Incorporated and its affiliates. All rights reserved.Trademarks are registered in the United States and in various other countries.
Jon ResnickVice President and General Manager
Real-World Evidence Solutions, IMS [email protected]
ACCESSPOINT • VOLUME 5 ISSUE 9 PAGE 1
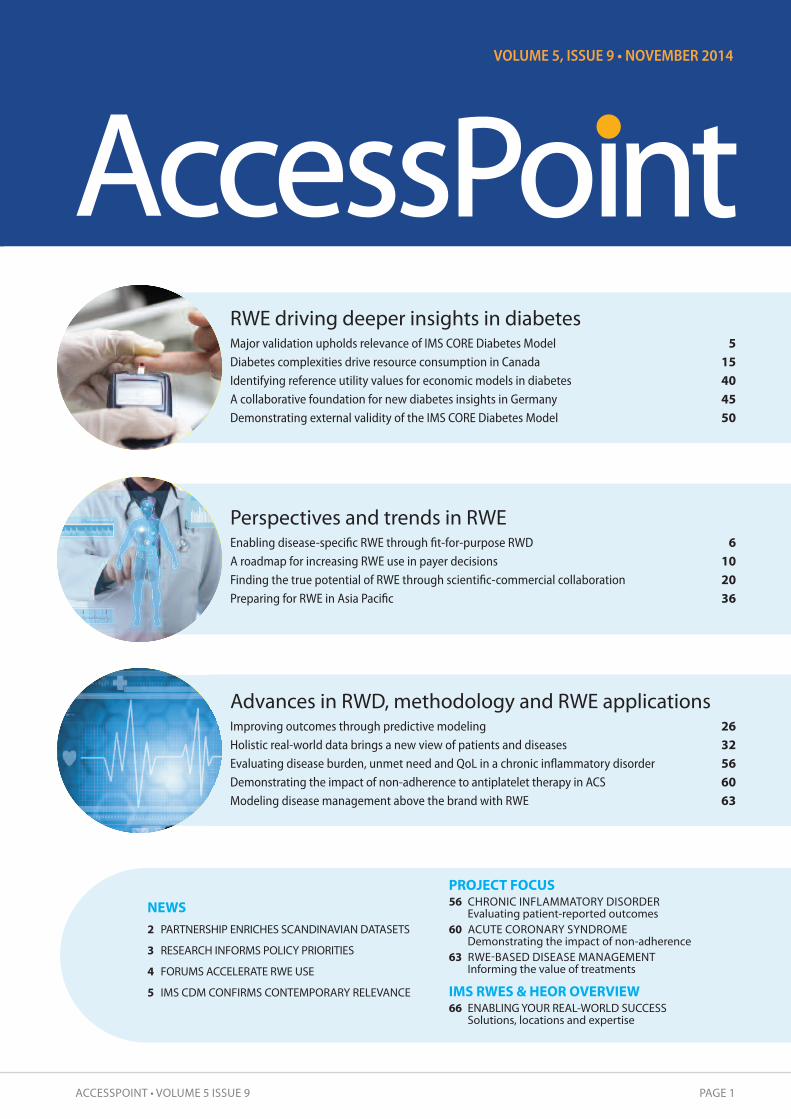
RWE driving deeper insights in diabetesMajor validation upholds relevance of IMS CORE diabetes Model 5diabetes complexities drive resource consumption in Canada 15Identifying reference utility values for economic models in diabetes 40A collaborative foundation for new diabetes insights in Germany 45demonstrating external validity of the IMS CORE diabetes Model 50
Advances in RWD, methodology and RWE applications Improving outcomes through predictive modeling 26Holistic real-world data brings a new view of patients and diseases 32Evaluating disease burden, unmet need and QoL in a chronic inflammatory disorder 56demonstrating the impact of non-adherence to antiplatelet therapy in ACS 60Modeling disease management above the brand with RWE 63
nEWs2 PARTNERSHIP ENRICHES SCANDINAVIAN DATASETS
3 RESEARCH INFORMS POLICY PRIORITIES
4 FORUMS ACCELERATE RWE USE
5 IMS CDM CONFIRMS CONTEMPORARY RELEVANCE
PROJECt FOCUs56 CHRONIC INFLAMMATORY DISORDER
Evaluating patient-reported outcomes60 ACUTE CORONARY SYNDROME
Demonstrating the impact of non-adherence63 RWE-BASED DISEASE MANAGEMENT
Informing the value of treatments
IMs RWEs & hEOR OVERVIEW66 ENABLING YOUR REAL-WORLD SUCCESS
Solutions, locations and expertise
VOLUME 5, ISSUE 9 • NOVEMBER 2014
Perspectives and trends in RWEEnabling disease-specific RWE through fit-for-purpose RWd 6A roadmap for increasing RWE use in payer decisions 10Finding the true potential of RWE through scientific-commercial collaboration 20Preparing for RWE in Asia Pacific 36

PAGE 2 IMS HEALTH REAL-WORLD EVIDENCE SOLUTIONS & HEOR
FIGURE 1: LEGISLATION, CONSENT ANd A PERSONAL Id CREATEPOTENTIAL FOR HIGH QUALITY, COMPREHENSIVE dATASETS
Partnership linkage of unique, Norwegian biobank data opens up groundbreakingresearch potential with global impact
IMS Health/Lifandis AS elevate real-world insights with enriched Scandinavian datasetsFurther expanding IMS Health’s distinctive and growingreal-world evidence capabilities in Northern Europe, thecompany has announced a collaboration with Lifandis AS, anindependent company that works closely with the HUNTResearch Centre in Norway. The agreement combines IMSHealth’s Pygargus extraction methodology with access tothe HUNT biobank and databank, as well as otherNorwegian biobanks and health registries, enabling thecreation of significantly enhanced real-world datasets.Underscoring the rising importance of Scandinavia as a richhub for RWE, this linkage affords one of the most holisticpatient-level views imaginable with potential forunprecedented insights of both local and global relevance.
RICH SETTING FOR REAL-WORLD DATA Scandinavia is unrivalled in opportunities to generate RWE given itswell-structured public healthcare, long established high-qualityelectronic medical records (EMR) and mature regulatory researchframework. In a first-of-its kind RWE approach, IMS Health brings themost complete, integrated view of patient-level care throughanonymous EMR data along with national and disease-specific registers.
The new collaboration with Lifandis in Norway extends application of theIMS Health Pygargus patented extraction methodology, first launched inSweden, to the HUNT biobank and databank, recognized by internationalresearchers for its value in personalized medicine (biomarker Id andvalidation, disease etiology, patient subgroup stratification), epidemiology(RWE, post-marketing studies, burden of disease, comparison of treatmentoutcomes), drug discovery (target identification, target validation) andclinical trial optimization. Containing unique patient data from 125,000anonymous individuals, with more than 25 years of follow-up, andcovering 6,000 distinct variables, the Nord-Trøndelag Health (HUNT) Studyis one of the largest population-based health studies ever performed.1
UNIQUE FOUNDATION FOR TAILORED RESEARCHLifandis was founded to drive partnership between Norwegian biobanks,academia and industry, and the company has also established a strongfoothold within register-based epidemiology. Its heritage includesrecruitment of at least 1.4 million Norwegians, around 30% of thepopulation, into consent-based research biobanks based on population-based studies, with an additional 25-30 million samples in clinicalbiobanks. Legislation, broad consent and the existence of a personalidentification number opens up the opportunity to build high-qualityand comprehensive datasets with access to more than 40 healthcare anddisease-specific registries, hospital and primary care EMRs and separateendpoint registries with validated outcomes (Figure 1).
Importantly, while affording direct insights from Scandinavia, the datacan also inform scientific research to support global decisions across arange of disease areas.
The strategic collaboration with IMS Health allows researchers to lookat a broader set of data in Norway as well as Sweden and otherScandinavian markets through IMS Health’s existing real-world solutionsassets. Clients will now be able to benefit from the Lifandis integratedpartnership in addition to IMS Health’s other information assets,scientific capabilities and involvement in research projects.
ESTABLISHED EXCELLENCE WITH GLOBAL IMPACT This development enriches an already distinctive offering that allowshealthcare researchers to develop globally and locally relevant insightsinto populations, diseases and treatment experience.
The ability of the IMS Health and Lifandis team to create holistic viewsacross settings of care over time enables Scandinavian-based affiliatesand global headquarters to answer meaningful and challengingresearch questions, based on
• Long-term study reviews for anonymous patients acrosssettings of care
• Difficult-to-get patient attributes for more meaningfultreatment journeys
• Information to determine the economic value of differentoutcomes measures
• Analytics to support research from epidemiology tocomparative effectiveness
TOWARDS A REAL-TIME UNDERSTANDING The extension of IMS Health’s RWE capabilities in Northern Europe marksanother important step in helping healthcare decision makers identify,link and interpret real-world outcomes in near real time.
For further information on the IMS Health/Lifandis AS approach toRWE and the exciting opportunities for integration of complex datasetsin the Scandinavian region, please email Patrik Sobocki [email protected] or Christian Jonasson at [email protected]
HUNT Biobank
HUNT Databank
HealthcareRegistries
Electronic MedicalRecords
EndpointRegistries
Archival issuesamples
Personal ID
HUNT Biobank
ies
dsorecRedicalonic MtrElec
istregReHealthcar
tabankersonal ID
HUNT DaP
ersonal IDies
samplesal issuechivrA
istregRtEndpoin
nEWs SCANDINAVIAN RWE COLLABORATION
1 Krokstad S, et al. Cohort Profile:The HUNT Study, Norway. Int. J Epidemiol. 2013Aug; 42(4): 968-77
ACCESSPOINT • VOLUME 5 ISSUE 9 PAGE 3
nEWs EMERGING HEALTHCARE TRENDS
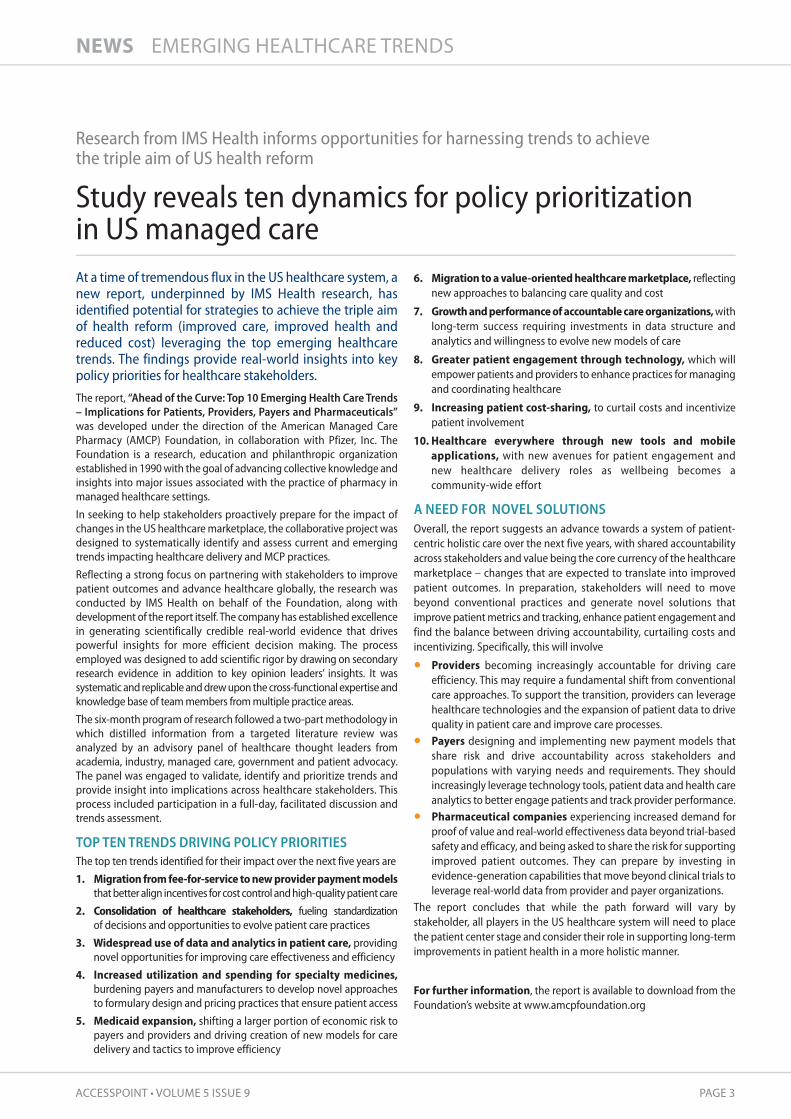
Research from IMS Health informs opportunities for harnessing trends to achieve the triple aim of US health reform
Study reveals ten dynamics for policy prioritization in US managed careAt a time of tremendous flux in the US healthcare system, anew report, underpinned by IMS Health research, hasidentified potential for strategies to achieve the triple aimof health reform (improved care, improved health andreduced cost) leveraging the top emerging healthcaretrends. The findings provide real-world insights into keypolicy priorities for healthcare stakeholders. The report, “Ahead of the Curve: Top 10 Emerging Health Care Trends– Implications for Patients, Providers, Payers and Pharmaceuticals”was developed under the direction of the American Managed CarePharmacy (AMCP) Foundation, in collaboration with Pfizer, Inc. TheFoundation is a research, education and philanthropic organizationestablished in 1990 with the goal of advancing collective knowledge andinsights into major issues associated with the practice of pharmacy inmanaged healthcare settings. In seeking to help stakeholders proactively prepare for the impact ofchanges in the US healthcare marketplace, the collaborative project wasdesigned to systematically identify and assess current and emergingtrends impacting healthcare delivery and MCP practices. Reflecting a strong focus on partnering with stakeholders to improvepatient outcomes and advance healthcare globally, the research wasconducted by IMS Health on behalf of the Foundation, along withdevelopment of the report itself. The company has established excellencein generating scientifically credible real-world evidence that drivespowerful insights for more efficient decision making. The processemployed was designed to add scientific rigor by drawing on secondaryresearch evidence in addition to key opinion leaders’ insights. It wassystematic and replicable and drew upon the cross-functional expertise andknowledge base of team members from multiple practice areas.The six-month program of research followed a two-part methodology inwhich distilled information from a targeted literature review wasanalyzed by an advisory panel of healthcare thought leaders fromacademia, industry, managed care, government and patient advocacy.The panel was engaged to validate, identify and prioritize trends andprovide insight into implications across healthcare stakeholders. Thisprocess included participation in a full-day, facilitated discussion andtrends assessment.
TOP TEN TRENDS DRIVING POLICY PRIORITIES The top ten trends identified for their impact over the next five years are1. Migration from fee-for-service to new provider payment models
that better align incentives for cost control and high-quality patient care2. Consolidation of healthcare stakeholders, fueling standardization
of decisions and opportunities to evolve patient care practices3. Widespread use of data and analytics in patient care, providing
novel opportunities for improving care effectiveness and efficiency4. Increased utilization and spending for specialty medicines,
burdening payers and manufacturers to develop novel approachesto formulary design and pricing practices that ensure patient access
5. Medicaid expansion, shifting a larger portion of economic risk topayers and providers and driving creation of new models for caredelivery and tactics to improve efficiency
6. Migration to a value-oriented healthcare marketplace, reflectingnew approaches to balancing care quality and cost
7. Growth and performance of accountable care organizations, withlong-term success requiring investments in data structure andanalytics and willingness to evolve new models of care
8. Greater patient engagement through technology, which willempower patients and providers to enhance practices for managingand coordinating healthcare
9. Increasing patient cost-sharing, to curtail costs and incentivizepatient involvement
10. Healthcare everywhere through new tools and mobileapplications, with new avenues for patient engagement andnew healthcare delivery roles as wellbeing becomes acommunity-wide effort
A NEED FOR NOVEL SOLUTIONS Overall, the report suggests an advance towards a system of patient-centric holistic care over the next five years, with shared accountabilityacross stakeholders and value being the core currency of the healthcaremarketplace – changes that are expected to translate into improvedpatient outcomes. In preparation, stakeholders will need to movebeyond conventional practices and generate novel solutions thatimprove patient metrics and tracking, enhance patient engagement andfind the balance between driving accountability, curtailing costs andincentivizing. Specifically, this will involve
• Providers becoming increasingly accountable for driving careefficiency. This may require a fundamental shift from conventionalcare approaches. To support the transition, providers can leveragehealthcare technologies and the expansion of patient data to drivequality in patient care and improve care processes.
• Payers designing and implementing new payment models thatshare risk and drive accountability across stakeholders andpopulations with varying needs and requirements. They shouldincreasingly leverage technology tools, patient data and health careanalytics to better engage patients and track provider performance.
• Pharmaceutical companies experiencing increased demand forproof of value and real-world effectiveness data beyond trial-basedsafety and efficacy, and being asked to share the risk for supportingimproved patient outcomes. They can prepare by investing inevidence-generation capabilities that move beyond clinical trials toleverage real-world data from provider and payer organizations.
The report concludes that while the path forward will vary bystakeholder, all players in the US healthcare system will need to placethe patient center stage and consider their role in supporting long-termimprovements in patient health in a more holistic manner.
For further information, the report is available to download from theFoundation’s website at www.amcpfoundation.org
PAGE 4 IMS HEALTH REAL-WORLD EVIDENCE SOLUTIONS & HEOR
nEWs RWE DEBATE
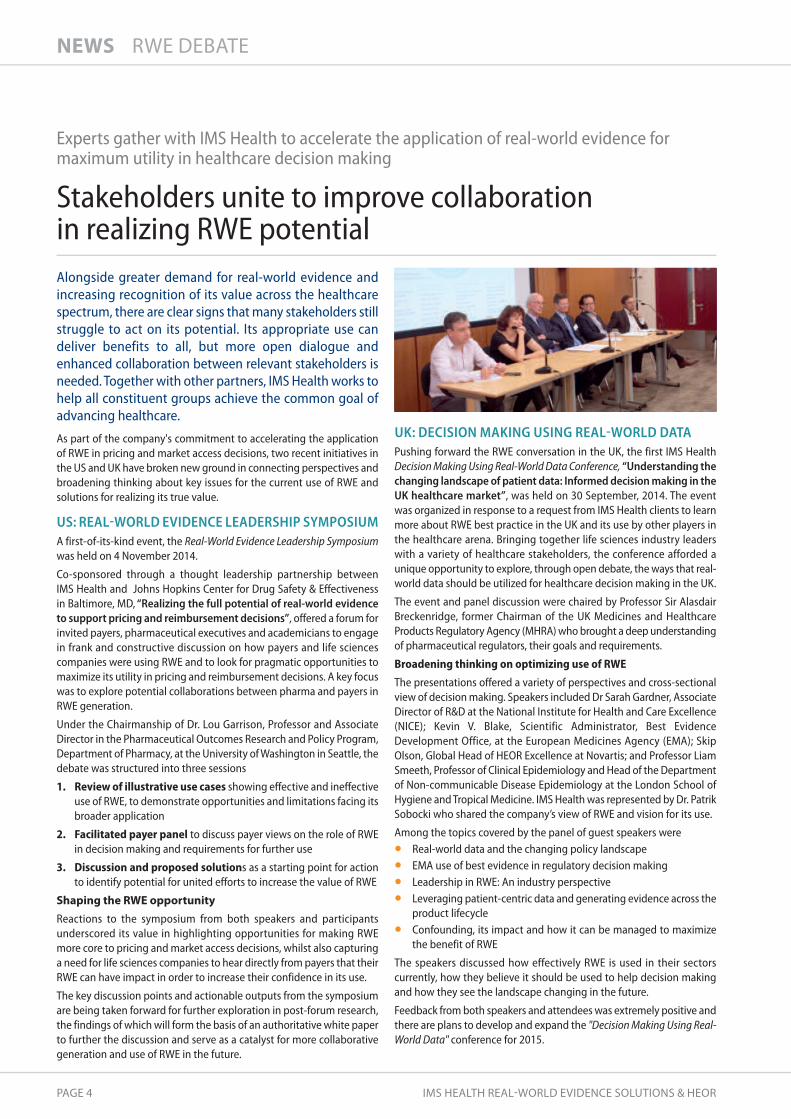
Experts gather with IMS Health to accelerate the application of real-world evidence for maximum utility in healthcare decision making
Stakeholders unite to improve collaboration in realizing RWE potentialAlongside greater demand for real-world evidence andincreasing recognition of its value across the healthcarespectrum, there are clear signs that many stakeholders stillstruggle to act on its potential. Its appropriate use candeliver benefits to all, but more open dialogue andenhanced collaboration between relevant stakeholders isneeded. Together with other partners, IMS Health works tohelp all constituent groups achieve the common goal ofadvancing healthcare.
As part of the company's commitment to accelerating the applicationof RWE in pricing and market access decisions, two recent initiatives inthe US and UK have broken new ground in connecting perspectives andbroadening thinking about key issues for the current use of RWE andsolutions for realizing its true value.
US: REAL-WORLD EVIDENCE LEADERSHIP SYMPOSIUM A first-of-its-kind event, the Real-World Evidence Leadership Symposiumwas held on 4 November 2014.
Co-sponsored through a thought leadership partnership between IMS Health and Johns Hopkins Center for drug Safety & Effectivenessin baltimore, Md, “Realizing the full potential of real-world evidenceto support pricing and reimbursement decisions”, offered a forum forinvited payers, pharmaceutical executives and academicians to engagein frank and constructive discussion on how payers and life sciencescompanies were using RWE and to look for pragmatic opportunities tomaximize its utility in pricing and reimbursement decisions. A key focuswas to explore potential collaborations between pharma and payers inRWE generation.
Under the Chairmanship of dr. Lou Garrison, Professor and Associatedirector in the Pharmaceutical Outcomes Research and Policy Program,department of Pharmacy, at the University of Washington in Seattle, thedebate was structured into three sessions
1. Review of illustrative use cases showing effective and ineffectiveuse of RWE, to demonstrate opportunities and limitations facing itsbroader application
2. Facilitated payer panel to discuss payer views on the role of RWEin decision making and requirements for further use
3. Discussion and proposed solutions as a starting point for actionto identify potential for united efforts to increase the value of RWE
shaping the RWE opportunityReactions to the symposium from both speakers and participantsunderscored its value in highlighting opportunities for making RWEmore core to pricing and market access decisions, whilst also capturinga need for life sciences companies to hear directly from payers that theirRWE can have impact in order to increase their confidence in its use.
The key discussion points and actionable outputs from the symposiumare being taken forward for further exploration in post-forum research,the findings of which will form the basis of an authoritative white paperto further the discussion and serve as a catalyst for more collaborativegeneration and use of RWE in the future.
UK: DECISION MAKING USING REAL-WORLD DATAPushing forward the RWE conversation in the UK, the first IMS HealthDecision Making Using Real-World Data Conference, “Understanding thechanging landscape of patient data: Informed decision making in theUK healthcare market”, was held on 30 September, 2014. The eventwas organized in response to a request from IMS Health clients to learnmore about RWE best practice in the UK and its use by other players inthe healthcare arena. bringing together life sciences industry leaderswith a variety of healthcare stakeholders, the conference afforded aunique opportunity to explore, through open debate, the ways that real-world data should be utilized for healthcare decision making in the UK.
The event and panel discussion were chaired by Professor Sir Alasdairbreckenridge, former Chairman of the UK Medicines and HealthcareProducts Regulatory Agency (MHRA) who brought a deep understandingof pharmaceutical regulators, their goals and requirements.
Broadening thinking on optimizing use of RWEThe presentations offered a variety of perspectives and cross-sectionalview of decision making. Speakers included dr Sarah Gardner, Associatedirector of R&d at the National Institute for Health and Care Excellence(NICE); Kevin V. blake, Scientific Administrator, best Evidencedevelopment Office, at the European Medicines Agency (EMA); SkipOlson, Global Head of HEOR Excellence at Novartis; and Professor LiamSmeeth, Professor of Clinical Epidemiology and Head of the departmentof Non-communicable disease Epidemiology at the London School ofHygiene and Tropical Medicine. IMS Health was represented by dr. PatrikSobocki who shared the company’s view of RWE and vision for its use.
Among the topics covered by the panel of guest speakers were
• Real-world data and the changing policy landscape
• EMA use of best evidence in regulatory decision making
• Leadership in RWE: An industry perspective
• Leveraging patient-centric data and generating evidence across theproduct lifecycle
• Confounding, its impact and how it can be managed to maximizethe benefit of RWE
The speakers discussed how effectively RWE is used in their sectorscurrently, how they believe it should be used to help decision makingand how they see the landscape changing in the future.
Feedback from both speakers and attendees was extremely positive andthere are plans to develop and expand the "Decision Making Using Real-World Data" conference for 2015.

ACCESSPOINT • VOLUME 5 ISSUE 9 PAGE 5
nEWs IMS CORE DIABETES MODEL VALIDATION
IMS CORE diabetes Model demonstrates continued credibility as the leading tool forpolicy and reimbursement strategy in diabetes
Major validation upholds relevance of IMS CORE diabetes Model The IMS CORE diabetes Model (CdM) is a well-publishedand validated simulation model that predicts long-termhealth outcomes and costs in type 1 and type 2 diabetes.For those developing policy and implementing decisionsinformed by CdM analyses, confirmation that the modelremains contemporary and validated is essential. Findingsfrom a new validation to recent diabetes outcome studies1
reaffirm the model’s suitability to support policy decisionsfor improving diabetes management.
disease simulation models are increasingly being applied to inform awide range of issues in healthcare decision making. Their ability toproject long-term outcomes and costs on the basis of short-term studydata is particularly relevant in a chronic condition like diabetes, givenits progressive course, associated complications and high and growingeconomic burden.
The market-leading CdM is designed to assess the lifetime healthoutcomes and economic consequences of interventions in diabetes, andcomprises 17 interdependent sub-models that simulate the majorcomplications of the disease. It allows estimation of direct and indirectcosts; adjusts for quality of life; and enables users to perform both cost-effectiveness and cost utility analyses. It is routinely used to informreimbursement decisions, public health issues, clinical trial design andoptimal patient management strategies.
ROBUST VALIDATION PEDIGREE Validation to external studies has been an intrinsic part of the CdM’sdevelopment process. In a major evaluation in 2004, its operationalpredictive validity was demonstrated against 66 clinical endpoints from11 epidemiological and clinical studies. Evolution of the model alsoreflects its strong links with the Mount Hood Challenge, a recognizedbiennial forum for comparing the structure and performance of diabeteshealth economic models with data from clinical trials (see Insights onpage 50).
RECENT ENHANCEMENTSAn ongoing commitment to ensuring that the CdM remains the bestavailable tool for economic evaluations in diabetes has seen the modelundergo a series of significant updates in recent years. These include
• Ability to model individual anonymous patient-level data
• Incorporation of treat-to-target efficacy data for HbA1c
• Inclusion of a detailed hypoglycemia sub-model
• Expansion of variables for probabilistic sensitivity analysis
• Addition of UKPdS 68 and 82 risk equations
ENSURING CONTEMPORARY RELEVANCE To ensure the CdM’s continued relevance and accuracy following theseenhancements, the aim of the latest validation study, published in 2014,was to examine the validity of the updated model to results from recentmajor long-term and short-term diabetes outcome studies. Particularemphasis was placed on cardiovascular (CV) risk.
Independent researchers with unrestricted access to the CdM and itssource code worked with IMS Health to verify (ensure the model is codedas intended and free from errors) and externally validate (quantify howwell outcomes observed in the real world are predicted) the model. Intotal 121 validation simulations were performed, stratified by study follow-up duration, study endpoints, year of publications and diabetes type.
goodness of fitA number of statistical measures of goodness-of-fit were used, including
• Testing of null hypothesis of no difference between theannualized event rates (observed vs. predicted) and relative riskreduction across all validation endpoints
• Assessment of whether the confidence intervals for the number ofevents predicted by the model and those reported in thevalidation studies overlapped
• Evaluation of goodness-of-fit between simulated and observedendpoints for trials, endpoints, treatment arm, and date of studyusing the mean absolute percentage error (MAPE) and the rootmean square percentage error (RMSPE)
• Scatterplots of observed vs. predicted endpoints along with thecoefficient of determination (R2)
Impact of choice of CV risk equations The CdM currently uses, amongst others, CV risk equations derived fromthe United Kingdom Prospective diabetes Study Outcomes Model(UKPdS68) but, given the increasing choice of equations that isemerging, assessing the continued relevance of UKPdS68 is essential.As part of the validation exercise, the absolute level of risk and relativerisk reduction was compared for 12 CV disease risk equations developedspecifically for T2dM patients.
RESULTS At conventional levels of statistical significance, the study found thatthe CdM fitted the contemporary validation data well, supporting themodel as a credible tool for predicting the absolute number of clinicalevents in dCCT- and UKPdS-like populations.
Underscoring the significance of these results, Professor Phil McEwan ofSwansea University, the lead researcher of the study, emphasized that"Organizations developing policy and implementing decisions informed byCDM require the reassurance that the model and its results are current andvalidated. This study helps to demonstrate that the model is a validated toolfor predicting major diabetes outcomes and consequently is potentiallysuitable for supporting policy decisions relating to disease management indiabetes."
A copy of the full validation study is available to download online at:http://www.valueinhealthjournal.com/article/S1098-3015(14)01928-7/pdf
For further information on the IMS CORE diabetes Model, pleaseemail Mark Lamotte at [email protected]
1 McEwan P, Foos V, Palmer JL, Lamotte MD, Lloyd A, Grant D. Validation of the IMSCORE Diabetes Model. Value in Health, 2014; 17: 714-724
PAGE 6 IMS HEALTH REAL-WORLD EVIDENCE SOLUTIONS & HEOR
The author
Rob Kotchie, M.CHEM, MSC is Vice President, RWE Solutions, IMS [email protected]
Enabling disease-specific RWEthrough fit-for-purpose RWD
Increased stakeholder demand and the greater supply ofelectronic real-world data are expanding the application of real-world evidence across the product lifecycle. The mostsuccessful organizations are developing RWE platforms,capabilities and analytical methodologies focused ontherapeutic areas. Increasingly, understanding how thecharacteristics of a particular disease area can influence theavailability and use of real-world data for evidence generation isimportant in setting strategies that create differentiation.
InsIghts DISEASE-SPECIFIC RWE

ACCESSPOINT • VOLUME 5 ISSUE 9 PAGE 7
continued on next page
A framework for reference in key disease areas
marketvalue byTO
P20 2017= 71%
Globally, intensified pressure to obtain better value forhealthcare spending has elevated the importance of real-world evidence (RWE) as an enabler of improvedhealthcare decision making. Increased stakeholderdemand and the greater supply of electronic real-worlddata (RWD) are expanding its application across theproduct lifecycle as companies become attuned to theinsights it can deliver.
Leading life sciences organizations are now using RWE tosupport clinical development, improve launchperformance and drive better commercial results. Themost successful are moving beyond a product-specific,study-based approach to develop RWE platforms,capabilities and analytical methodologies focused on asingle or set of therapy areas to drive sustained valueacross their franchises.
As these trends continue, the ability to compare andunderstand how the characteristics of a particular diseasearea can influence the availability and use of RWD is animportant step in setting focused and relevant RWEstrategies that create differentiation and driveachievement of commercial goals. This article offers aframework for assessing RWD availability by therapy areato guide internal decision making.
NUANCED CHALLENGES FOR RWE RESEARCH By 2017, IMS Health estimates that the largest therapeuticclasses in the developed markets will include acombination of both traditional primary care andspecialized areas, led by oncology, diabetes, anti-TNFs,pain and asthma/COPD (Figure 1). Each of these diseaseareas presents markedly different patient populations,unmet medical need, standards of care and diseaseoutcomes, leading to a nuanced set of challenges for RWE research.
DISEASE-DRIVEN DETERMINANTS OF RWE In seeking to inform the ease and extent of RWEdevelopment in a particular therapeutic class, IMS Healthhas identified five key characteristics of a disease areathat have influenced the evolution of RWD developmentto date
1. Routine capture of clinical measures 2. Nature of the critical endpoint3. Number of treatment settings4. Length of follow-up5. Available sample size
By assessing each disease area against these fivecharacteristics it is possible to identify the specific factorslimiting an expansion of RWD use and the levers that canbe engaged to accelerate future adoption. This point isillustrated in Figure 2 and discussed below for theprojected top five therapy areas in 2017.
Oncology: Complex patient subgroupsFor oncology, a disease area that is often more amenableto RWE research due to the nature of the critical endpointand frequent short length of required patient follow-up,analysis can be often limited by the complexity of patientsubgroups and the need to capture detailed informationon disease staging, therapy sequencing, role of surgeryand patient biomarker status.
These challenges are now being overcome to a degree by healthcare stakeholders working together to linkimportant rich clinical information with genomic andproteomic data, increasing the value and uses of RWD inthis area.
For example, RWD is increasingly being leveraged inoncology to facilitate pricing and reimbursement oftherapies by use, enabling a mechanism for greateralignment between manufacturers and healthcare payersand providers on the value and costs of treatment in aspecific indication or patient population.

PAGE 8 IMS HEALTH REAL-WORLD EVIDENCE SOLUTIONS & HEOR
InsIghts DISEASE-SPECIFIC RWE
Diabetes: Extended timeframe and multiple care settingsIn diabetes the generation and application of RWE, eitherby researchers to support burden of disease, comparativeeffectiveness or safety research or by commercialfunctions for forecasting or sales and marketing purposes,is often hindered by the need to track patients over longperiods of time and across multiple settings of care. Inother words, in order to infer the effects of a diabetesintervention on delaying the worsening of a secondarycondition (eg, renal disease) or a reduction in a relatedcomplication (eg, microvascular or macrovascular events)patients must be followed over several years. Thisincludes tracking their admissions and discharge to andfrom hospital, and across multiple treatment centers.
Hence, to fully assess the comparative effectiveness of adiabetes intervention in the real-world setting requireslinking one or more datasets across both ambulatory andspecialist treatment settings, and/or combining a closeddatabase of medical and pharmacy claims with EMR datato provide meaningful clinical data on outcomes andconfounding factors such as Body Mass Index and HbA1c.Despite the proliferation of data in a primary care disease
like diabetes, the challenge is in bringing it together in ameaningful way that will increase the usability of diabetes RWD.
Anti-tnFs/Pain: Patient-reported endpointsIn the case of anti-TNFs or therapies to treat pain, RWEresearch is often limited by the lack of routine capture ofpatient-reported endpoints in clinical practice. Whiledisease-specific instruments that are used to assess apatient’s response to therapy are systematically applied inclinical trials, they are typically either not routinelyrecorded in clinical practice or the data is stored inunstructured clinical notes making it challenging andtime consuming to extract, analyze and interpret.
Asthma/COPD: Routine tests and acute eventsSimilarly, in other chronic disease areas such asasthma/COPD, research can be restricted by the lack ofroutine capturing of test results used to assess the long-term deterioration of the disease (eg, spirometrymeasures such as FEV1) or detailed descriptions of acuteepisodic events, such as admission to hospital for a majorCOPD exacerbation, or the documentation of rescuemedication use for a mild to moderate exacerbation.
Source: Rickwood S, Kleinrock M, Nunez-Gaviria M. The global use of medicines: Outlook to 2017. IMS Institute for Healthcare Informatics, 2013 Nov.
Interferons
ADHD
Antivirals excluding HIV
Antidepressants
Antiulcerants
Antipsychotics
Immunosuppressants
Anti-Epileptics
Cholesterol
Antibiotics
Dermatology
HIV Antivirals
Immunostimulants
Hypertension
Other CNS Drugs
Asthma/COPD
Pain
Anti-TNFs
Diabetes
Oncology
Top 20Classes
71%
Others29%
Developed Markets Sales in 2017 (LC$)
$74-84Bn
$34-39Bn
$32-37Bn
$31-36Bn
$31-36Bn
$26-31Bn
$23-26Bn
$22-25Bn
$22-25Bn
$22-25Bn
$18-21Bn
$16-19Bn
$15-18Bn
$15-18Bn
$13-16Bn
$12-14Bn
$10-12Bn
$8-10Bn
$7-9Bn
$6-8Bn
FIGURE 1: LEAdING THERAPEUTIC CLASSES IN 2017 WILL INCLUdE PRIMARY CARE ANd SPECIALIST AREAS

ACCESSPOINT • VOLUME 5 ISSUE 9 PAGE 9
LEVERAGING PROGRESS TO REALIZE VALUE Growing need and rapidly expanding applications of RWEare driving the development of innovative techniques tolink, supplement and pool data sources for deeper andmore meaningful research in this area.
The deployment of data encryption engines and greatercollaboration between key players is enabling everincreasing scope to link anonymous information acrossdatasets and settings of care, while preserving patientconfidentiality and appropriate use.
Innovative techniques are now available to supplementsecondary data from the electronic health record throughnovel primary data collection from physician and/orpatients at the point of care (‘over the top’ data collection),
and deploy Natural Language Processing (NLP) to extractadditional rich information from clinical notes in a HIPAA-compliant manner.
These developments are providing life science researcherswith unprecedented access to comprehensive disease areareal-world datasets spanning multiple sources and settingsof care - with sufficient sample size and patient follow-upto power an expanded set of RWE applications.
As companies look to maximize the value of RWE in theirorganization, a focus on understanding the specific needsand challenges for evidence generation presented bydisease areas of interest will be a key step to leveragingthe progress being made and realizing its full potentialacross their franchises.
Oncology Anti-TNF Pain Asthma/COPDDiabetes
Levers
Routine capture of clinical measures
Nature ofthe critical endpoint
Number oftreatment settings
Length offollow up
Availablesample size
Supplementation
Supplementation NLP
Linkage
Linkage retention modeling
Pooling
Abundant
Hard
Single
Short
Large Small
Long
Multi
Soft
Infrequent
Understanding how the characteristics of a disease area can influenceavailability and use of real-world data for evidence generation isincreasingly important.
“”
FIGURE 2: FRAMEWORK FOR dETERMINING CHALLENGES OF RWE GENERATION bY dISEASE

PAGE 10 IMS HEALTH REAL-WORLD EVIDENCE SOLUTIONS & HEOR
The authors
Ragnar Linder, MSC is Principal, RWE Solutions & HEOR, IMS [email protected]
Marla Kessler, MBA is Vice President, IMS Consulting Group [email protected]
Real-world evidence has been part of healthcare for more than 30 years. Despite this, its application to really improve theefficiency of healthcare delivery remains uneven and siloed.Some of the greatest opportunities lie within the realms ofcollaborative and partnership initiatives between stakeholders,especially payers.
A roadmap for increasingRWE use in payer decisions
InsIghts RWE ROADMAP

ACCESSPOINT • VOLUME 5 ISSUE 9 PAGE 11
FIGURE 1: THERE HAS bEEN AN EXPLOSION OF REAL-WORLd dATA FOR ANALYSIS
Bridging the gap between promise and reality
" " " " "" " " " "" " " " "" " " " "" " " " "" " " " "" " " " "" " " " "" " " " "
of payer respondents had no confidence in the economic evidence provided by pharma44%
continued on next page
Real-world evidence has been part of healthcare for over30 years, applied at varying levels by regulators, clinicians,payers and manufacturers to inform decisions, buildprograms and improve health. IMS Health has documentedmore than 100 case studies where RWE has activelyinfluenced product labeling, price, access and use.1
Despite this, the application of RWE to really improve theefficiency of healthcare delivery remains uneven andsiloed. Does this suggest a lack of comprehensive, qualitydata? Are healthcare professionals, policy makers andother key stakeholders waiting for better tools? Are theskills sets to link and analyze data not widely accessible?In fact the evidence suggests that the ability to produceRWE is expanding, and rather quickly. However, the gapbetween the exponential increase in RWE sources and the capacity to harness these effectively is also growing.Our research suggests that this widening gap between the promise and reality is due to three critical – butmanageable – barriers.
GROWING VOLUME BUT UNREALIZED POTENTIALThe quantity and importance of RWE has expandedtremendously in recent years (Figure 1). RWE is generatedand applied throughout the lifecycle of pharmaceuticalsand other medical interventions to demonstrateeffectiveness, safety and value. It can be used forpopulation health management, for example inidentifying significant health factors by geography ordemographics for the design and evaluation ofinterventions to improve health. It can enable betterunderstanding and characterization of diseaseepidemiology, treatment paradigm and associatedresource utilization. It can inform quality of careassessment, point of care decision guides andtranslational research projects. And it can also serve toassess a drug’s performance outside the randomizedcontrolled trial (RCT) setting and describe any shifts inpractice once the drug is approved and used.
PAGE 12 IMS HEALTH REAL-WORLD EVIDENCE SOLUTIONS & HEOR
InsIghts RWE ROADMAP
While RCT data is still regarded as being top of theevidence hierarchy, there has been an increased use ofapproaches that assess patient outcomes and follow allthe care and interventions they receive. Real-world data(RWD) is now being used to complement RCTinformation, providing valuable evidence of the waypharmaceuticals are being used in practice and in manypopulations, which cannot be gained from RCTs.
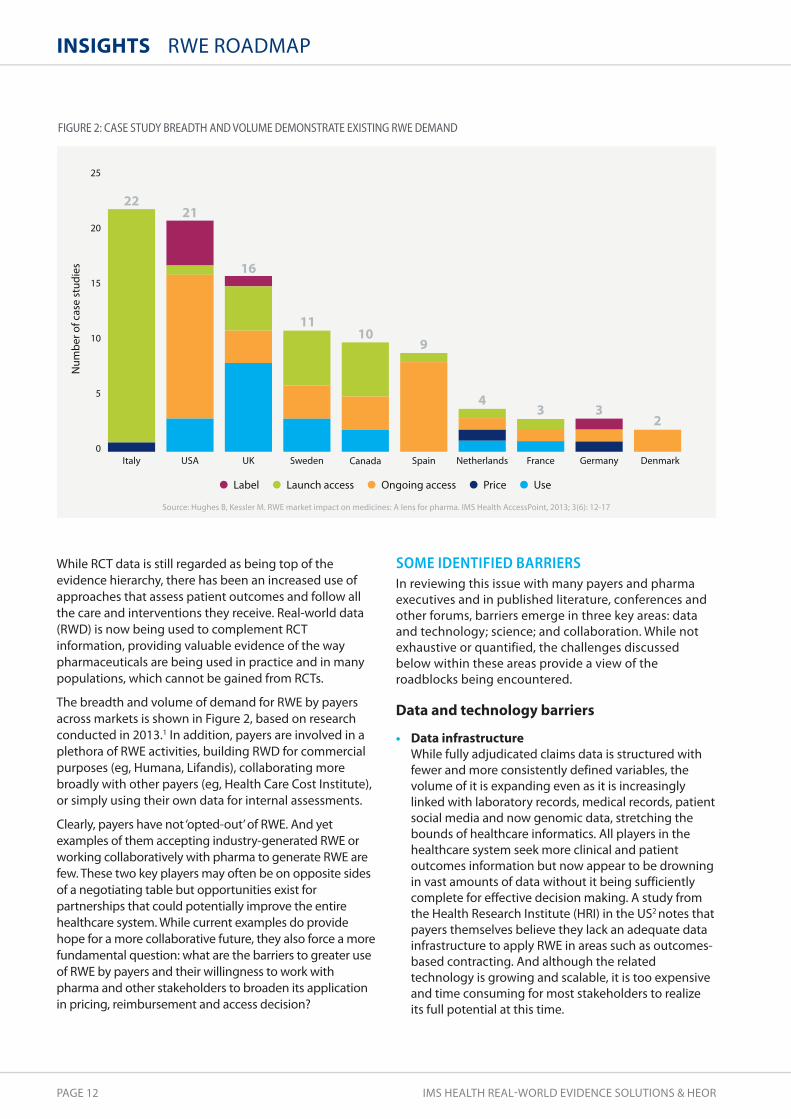
The breadth and volume of demand for RWE by payersacross markets is shown in Figure 2, based on researchconducted in 2013.1 In addition, payers are involved in aplethora of RWE activities, building RWD for commercialpurposes (eg, Humana, Lifandis), collaborating morebroadly with other payers (eg, Health Care Cost Institute),or simply using their own data for internal assessments.
Clearly, payers have not ‘opted-out’ of RWE. And yetexamples of them accepting industry-generated RWE orworking collaboratively with pharma to generate RWE arefew. These two key players may often be on opposite sidesof a negotiating table but opportunities exist forpartnerships that could potentially improve the entirehealthcare system. While current examples do providehope for a more collaborative future, they also force a morefundamental question: what are the barriers to greater useof RWE by payers and their willingness to work withpharma and other stakeholders to broaden its applicationin pricing, reimbursement and access decision?
SOME IDENTIFIED BARRIERS In reviewing this issue with many payers and pharmaexecutives and in published literature, conferences andother forums, barriers emerge in three key areas: dataand technology; science; and collaboration. While notexhaustive or quantified, the challenges discussedbelow within these areas provide a view of theroadblocks being encountered.
Data and technology barriers
• Data infrastructureWhile fully adjudicated claims data is structured withfewer and more consistently defined variables, thevolume of it is expanding even as it is increasinglylinked with laboratory records, medical records, patientsocial media and now genomic data, stretching thebounds of healthcare informatics. All players in thehealthcare system seek more clinical and patientoutcomes information but now appear to be drowningin vast amounts of data without it being sufficientlycomplete for effective decision making. A study fromthe Health Research Institute (HRI) in the US2 notes thatpayers themselves believe they lack an adequate datainfrastructure to apply RWE in areas such as outcomes-based contracting. And although the relatedtechnology is growing and scalable, it is too expensiveand time consuming for most stakeholders to realizeits full potential at this time.
FIGURE 2: CASE STUdY bREAdTH ANd VOLUME dEMONSTRATE EXISTING RWE dEMANd
Source: Hughes B, Kessler M. RWE market impact on medicines: A lens for pharma. IMS Health AccessPoint, 2013; 3(6): 12-17
Label Launch access Price UseOngoing access
25
20
15
10
5
0
Num
ber o
f cas
e st
udie
s
Italy UK Sweden DenmarkSpain Netherlands France GermanyCanadaUSA
2221
16
1110
9
43 3
2

ACCESSPOINT • VOLUME 5 ISSUE 9 PAGE 13
• Data extraction and linkage Many payers have built distinctive capabilities inunderstanding claims-related data but clinical datarequires a different set of expertise. The magnitude ofthe challenge is just as great for pharma although itsnature is different. Companies may have acquiredsubstantial data and even technology integrationsolutions but the data sits in functional and geographicsilos using new and old technologies, making itchallenging to link let alone analyze.
Even in a country like Sweden, where almost all patientdata can be tied to a consistent national social securitynumber, linkage is possible but not immediate.
• Data programming and processing Speed is critical. However, a well-constructed researchstudy involving intensive SAS programming can takemonths to conduct, extended by delays in gaininganswers to questions, with knock-on implications forthe timeliness of the insights delivered.
scientific barriers
• Lack of consistent RWD methodologiesThe insights to be gained from RWD are substantial,but the growing availability of data highlightsimportant methodological challenges. Even at a basiclevel, questions can arise. For example, what defines adiabetic patient? Is it based on medications taken, arecorded diagnosis code, or an actual laboratory orseries of laboratory results?
Not every patient record contains all that informationor even some of it. This quickly leads to more complexchallenges: when should data matching bedeterministic versus probabilistic? When is itacceptable to impute missing values? How will thesedecisions bias the results? How can advanced analytics,including predictive analytics, improve the quality ofand confidence in RWE? The expertise to deal with thisexists, but not always in-house. Furthermore, payerscan be skeptical of data because there is no easy wayof ensuring that the deployed methodologies aresufficiently robust.
• Absence of standardized measuresThe current lack of consensus around many keymeasures means that even issues such as how long a patient needs to demonstrate an outcomebefore a treatment is deemed cost-effective, are notuniversally agreed.
The variation in approaches can significantly impactstudy results. Exploring methods used to scorephysician spending patterns (cost profiling), a measurefrequently assessed by payers, a Rand Health researchstudy showed that even slight changes in attributionrules can dramatically change the characterization ofphysician performance. For example, “Between 17 and61 percent of physicians would be assigned to adifferent cost category if an attribution rule other thanthe most common rule were used.”3
Collaboration barriers
• Lack of trustThis is perhaps the elephant in the room that everyoneis willing to talk about. While payers and pharmashould be aligned around patient outcomes, economicincentives are more complex. The previouslyreferenced HRI study found that 44% of payerrespondents had no confidence in the economicevidence provided by pharma.2 Fewer than 1 in 10were very confident in using pharma-generatedinformation to evaluate a drug’s comparativeeffectiveness.
For data holders, the need to protect patient privacyand the integrity of the data being used has createdmany hurdles to access. Even straightforward protocolscan take months to approve if each proposal isevaluated individually.
• Lack of imperativeWhile some payers see their data as entirely adequateto support comparative effectiveness and otheranalysis, others are not even sure the analysis isrequired to achieve their goals. If the main objectivesare managing unit costs of treatments, payers haveother mechanisms such as rebates, formulary designand traditional analysis of claims data, which they mayfind easier to use.
In parallel, many pharma companies can be risk averseto generating RWE with a payer without fullyunderstanding what will be said and how it will be used.
Some of the greatest opportunities for achieving the goal of improvedefficiency in healthcare lie within the realms of collaborative andpartnership initiatives between stakeholders, to ensure implementation.
“”
continued on next page

PAGE 14 IMS HEALTH REAL-WORLD EVIDENCE SOLUTIONS & HEOR
InsIghts RWE ROADMAP
SOME POTENTIAL SOLUTIONS None of the barriers referenced are insurmountable.Indeed, interesting examples are already emerging ofinnovative solutions on the path towards greater use ofRWE in pricing and reimbursement decisions.
• Evolution of methodologies and technology-enabled analyticsThis edition of AccessPoint alone spotlights the area ofpredictive modeling where novel methodologies aredriving a new generation of applications in RWE (seearticle on page 26). In these areas, researchers aretaking advantage of improved data and computingpower to run analytics that otherwise would have beentoo time-consuming, if not impossible, to conduct.
• Richer data sourcesNot every research question must rely on locally-sourced data. In countries such as Scandinavia, morethan two decades of rich patient-level data existselectronically. Technologies such as the IMS PygargusCustomized eXtraction Program facilitate linkagebetween the various sources by extracting the desireddata from an electronic medical record (EMR) to builddatabases of EMR and register data. A 2014retrospective cohort study linked national Swedishmandatory registries to EMR data from outpatienturology clinics to study prostate cancer (PC) patients.The use of this approach provided a uniqueunderstanding of the clinical course of PC that caninform treatment and research across developedmarkets – not only in Sweden.4
• CollaborationsOrganizations such as the Healthcare Cost Institute(HCCI) have been established with the goal of poolingdata (in this case, from US payers) and increasing itsquality. In reality, the value of cooperation betweenstakeholders in different parts of the system – payers,providers and pharma – will be critical, not only inimproving data sources but also in increasing buy-in toand application of the insights from them. This check-and-balance will enable stakeholders to put the patientat the center of RWE and provide care that actuallyimproves outcomes.
In addition, it can enable a movement away fromdifferent parties running analytics to stakeholdersworking together to solve problems. For example, RWE can support efforts to improve decision making,adherence and efficient care delivery, where the focus goes beyond analytics and ultimately to betterpatient care.
• third-party involvementThe involvement of independent, objective thirdparties can increase confidence in the underlying dataas well as the resulting analysis. It can also be animportant enabler of packaged analytics where datacan be used for a variety of applications within aspectrum of pre-approved uses. A trusted third partycan deliver that protection. In addition, for dataproviders interested in commercializing their data, athird party can enable the full value potential of thatdata to be captured across a range of research goalsinvolving many different types of organizations.
FULFILLING THE PROMISE The importance of RWE is continuing to grow along withits ability to inform critical decisions for payers, pharmacompanies and other healthcare stakeholders. However,the full impact of its potential has yet to be realized. Thisarticle has considered some of the barriers to wider useof RWE and proposed some solutions to address them.Some of the greatest opportunities for achieving thegoal of improved efficiency in healthcare lie within therealms of collaborative and partnership initiativesbetween stakeholders, to ensure implementation. Only then can we provide the best care for patients and improve outcomes.
1 Hughes B, Kessler M. RWE market impact on medicines: A lens for pharma. IMS Health AccessPoint, 2013; 3(6): 12-172 Health Research Institute/PWC. Unleashing value: The changing payment landscape for the US pharmaceutical industry. May, 20123 Mehrotra D, Adams JL, Thomas WJ, McGlynn EA. Is physician cost profiling ready for prime time? Research Brief, Rand Health, 20104 Banefelt J, Liede A, Mesterton J, Stålhammar J, Hernandez RK, Sobocki P, Persson BE. Survival and clinical metastases among prostate cancer patientstreated with androgen deprivation therapy in Sweden. Cancer Epidemiology, 2014, Aug; 38(4): 442-7. doi: 10.1016/j.canep.2014.04.007. Epub 2014May 27.

ACCESSPOINT • VOLUME 5 ISSUE 9 PAGE 15
InsIghts PRIMARY CARE UTILIZATION IN CANADA
Diabetes complexities drive resourceconsumption in Canada
The authors
Sergey Mokin, MSC, MBA is Consultant, CES, IMS [email protected]
Richard Borrelli, B. COMM, MBA is Principal, CES, IMS [email protected]
Michael Sung, MSC, MBA is Consultant, CES, IMS [email protected]
According to the OECD, Canada currently ranks 27 out of 34member countries in the number of physicians per 1,000persons.1 Around 15% of Canadians report either being unable toaccess a primary care doctor or choosing not to do so.2 A newIMS Health analysis of EMR data reveals diabetes as the mainconsumer of GP resource among chronic conditions in Canada,with key insights for improvement initiatives.
PAGE 16 IMS HEALTH REAL-WORLD EVIDENCE SOLUTIONS & HEOR
InsIghts PRIMARY CARE UTILIZATION IN CANADA
LEVERAGING REAL-WORLD EVIDENCEFindings from the 2013 National Physician Survey in Canadaindicate that 64% of family physicians and 59% of specialistsnow utilize electronic medical records (EMR) in theirpractices.3 The improved availability of EMR data makes it apowerful source of real-world evidence to better understanddemands on the healthcare system. In seeking to evaluateprimary care utilization in the country, a study wasconducted using Canadian data from the IMS Evidence 360EMR database. This provided access to a panel of around 500general practitioners (GPs) and specialists covering morethan 500,000 anonymous patients as a sample of theCanadian population in major chronic indications.
ObjectivesThe cross-sectional EMR study had three key objectives
1. Identify medical conditions that are the highestconsumers of physicians’ time in Canada, measured invisits per patient per year
2. Describe the contributing factors for the medicalcondition associated with the most frequent visits perpatient per year
3. Propose areas of high potential impact for furtherinvestigation and intervention
MethodologyA cohort of all patients with at least one physician visitrecorded during the study period of June 2013–May 2014was extracted from the EMR dataset. The overallconcentration of patient visits and average visits perpatient was then determined across different diagnosedconditions. These conditions were prioritized based onthe average visits per patient, and statistical significancecalculated to identify the top consumer of physicians’time for both the acute and chronic conditions.
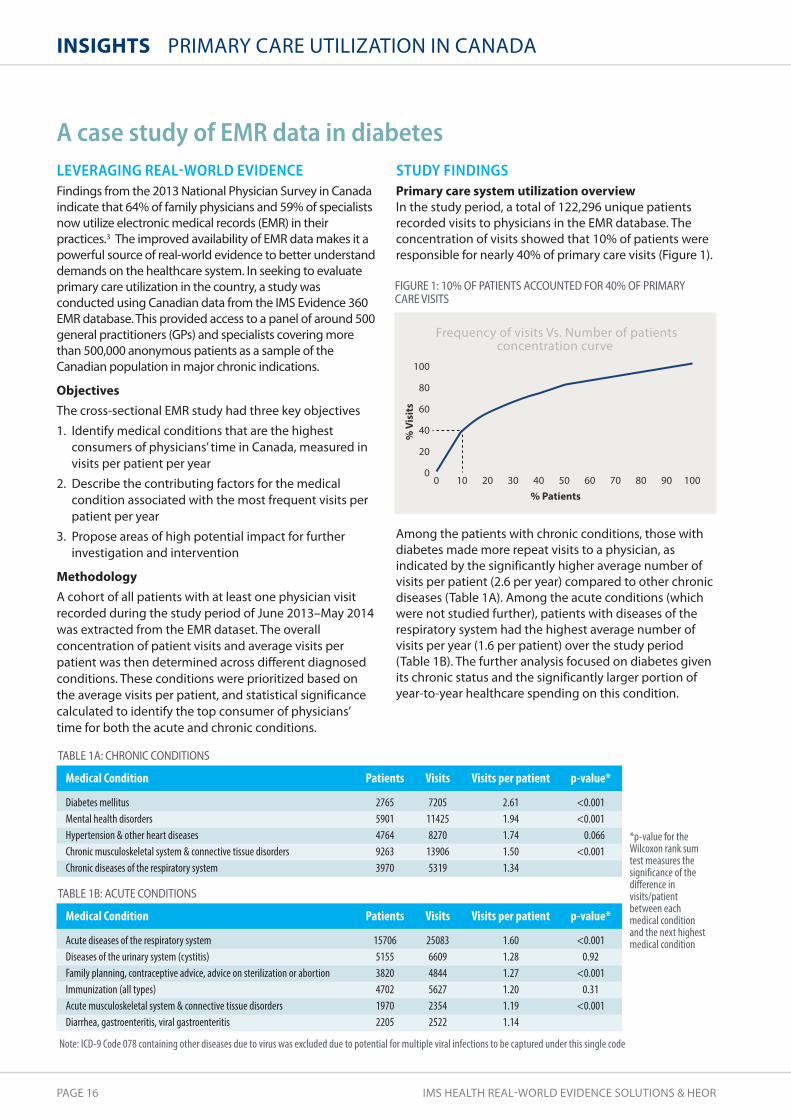
STUDY FINDINGS Primary care system utilization overviewIn the study period, a total of 122,296 unique patientsrecorded visits to physicians in the EMR database. Theconcentration of visits showed that 10% of patients wereresponsible for nearly 40% of primary care visits (Figure 1).
Among the patients with chronic conditions, those withdiabetes made more repeat visits to a physician, asindicated by the significantly higher average number ofvisits per patient (2.6 per year) compared to other chronicdiseases (Table 1A). Among the acute conditions (whichwere not studied further), patients with diseases of therespiratory system had the highest average number ofvisits per year (1.6 per patient) over the study period(Table 1B). The further analysis focused on diabetes givenits chronic status and the significantly larger portion ofyear-to-year healthcare spending on this condition.
A case study of EMR data in diabetes
Frequency of visits Vs. Number of patientsconcentration curve
100
80
60
40
20
00 10 20 30 40 50 60 70 80 90 100
% Patients
% V
isit
s
FIGURE 1: 10% OF PATIENTS ACCOUNTEd FOR 40% OF PRIMARY CARE VISITS
TAbLE 1A: CHRONIC CONdITIONS
Medical Condition
Diabetes mellitus Mental health disordersHypertension & other heart diseases Chronic musculoskeletal system & connective tissue disordersChronic diseases of the respiratory system
Patients
27655901476492633970
Visits
7205114258270139065319
Visits per patient
2.611.941.741.501.34
p-value*
<0.001<0.0010.066
<0.001
TAbLE 1b: ACUTE CONdITIONS
Medical Condition
Acute diseases of the respiratory systemDiseases of the urinary system (cystitis)Family planning, contraceptive advice, advice on sterilization or abortionImmunization (all types)Acute musculoskeletal system & connective tissue disordersDiarrhea, gastroenteritis, viral gastroenteritis
Patients
1570651553820470219702205
Visits
2508366094844562723542522
Visits per patient
1.601.281.271.201.191.14
p-value*
<0.0010.92
<0.0010.31
<0.001
Note: ICD-9 Code 078 containing other diseases due to virus was excluded due to potential for multiple viral infections to be captured under this single code
*p-value for theWilcoxon rank sumtest measures thesignificance of thedifference invisits/patientbetween eachmedical conditionand the next highestmedical condition

ACCESSPOINT • VOLUME 5 ISSUE 9 PAGE 17
continued on next page
Resource use contributors in diabetesTo determine potential contributors to the high level ofresource use in diabetes, data on its associateddemographics, co-morbidities/concomitances and labtests was extracted and analyzed. All diabetic patientswere identified in the cohort on the basis of having at leastone ICD-9 diagnosis code 250 or at least one prescriptionfor an anti-diabetic described by the ATC code A10.
Body Mass Index (BMI), HbA1c and fasting glucose levelswere analyzed for the diabetic cohorts based on the latestavailable result within the study period. Patients withfasting glucose >6.9 mmol/L or HbA1c >7% were furthersegmented as ‘out of control’. Those treated with ametformin product alone for the entire study period andthose who received metformin plus another anti-diabeticclass in the study period were also segmented. Statisticaltests were conducted to determine if observed differencesbetween patient segments were statistically significant.
PatientsA total of 4,390 diabetic patients recorded physician visitsin the EMR dataset over the study period. More males(55%) than females (45%) were observed among thesepatients, which is representative of the Canadian diabeticpopulation (54% males vs. 46% females).4 The majority(73%) were over 50 years of age (Figure 2). Of the 1,697patients with measurable BMI, more than 50% wereclassified as obese (BMI >30.00) and another 30% asoverweight (BMI 25.00–29.99) (Figure 3).
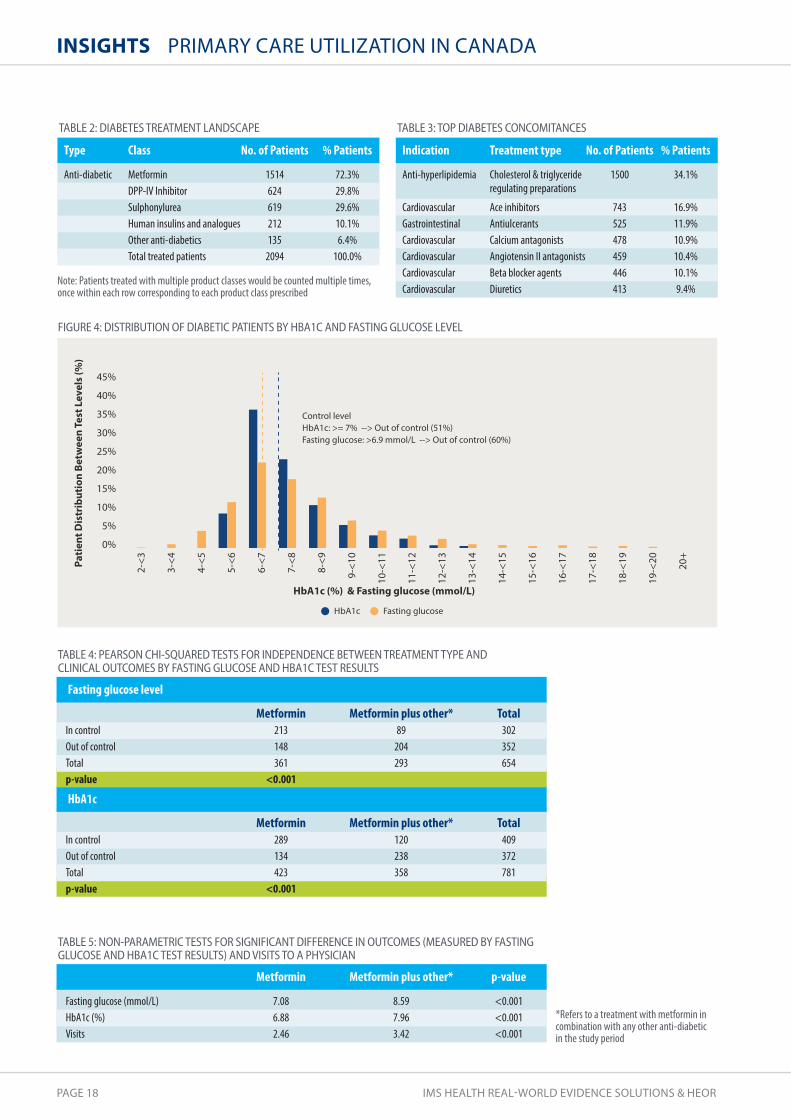
More than 70% of patients were treated with metformin.However, multiple classes of anti-diabetic medicationswere used to manage the disease, with DPP-IV inhibitorsand sulphonylureas being the next two most frequentlyprescribed (Table 2). Diabetic patients were also likely tobe taking medications for cholesterol and triglyceridecontrol as well as for hypertension or other cardiovascularconditions (Table 3). The type and prevalence ofconcomitances were consistent with an older and mostlyoverweight patient population.
Of patients whose med lab test results were available andwho had been treated with an anti-diabetic, distributionanalysis of their most recent HbA1c and fasting glucoselevels (Figure 4) showed that 51% did not meet theHbA1c control threshold and 60% were out of controlbased on the fasting glucose threshold.
Patients on metformin alone were compared with thosewho had metformin plus at least one other anti-diabeticin the study period. There was a statistically significantrelationship between the medication regimen (metforminvs. metformin plus other) and achieved control state (incontrol vs. out of control) within the study period (Table 4).Fasting glucose and HbA1c levels were significantlyhigher for patients treated with metformin and anotheranti-diabetic in the study period. These patients also had asignificantly higher number of GP visits (Table 5). However,further studies are required to determine the link betweenthe medications prescribed and control of diabetes.
60.0
50.0
40.0
30.0
20.0
10.0
0.0<18.50 18.50-24.99 25.00-29.99 >30.000.4%
17.7%
30.8%
51.0%
BMI
% P
atie
nts
FIGURE 3: bMI dISTRIbUTION OF dIAbETIC PATIENTS (N=1697)
30.0
25.0
20.0
15.0
10.0
5.0
0.00-10 11-20 21-30 31-40 41-50 51-60 61-70 71-80 81-900.1% 0.7%
4.1%6.6%
15.3%
25.5%23.4%
16.1%
8.2%
Age Range
% P
atie
nts
FIGURE 2: AGE dISTRIbUTION OF dIAbETIC PATIENTS (N=4390)
The findings of the study utilizing EMR data identify diabetes as theprimary consumer of GP resource among chronic conditions in Canada.“ ”
PAGE 18 IMS HEALTH REAL-WORLD EVIDENCE SOLUTIONS & HEOR
InsIghts PRIMARY CARE UTILIZATION IN CANADA
Fasting glucoseHbA1c
45%
40%
35%
30%
25%
20%
15%
10%
5%
0%
Control level HbA1c: >= 7% --> Out of control (51%) Fasting glucose: >6.9 mmol/L --> Out of control (60%)
HbA1c (%) & Fasting glucose (mmol/L)
Pati
ent D
istr
ibut
ion
Betw
een
Test
Lev
els
(%)
2-<3
3-<4
4-<5
5-<6
6-<7
7-<8
8-<9
9-<1
0
10-<
11
11-<
12
12-<
13
13-<
14
14-<
15
15-<
16
16-<
17
17-<
18
18-<
19
19-<
20
20+
FIGURE 4: dISTRIbUTION OF dIAbETIC PATIENTS bY HbA1C ANd FASTING GLUCOSE LEVEL
Note: Patients treated with multiple product classes would be counted multiple times,once within each row corresponding to each product class prescribed
TAbLE 3: TOP dIAbETES CONCOMITANCES
Indication
Anti-hyperlipidemia
CardiovascularGastrointestinalCardiovascularCardiovascularCardiovascularCardiovascular
Treatment type
Cholesterol & triglycerideregulating preparations
Ace inhibitorsAntiulcerantsCalcium antagonistsAngiotensin II antagonistsBeta blocker agentsDiuretics
No. of Patients
1500
743525478459446413
% Patients
34.1%
16.9%11.9%10.9%10.4%10.1%9.4%
TAbLE 2: dIAbETES TREATMENT LANdSCAPE
Type
Anti-diabetic
Class
MetforminDPP-IV Inhibitor SulphonylureaHuman insulins and analoguesOther anti-diabeticsTotal treated patients
No. of Patients
15146246192121352094
% Patients
72.3%29.8%29.6%10.1%6.4%100.0%
*Refers to a treatment with metformin incombination with any other anti-diabeticin the study period
TAbLE 5: NON-PARAMETRIC TESTS FOR SIGNIFICANT dIFFERENCE IN OUTCOMES (MEASUREd bY FASTINGGLUCOSE ANd HbA1C TEST RESULTS) ANd VISITS TO A PHYSICIAN
Fasting glucose (mmol/L)HbA1c (%)Visits
Metformin
7.086.882.46
Metformin plus other*
8.597.963.42
p-value
<0.001<0.001<0.001
HbA1c
In controlOut of controlTotalp-value
Metformin289134423
<0.001
Metformin plus other*120238358
Total409372781
TAbLE 4: PEARSON CHI-SQUAREd TESTS FOR INdEPENdENCE bETWEEN TREATMENT TYPE ANdCLINICAL OUTCOMES bY FASTING GLUCOSE ANd HbA1C TEST RESULTS
Fasting glucose level
In controlOut of controlTotalp-value
Metformin213148361
<0.001
Metformin plus other*89204293
Total302352654
ACCESSPOINT • VOLUME 5 ISSUE 9 PAGE 19
IMPLICATIONS FOR FUTURE INTERVENTIONSIt has been estimated that by 2020 around 10.8% of theCanadian population will be diagnosed with diabetes, a57% increase over a 10-year period. In addition, 22.6% ofthe population will be classified as pre-diabetic and at riskof developing diabetes in the future.5 This couldsignificantly increase the financial burden to Canadianhealthcare; direct medical costs are projected to reachCN$3.8 billion by 2020 (37% growth since 2010), withabout 5% attributed to GP and specialist visits.5
The findings of the study utilizing EMR data identifydiabetes as the primary consumer of GP resource amongchronic conditions in Canada. With 80% of diabeticpatients classified as being either overweight or obesethere is a clear need for weight management programsand lifestyle counseling.
Many diabetics are also often treated for co-morbiditieswith antihypertensive, gastrointestinal or hyperlipidemiamedications. This is indicative of a more complex patient,leading to greater demands on a primary care physicianin managing these interrelated conditions.
Despite the availability of multiple treatment choices,more than half of the diabetic patients in the study cohortfailed to achieve control of their most recent HbA1clevels. Although the study was not designed to evaluatethe drivers of diabetes control, further investigation into
the real-world effectiveness of various therapies isencouraged. The results could potentially informtreatment choices, resulting in a more efficient allocationof resources.
A further observation from the study is that treatmentcomplexity, as indicated by a drug regimen includingmetformin plus other, is associated with poorerHbA1c/glucose-level control and an increased demandfor physician time. Thus, patients who were unable toachieve target control and required more complextreatment regimens consumed a higher number ofprimary care visits. This implies that maintaining bettercontrol of patients during earlier treatment phases canreduce the additional resource required for moreadvanced diabetes care.
Finally, the study findings point to four key areas withhigh potential impact for intervention to improve thereal-world management of diabetes in primary care
1. Controlling weight
2. Efficiently managing the challenges of treating apatient for multiple conditions
3. Evaluating and identifying the most appropriate andeffective medications per patient
4. Achieving and maintaining effective early control of diabetes.
1 OECD Health Statistics 2014 : How does Canada compare? Available at: http://www.oecd.org/els/health-systems/Briefing-Note-CANADA-2014.pdf.Accessed 6 October, 2014
2 Statistics Canada, Community Health Survey 2012. Available at http://www.statcan.gc.ca/pub/82-625-x/2013001/article/11832-eng.htm. Accessed 6 October, 2014
3 2013 National Physician Survey. The College of Family Physicians of Canada, Canadian Medical Association, The Royal College of Physicians andSurgeons of Canada. Available at: http://nationalphysiciansurvey.ca/wp-content/uploads/2013/10/2013-National-ENr.pdf. Accessed 6 October, 2014
4 Statistics Canada. Data for 2013. Available at: http://www.statcan.gc.ca/tables-tableaux/sum-som/l01/cst01/health53a-eng.htm. Accessed 6 October 2014
5 Canadian Diabetes Association, Diabetes Québec, 2011. Diabetes: Canada at the tipping point. Charting a new path. Available at:http://www.diabetes.ca/CDA/media/documents/publications-and-newsletters/advocacy-reports/canada-at-the-tipping-point-english.pdf. Accessed 6 October 2014
The study findings point to four key areas with high potential impact toimprove the management of diabetes in primary care.“ ”
PAGE 20 IMS HEALTH REAL-WORLD EVIDENCE SOLUTIONS & HEOR
InsIghts SCIENTIFIC-COMMERCIAL RWE SUPPORT
The authors
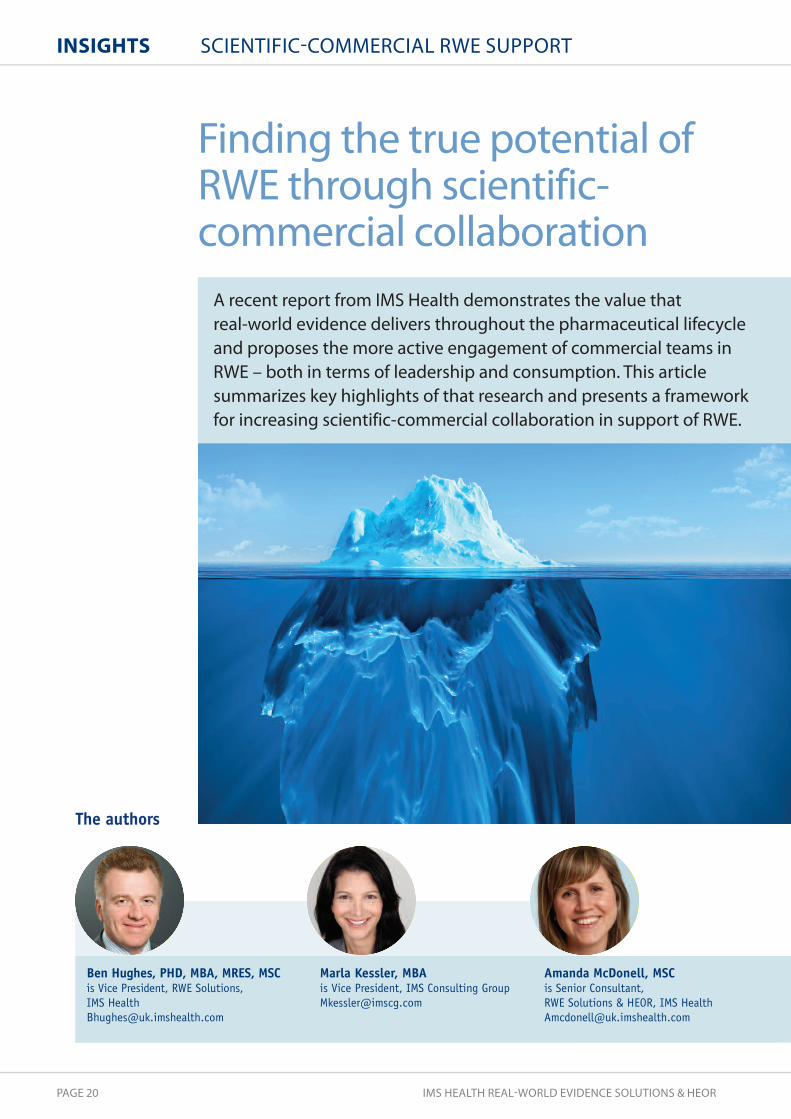
A recent report from IMS Health demonstrates the value that real-world evidence delivers throughout the pharmaceutical lifecycleand proposes the more active engagement of commercial teams inRWE – both in terms of leadership and consumption. This articlesummarizes key highlights of that research and presents a frameworkfor increasing scientific-commercial collaboration in support of RWE.
Marla Kessler, MBA is Vice President, IMS Consulting Group [email protected]
Amanda McDonell, MSC is Senior Consultant, RWE Solutions & HEOR, IMS [email protected]
Ben Hughes, PHD, MBA, MRES, MSC is Vice President, RWE Solutions, IMS [email protected]
Finding the true potential ofRWE through scientific-commercial collaboration

ACCESSPOINT • VOLUME 5 ISSUE 9 PAGE 21
STEPPING UP TO UNTAPPED RWE POTENTIAL The IMS Health report1 shows how a few leadingcompanies pursue RWE as a capability, implementingRWE platforms that move beyond narrow, study-basedapproaches to create sustained value across the productlifecycle and disease franchises. By following thisapproach, a top-10 pharmaco could derive US$1 billion invalue from RWE.
For commercial teams the expanding applications of RWEcome at just the right time, when their stakeholders aredemanding ever more support of a product’s valueproposition just as they and others are producingevidence of its performance in real-life settings.
In parallel, commercial teams appreciate theshortcomings of traditional approaches to gaining marketinsights but feel they lack ready alternatives. Primarymarket research is inherently limited in sample size anddepth of insight, as well as being time intensive. It canalso be inaccurate and thus an inconsistent indicator ofactual behavior. There is a growing need for more time-efficient, fact-based research.
FOUR GOLDEN PRINCIPLES FOR TRANSFORMATIONLeading companies have recognized these challengesand taken steps to address them. Their experiencessuggest Four Golden Principles of using RWE to transformperformance, with direct implications for commercial teams.
1. RWE capabilities converge in a platformLeaders approach platform investments in information,technology and analytics tools with a plan to support arange of uses – both scientific and commercial. In thesecompanies, commercial teams can respond rapidly toqueries about product use and evolving treatmentparadigms rather than having to wait a year to answer themost fundamental questions.
Leaders think carefully about the platform capabilitiesthey should buy versus build, and how best to balancethe benefits of centralization (economies of skill) with thebenefits of embedding capabilities within the businessunit (responsiveness to business needs) (Figure 1).
The necessary layers of capabilities are • Information, networks and data linkage
Increasingly, technology is enabling managed accessto new information with consent. Leaders developrelationships with healthcare stakeholders to accessspecific data sources relevant to their research needs.They are able to link datasets, comply with privacylaws, use technologies that anonymize data at source,or integrate routine databases with traditionalprospective data. The result is a rich end-to-end view of patient journeys.
• technology-enabled tools and analytics Leaders provide users with direct access to data insightsthrough user-friendly interfaces. Pre-defined, validatedqueries under scientific leadership facilitate simplerequests. This flexibility, coupled with high-performance architecture, reduces time to insight. Itdoes not replace experienced scientific and statisticalstaff, but rather ensures their focus on value-addedinstead of routine tasks.
FIGURE 1: CAPAbILITIES LAYER IN AN RWE PLATFORM
Realizing a US$1 billion opportunity through scientific-commercial collaboration
continued on next page
RWE
capa
bilit
ies
stac
k
Business speci�c setup/build
Partially consolidated capabilities/build
Consolidated capabilities/buy
Channels for
dissemination & engagement
CoEs for scienti�c & commercial analytics
Technology-enabled tools & analytics
Information, networks & data linkage
5% brand growth via RWE-enabled marketing20% launch improvement via patient pool segmentation3-month acceleration of market access submissions25-90% cost savings versus primary researchIN
CLU
DIN
G
$1bn
PAGE 22 IMS HEALTH REAL-WORLD EVIDENCE SOLUTIONS & HEOR
InsIghts SCIENTIFIC-COMMERCIAL RWE SUPPORT
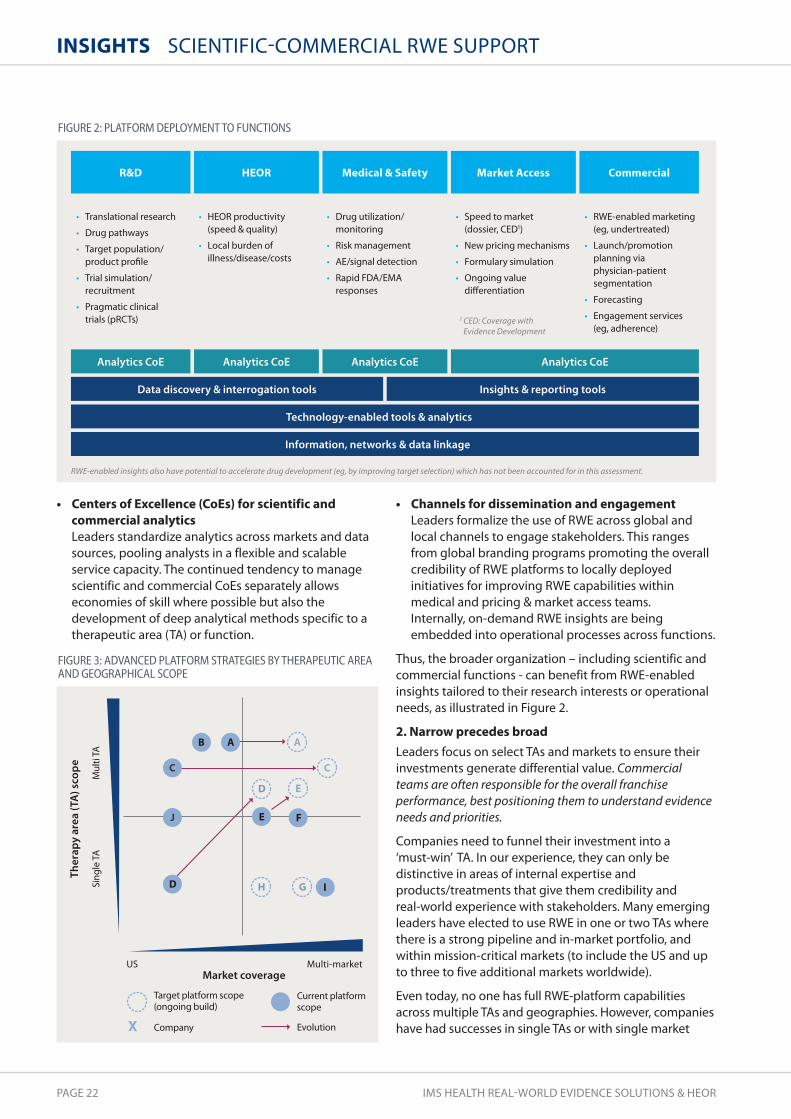
• Centers of Excellence (CoEs) for scientific andcommercial analytics Leaders standardize analytics across markets and datasources, pooling analysts in a flexible and scalableservice capacity. The continued tendency to managescientific and commercial CoEs separately allowseconomies of skill where possible but also thedevelopment of deep analytical methods specific to atherapeutic area (TA) or function.
• Channels for dissemination and engagementLeaders formalize the use of RWE across global andlocal channels to engage stakeholders. This rangesfrom global branding programs promoting the overallcredibility of RWE platforms to locally deployedinitiatives for improving RWE capabilities withinmedical and pricing & market access teams. Internally, on-demand RWE insights are beingembedded into operational processes across functions.
Thus, the broader organization – including scientific andcommercial functions - can benefit from RWE-enabledinsights tailored to their research interests or operationalneeds, as illustrated in Figure 2.
2. narrow precedes broad Leaders focus on select TAs and markets to ensure theirinvestments generate differential value. Commercialteams are often responsible for the overall franchiseperformance, best positioning them to understand evidenceneeds and priorities.
Companies need to funnel their investment into a ‘must-win’ TA. In our experience, they can only bedistinctive in areas of internal expertise andproducts/treatments that give them credibility and real-world experience with stakeholders. Many emergingleaders have elected to use RWE in one or two TAs wherethere is a strong pipeline and in-market portfolio, andwithin mission-critical markets (to include the US and upto three to five additional markets worldwide).
Even today, no one has full RWE-platform capabilitiesacross multiple TAs and geographies. However, companieshave had successes in single TAs or with single market
Data discovery & interrogation tools
Technology-enabled tools & analytics
Information, networks & data linkage
Insights & reporting tools
R&D HEOR Medical & Safety Market Access Commercial
Translational research
Drug pathways
Target population/ product pro�le
Trial simulation/ recruitment
Pragmatic clinical trials (pRCTs)
Drug utilization/ monitoring
Risk management
AE/signal detection
Rapid FDA/EMA responses
Speed to market (dossier, CED1)
New pricing mechanisms
Formulary simulation
Ongoing value di�erentiation
RWE-enabled marketing (eg, undertreated)
Launch/promotion planning via physician-patient segmentation
Forecasting
Engagement services (eg, adherence)
HEOR productivity (speed & quality)
Local burden of illness/disease/costs
1 CED: Coverage with Evidence Development
RWE-enabled insights also have potential to accelerate drug development (eg, by improving target selection) which has not been accounted for in this assessment.
Analytics CoE Analytics CoE Analytics CoE Analytics CoE
X
Ther
apy
area
(TA
) sco
pe
Market coverageUS Multi-market
Target platform scope (ongoing build)
Current platform scope
Company Evolution
Sing
le T
AM
ulti
TA
D
J
C C
D
GH
A AB
FIGURE 2: PLATFORM dEPLOYMENT TO FUNCTIONS
FIGURE 3: AdVANCEd PLATFORM STRATEGIES bY THERAPEUTIC AREAANd GEOGRAPHICAL SCOPE
ACCESSPOINT • VOLUME 5 ISSUE 9 PAGE 23
approaches that they have expanded over time, as shownby the migration of individual platforms in Figure 3.
Many will debate this view, given the desire to drivedistinctive capabilities simultaneously in all key TAs,markets and functions. In reality, it takes several years todevelop the necessary capabilities and deliver value,which is easier to do when those involved are aligned bycommon data and/or challenges, often defined by TA.Companies outlining a transformation agenda must setthe right expectations. There is no silver bullet; successrequires a multi-year effort of continuous improvement.
3. Commercial leads the charge HEOR and other scientific colleagues are sometimescritical of commercial-driven RWE, as the speed to insightis contrary to their experience of time-intensive studydesign and implementation. Yet platform-based RWEcapabilities will help them deliver more and betterresearch publications with greater scientific and marketimpact. Commercial teams must champion the overallplatform to broaden RWE’s application and value formany reasons – including their unique ability to secureresources – while HEOR continues to lead thedevelopment and implementation of scientificallyrigorous studies.
The need for commercial to take the lead in thistraditionally scientific domain is not immediately obvious.However, leaders realize that scientific can be the datacustodian and user of RWE for protocol-driven studieswhile commercial can be given appropriate access todrive strategic decisions. Strong governance, allowingnominated individuals outside scientific access to datainsights, enables scale in RWE investments.
The largest immediate financial value of RWE is insupporting about-to-launch and launched products,areas where commercial drives decision making. Manydecisions related to labeling and identifying targetpatients, contracting and pricing strategies, and launchplanning are transformed by RWE, requiring commercialto be close to RWE strategy. Ultimately, only franchiseleaders can really champion the longer-term investmentin their patients and key markets.
How can commercial initiate its leadership role in apragmatic way? More product teams are now sharingtheir priorities across functions and mapping their currentand pending evidence plans against them. One companyreoriented several expensive prospective studies to builda platform capability linking key information sets forrequired insights. Thus, longer-term evidence planningand commercial’s ability to remove organizational barriersis an emerging vehicle for RWE leadership.
4. speed is a goal Leaders seek speed to insight and can perform end-to-end scientific studies in weeks. In their vision of on-demand insights, quality and speed are harmonious, nottrade-offs. With better, timelier information, commercialteams can become more nimble and work more effectivelywith their customers.
Platform-based RWE capabilities challenge the paradigmthat robust, scientific-led insights require significant time.With existing data agreements in place and pre-definedanalytics established, analyses can start almost immediately.In companies where RWE delivery teams have a customerservice mindset (at least three to our knowledge), fullscientific studies using platform-enabled analytics havebeen completed in less than a month, rather than up to a year.
Productivity & cost savings US$100m
Clinical development* US$100-200m
Initial pricing & market access* US$100m
Launch planning & tracking US$150m
Safety & value demonstration US$200-600m
Commercial
US$200-300m
Development Launch In-market
* Selected operational opportunities only; excludes increased R&D pipeline throughput and better pricing
spend e�ectiveness
FIGURE 4: VALUE CAPTURE FROM RWE ACROSS LIFECYCLE FOR A TOP-10 PHARMACO
continued on next page

PAGE 24 IMS HEALTH REAL-WORLD EVIDENCE SOLUTIONS & HEOR
InsIghts SCIENTIFIC-COMMERCIAL RWE SUPPORT
Insights from RWE can provide commercial teams withfeedback on market changes and the impact of theiractions within weeks. Leaders realize such speed onlymatters if there is willingness to act on these insightspromptly. This could mean changing sales call plans,reprioritizing physician targets, altering or droppingpromotional plans and even engaging with payers morefrequently or differently. RWE leaders make this more real-time information available, adopt more dynamicmarketing plans, and empower key account managersand others to leverage the new knowledge.
SOURCES OF THE US$1 BILLION RWEOPPORTUNITY The experience of companies living the Four GoldenPrinciples demonstrates the significant value RWE candeliver at different stages of the pharmaceutical lifecycle.Our research identified six main areas of value capture:clinical development; initial pricing & market access;launch planning & tracking; safety & value demonstration;commercial spend effectiveness; and overall productivity& cost savings. As shown in Figure 4, most of the value islikely to come after product launch.
5% brand growth via RWE-enabled marketing
20-50% improved promotion via physician–patient segments
Better forecasting via disease progression models
Formulary improvement from Tier-3 to -2
Avoidance of label changes
2-week responses to FDA/3rd party journal publications
20% launch improvement via patient pool segmentation
Rapid adjustment of messaging/resource allocation at launch
3-month acceleration of market access submissions Payment by use/indication, more e�ective price negotiations
(not quanti�ed) Conditional access via coverage with evidence development
25-90% cost saving versus primary market research
Doubling of impact factor of publications1
30% improvement in trial enrolment
Reduction in strategic trial design �aws Better product pro�le design (not quanti�ed)
Examples of impact
1 Hruby GW, et al. J Am Med Inform Assoc, 2013; 20: 563-567
Clinical development*
Productivity & cost savings
Initial pricing & market access*
Launch planning & tracking
Safety & value demonstration
Commercial spend e�ectiveness
Traditional focus Leaders’ additional focus
US$200-300m
US$150m
US$100m
US$100-200m
US$100m
US$100m (upside)
US$100-500m
(downside avoidance)
* Selected operational opportunities only; excludes increased R&D pipeline throughput and better pricing
FIGURE 5: CASE STUdIES OF RWE IMPACT ACROSS OPPORTUNITY AREAS

ACCESSPOINT • VOLUME 5 ISSUE 9 PAGE 25
In companies without RWE platform capabilities, the rolesof scientific and commercial are compartmentalized:scientific teams are asked for studies to support specificad hoc arguments without long-term strategic input,while commercial teams face increasing scrutiny of theirproducts but are often unarmed with the evidence todefend them. Leaders have built RWE capabilities thatspan both functions, enabling immediate and strategicevidence generation.
Diving deeper into the buckets of RWE value, the researchsought to provide more information about the value driversand financial magnitude. Case studies enabled a richerunderstanding. While RWE can help increase revenues, itcan also avoid downside risk as well as unnecessary costs.Of particular interest were areas where leaders thinkbeyond traditional RWE applications (Figure 5).
IMPLICATIONS FOR SCIENTIFIC ANDCOMMERCIAL COLLABORATION The involvement of commercial does not diminish therole of HEOR and other scientific and medical teams.Rather, it should be complementary, serving to focus onremoving roadblocks to broader commitment for RWEand increasing its overall application to demonstrate thevalue of a franchise.
At the same time, scientific teams should champion thetreatment of RWE as a capability instead of a series ofstudies to increase their overall effectiveness andproductivity. With the right RWE information and tools,these teams can focus on the highest-value analyticsrather than lower value activities such as ad hoc datasourcing and protocol development. Just as commercialteams will need to generate, analyze and apply insightsmore frequently, scientific colleagues will have tointegrate more seamlessly into the faster pace of decisionmaking enabled by systematic application of RWE.
Best practice example A leading company provides an intriguing lens into bestpractice. It began its RWE journey by creating an integratedevidence platform in response to value and safetydemonstration challenges. When the FDA questioned theappropriate use of its blockbuster oncology product, up toUS$500m of revenue was placed at risk due to potentiallabel changes. By developing the broadest RWE platform atthe time, the company enabled a variety of insights toinform discussions with a multitude of stakeholders,successfully responding to the FDA challenge.Having experienced the power of RWE insights, thecompany continued to invest beyond value and safetydemonstration. Commercial leaders acquainted with RWEcapabilities started to systematically lever detailed patientpathways to understand product use, identify patterns ofunder-diagnosis and under-treatment, and shape highlytargeted marketing campaigns. These campaigns nearlydoubled sales growth. Over time, RWE became thecompany’s currency and competitive advantage forengaging health systems, with granular forecasting anddisease progression models levered by a series of medicalcenter partners for their own service planning. For thefirst time in the industry it effectively developed a closed-loop system, using insights to engage and improvepatient pathways.
SIGNIFICANT ADDED VALUEThe opportunity for RWE to add value is thus substantial,especially for in-market products. As the principalorganizational owners of these products, commercialneeds to step up and take accountability for implementingRWE capabilities. Working collaboratively and cross-functionally with scientific will ensure that investment inRWE spans the interests of both respective functions.
1 Hughes B, Kessler M, McDonell A. Breaking New Ground with RWE: How Some Pharmacos are Poised to Realize a $1 Billion Opportunity. A White Paper from IMS Health. August 2014.
The opportunity for RWE to add value is substantial but commercial needsto step up and take accountability for implementing RWE capabilities.“ ”
PAGE 26 IMS HEALTH REAL-WORLD EVIDENCE SOLUTIONS & HEOR
The author
John Rigg, PHD is director Predictive Analytics, RWE Solutions, IMS [email protected]
Improving outcomes through predictive modeling
Predictive modeling involves assigning values to new or unseendata. With growing promise across a wide range of fields, it isincreasingly being applied in various healthcare settings both toreduce costs and drive quality improvements. However, while itspotential contribution is substantial, even exciting, applicationsinvolving its use are not widespread and demonstrable evidenceon effectiveness is limited.
InsIghts PREDICTIVE MODELING
ACCESSPOINT • VOLUME 5 ISSUE 9 PAGE 27
Potential and challenges for developing successful models
Referencing real-world cases studies that have emerged,this article discusses ways in which predictive modeling iscurrently being used, considers the potential forinnovations from machine learning to extend its valueand accuracy, and highlights the challenges todeveloping a successful predictive modeling application.
DIVERSE APPLICATIONS IN PRIMARY CAREThe scope of predictive modeling applications is wideranging, with models used to stratify risk both at apopulation and patient level. At the population level, riskstratification is routinely employed by payers/commissioners to understand resource need and helpshape service delivery. Typically, this involves estimates ofdisease prevalence, including age-demographicadjustments. These models will likely becomeincreasingly advanced, helping to quantify the depth ofclinical need and define the type and scope of service.
At patient level, the applications principally focus onidentifying patients at high risk of particular events suchas unplanned hospital (re)admission, or the onset of achronic disease such as diabetes. High-risk patients arethen targeted with an intervention aimed at mitigatingthe event.
1. Reducing hospitalizations
Identifying patients at greatest risk of unplanned hospitalreadmission is currently by far the most widespread useof predictive modeling in primary care.1 Readmissionswithin thirty days of discharge are common, costly andhazardous. Moreover, many readmissions are consideredavoidable.2 Reducing them is thus a major focus invirtually all healthcare systems.3,4,5 It has certainlycaptivated policymakers as a goal that can both improvequality and reduce healthcare costs, seen in the US, forexample, with powerful incentives in the PatientProtection and Affordable Care Act penalizing hospitalsthat have higher-than-expected readmission rates.5
Heart failure has been a particular target, being one of themost common reasons for hospitalization in thedeveloped world and accounting for the highest thirty-day readmission rates.3
Parkland Health & Hospital System: Informing CHF andexpanded disease areas One example of a successful program is Parkland Health &Hospital System in Dallas, Texas. In 2009, Parkland begananalyzing electronic medical records (EMR) with the aimof using predictive modeling to identify patients at highrisk of hospital readmission. The initial focus was oncongestive heart failure (CHF). Today, case managers andother frontline providers receive details of high-riskpatients on a near real-time basis, information that is usedto prioritize workflow and allocate scarce resources tosupport those most in need. Interventions are bothhospital- and community-based.6
Evaluation of the program identified a reduction in thirty-day all-cause readmission rates from 26.2% to 21.2%.7 Asobserved in an editorial by McAlister, “This effect size wasachieved even though the programme was only offered toapproximately a quarter of discharged patients, was onlydeployed on weekdays (weekend discharges actually exhibitthe highest rate of readmissions) and despite the fact thatonly a minority of readmissions may be truly preventable.”3
Given the observed fall in readmissions and costs for CHFpatients at Parkland, the program has been expanded topatients with diabetes, acute myocardial infarction andpneumonia. Preliminary data suggests similar successwith readmission rates in these conditions.6
NorthShore University HealthSystem: Supportinghospital and primary care Positive results have also been achieved through the useof an effective predictive model at NorthShore UniversityHealthSystem in Chicago. Reports stratifying inpatients byhigh, medium or low risk of readmission in 30 days areprovided to health system hospitalists on a daily basis andscores noted as a value in every inpatient EMR.
reduction inre-admission rates26% 21%
continued on next page

PAGE 28 IMS HEALTH REAL-WORLD EVIDENCE SOLUTIONS & HEOR
InsIghts PREDICTIVE MODELING
These have proved so useful that reports are also nowsent to the system’s primary care physicians listing theirpatients with a high risk of readmission. The program hasseen a reduction in readmissions from 35% to 28%among high-risk patients.8
Despite these successes, recent reviews reveal littlesystematic evidence on what works in terms of community-based alternatives to hospital admissions.4,5,9 However, thereis evidence to suggest some impact of particular initiativesin targeted populations, such as education with self-management in asthma, and specialist heart failureinterventions. Moreover, certain types of interventions, suchas post-discharge telephone calls, have also been identifiedas effective.5 Beyond that, most other interventions appearto have no effect in reducing emergency admissions in awide range of patients. There is a clear need to betterunderstand what works and for whom.
Interventions to reduce emergency admissions take placewithin a complex environment where the nature andstructure of existing care services, individual professionalattitudes, patient and family preferences, and generalattitudes to risk management can affect theirimplementation. While some interventions fail to reduceadmissions, they may have other beneficial effects, such asreducing length of stay or improving the experience of care.4
2. Mitigating risk
NorthShore University HealthSystem: Predictivemodeling in hypertensionNorthShore is a pioneer in the use of various risk stratificationapplications. One success story involves predictive modelingto identify undiagnosed patients with hypertension (HTN).10
Although many patients with HTN are actively managed,the condition is often overlooked. The risk stratification isbased on three screening algorithms, developed usingestablished HTN diagnosis guidelines, to identify patientswith consistently elevated blood pressure readings andexclude those with only intermittent elevations. Patientsare considered at risk for undiagnosed HTN if they meetthe criteria of any of the three algorithms. The screeningtool was built using outpatient data from the NorthShoredata warehouse and the model has an accuracy rate(Predictive Positive Value) of approximately 50%.
Veterans Health Administration (VHA): Population-widerisk scoresThe VHA has also invested heavily in risk stratificationapplications, covering its entire primary care population.11
This includes models that output a patient’s percentilescores associated with risk of hospitalization andmortality. Updated weekly to reflect changes in individualclinical status, the models rely on six data domains pulledfrom the VHA’s extensive data platform: demographics;
diagnoses (inpatient and outpatient); vital signs;medications; laboratory results; and prior use of healthservices. Risk scores can be accessed on-line by each careteam, alongside other information such as activediagnoses, recent visits to primary care and enrollment incare management programs. They can also be renderedas high-resolution geospatial maps to assist managerswith program planning and determining where new sitesfor service delivery might be located.
While it is too early to determine whether the risk scoreshelp improve outcomes, the VHA suggests that based onthe frequency of access, healthcare providers are findingthem worthwhile. In addition, testimonials from cliniciansand care managers indicate that the scores are moreuseful than clinical reminders, since each score takes intoaccount the patient’s unique needs and allows staffmembers to focus on what is most likely to improvefuture outcomes on an individual basis.
The VHA has also implemented a system for earlydetection and management of chronic kidney disease,including risk-based clinical EMR reminders which play animportant part in the effectiveness of the program.12
DEVELOPING AND APPLYING A PREDICTIVE MODELAn outline of the main stages associated with developing,validating and operationalizing a typical predictingmodeling application is shown in Figure 1 (page 30) anddescribed below.
1. Cohort creation from raw input dataIn the initial stage, patient cohorts are created from theinput data. There are generally two: one cohort for modeldevelopment, the other for validation. A commonpractice is to randomly split the data approximately two-thirds and one-third between development andvalidation cohorts respectively.
2. Algorithm developmentIn the second stage, the predictive model is estimated onthe development sample using an appropriate statisticalmethod such as regression analysis. The model is then usedto identify at-risk patient profiles and key predictors/characteristics are described and clinically verified.
3. Algorithm validationIt is important that model development and validationare carried out on separate data. This enablesindependent assessment of its performance, ensuring it isnot ‘overfitting’ (where a model may accurately describedata upon which it is estimated but poorly describe newor unseen data). Thus, the third stage involves detailedevaluation of model performance using a variety ofmetrics. In the case of hospital readmission modeling, for example, the metrics may include the number of

ACCESSPOINT • VOLUME 5 ISSUE 9 PAGE 29
readmitted patients correctly predicted to be readmitted,the number of readmitted patients incorrectly predictednot to be readmitted, and the Area Under Curve (AUC; asummary measure of model accuracy).
4. Model operationalizationFinally, the model is operationalized to identify high-riskpatients. This can be done in a number of ways, frompaper-based forms used by clinicians to a host oftechnological solutions. One option is a real-time clinicalalert/screening tool that generates a pop-up on the EMRsystem each time a high-risk patient presents.
THE PROMISE OF MACHINE LEARNINGTo-date, risk models in primary care have almostexclusively employed standard statistical methods, suchas regression analysis. State-of-the-art techniques fromthe field of machine learning13 are particularly effective atproducing robust predictions in complex settings.
Machine learning, sometimes referred to as predictiveanalytics, encompasses the fields of artificial intelligenceand data mining and is designed to identify complex, oftensubtle, patterns in data – detecting ‘signal’ from ‘noise’.Examples in healthcare include identifying genotype-phenotype associations predictive of disease risk14 and theautomatic extraction of accurate diagnostic informationfrom medical images, such as MRI scans and X-rays.15
Next generation predictive modeling applicationsInnovative methods from machine learning are likely toplay an important part in some of the next generation ofpredictive modeling applications in primary care inseveral ways
1. First, they can help improve the accuracy of currentapplications, such as readmission modeling. The benefitis likely to be most notable where many potential riskfactors are modeled simultaneously (eg, where data iscombined from multiple care settings).
2. Second, risk models almost always simply identifyhigh-risk patients for the event in question. Wherepatients identified are eligible for a range ofinterventions, models need to go beyond currentpractice and determine which patients are most likelyto benefit from which intervention. Given theconsiderable heterogeneity in patient response todifferent interventions, predictive modelingapplications potentially could be far more effective byunpicking this heterogeneity.
In statistical modeling and machine learning, this is anarea known as uplift modeling which relates to theexpected ‘uplift’ (improvement in outcome) if a patient
were to receive an alternative intervention compared toa benchmark. While standard statistical approaches(such as regression analysis) are not designed tooptimize this problem, recent innovations in machinelearning have demonstrated remarkable effectiveness inthis area16,17,18 and can thus help ensure that the patientslikely to benefit most from an intervention will receive it.
3. Third, the journey towards precision medicine will befacilitated by physician decision support tools designedto show expected/predicted outcomes associated withdifferent treatment choices, based on detailed patient-level demographic, treatment history, biomarker andother information. Machine learning can help providerobust evidence for complex disease states. TheEuResist project19 is a key case in point, involvingmanagement of treatment for a complex disease (HIV)and highly-effective machine learning algorithms.Uplift modeling is important here, too, sincepersonalized medicine means the right patientreceiving the right treatment which in turn involvesanalysis of expected outcomes for different treatments.
4. Finally, machine learning can help identify patients withconditions that often slip beneath the radar in primarycare practice, such as those with rare or early stagediseases. Machine learning comes into its own if thereare multiple idiosyncratic factors that determinewhether the condition is present; these arecircumstances calling for specialist, purpose-builtmethods for detecting ‘signal from noise’.
Clinical Vigilance for Sepsis: Sophisticated early detectionSophisticated screening tools are more common insecondary rather than primary care. Clinical Vigilance forSepsis is a sophisticated early detection system for sepsis,20
a disease that often goes undetected until too late andwhere early detection depends on multiple patient-specificfactors. There are several applications to detect sepsis, manywith a high rate of false-positive signals, but a particularlyeffective solution uses machine learning techniques,including natural language processing of unstructured data.
The system has more than one hundred variables derivedfrom real-time telemetry data from bedside machines,structured data (such as medical codes and other numericvalues) and unstructured data (such as doctor’s notes andoperative reports). When it detects that a patient isheading towards sepsis, a text is sent to the doctor ornurse. Hospitals using the tool are able to spot sepsisearlier, which translates into quicker administration ofantibiotics and a shorter stay in the hospital. For a 300-bed hospital, an average of US$2 million in direct savingsis estimated as measured by length of stay.
continued on next page
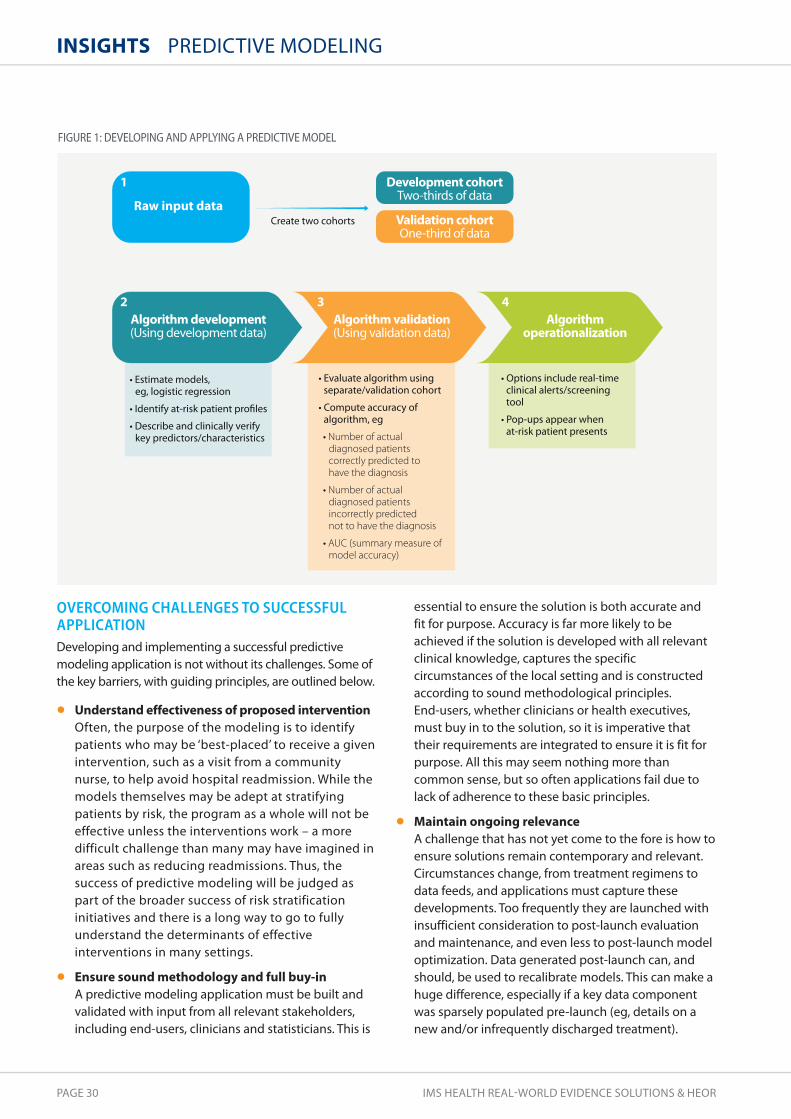
PAGE 30 IMS HEALTH REAL-WORLD EVIDENCE SOLUTIONS & HEOR
InsIghts PREDICTIVE MODELING
OVERCOMING CHALLENGES TO SUCCESSFULAPPLICATIONDeveloping and implementing a successful predictivemodeling application is not without its challenges. Some ofthe key barriers, with guiding principles, are outlined below.
• Understand effectiveness of proposed interventionOften, the purpose of the modeling is to identifypatients who may be ‘best-placed’ to receive a givenintervention, such as a visit from a communitynurse, to help avoid hospital readmission. While themodels themselves may be adept at stratifyingpatients by risk, the program as a whole will not beeffective unless the interventions work – a moredifficult challenge than many may have imagined inareas such as reducing readmissions. Thus, thesuccess of predictive modeling will be judged aspart of the broader success of risk stratificationinitiatives and there is a long way to go to fullyunderstand the determinants of effectiveinterventions in many settings.
• Ensure sound methodology and full buy-in A predictive modeling application must be built andvalidated with input from all relevant stakeholders,including end-users, clinicians and statisticians. This is
essential to ensure the solution is both accurate and fit for purpose. Accuracy is far more likely to beachieved if the solution is developed with all relevantclinical knowledge, captures the specificcircumstances of the local setting and is constructedaccording to sound methodological principles. End-users, whether clinicians or health executives,must buy in to the solution, so it is imperative thattheir requirements are integrated to ensure it is fit forpurpose. All this may seem nothing more thancommon sense, but so often applications fail due tolack of adherence to these basic principles.
• Maintain ongoing relevance A challenge that has not yet come to the fore is how toensure solutions remain contemporary and relevant.Circumstances change, from treatment regimens todata feeds, and applications must capture thesedevelopments. Too frequently they are launched withinsufficient consideration to post-launch evaluationand maintenance, and even less to post-launch modeloptimization. Data generated post-launch can, andshould, be used to recalibrate models. This can make ahuge difference, especially if a key data componentwas sparsely populated pre-launch (eg, details on anew and/or infrequently discharged treatment).
Raw input data
Development cohort
Algorithm development
Validation cohort
Algorithm validation Algorithmoperationalization
Number of actual diagnosed patients correctly predicted to have the diagnosis
Number of actual diagnosed patients incorrectly predicted not to have the diagnosis
AUC (summary measure of model accuracy)
1
2 3 4
FIGURE 1: dEVELOPING ANd APPLYING A PREdICTIVE MOdEL
1 Kansagara D, Englander H, Salanitro A, Kagen D, Theobald C, Freeman M, Kripalani S. Risk prediction models for hospital readmission: A systematicreview. JAMA, 2011; 306(15):1688-1698. doi:10.1001/jama.2011.1515
2 Van Walraven C, Bennett C, Jennings A, Austin PC, Forster AJ. Proportion of hospital readmissions deemed avoidable: A systematic review. CMAJ,2011; 183: E391-402
3 McAlister FA. Decreasing readmissions: It can be done but one size does not fit all. BMJ Qual Saf, 2013; 22: 975-976. Epub 4 September 2013doi:10.1136/bmjqs-2013-002407
4 Purdy S. Avoiding hospital admissions. What does the research evidence say? The King’s Fund, 2010, December. ISBN: 978 1 85717 607 05 Hansen LO, Young RS, Hinami K, Leung A, Williams MV. Interventions to reduce 30-day rehospitalization: A systematic review, 2011, Oct 18; 155(8):520-8. doi: 10.7326/0003-4819-155-8-201110180-00008.
6 AHRQ. Hospital uses data analytics and predictive modeling to identify and allocate scarce resources to high-risk patients, leading to fewerreadmissions. Available at: https://innovations.ahrq.gov/profiles/hospital-uses-data-analytics-and-predictive-modeling-identify-and-allocate-scarce-resources. Accessed 21 October, 2014.
7 Amarasingham R, Patel PC, Toto K, Nelson LL, Swanson TS, Moore BJ, et al. Allocating scarce resources in real-time to reduce heart failure admissions:A prospective, controlled study. BMJ Quality Saf, 2013; 22(12): 1-8
8 Van Dyke M. Predictive analytics: Pinpointing how best to allocate patient resources. Healthcare Financial Management Association, 1 March, 2013.Available at http://www.hfma.org/Content.aspx?id=16069. Accessed 27 October, 2014
9 Bardsley M, Steventon A, Smith J, Dixon J. Evaluating integrated and community-based care. How do we know what works? Nuffield Trust, 2013,June. Available at: http://www.nuffieldtrust.org.uk/sites/files/nuffield/publication/evaluation_summary_final.pdf. Accessed 21 October, 2014
10 Rakotz MK, Ewigman BG, Sarav M, Ross RE, Robicsek A, Konchak CW, et al. A technology-based quality innovation to identify undiagnosedhypertension among active primary care patients. Ann Fam Med, 2014; 12(4):352-358. doi: 10.1370/afm.1665.
11 Fihn D, Francis J, Clancy C, Nielson C, Nelson K, Rumsfeld J, Cullen T, Bates J, Graham GL. Insights from advanced analytics at the Veterans HealthAdministration. Health Affairs, 2014; 33(7): 1203-1211
12 Patel TG, Pogach LM, Barth RH. CKD screening and management in the Veterans Health Administration: The impact of system organization and aninnovative electronic record. Am J Kidney Dis, 2009; 53(3 Suppl 3): S78-S85
13 Hastie T, Tibshirani R, Friedman J. The elements of statistical learning: Data mining, inference, and prediction. Springer Series in Statistics 2009 (2ndEdition), New York: Springer
14 Gondro C, van der Werf J, Hayes B. Genome-wide association studies and genomic prediction. Methods in Molecular Biology. New York: HumanaPress. 2013; 1019. Springer Protocols.
15 Criminisi A, Shotton J. Decision forests for computer vision and medical image analysis. 2013. London: Springer-Verlag 16 Kuusisto F, Santos Costa V, Nassif H, Burnside E, Page D, Shavlik J. Support vector machines for differential prediction. Computer Science, 2014;
8725: 50-65 17 Sołtys M, Jaroszewicz S, Rzepakowski P. Ensemble methods for uplift modeling. Data Min Knowl Disc, 2014 September. DOI 10.1007/s10618-014-0383-9. 18 Radcliffe NJ, Surry PD. Real-world uplift modelling with significance-based uplift trees. Portrait Technical Report. 2011 TR-2011-1, Stochastic solutions 19 EUResist. http://www.euresist.org 20 Woodie A. Fighting sepsis with real-time analytics. Datanami. 2014, March. Available at:
http://www.datanami.com/2014/03/04/fighting_sepsis_with_real-time_analytics/ Accessed 21 October, 2014
ACCESSPOINT • VOLUME 5 ISSUE 9 PAGE 31
HIGH TRANSFORMATIONAL POTENTIALWith the knowledge to overcome the challenges itpresents, predictive modeling has a part to play inimproving the quality, efficiency and effectiveness ofprimary care. Successful applications, albeit currentlyconfined to isolated pockets of best practice, illustrate thepotential for transformational innovation. Importantapplications include physician decision support tools,screening tools and early warning systems.
Standard statistical methods are perfectly adequate for themodels underpinning many of these applications. However,innovations from the world of machine learning are likely tobe pivotal to many of the next generation of predictivemodeling applications, especially where personalizedmedicine involves complex disease states and conditions(such as many rare diseases) are difficult to detect.
Predictive modeling has a part to play in improving the quality,efficiency and effectiveness of primary care with the potential fortransformational innovation.
“”

PAGE 32 IMS HEALTH REAL-WORLD EVIDENCE SOLUTIONS & HEOR
InsIghts
Mats Rosenlund, PHD, MPH is Principal, RWE Solutions & HEOR, IMS [email protected]
Holistic real-world databrings a new view of patientsand diseases
SCANDINAVIAN REAL-WORLD DATA
A promise of increasingly rich, anonymous clinical data is theability to understand more about the way in which modernhealthcare affects the patient experience in the real world, basedon all the relevant evidence to make informed and confidentdecisions. In reality, this goal remains a vision of the future inmany cases. We are, however, seeing breakthrough researchopportunities using unparalleled Scandinavian healthcare dataand linking critical variables for the first time ever across theentire patient journey.
The authors
Ragnar Linder, MSC is Principal, RWE Solutions & HEOR, IMS [email protected]

ACCESSPOINT • VOLUME 5 ISSUE 9 PAGE 33
Gateway to breakthrough outcomes research globally
FIGURE 1: SCANdINAVIAN REAL-WORLd dATA IS UNPARALLELEd IN dEPTH ANd LONGITUdINAL AVAILAbILITY
continued on next page
Longitudinal history of EMR data for 20+ years
Mortality data• Date of mortality
Rx data• Medication files (type,
strength, days supply)• Treatment switch• Patient co-pay• Total cost
Risk factors, measures• BMI, smoking status• Blood pressure• Tumor staging• Biomarkers• Performance status
Patient info• Age, gender, vitals• Date of diagnosis• Co-morbid conditions• Socioeconomic data
hCP contact• Healthcare visit• Type of HCP• Referrals
Lab results• Tests performed
(HbA1c, lipids, etc)• Test results &
interpretation
hOLIstICPAtIEnt
VIEW
EMR coverage disease-specific registries years of data100% 100+ 20+
WHAT MAKES SCANDINAVIA SO UNIQUE?Scandinavia has a long history of electronic medicalrecords (EMRs) and the collection of healthcare andsocioeconomic data in registries. These EMRs providebroad coverage of the population but are uniquely rich inclinical depth for many diseases and patient populations.According to a recent IMS Health study of real-worldevidence (RWE) impact1 and an assessment of progresstowards value-based healthcare by Soderland, et al,2 theNordic countries, Sweden in particular, have reached thehighest maturity for the supply and use of RWE. Thisreflects their well-structured public healthcare system,legal and ethical frameworks, and universalimplementation of EMRs since the 1990s.
Today, both primary and hospital care in Scandinaviahave 100 percent EMR coverage. In many cases, nationalhealth and medical care or social services registries havebeen collecting data since the 1950s. Further, there aremore than 100 national disease-specific registries
available, including in Sweden the National DiabetesRegister, the National Cataract Register, the StrokeRegistry and the National Rheumatology Register.
Available clinical data includes co-morbidity (ICD-10diagnoses), demographic information, hospitalizations,laboratory results, risk factors and measures, prescriptionsand mortality. The inclusion of socioeconomic factors (eg, educational level, long-term sick leave, earlyretirement) further enrich the dataset, with decades-longlongitudinal data enabling insights around diseaseprogression and long-term outcomes (Figure 1).
Finally, there is the possibility to link this rich data throughtechnology advances such as the Pygargus methodology(Customized eXtraction Program) and a mature legal andethical framework. Linkage is also possible due to thelongstanding use of unique personal Social Securitynumbers, which eliminates many of the patient-matchingissues that afflict linked datasets in other areas.

PAGE 34 IMS HEALTH REAL-WORLD EVIDENCE SOLUTIONS & HEOR
InsIghts SCANDINAVIAN REAL-WORLD DATA
The common set-up of healthcare, health information andclassification systems in Scandinavia ensures the qualityand consistency of data variables. The legal and ethicalframeworks for research purposes enable linkage of EMRwith public health registers within any given therapeuticarea. And the strength of academic hubs throughout theregion provides potential for extensive scientificcollaboration.
SCANDINAVIAN DATA SUPPORTS GLOBALRESEARCH WITH REAL-WORLD INSIGHTOpportunities to apply these insights are significant inScandinavian markets, where RWE is already in formal usefor HTA processes. However, the real potential fortransformation in healthcare will come from applying thisinformation to answer questions that affect healthcaredecisions globally.
In collaboration with research specialists and academics,companies are experiencing firsthand the unique natureof outcomes research based on Scandinavian real-worlddata. They are constructing entire patient journeysthrough the healthcare system, analyzing resourceutilization and assessing the outcomes of interventions ina wide range of leading disease areas.
Robust, comprehensive databases built on data fromScandinavian EMR registries have supported globalresearch with real-world insight addressing diversequestions around comparative effectiveness,pharmacovigilance, epidemiology and clinical outcome.
DRIVING LANDMARK RESEARCH IN PRIMARY CAREA practical example of the process and impact ofcombining primary care EMR and national register data isa study in chronic obstructive pulmonary disease (COPD).This observational retrospective epidemiological analysis,conducted in Sweden, generated data from patients withCOPD during the first decade of the 21st century. COPD isthe fourth leading cause of mortality, affects 1 in 4 adultsaged over 35 years, and is increasing in prevalenceworldwide. The implications of the findings for managingthe disease were thus considerable.
The study was made possible by identifying COPDpatients in primary care EMRs and linking them to registerdata from some of Sweden’s national healthcare registers.
This enabled the creation of a unique and detaileddatabase of more than 20,000 patients. The aim was todescribe the COPD population, the disease characteristicsand approaches to management, based on more than 11years of longitudinal data. Emphasis was placed onprevalence, incidence, exacerbations, co-morbidities andmortality. The study also compared the outcomes andsafety of modern COPD treatments.
Published in leading clinical journals and presented atmajor international conferences, this landmark studybrought a new understanding to recent COPDepidemiology. Mapping out the longitudinal managementof patients with the disease, it revealed changes in careover the last decade, the importance of ‘specialist’competence in primary care, and the impact of therapyon exacerbations and pneumonia-related mortality.
CHARTING DISEASE PROGRESSION INSECONDARY CAREIn secondary care, real-world data can be used to studydisease progression, from early symptoms and thepatient’s first contact with healthcare through to theirdeath. Unique population-based studies can beperformed by linking hospital EMR data with disease-specific registers and national healthcare andsocioeconomic registers.
An example published recently by Banefelt, et al, inCancer Epidemiology3 studied the incidence ofmetastases and clinical course of prostate cancer patientswho were without confirmed metastasis when initiatedon androgen deprivation therapy (ADT). In this study,EMR data from outpatient urology clinics was linked withnational mandatory registers to capture medical anddemographic data. The unique ability to examine PSAvalues recorded over time provided important insightsinto risk determinants of metastasis and death, foradvancing optimal management of the disease.
INFORMING OUTCOMES IN SMALL POPULATIONSThe large datasets that exist in Scandinavia also make itpossible to stratify populations and study differentcohorts, which is especially valuable in rare diseases andsmall patient groups. A recent study of T-cell lymphomasby Ellin, et al, illustrates this point.4
We can track the entire patient journey and make really deep dives. By following social security numbers we can study the connection betweenearly diagnosis and improved therapy and care. We can also understand howcare develops and see which factors drive improvements in treatment results. Bo Lidman, Co-founder of Pygargus, and Principal, IMS RWE Solutions & HEOR
“”

ACCESSPOINT • VOLUME 5 ISSUE 9 PAGE 35
Lymphoma is the most common form of blood cancer,principally comprising Hodgkin lymphoma and non-Hodgkin lymphoma. In turn, these are subdivided intoabout 50 different histological subtypes. In Sweden,peripheral T-cell lymphomas have an annual incidence ofonly slightly more than one hundred cases per year.Typically aggressive, they have a poor outcome with thetreatments that are currently available.
Due to the very low incidence of peripheral T-celllymphomas, population-based studies of theseconditions are scarce or evaluate small cohorts. In theirstudy, Ellin and colleagues assessed a cohort of 755patients with peripheral T-cell lymphomas based on theentire population of Sweden over a period of 10 years.This represented the largest population-based materialreported for this type of disease. The analysis includedfrequency, factors of prognostic impact, therapeuticresponse to radiation, effects of chemotherapy with orwithout addition of etoposide, and autologous stemcell transplantation.
The data obtained in this study provides importantinformation on outcome in an unselected cohort ofpatients, bringing the potential to aid development ofnew treatment regimens and also serve as a baseline forcomparison of novel therapies and their outcomes.
PROGRESSING VALUE-BASED HEALTHCAREGLOBALLYThe use of EMRs and registries has proved valuable forquality improvements in healthcare by enhancing healthoutcomes and reducing costs. Going forward, there ispotential to maximize the value of existing resources andensure more effective, efficient and insightful outcomesresearch to improve patient care. Based on the availabledata and experience, the Scandinavian countries can leadthe transformation to value-based healthcare globally.
1 Hughes B, Kessler M. RWE market impact on medicines: A lens for pharma. IMS Health AccessPoint, 2013; 3(6): 12-172 Soderland N, Kent J, Lawyer P, Larsson S. Progress towards value-based health care, Boston Consulting Group, BCG, June 20123 Banefelt J, Liede A, Mesterton J, Stålhammar J, Hernandez RK, Sobocki P, Persson B-E. Survival and clinical metastases among prostate cancerpatients treated with androgen deprivation therapy in Sweden. Cancer Epidemiology, 2014 Aug; 38(4): 442-7. doi: 10.1016/j.canep.2014.04.007. Epub2014 May 27.
4 Ellin F, Landström J, Jerkeman M, Relander T. Real world data on prognostic factors and treatment in peripheral T-cell lymphomas: A study from theSwedish Lymphoma Registry. Blood, 2014; 124(10): 1570-7
The use of unique personal identification numbers in combination with a legalframework that allows linking of registers and access to longitudinal datamake Scandinavia unique for RWE research. It enables a deeper understandingthan it is possible to get in any other region. Lars-Åke Levin, Professor of Health Economics, Linköping University, Sweden
“”

PAGE 36 IMS HEALTH REAL-WORLD EVIDENCE SOLUTIONS & HEOR
InsIghts
The authors
Joe Caputo, BSC is Regional Principal, RWE Solutions & HEOR, IMS [email protected]
Jovan Willford, MBA is Senior Principal, RWE Solutions, IMS Health [email protected]
Preparing for real-worldevidence in Asia Pacific
IMS HEALTH SYMPOSIUM
Real-world evidence is increasingly informing healthcaredecisions in Western markets. Technology advances haveincreased the quantity of electronic data, enabled linking ofdisparate datasets, and powered more sophisticated analyticapplications of the data. This has opened the window onto thefull patient journey with visibility across each care setting wherevaluable clinical information is collected. However, the situationis very different in Asia Pacific.

ACCESSPOINT • VOLUME 5 ISSUE 9 PAGE 37
Challenges and novel approaches
The dynamics that have significantly advanced the use ofRWE in North America and the EU are still relativelynascent in Asia Pacific, meaning that RWE has notdeveloped to the same extent. These dynamics include
• Regulatory and reimbursement requirements The level of scrutiny afforded by formalized HTA andregulatory processes is historically lower in Asia Pacificthan in Western markets although this is rapidlychanging
• Data accessibility The majority of healthcare data isowned by government with limited or no access toprivate organizations
• Data quality There are issues over dataintegrity/reliability and resulting complexities forresearch methodology
• Infrastructure Data sources are fragmented due tolack of data standardization and integration, partlydriven by historical lower demand/need forsophisticated RWE solutions
Not only is Asia Pacific very different from North Americaand EU, but also there is clear diversity among the region’smarkets themselves with respect to the application ofRWE. Figure 1 illustrates some of the key drivers of RWE
use within the region, highlighting the need for tailoredresponses according to market conditions.
As an example, a high degree of formalized evidence isincorporated into reimbursement and access decisions inKorea, whereas in China no such formal requirementexists to date. However, when considering fundamentalssuch as overall market, prescribing and diseaseprevalence, it is clear that the sheer size of China relativeto other markets means that it cannot be ignoredcompletely from a RWE-development perspective.
One of the key consequences of this diversity is that localhealthcare stakeholders have not yet fully embraced RWEas an evidence source even though they have a growingneed for more evidence to allocate scarce resources. Thisbecomes especially critical given the stated aims of manygovernments across the region to provide universalcoverage – particularly within the context of improvingaccess to general medicine services in response togrowing needs for primary healthcare in these markets.
Today, two key drivers of change offer light at the end ofthe tunnel. Firstly, is the range of data sources that areemerging across Asia Pacific and China. Althoughfragmented, the ability to access government-ownedclaims data in several markets and hospital-based
CumE
Formalized evidence in access
Value with commercialdecision makers
Accessibility ofsu!cient data
Standards, methods, legal structures in place
Compelling marketfundamentals
Low
Low
Low
Low
Low High
High
High
High
High
India China Japan Taiwan Australia South Korea
FIGURE 1: HETEROGENEITY OF RWE ACROSS THE ASIA-PACIFIC REGION: ILLUSTRATIVE dRIVERS ANd MARKET COMPARISON
Industry needs to push for greater accessibility to government-owneddata sources, particularly in markets where such data exists and is beingused for reimbursement and access decision making.
“”
continued on next page

PAGE 38 IMS HEALTH REAL-WORLD EVIDENCE SOLUTIONS & HEOR
InsIghts IMS HEALTH SYMPOSIUM
information systems and private electronic medicalrecords (EMRs) in others brings promise for applicationsof RWE. Secondly, market leaders on the global RWE stagehave been increasingly looking to Asia as their RWEcapabilities mature in developed markets. Consequently,innovative pricing schemes, responsiveness to growingdemands for HTA, and exploration of novel mechanismsto generate relevant data are accelerating in the region.
NEW PATIENT-CENTRIC APPROACHESAs the industry seeks to overcome the barriers andchallenges presented within Asia Pacific and China, thereis a need to adopt new and innovative approaches byleveraging opportunities for RWE generation throughpatient-centric programs. By their very nature large scale,such programs generate significant amounts of locally-relevant RWE. Traditionally, they have been run inisolation with data locked down and results consigned toarchives once the original study question has beenanalyzed and reported. Yet they have much greaterpotential to yield data that could modify clinical practicewhen analyzed beyond the scope of their original intent,particularly if the data could be supplemented with pre-existing or concurrent datasets such as EMR or healthinsurance claims.
Through this type of innovation and integration –expanding purpose-collected patient-level data by linkingand applying it more broadly – the full potential can beunlocked through multiple concurrent uses. These mightinclude outcomes research, clinical practice audit feedback,treatment guideline validation, risk-share agreementdesign and implementation, or even as a physician tool ininforming individual patient treatment management.
EMERGING APPLICATIONSCertainly the use of patient-centric programs representsone way of overcoming lack of data across Asia Pacificand China. Further evidence generation methods that aregrowing in the region include retrospective analysis ofexisting databases via protocol-ized research,partnerships and sponsorship of patient registries, andprimary observational research. In Asia, in particular, theuse of registries has doubled every two years since 2004.One such example is China Cardiometabolic Registries, anevidence-based research program to improveunderstanding of unmet medical need and clinicaloutcomes in cardiovascular (CV) and metabolic diseasesin the country. It is currently following over 25,000patients with type-2 diabetes and CV risk factors. 1
Aside from traditional applications of RWE, is theincreasing application of RWE across the product lifecycle.A very strong trend emerging from the US and EU is theconvergence of clinical and commercial evidencerequirements, and the need to leverage RWE for a widevariety of internal stakeholders at various points in theproduct development cycle.
As RWE infrastructure grows in the region so, too, will thepotential applications, in particular the opportunity formore scientifically-robust health economics andoutcomes research studies. Local examples includeAvastin (bevacizumab, Chugai Seiyaku) in Japan, whichgained a 5% ‘premium’ during re-pricing negotiationsthrough post-marketing evidence of prolonged overallsurvival in lung cancer in 2012, and Bayer’s use of JapanMedical Data Center (JMDC) data in Japan to supportremoval of a label warning for Adalat (nifedipine).
IMPERATIVES FOR PROGRESSLooking ahead to the future of RWE in Asia Pacific, thereare clear pointers for the industry as a whole, as well asindividual companies and other stakeholders, in movingthe RWE agenda forward. Key amongst these is the needto leverage existing data, including linkingcomplementary datasets and investing in emergent datasources. Industry needs to push for greater accessibility togovernment-owned data sources, particularly in marketswhere such data exists and is being used forreimbursement and access decision making.
The linkage of datasets is emerging as a useful and validresearch technique that can expand the application ofindividual databases, as demonstrated in a recentretrospective observational cohort study in Japan.2Innovative data sourcing requires integration acrossfragmented sources, which in itself presents anopportunity for industry, manifested through collaborationwith IT systems providers, use of social media or app-drivendata, or other innovative initiatives that can help to fulfillthe requirements of multiple stakeholders.
Regardless of data considerations, there is the need todevelop innovative approaches to research objectives, tomove away from singular research studies towardsbroader value studies meeting a variety of needs acrossstakeholder groups. Last, but by no means least, is theneed to embed RWE and especially HEOR capabilities,which are critical to leverage existing and evolving datasources to conduct high-quality outcomes researchspecific to local settings.
The APAC nations are already making rapid progress in learning from thetriumphs and failures of other regions as well as from each other – andthat must continue.
“”
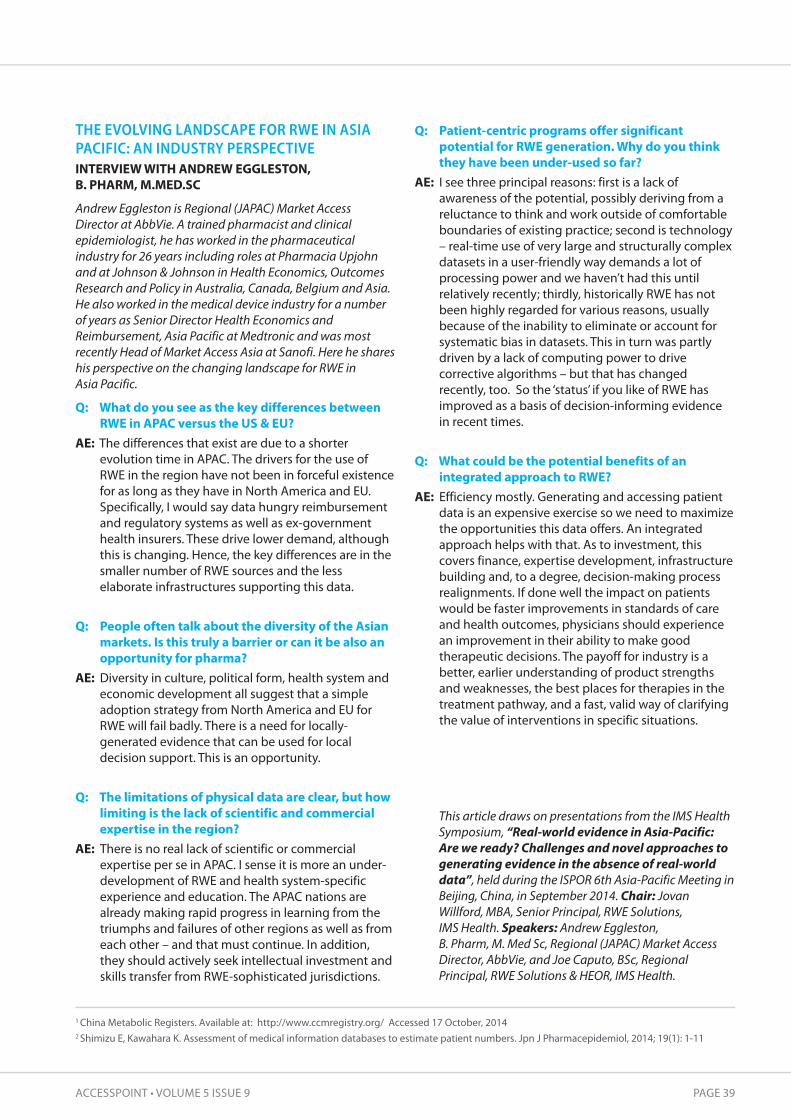
ACCESSPOINT • VOLUME 5 ISSUE 9 PAGE 39
THE EVOLVING LANDSCAPE FOR RWE IN ASIAPACIFIC: AN INDUSTRY PERSPECTIVEIntERVIEW WIth AnDREW EggLEstOn, B. PhARM, M.MED.sC
Andrew Eggleston is Regional (JAPAC) Market AccessDirector at AbbVie. A trained pharmacist and clinicalepidemiologist, he has worked in the pharmaceuticalindustry for 26 years including roles at Pharmacia Upjohnand at Johnson & Johnson in Health Economics, OutcomesResearch and Policy in Australia, Canada, Belgium and Asia.He also worked in the medical device industry for a numberof years as Senior Director Health Economics andReimbursement, Asia Pacific at Medtronic and was mostrecently Head of Market Access Asia at Sanofi. Here he shareshis perspective on the changing landscape for RWE in Asia Pacific.
Q: What do you see as the key differences betweenRWE in APAC versus the Us & EU?
AE: The differences that exist are due to a shorterevolution time in APAC. The drivers for the use ofRWE in the region have not been in forceful existencefor as long as they have in North America and EU.Specifically, I would say data hungry reimbursementand regulatory systems as well as ex-governmenthealth insurers. These drive lower demand, althoughthis is changing. Hence, the key differences are in thesmaller number of RWE sources and the lesselaborate infrastructures supporting this data.
Q: People often talk about the diversity of the Asianmarkets. Is this truly a barrier or can it be also anopportunity for pharma?
AE: Diversity in culture, political form, health system andeconomic development all suggest that a simpleadoption strategy from North America and EU forRWE will fail badly. There is a need for locally-generated evidence that can be used for localdecision support. This is an opportunity.
Q: the limitations of physical data are clear, but howlimiting is the lack of scientific and commercialexpertise in the region?
AE: There is no real lack of scientific or commercialexpertise per se in APAC. I sense it is more an under-development of RWE and health system-specificexperience and education. The APAC nations arealready making rapid progress in learning from thetriumphs and failures of other regions as well as fromeach other – and that must continue. In addition,they should actively seek intellectual investment andskills transfer from RWE-sophisticated jurisdictions.
Q: Patient-centric programs offer significantpotential for RWE generation. Why do you thinkthey have been under-used so far?
AE: I see three principal reasons: first is a lack ofawareness of the potential, possibly deriving from areluctance to think and work outside of comfortableboundaries of existing practice; second is technology– real-time use of very large and structurally complexdatasets in a user-friendly way demands a lot ofprocessing power and we haven’t had this untilrelatively recently; thirdly, historically RWE has notbeen highly regarded for various reasons, usuallybecause of the inability to eliminate or account forsystematic bias in datasets. This in turn was partlydriven by a lack of computing power to drivecorrective algorithms – but that has changedrecently, too. So the ‘status’ if you like of RWE hasimproved as a basis of decision-informing evidencein recent times.
Q: What could be the potential benefits of anintegrated approach to RWE?
AE: Efficiency mostly. Generating and accessing patientdata is an expensive exercise so we need to maximizethe opportunities this data offers. An integratedapproach helps with that. As to investment, thiscovers finance, expertise development, infrastructurebuilding and, to a degree, decision-making processrealignments. If done well the impact on patientswould be faster improvements in standards of careand health outcomes, physicians should experiencean improvement in their ability to make goodtherapeutic decisions. The payoff for industry is abetter, earlier understanding of product strengthsand weaknesses, the best places for therapies in thetreatment pathway, and a fast, valid way of clarifyingthe value of interventions in specific situations.
1 China Metabolic Registers. Available at: http://www.ccmregistry.org/ Accessed 17 October, 20142 Shimizu E, Kawahara K. Assessment of medical information databases to estimate patient numbers. Jpn J Pharmacepidemiol, 2014; 19(1): 1-11
This article draws on presentations from the IMS HealthSymposium, “Real-world evidence in Asia-Pacific: Are we ready? Challenges and novel approaches togenerating evidence in the absence of real-worlddata”, held during the ISPOR 6th Asia-Pacific Meeting inBeijing, China, in September 2014. Chair: JovanWillford, MBA, Senior Principal, RWE Solutions, IMS Health. Speakers: Andrew Eggleston, B. Pharm, M. Med Sc, Regional (JAPAC) Market AccessDirector, AbbVie, and Joe Caputo, BSc, RegionalPrincipal, RWE Solutions & HEOR, IMS Health.

PAGE 40 IMS HEALTH REAL-WORLD EVIDENCE SOLUTIONS & HEOR
InsIghts UTILITY VALUES IN DIABETES MODELING
Identifying reference utilityvalues for economic modelsin diabetes
Diabetes is a long-term condition associated with excess mortalityand substantial morbidity due to its range of fatal and non-fatalcomplications. Health-related quality of life is severely impacted indiabetes patients, who report significantly lower health state utilityscores compared to the non-diabetic population and experiencereduced quality-adjusted life expectancy. This article identifies apreferred set of values for assessing utility consistent with the NICEreference case.
The authors
Amélie Beaudet, MSC is Senior Consultant, RWE Solutions & HEOR, IMS [email protected]
Adam Lloyd, MPHIL is Senior Principal, RWE Solutions & HEOR, IMS [email protected]

ACCESSPOINT • VOLUME 5 ISSUE 9 PAGE 41
continued on next page
Globally, there are around 382 million people withdiabetes; by 2035 this number is set to reach 592 million.1
In the top five European countries,i approximately 6-12%of all healthcare spending is attributable to the disease.2
There is thus an imperative public health and economicneed to ensure efficient allocation of resources for moreeffective diabetes management.
The National Institute for Health and Care Excellence(NICE) in England and Wales is a highly respected healthtechnology assessment authority. Consistent with theNHS goal of maximizing health gain from limitedresources, NICE has defined appropriate methods forassessing the effectiveness and cost-effectiveness ofmedical technologies. This ‘reference case’ recommendsthe use of quality-adjusted life-years and measurement ofhealth states through the EuroQol five-dimensional (EQ-5D) valuation questionnaire.3,4,5,6
The EQ-5D comprises a descriptive system and the EuroQolvisual analogue scale (EQ-VAS). The former is a self-administered questionnaire addressing five key areas:mobility; self-care; usual activities; pain/discomfort; andanxiety/depression. The EQ-VAS is a vertical visual analoguescale on which respondents rate their current health statefrom ‘best imaginable’ (100) to ‘worst imaginable’ (0).7
The descriptive system allows EQ-5D questionnaire indexvalues to be generated using scores from a set ofpreference weights measured on a sample from thegeneral population. The index value can thus be seen as asocietal valuation of the patient’s health state rather thanthe patient’s own assessment and is therefore preferablefrom an economic perspective.
DEFINING UTILITY VALUES FOR ECONOMICMODELING A key element of economic analysis in type 2 diabetesmellitus (T2DM) is the need to evaluate the impact ofmultiple, wide-ranging complications. The choice ofmethodology for assessing utility can significantly affectpredicted values and thus the outcome of economicevaluation.8,9 A study was therefore carried out to identify aset of utility values consistent with the NICE reference case,based on extensive review of the published literature.
ApproachPublications for five computer models simulating long-term outcomes in T2DM were appraised to identifydiabetic complications impacting patient utility
1. IMS CORE Diabetes Model10
2. UK Prospective Diabetes Study (UKPDS)Outcomes Model11
3. Cardiff Diabetes Model12
4. Sheffield Diabetes Model13
5. CDC and Prevention/Research Triangle Institute Type 2 Diabetes Model13
Health states used in these models were considered relevantif they described microvascular or macrovascularcomplications of T2DM or direct consequences of treatment(such as hypoglycemia), or were related to excess bodyweight (Table 1). Where available, data was also extracted onthe utility value for patients without specific complications.
Articles reporting utility values for diabetic complicationswere identified in MEDLINE; Medline In-Process; Embase;EconLIT; and the National Health Service EconomicEvaluation Database, from the earliest available date toMay, 2012. Only those containing original data, reportinga study performed in adults, and written in English wereconsidered. The shortlist was then reviewed to identifypapers meeting the NICE reference case criteria. As NICErecommends utilities estimated from a sample of thegeneral population, those using the EQ-5D wereconsidered more appropriate than the EQ-VAS.8,14
TAbLE 1: COMPLICATIONS OF TYPE 2 dIAbETES IdENTIFIEd dURINGMOdEL REVIEW
AnginaCataractDiabetic retinopathyExcess weight*Foot ulcerHeart failure HypoglycemiaMacular edema
Microalbuminuria/protenuriaMyocardial infarctionNeuropathyPeripheral vascular diseaseRenal dialysisRenal transplantStrokeVision loss
T2DM Complications
*Defined as presence vs. absence of obesity or increased BMI
Challenges of systematic utility data selection
2014 2035 of EU5 healthcare spend382m 592m 6-12%
i France, Germany, Italy, Spain and UK
DIA
BETE
S

PAGE 42 IMS HEALTH REAL-WORLD EVIDENCE SOLUTIONS & HEOR
Studies consistent with the reference case wereconsidered for the preferred input set and the followingattributes extracted
• Country in which each study took place
• Year of publication
• Sample size and recruitment method
• Patient demographic characteristics
• Statistical methods
• Measures of precision reported
When the diabetic complication had no index valuesthat met the NICE reference case, an alternative sourcewas sought.
The preferred input set was created on the basis ofseveral criteria
• If only one measure meeting NICE criteria wasavailable, this was accepted
• When more than one estimate was identified, studiesreporting the marginal impact of T2DM complicationsrelative to a baseline ‘no complication’ state werepreferred over those reporting disutilities alone.Consideration was given to synthesizing health utilityvalues if identified studies were sufficientlyhomogeneous.4
• When an article provided utility values using multiplestatistical models, the best-fitting model or the onepreferred by the authors was selected
• Where possible, disutility estimates calculated fromstatistical models were selected, otherwise thedifference between patients with and without thespecific complication was presented.
If these criteria were insufficient to identify a preferredmeasure, the study most precisely matching thedefinition of the preferred complication was selected.
For measures of utility in the preferred set, the 95%confidence intervals were extracted if available; otherwisethey were estimated around each point value usingreported mean and sample size values, assuming anormal distribution.
ResultsA total of 16,574 records were identified from which 339full-text articles were retrieved. Of these, 61 includedutility values assessed against NICE reference criteria(Figure 1). Among the 21 studies considered for thepreferred set, 19 met the NICE criteria, reporting utilityvalues for all complications apart from renal transplant; inthis case, two studies using alternative methodology wereconsidered for inclusion.
Index value estimates for T2DM without complicationsranged from 0.711 to 0.940.15,16 The utility decrementassociated with complications ranged from 0.014 (minorhypoglycemia)15 to 0.28 (amputation).17
DiscussionThe preferred set of values for modeling T2DMcomplications is shown in Table 2, alongside 95%confidence intervals. Uncertainty around the pointestimate was important. In the case of everycomplication, the interval overlapped with that of the‘T2DM without complication health state’, reflecting theexpectation of amputation.
Most values for the preferred reference set were extractedfrom Clarke, et al, due to its large sample size, T2DM-specific nature, methodological quality and use of EQ-5Din a UK population.17
FIGURE 1: FLOW OF STUdY SELECTION FOR PREFERREd SET OF UTILITY VALUES
Records identifiedthrough database
searching (n=19,195)
Additional recordsidentified through other
sources (n=0)
Records after duplicatesremoved (n=16,574)
Abstracts screened(n=16,574 )
Abstracts excluded(n=16,235)
Full-text articles assessedfor eligibility (n=339)
Full-text articles excluded (n=278)
Reasons for exclusion- Not presenting utilityvalues- Presenting only utilityvalues associated withspecific intervention- Not presenting utilityvalues associated withdiabetes complications
Studies assessed againstNICE criteria (n=61)
Full-text articlesexcluded (n=40)
- Health states notvaluated by patents
- Not using societalvaluation algorithm- Not using EQ-5D
Studies considered forpreferred set (n=21);- Meeting NICE criteria(n=19)- Reporting valueswhere no availablestudies met NICEcriteria (n=2)
InsIghts UTILITY VALUES IN DIABETES MODELING
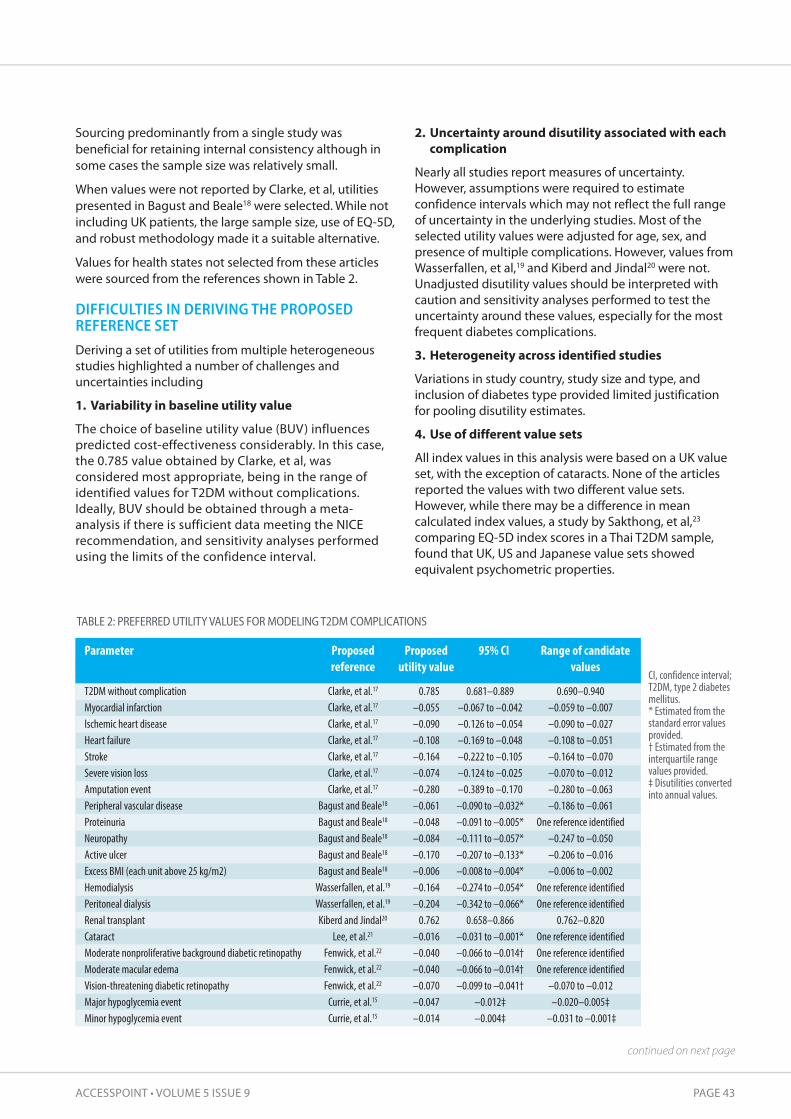
ACCESSPOINT • VOLUME 5 ISSUE 9 PAGE 43
continued on next page
TAbLE 2: PREFERREd UTILITY VALUES FOR MOdELING T2dM COMPLICATIONS
Parameter
T2DM without complicationMyocardial infarctionIschemic heart diseaseHeart failureStrokeSevere vision lossAmputation eventPeripheral vascular diseaseProteinuriaNeuropathyActive ulcerExcess BMI (each unit above 25 kg/m2)HemodialysisPeritoneal dialysisRenal transplantCataractModerate nonproliferative background diabetic retinopathyModerate macular edemaVision-threatening diabetic retinopathyMajor hypoglycemia eventMinor hypoglycemia event
Proposed reference
Clarke, et al.17
Clarke, et al.17
Clarke, et al.17
Clarke, et al.17
Clarke, et al.17
Clarke, et al.17
Clarke, et al.17
Bagust and Beale18
Bagust and Beale18
Bagust and Beale18
Bagust and Beale18
Bagust and Beale18
Wasserfallen, et al.19
Wasserfallen, et al.19
Kiberd and Jindal20
Lee, et al.21
Fenwick, et al.22
Fenwick, et al.22
Fenwick, et al.22
Currie, et al.15
Currie, et al.15
Proposedutility value
0.785–0.055–0.090–0.108–0.164–0.074–0.280–0.061–0.048–0.084–0.170–0.006–0.164–0.2040.762
–0.016–0.040–0.040–0.070–0.047–0.014
95% CI
0.681–0.889–0.067 to –0.042–0.126 to –0.054–0.169 to –0.048–0.222 to –0.105–0.124 to –0.025–0.389 to –0.170–0.090 to –0.032*–0.091 to –0.005*–0.111 to –0.057*–0.207 to –0.133*–0.008 to –0.004*–0.274 to –0.054*–0.342 to –0.066*0.658–0.866
–0.031 to –0.001*–0.066 to –0.014†–0.066 to –0.014†–0.099 to –0.041†
–0.012‡–0.004‡
Range of candidatevalues
0.690–0.940–0.059 to –0.007–0.090 to –0.027–0.108 to –0.051–0.164 to –0.070–0.070 to –0.012–0.280 to –0.063–0.186 to –0.061
One reference identified–0.247 to –0.050–0.206 to –0.016–0.006 to –0.002
One reference identifiedOne reference identified
0.762–0.820One reference identifiedOne reference identifiedOne reference identified
–0.070 to –0.012–0.020–0.005‡–0.031 to –0.001‡
CI, confidence interval;T2DM, type 2 diabetesmellitus.* Estimated from thestandard error valuesprovided.† Estimated from theinterquartile rangevalues provided.‡ Disutilities convertedinto annual values.
Sourcing predominantly from a single study wasbeneficial for retaining internal consistency although insome cases the sample size was relatively small.
When values were not reported by Clarke, et al, utilitiespresented in Bagust and Beale18 were selected. While notincluding UK patients, the large sample size, use of EQ-5D,and robust methodology made it a suitable alternative.
Values for health states not selected from these articleswere sourced from the references shown in Table 2.
DIFFICULTIES IN DERIVING THE PROPOSEDREFERENCE SET Deriving a set of utilities from multiple heterogeneousstudies highlighted a number of challenges anduncertainties including
1. Variability in baseline utility value
The choice of baseline utility value (BUV) influencespredicted cost-effectiveness considerably. In this case,the 0.785 value obtained by Clarke, et al, wasconsidered most appropriate, being in the range ofidentified values for T2DM without complications.Ideally, BUV should be obtained through a meta-analysis if there is sufficient data meeting the NICErecommendation, and sensitivity analyses performedusing the limits of the confidence interval.
2. Uncertainty around disutility associated with eachcomplication
Nearly all studies report measures of uncertainty.However, assumptions were required to estimateconfidence intervals which may not reflect the full rangeof uncertainty in the underlying studies. Most of theselected utility values were adjusted for age, sex, andpresence of multiple complications. However, values fromWasserfallen, et al,19 and Kiberd and Jindal20 were not.Unadjusted disutility values should be interpreted withcaution and sensitivity analyses performed to test theuncertainty around these values, especially for the mostfrequent diabetes complications.
3. heterogeneity across identified studies
Variations in study country, study size and type, andinclusion of diabetes type provided limited justificationfor pooling disutility estimates.
4. Use of different value sets
All index values in this analysis were based on a UK valueset, with the exception of cataracts. None of the articlesreported the values with two different value sets.However, while there may be a difference in meancalculated index values, a study by Sakthong, et al,23
comparing EQ-5D index scores in a Thai T2DM sample,found that UK, US and Japanese value sets showedequivalent psychometric properties.

PAGE 44 IMS HEALTH REAL-WORLD EVIDENCE SOLUTIONS & HEOR
Furthermore, the variation in estimated EQ-5Dquestionnaire index values was found to have a marginalimpact on the projected incremental cost utilization ratio.Nevertheless, when creating a utility value set formodeling, it would be preferable to select values usingthe same EQ-5D questionnaire value set or convert theoriginal data using the appropriate EQ-5D questionnairevalue set.
5. Variation in utility over time
Utility can vary over time, both among differentsubpopulations as well as in line with evolving medicalpractice. The two main studies contributing to theproposed reference set, while still the best sourcesidentified, reported on data collected some years ago.However, unless there has been recent progress intreating a particular complication, it is preferable to selectpublications on the basis of methodological strengthrather than on whether they are contemporary.
6. Changing impact of clinical events on hRQoL overcourse of disease
To allow for this uncertainty, it may be appropriate to varythe disutility values associated with a complicationdepending on time since onset. In the present case, Clarke,et al, reported the relationship between health state utilitiesand clinical events occurring in the previous year or prior tothe previous year. The authors did not find a greaterdisutility during the year of the event versus the disutility forevents that occurred during the previous years.
COMMON INPUT FOR ECONOMIC EVALUATION Despite inherent challenges and uncertainties, thepreferred reference set was derived in a transparent wayand may serve as a common input for evaluating differenttechnologies for diabetes in line with the NICE referencecase. Although the specific characteristics of novelinterventions may justify additional or different valuesfrom those presented, the dataset may provide futureeconomic evaluations with a starting point for suchconsiderations. The relevance of the identified utility valueset should be considered before it is applied to a modelingstudy, and appropriate sensitivity analyses conducted.
The learnings from this methodological approach may alsoserve to inform similar economic evaluations in other countries.
Consistency in the use of statistical models and reportingwould improve comparability of utility-related research. Inaddition, further research surrounding appropriateestimation of utility values for patients experiencingseveral complications would improve the currentevidence base. This is likely to be of increasing importancefor T2DM patients with advanced disease given the typicaldevelopment of additional complications over time.
Further details of the review and analysis can be found inthe original study publication on which this article is based.
Beaudet A, Clegg J, Thuresson PO, Lloyd A, McEwan P. Reviewof Utility Values for Economic Modeling in Type 2 Diabetes.Value in Health, 2014; 17: 462-70. Available atwww.sciencedirect.com
1 IDF Diabetes Atlas, 6th Edition. Available atwww.idf.org/diabetesatlas/introduction. Accessed 16 October, 2014
2 Zhang P, Zhang X, Brown J, Vistisen D, Sicree R, Shaw J, et al. Globalhealthcare expenditure on diabetes for 2010 and 2030. Diabetes ResClin Pract. 2010 Mar;87(3):293-301
3 NICE Guide to the methods of technology appraisal, 2013. Available at:http://www.nice.org.uk/article/PMG9/chapter/Foreword. Accessed 16October, 2014
4 Papaioannou D, Brazier J, Paisley S. TSD 9: The identification, review andsynthesis of health state utility values from the literature. DecisionSupport Unit, School of Health and Related Research. Sheffield, UK:University of Sheffield, 2010
5 Brazier J, Longworth L. TSD 8: An introduction to the measurement andvaluation of health for NICE submissions. Sheffield, UK: DecisionSupport Unit, ScHARR, University of Sheffield, 2011
6 National Institute for Health and Care Excellence. Single technologyappraisal (STA), Specification for manufacturer/sponsor submission ofevidence. Rotterdam, The Netherlands: NICE, 2012.
7 Rabin R, Oemar M, Oppe M. EQ-5D-3L User Guide (Version 4.0).Rotterdam, The Netherlands: EuroQol Group, 2011
8 Conner-Spady B, Suarez-Almazor ME. Variation in the estimation ofquality-adjusted life-years by different preference-based instruments.Med Care 2003; 41: 791-801
9 Kopec JA, Willison KD. A comparative review of four preferenceweighted measures of health-related quality of life. J Clin Epidemiol2003; 56: 317-25
10 Palmer AJ, Roze S, Valentine WJ, et al. The CORE Diabetes Model:projecting long-term clinical outcomes, costs and cost-effectiveness ofinterventions in diabetes mellitus (types 1 and 2) to support clinical andreimbursement decision-making. Curr Med Res Opin, 2004; 20 (Suppl. 1): S5-26
11 Clarke PM, Gray AM, Briggs A, et al. A model to estimate the lifetimehealth outcomes of patients with type 2 diabetes: the United KingdomProspective Diabetes Study (UKPDS) Outcomes Model (UKPDS no. 68).Diabetologia, 2004; 47: 1747-59
12 McEwan P, Peters JR, Bergenheim K, Currie CJ. Evaluation of the costsand outcomes from changes in risk factors in type 2 diabetes using theCardiff stochastic simulation cost-utility model (DiabForecaster). CurrMed Res Opin, 2006; 22: 121-9
13 Mount Hood 4 Modeling Group. Computer modeling of diabetes andits complications: A report on the Fourth Mount Hood ChallengeMeeting. Diabetes Care, 2007; 30: 1638-46
14 Lung TW, Hayes AJ, Hayen A, et al. A meta-analysis of health statevaluations for people with diabetes: explaining the variation acrossmethods and implications for economic evaluation. Qual Life Res,2011; 20: 1669-78
15 Currie CJ, Morgan CL, Poole CD, et al. Multivariate models of healthrelated utility and the fear of hypoglycaemia in people with diabetes.Curr Med Res Opin, 2006; 22: 1523-34
16 Smith DH, Johnson ES, Russell A, et al. Lower visual acuity predicts worseutility values among patients with type 2 diabetes. Qual Life Res, 2008; 17:1277-84
17 Clarke P, Gray A, Holman R. Estimating utility values for health states of type2 diabetic patients using the EQ-5D (UKPDS 62). Med Decis Making, 2002;22: 340-9
18 Bagust A, Beale S. Modelling EuroQol health-related utility values fordiabetic complications from CODE-2 data. Health Econ, 2005; 14: 217-30
19 Wasserfallen JB, Halabi G, Saudan P, et al. Quality of life on chronicdialysis: Comparison between haemodialysis and peritoneal dialysis.Nephrol Dial Transplant, 2004 ;19: 1594-9
20 Kiberd BA, Jindal KK. Screening to prevent renal failure in insulindependent diabetic patients: An economic evaluation. BMJ, 1995; 311:1595-9
21 Lee WJ, Song KH, Noh JH, et al. Health-related quality of life using theEuroQol 5D questionnaire in Korean patients with type 2 diabetes. JKorean Med Sci, 2012; 27: 255-60
22 Fenwick EK, Xie J, Ratcliffe J, et al. The impact of diabetic retinopathyand diabetic macular edema on health-related quality of life in type 1and type 2 diabetes. Invest Ophthalmol Vis Sci, 2012; 53: 677-84
23 Sakthong P, Charoenvisuthiwongs R, Shabunthom R. A comparison ofEQ-5D index scores using the UK, US, and Japan preference weights in aThai sample with type 2 diabetes. Health Qual Life Outcomes, 2008; 6: 1
InsIghts UTILITY VALUES IN DIABETES MODELING
ACCESSPOINT • VOLUME 5 ISSUE 9 PAGE 45
InsIghts MIXED METHODS REGISTRY CREATION
The authors
Laura Garcia Alvarez, PHD is Senior Consultant, RWE Solutions, IMS [email protected]
Joshua Hiller, MBA is Senior Principal, RWE Solutions, IMS [email protected]
A collaborative foundationfor new diabetes insights in Germany
Researchers conducting analytics and epidemiological studiesusing electronic medical record databases frequently findthemselves short of critical variables. The value from datacollected through a mixed methods registry like DIAREG spansscientific and commercial applications and creates newpotential for exploring relationships between perspectives,actions and outcomes.

PAGE 46 IMS HEALTH REAL-WORLD EVIDENCE SOLUTIONS & HEOR
Researchers conducting analytics and epidemiologicalstudies using electronic medical record (EMR) databasesfrequently find themselves short of critical variables,potentially limiting the breadth of research they canperform. Although widely available EMR databases suchas The Health Improvement Network (THIN), IMS® DiseaseAnalyzer, and the Clinical Practice Research Datalink(CPRD) contain a great deal of longitudinal primary caredata, it is often the case that certain types of informationare missing – either because an EMR field has not beencompleted or because a particular field does not existwithin the database.
In particular, behavioral detail such as reasons for changingtherapy or the physician’s perspective of important clinicalcharacteristics are rarely part of a structured health recordand thus are not contained in mainstream EMR databases.Typically, researchers must then decide whether to sacrificethe breadth of variables captured, and hence limit thestudy scope, or use a purely prospective design andsacrifice time and cost to implement an extendedprospective observational study.
LEVERAGING MIXED METHODS FOR ACOMPREHENSIVE RESOURCETo address these challenges, IMS Health, in partnershipwith AstraZeneca, has developed an innovative registry(DIAREG) of patients with type 2 diabetes mellitus(T2DM). AstraZeneca is committed to demonstrating theefficacy and benefit of its medicines in a real-worldsetting, especially in terms of patient-relevant outcomes.The registry is based on the complementary methods ofretrospective and prospective data collection, therebyovercoming the individual limitations of each, enablingthe creation of a rich data resource for observationalresearch in this area.
IDENTIFYING REQUIREMENTS Work on DIAREG began in 2012. Understanding the keyrequirements for a comprehensive prospective diseaseregistry, IMS® Disease Analyzer in Germany was selectedas the core data backbone, being representative withinput from physicians in general practice as well as
diabetologists,i and validated with a documentedhistory of application in published scientific studies.
Initial analysis of data variables confirmed that DiseaseAnalyzer contained rich information on populationcharacteristics (eg, demographics, medical history) andtreatment patterns (eg, diagnosis, prescriptions, co-medications, co-morbid conditions) in diabetes patients.However, while some data existed for certain diabetes-relevant clinical parameters, such as HbA1c and bodymass index (BMI), this was often recorded less frequentlyor sometimes not at all. Furthermore, other clinicaloutcomes (eg, cardiovascular events, hypoglycemicepisodes, hospitalizations), physician behavior (eg, driversof therapy decision, reasons for dose or treatmentmodification) and patient-reported outcomes (PRO) (eg, general quality of life, disease-specific quality of lifeor treatment satisfaction), were not captured asstructured data within the patient record at all.
As a result of this initial analysis, a set of 27 variables wereidentified for their potential research value if collected, toenhance the available EMR resource.
DIAREG IS BORNThe identified need for an ‘enhanced’ EMR registry tookthe next stage of development down two separate paths– technical and ethical – to achieve an optimal solution.
technical implementationTo facilitate technical implementation of the registry, IMS Health worked closely with the EMR software vendorresponsible for collecting the data underpinning DiseaseAnalyzer. Together, they designed and created thecapability for a retrieve form data capture window (or‘pop up’) to be triggered in the physician office during thepatient visit, based on a set of criteria available within thepatient EMR (eg, diagnosis code, existence of prior anti-diabetic treatment, etc). Every time an eligible patient wasidentified through the trigger, the physician completedan electronic case report form (eCRF) in the ‘pop-up’window to provide the required additional clinical data.
Enhanced insights from a mixed methods approach
patients1,071
DIA
REG
changed therapy22%
InsIghts MIXED METHODS REGISTRY CREATION
i Becher H, Kostev K, Schröder-Bernhardi D. Validity andrepresentativeness of the Disease Analyzer patient database for use inpharmacoepidemiological and pharmacoeconomic studies. Int J ClinPharmacol Ther, 2009; 47: 617-626

ACCESSPOINT • VOLUME 5 ISSUE 9 PAGE 47
Since patient EMR was used as the basis for including orexcluding a patient from the registry, the potential impactof subjective selection was reduced. Consecutive newpatients continued to be triggered for inclusion in theregistry until the physician reached a pre-defined cap, thusproviding a framework for random sample selection. Datacollected from the retrieve form data capture window eCRFis currently being linked back to the EMR using a hash de-id process that removes protected health information(PHI) prior to extraction to the IMS Health database.
In addition to the enhanced clinical data collection, asecond phase of the registry build involved theintroduction of PROs to provide a further layer ofinformation. These are collected via paper-basedquestionnaires handed to patients at the physician sitewhere they are filled in and returned for entry into anelectronic database. An additional hash algorithm hasbeen deployed for one-way linkage of the PRO data tothe EMR and eCRF (Figure 1).
Ethical implementationFrom an ethical perspective, it was essential to ensurethat the registry was developed in accordance with soundobservational research practices. To that end, a ScientificAdvisory Board was created to provide guidance on themethods for site identification, eCRF review, inclusion ofPROs, use of patient informed consent, and submissionsfor ethics approval. The Committee is made up of sixindependent academic researchers and physicians whohave no affiliation with either AstraZeneca or IMS Health.Patients participating in the registry have given informedconsent for inclusion of their information from EMR, aswell as the eCRF and PRO questionnaire. The registryprotocol was reviewed and approved by the EthicsCommittee, Nordrhein, Germany (Ethikkommission derÄrztekammer Nordrhein) under the name of DIAREG.
UNIQUELY GRANULAR OBSERVATIONALRESEARCH As of September 2014, DIAREG has been collecting datafor more than 18 months. The registry currently containseCRF questionnaires, with comprehensive, longitudinaldata variables, for 1,071 diabetes patients, enablinggranular observational research. A subset analysis ofthese patients (n=824) shows that 77% were enrolled byGPs, the remainder being recruited by diabetologists.
Based on data from half of the cohort, average length oftime with T2DM is 12.3 years (median 11 years). Twenty-two percent of patients (n=181/824) in the registry haveexperienced a change to their anti-diabetes therapy atleast once within the last year, mostly by the GP (57%) butalso by diabetologists, who were responsible for 35% oftherapy changes. For 152 patients (84% of the therapymodification population), this took the form of a doseadjustment to their existing therapy, mainly due toinsufficient control of HbA1c (Figure 2). A change of drugwas recorded for 60 patients (33%) for the same reason.Overall, doctors have reported high expectations of HbA1creduction when deciding on a new treatment regimen.
A total of 475 patients (58%) self-monitored their bloodglucose levels, with 30% checking their blood sugar morethan twice a day. Visits to other specialists were recordedfor 43% of 824 patients, the most frequently visited beingophthalmologists (57%) for diagnosis of retinopathies.
Of the 824 patients in the subset, 43 experienced at leastone hypoglycemic event, four of whom requiredhospitalization (Figure 3).
ENABLING EVIDENCE-BASED CONNECTIONS The data captured in DIAREG enables researchers toidentify and explore associations across measures thathave not been collected before in a sustainable andintegrated manner.
Patient characteristics ofinterest programmed into
EMR database to trigger eCRF
EMR and PRO linked to disease-speci�c data atpatient level creating enhanced patient record
Double hash algorithm applied for data anonymization
IMS Disease Analyzer
eCRF pop-up
PRO
Enhanced DiseaseCohort
FIGURE 1: CUSTOMIZEd EMR ANd REGISTRY dATA COHORT
continued on next page

PAGE 48 IMS HEALTH REAL-WORLD EVIDENCE SOLUTIONS & HEOR
InsIghts MIXED METHODS REGISTRY CREATION
By allowing comparison of clinical parameters at apatient level, it provides evidence of associations from areal-world setting that previously could only beidentified anecdotally or through market research. As an example, the capture of BMI and HbA1c
measurements without DIAREG was recorded in 61.9%and 42.3% of the population respectively. With DIAREG,the capture of these critical lab measurements increasesto 83.3% and 77.6% respectively (Figure 4).
Source: Disease registries including Patient Reported Outcomes - IMS® DIAREG
YesNo
Number of patients withat least one dose adjustment
Reason for therapy adjustment
0 20 40 60 80 100 120
16% (n=29)84%
(n=152)
Other
Co-medication
Weight gain
Patient request
Hypoglycemic events
Microvascular complications
Macrovascular complications
Change of substance combination
Insu�cient HbA1c reduction
39
9
13
10
22
16
2
23
112
FIGURE 2: MOST THERAPY AdJUSTMENTS ARE dUE TO POOR HbA1C CONTROL
N= 824 Patients, of which 43 had at least 1 hypoglycemic event as reported in DIAREGSource: Disease registries including Patient Reported Outcomes - IMS® DIAREG
4 or more 3 2 1
Number of patients having a hypoglycemic eventType of
hypoglycemic event
0 2 4 6 8 10 12 14 16
1
1
3
3
4
2
26
712
9
15
1317
Hypoglycemia requiringhospitalization
Hypoglycemia withglucose consumption
Number of events per patient
Hypoglycemiarequiring assistance
Blood sugar <70 mg/dlmeasured by patient
FIGURE 3: PATIENTS EXPERIENCING A HYPOGLYCEMIC EVENT
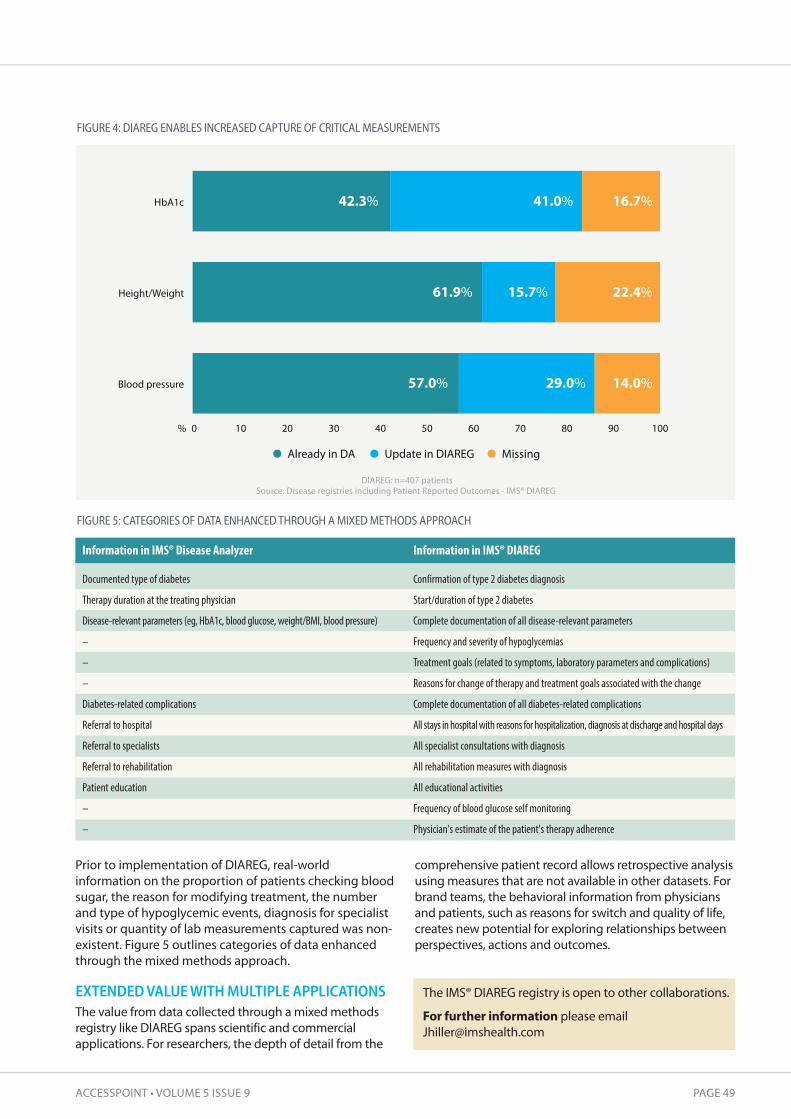
ACCESSPOINT • VOLUME 5 ISSUE 9 PAGE 49
Prior to implementation of DIAREG, real-worldinformation on the proportion of patients checking bloodsugar, the reason for modifying treatment, the numberand type of hypoglycemic events, diagnosis for specialistvisits or quantity of lab measurements captured was non-existent. Figure 5 outlines categories of data enhancedthrough the mixed methods approach.
EXTENDED VALUE WITH MULTIPLE APPLICATIONS The value from data collected through a mixed methodsregistry like DIAREG spans scientific and commercialapplications. For researchers, the depth of detail from the
comprehensive patient record allows retrospective analysisusing measures that are not available in other datasets. Forbrand teams, the behavioral information from physiciansand patients, such as reasons for switch and quality of life,creates new potential for exploring relationships betweenperspectives, actions and outcomes.
DIAREG: n=407 patientsSource: Disease registries including Patient Reported Outcomes - IMS® DIAREG
Already in DA Update in DIAREG Missing
57.0%
61.9%
42.3%
29.0%
15.7%
41.0%
14.0%
22.4%
16.7%
0% 10 20 30 40 50 60 70 80 90 100
Blood pressure
Height/Weight
HbA1c
FIGURE 4: dIAREG ENAbLES INCREASEd CAPTURE OF CRITICAL MEASUREMENTS
FIGURE 5: CATEGORIES OF dATA ENHANCEd THROUGH A MIXEd METHOdS APPROACH
Information in IMS® Disease Analyzer
Documented type of diabetes
Therapy duration at the treating physician
Disease-relevant parameters (eg, HbA1c, blood glucose, weight/BMI, blood pressure)
–
–
–
Diabetes-related complications
Referral to hospital
Referral to specialists
Referral to rehabilitation
Patient education
–
–
Information in IMS® DIAREG
Confirmation of type 2 diabetes diagnosis
Start/duration of type 2 diabetes
Complete documentation of all disease-relevant parameters
Frequency and severity of hypoglycemias
Treatment goals (related to symptoms, laboratory parameters and complications)
Reasons for change of therapy and treatment goals associated with the change
Complete documentation of all diabetes-related complications
All stays in hospital with reasons for hospitalization, diagnosis at discharge and hospital days
All specialist consultations with diagnosis
All rehabilitation measures with diagnosis
All educational activities
Frequency of blood glucose self monitoring
Physician's estimate of the patient's therapy adherence
The IMS® DIAREG registry is open to other collaborations.
For further information please [email protected]
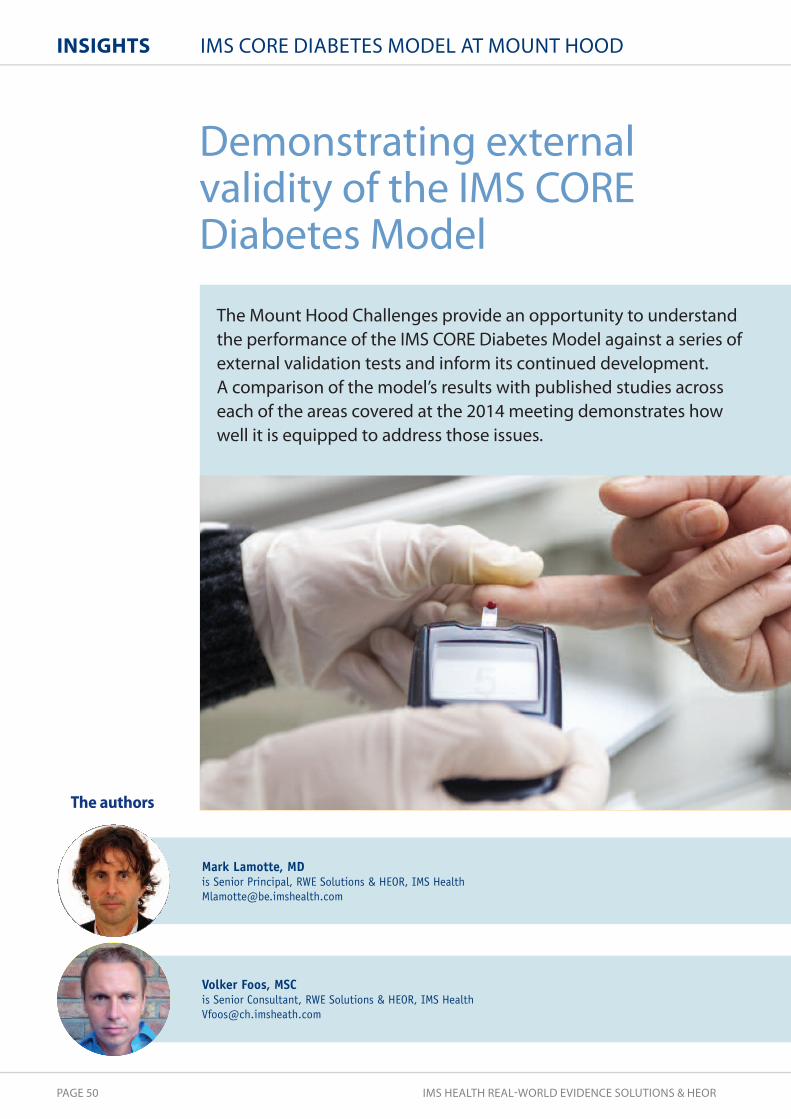
PAGE 50 IMS HEALTH REAL-WORLD EVIDENCE SOLUTIONS & HEOR
InsIghts IMS CORE DIABETES MODEL AT MOUNT HOOD
Demonstrating externalvalidity of the IMS COREDiabetes Model
The Mount Hood Challenges provide an opportunity to understandthe performance of the IMS CORE Diabetes Model against a series ofexternal validation tests and inform its continued development. A comparison of the model’s results with published studies acrosseach of the areas covered at the 2014 meeting demonstrates howwell it is equipped to address those issues.
The authors
Volker Foos, MSC is Senior Consultant, RWE Solutions & HEOR, IMS [email protected]
Mark Lamotte, MD is Senior Principal, RWE Solutions & HEOR, IMS [email protected]

ACCESSPOINT • VOLUME 5 ISSUE 9 PAGE 51
In June 2014, members of the IMS CORE Diabetes Model(CDM) team participated in the 7th Mount HoodChallenge at Stanford University in Palo Alto, CA. Focusedon economic aspects of diabetes and its complications,this biennial event is an important forum for comparingdifferent health economic diabetes simulation models(DSM), particularly in terms of structure and performance.The goal is to advance the science of economic modelingin diabetes and increase its validity and relevance to real-world decision making. Attendees include leadingdiabetes modeling groups, academics, industryrepresentatives and payers with an interest in theeconomics of diabetes.
A particular theme of the 2014 Challenge was how togeneralize DSM for different populations and over time,specifically exploring the ability of existing models toadjust for risk differentials arising from ethnic andsocioeconomic variability and any secular improvementsin diabetes care. Participants were tasked with three‘challenges’ to compare model projections to real-worldor clinical trial outcomes and explain and discussobserved differences
1. Replication of key endpoints from the Action for HealthDiabetes (Look AHEAD) study
2. Prediction of mortality following first myocardialinfarction (MI) or stroke
3. Variation in event rates due to ethnicity
TAKING THE CHALLENGE The CDM is a simulation model that predicts the long-term clinical and economic outcomes of diabetes mellitustype 1 (T1DM) and type 2 (T2DM). It is the leading tool forpolicy analysis and reimbursement strategy in the diseaseand is regularly updated and revalidated (see Newssection, page 5). The Mount Hood Challenges provide anopportunity to understand its performance against aseries of external validation tests and inform thecontinued development and enhancement of itsfunctionalities. Although findings from the challengesthemselves cannot be reported here, comparing CDMresults with published studies across each of the areasthey covered demonstrates how well the model isequipped to address these issues.
Challenge 1: Look AhEAD validationThe LOOK AHEAD study1 included 5,145 overweight orobese T2DM patients to participate in an intensivelifestyle intervention (ILI) promoting weight loss throughdecreased caloric intake and increased physical activity(intervention group) or to receive diabetes support andeducation (DSE) (control group). Patients in the ILI groupexperienced greater weight loss (8.6% vs. 0.7%) andreductions in HbA1c (0.6% points vs. 0.1% points) at oneyear. The study concluded that weight loss did not reducethe rate of cardiovascular (CV) events in overweight orobese adults with T2DM.
External validation of DSM against studies that primarilyfocused on weight reduction is of interest particularlyfollowing a recent review criticizing the degree by whichmodels translate weight improvements into benefits.2 Theauthors assert that their fundamental assumptionsrelating to weight effects are too strong and unsupportedby the literature.
Like many models targeted in the review andparticipating in the Mount Hood Challenge, the CDMapplies UKPDS risk equations3,4 that incorporate BMI as arisk factor for heart failure. In fact, no other micro- ormacrovascular complication risk is affected by weight. Theoverall magnitude of weight-changes on clinicaloutcomes in DSM is therefore modest when compared tothe impact of other risk factors such as HbA1c, lipids orblood pressure.
For example, a CDM lifetime analysis utilizing UKPDS 68equations3 in a ACCORD-like population to explore thebenefits of reducing BMI from 32 to 31 kg/m2 translatesinto 0.008 life years gained and 0.004 QALYs gained withno substantial improvements projected for any endpointexcept a 4.5% relative reduction of heart failure (HF)incidence (16.1% vs. 16.8%).
The external validation of the LOOK AHEAD trial acrossseveral DSM was relevant to further inform this researchquestion and help eliminate doubts that modelsoverestimate the clinical effects associated with weightchanges.
The 2014 Mount Hood Challenge
continued on next page
The goal of the Mount Hood Challenge is to advance the science ofeconomic modeling in diabetes and increase its validity and relevance to real-world decision making.
“”

PAGE 52 IMS HEALTH REAL-WORLD EVIDENCE SOLUTIONS & HEOR
InsIghts IMS CORE DIABETES MODEL AT MOUNT HOOD
Challenge 2: Mortality validationIt is important to understand how DSM are capable ofpredicting mortality across populations that were notused for the construction of their inherent risk equations(external validation). This challenge examined their abilityto predict mortality vs. trends observed in 20,836 peoplewith T2DM from the Swedish National Diabetes Register.
The CDM utilizes risk equations from the UKPDS3,4 topredict mortality following major diabetes-relatedcomplications. It has recently undergone a single ‘all-cause mortality’ (ACM) validation against variouscontemporary outcome studies (UKPDS, ACCORD,ADVANCE, VADT, ASPEN)5,6,7,8,9 which has shown a belowaverage fit with an R2-statistic of 0.651. This compares toan overall R2-statistic of 0.90 as obtained in the 2014 CDMrevalidation exercise including 112 microvascular,macrovascular and mortality validation endpoints.10
Lack of fit in the ACM validation was associated with amodel over-estimation of ACM when compared tocontemporary outcome studies (ACCORD, ADVANCE, andVADT). It is generally understood that these studiesreported low mortality incidence, likely because patientswere managed under controlled clinical trial (RCT)conditions. CDM mortality predictions were thereforecontrasted against several external datasets that weremore eligible to represent real-world conditions
• Charlson Co-morbidity Index (CCI)The CCI11 is widely utilized to measure burden of diseaseand predict mortality in various disease subgroups,including cancer, renal disease, liver disease anddiabetes. Its ability to predict mortality risk has beenvalidated extensively. The CCI was applied to predict 10-year mortality risk for diabetes patients aged 50, 60,70 and 80 years. Risk scores were generated for fourdifferent co-morbidity levels: no complications (NC); MI;MI and stroke (MI+S); MI+S and CHF (MI+S+CHF); andMI+S+CHF and end-stage renal disease (MI+S+CHF+ESRD).CCI mortality scores were compared to corresponding10-year ACM predictions from the CDM.
• UK general Practice Research Database (gPRD) The CDM was validated to data from a retrospectivecohort study12 from the UK General Practice ResearchDatabase (GPRD). The study compared ACM across fiveglucose-lowering regimens: metformin monotherapy;sulfonylurea monotherapy; insulin monotherapy;metformin plus sulfonylurea combination therapy; andinsulin plus metformin combination therapy.
• Administrative dataset from Western Australia (WA) Predictions from an online life expectancy calculatorthat applies mortality risk equations derived from13,884 WA hospital and mortality records13 werecompared to respective predictions from the CDM.
The coefficient of determination (R2) goodness-of-fitmeasure was evaluated separately for the individualexercises. R2 scores of 0.76, 0.82 and 0.99 were obtainedwhen the CDM was compared to predictions from theCCI, GPRD and WA life expectancy calculator. Overall R2,including all mortality and life expectancy validation
outcomes, amounted to 0.88 which supports the CDM asa credible tool for predicting mortality in real-worldsettings. Individual outcomes for the four validationsettings are shown in Figure 1.
This validation exercise outlines the observed discrepancywhen the CDM is compared to data from RCTs or to datafrom non-controlled, real-world observations. As theoverall intention of DSM is to predict the implications ofnew technologies in clinical practice, this emphasizes theneed to compare against evidence from real-worldsettings when assessing the validity of DSM.
Challenge 3: Ethnicity differencesEconomic evaluations of health interventions need toconsider differences in healthcare expenditures acrosssubgroups.14 Accounting for the heterogeneity of thetreated population to identify subgroups is important toexpose variation in incremental cost-effectiveness ratios(ICERs); a given intervention may be cost-effective forsome subgroups but not for others.
Ethnicity can considerably influence the incidence ofdiabetes-related complications which may be caused bygenetic, socioeconomic and socio-cultural factors.15 It isthus important to understand the extent to which DSMconsider ethnic differences in the modeling. Severalstudies have reported on ethnic differences in rates ofdiabetes-related complications.16,17,18,19 The aim of thethird challenge was to understand the degree to whichthese differences are incorporated into the various DSMand affect predicted outcomes.
The goal for the modeling groups was to estimatesurvival, costs and diabetes-related outcomes for anaverage T2DM profile and all ethnic groups considered inthe respective models. The CDM considers ethnicityadjustments for a number of micro- and macrovascularcomplications including renal disease, eye disease,neuropathy, and coronary heart disease. Details of theethnicity adjustments applied in the CDM, together withrespective literature sources, are reported in Table 1.
In this respect, a comparison of ethnic adjustments in theCDM to a systematic review20 documenting a similar trendof ethnicity-related risk associations for renal disease, eyedisease, CV disease and mortality, is revealing.Consolidating the evidence of 51 articles reporting dataon ethnic differences in mortality and diabetes-relatedcomplications, the review quantified the number ofidentified studies (see Table 2) that reported higher (red),lower (blue) or equal (green) risk for several ethnicitygroups versus a white reference population.
Studies were classified in different groups to distinguishthose that reported significant risk associations withethnicity after adjustment of confounders (eg, age,duration of diabetes and sex) and those that furtheradjusted for additional risk factors (eg socioeconomicstatus, smoking). Although the CDM applies data fromdifferent sources, comparability to the reviewdemonstrates that its ethnicity adjustments arecontemporary and qualified to differentiate ethnicity-related differences in the natural history of diabetes.
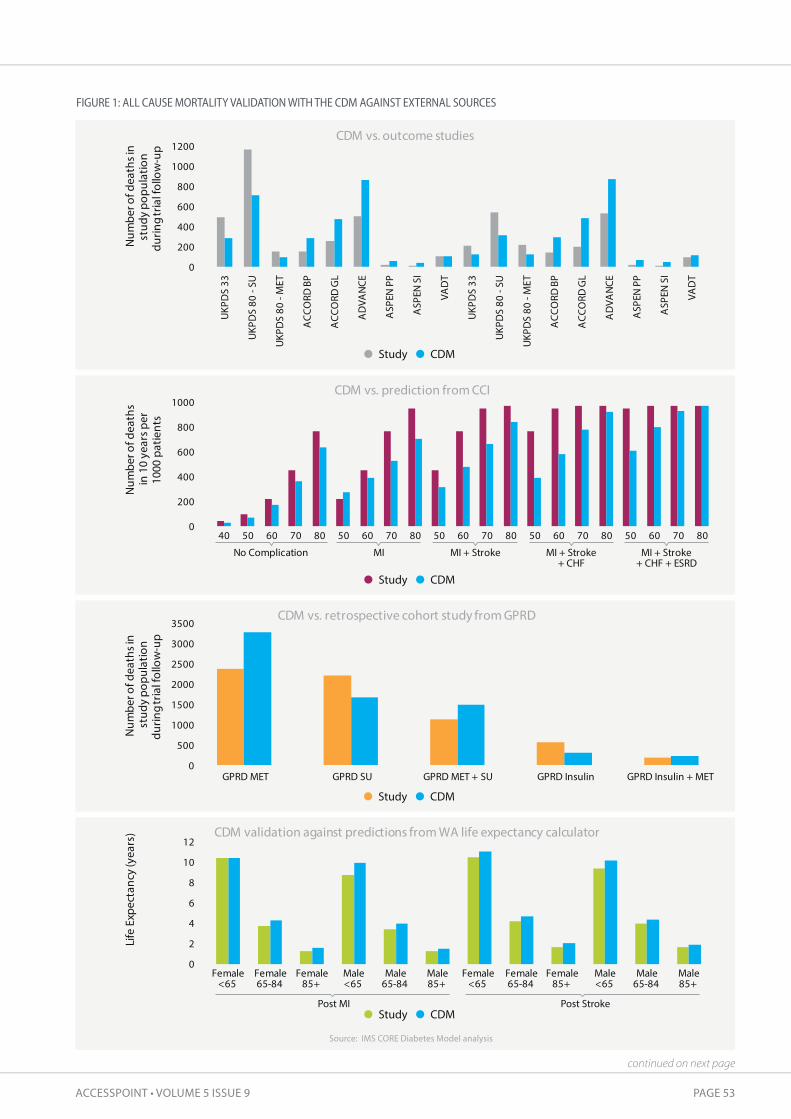
ACCESSPOINT • VOLUME 5 ISSUE 9 PAGE 53
FIGURE 1: ALL CAUSE MORTALITY VALIdATION WITH THE CdM AGAINST EXTERNAL SOURCES
Source: IMS CORE Diabetes Model analysis
0
200
400
600
800
1000
40 50 60 70 80 50 60 70 80 50 60 70 80 50 60 70 80 50 60 70 80
No Complication MI MI + Stroke MI + Stroke+ CHF
MI + Stroke + CHF + ESRD
Num
ber o
f dea
ths
in 1
0 ye
ars p
er10
00 p
atie
nts
CDM vs. prediction from CCI
0
500
1000
1500
2000
2500
3000
3500
GPRD MET GPRD SU GPRD MET + SU GPRD Insulin GPRD Insulin + MET
Num
ber o
f dea
ths i
n st
udy
popu
latio
ndu
ring
tria
l fol
low
-up
CDM vs. retrospective cohort study from GPRD
0
200
400
600
800
1000
1200
UKP
DS
33
UKP
DS
80 -
SU
UKP
DS
80 -
MET
ACC
ORD
BP
ACC
ORD
GL
AD
VAN
CE
ASP
EN P
P
ASP
EN S
I
VAD
T
UKP
DS
33
UKP
DS
80 -
SU
UKP
DS
80 -
MET
ACC
ORD
BP
ACC
ORD
GL
AD
VAN
CE
ASP
EN P
P
ASP
EN S
I
VAD
T
Num
ber o
f dea
ths i
nst
udy
popu
latio
n du
ring
tria
l fol
low
-up
CDM vs. outcome studies
0
2
4
6
8
10
12
Female<65
Female65-84
Female85+
Male<65
Male65-84
Male85+
Female<65
Female65-84
Female85+
Male<65
Male65-84
Male85+
Life
Exp
ecta
ncy
(yea
rs) CDM validation against predictions from WA life expectancy calculator
Study CDM
Study CDM
Study CDM
Study CDM
Post StrokePost MI
continued on next page

PAGE 54 IMS HEALTH REAL-WORLD EVIDENCE SOLUTIONS & HEOR
InsIghts IMS CORE DIABETES MODEL AT MOUNT HOOD
TAbLE 1: SUMMARY OF OddS RATIOS APPLIEd TO ETHNIC AdJUSTMENTS IN THE CdM
WHO = Ethnicity specificlife table data from Worldhealth organization(http://apps.who.int/gho/data/view.main.61780)adjusted (reduced) for alldiabetes-related causesof death that are trackedin the CDM; UK 68 RE=UKPDS 68 riskequations; UK 82 RE=UKPDS 82 riskequations; UK 56 RE=UKPDS 56 riskengine; T1DM= Type 1 diabetes;T2DM= Type 2 diabetes;x = no race adjustment
Microvascular
Eye diseaseBDR onsetBDR to PDRPDR to SVLME to SVLRenal diseaseMAU onsetMAU to GRPGRP to ESRDESRD deathpost HD post PDpost RT
NeuropathyMacrovascularMI
StrokeIHDCHFMortalityEvent fatalityLong-term diabetes related mortalityNon diabetes-specific mortality
Type
T2DMT2DMT2DMT2DM
T2DMT1DM & T2DMT1DM & T2DMT1DM & T2DMT1DM & T2DMT1DM & T2DMT1DM & T2DM
T1DM & T2DM
T1DM & T2DMT1DM & T2DMT1DM & T2DM
T1DM & T2DMT1DM & T2DMT1DM & T2DM
White
xxxx
xxxx112
112
112
x
x
xxx
xx
WHO30
Black
1.0321
3.7721
122
2.323
1.38211
4.425
4.425
0.7226
0.5626
1.0026
0.5327
UK 68 RE3
UK 82 RE4
UK 56 RE29
xxx
xx
WHO30
Hispanic
1.0321
3.6321
122
2.323
124
2.525
2.525
xxx128
x
xxx
xx
WHO30
Am. Indian
1.0321
11
122
123
1.04824
1.525
1.525
xxx
0.2927
x
xxx
xx
WHO30
Asian/PacificIslander
xxxx
xxx
xxxx
x
xxx
xx
WHO30,19
Indian
xxxx
xxx
xxxx
UK 82 RE4
xxx
UK 82 RExx
TAbLE 2: SUMMARY FINdINGS ON NUMbER OF STUdIES REPORTING EITHER LOWER, EQUAL OR HIGHER RISK ASSOCIATEdWITH ETHNICITIES VERSUS WHITE POPULATION IN US & UK
Higher risk (average)Lower risk (average)Equal risk (average)Retinopathy
Black Hispanic Asian
Nephropathy & ESRD Black Hispanic Asian
CV complications Black Hispanic Asian
NeuropathyBlack Hispanic Asian
MortalityBlack Hispanic Asian
higher11
21
41
lower00
0
equal00
11
22
11
1
higher13
211
1
lower11
0
1 3 3
equal30
11
2
1 1
13
higher0
0
lower0
0
1
2
equal1
0
1
1
higher0
0
1
lower0
1
1
equal0
0
1
1
US
Adjusted for confounders(age, duration, sex)
Adjusted for confounders& additional risk factors
Adjusted for confounders(age, duration, sex)
Adjusted for confounders& additional risk factors
UK

ACCESSPOINT • VOLUME 5 ISSUE 9 PAGE 55
1 The Look AHEAD Research Group. Cardiovascular effects of intensive lifestyle intervention in type 2 diabetes. N Engl J Med, 2013; 369: 145-542 Asche CV, Hippler SE, Eurich DT. Review of models used in economic analyses of new oral treatments for type 2 diabetes mellitus.Pharmacoeconomics, 2014, Jan; 32(1): 15-27
3 Clarke PM, Gray AM, Briggs A, Farmer AJ, Fenn P, Stevens RJ, et al. A model to estimate the lifetime health outcomes of patients with type 2diabetes: The United Kingdom Prospective Diabetes Study (UKPDS) Outcomes Model (UKPDS no. 68). Diabetologia, 2004, Oct; 47(10): 1747-59.Epub 2004 Oct 27.
4 Hayes AJ, Leal J, Gray AM, Holman RR, Clarke PM. UKPDS outcomes model 2: A new version of a model to simulate lifetime health outcomes ofpatients with type 2 diabetes mellitus using data from the 30 year United Kingdom Prospective Diabetes Study: UKPDS 82. Diabetologia, 2013, Sep;56(9): 1925-33. Epub 2013 Jun 22.
5 Holman RR, Paul SK, Bethel MA, Matthews DR, Neil HA. 10-year follow-up of intensive glucose control in type 2 diabetes. N Engl J Med, 2008; 359(15): 1577-896 The Action to Control Cardiovascular Risk in Diabetes Study Group. Effects of intensive glucose lowering in type 2 diabetes. N Engl J Med, 2008; 358: 2545-2557 ADVANCE Collaborative Group. Intensive blood glucose control and vascular outcomes in patients with type 2 diabetes. N Engl J Med, 2008; 358 (24): 2560-728 Duckworth W, Abraira C, Moritz T, Reda D, Emanuele N, Reaven PD, et al; VADT Investigators. Glucose control and vascular complications in veteranswith type 2 diabetes. N Engl J Med, 2009; 360(2): 129-39
9 Knopp RH, d'Emden M, Smilde JG, Pocock SJ. Efficacy and safety of atorvastatin in the prevention of cardiovascular end points in subjects with type 2diabetes: The Atorvastatin Study for Prevention of Coronary Heart Disease Endpoints in non-insulin-dependent diabetes mellitus (ASPEN). DiabetesCare, 2006 Jul; 29(7): 1478-85
10 McEwan P, Foos V, Palmer JL, Lamotte M, Lloyd A, Grant D. Validation of the IMS CORE Diabetes Model. Value in Health, 2014; 17: 714-72411 Quan H, Li B, Couris CM, Fushimi K, Graham P, Hider P, Januel JM, Sundararajan V. Updating and validating the Charlson comorbidity index and score
for risk adjustment in hospital discharge abstracts using data from 6 countries. Am J Epidemiol, 2011; 173(6): 676-8212 Currie C J, Poole CD, Evans M, Peters JR, Morgan CL. Mortality and other important diabetes-related outcomes with insulin vs other
antihyperglycemic therapies in type 2 diabetes. J Clin Endocrinol Metab, February 2013; 98(2): 668-67713 Hayes A, Leal J, Kelman C, Clarke P. Risk equations to predict life expectancy of people with type 2 diabetes mellitus following major complications:
A study from Western Australia. Diabet Med, 2011, Apr; 28(4): 428-35. Calculator available at: http://sydney.edu.au/medicine/public-health/heconomics/resources/supplementary.php Accessed 19 October, 2014
14 Sculpher M. Sculper subgroups and heterogeneity in cost-effectiveness analysis. Pharmacoeconomics, 2008; 26 (9): 799-80615 Uniken Venema HP, Garretsen HF, van der Maas PJ. Health of migrants and migrant health policy: The Netherlands as an example. Soc Sci Med, 1995; 41:809-81816 Skyler JS, Oddo C. Diabetes trends in the USA. Diabetes Metab Res Rev, 2002; 18 (Suppl 3): S21-S2617 Samanta A, Burden AC, Fent B. Comparative prevalence of non-insulin-dependent diabetes mellitus in Asian and white Caucasian adults. Diabetes
Res Clin Pract, 1987; 4:1-618 Samanta A, Burden AC, Jones GR, Woollands IG, Clarke M, Swift PG, Hearnshaw JR. Prevalence of insulin-dependent diabetes mellitus in Asian
children. Diabet Med, 1987; 4: 65-67 19 Davis TM, Coleman RL, Holman RR; UKPDS Group. Ethnicity and long-term vascular outcomes in type 2 diabetes: A prospective observational study
(UKPDS 83). Diabet Med, 2014, Feb; 31(2): 200-720 Lanting LC, Joung IM, Mackenbach JP, Lamberts SW, Bootsma AH. Ethnic differences in mortality, end-stage complications, and quality of care
among diabetic patients. Diabetes Care, 2005, Sep; 28(9): 2280-821 Zhang X, Saaddine JB, Chou C-F, Cotch MF, Cheng YJ, Geiss LS , et al. Prevalence of diabetic retinopathy in the United States, 2005-2008. JAMA,
2010, Aug 11; 304(6): 649-56. doi: 10.1001/jama.2010.1111 22 Sivaprasad S, Gupta B, Gulliford MC, Dodhia H, Mann S, Nagi D, Evans J. Ethnic variation in the prevalence of visual impairment in people
attending diabetic retinopathy screening in the United Kingdom (DRIVE UK). PLoS One, 2012; 7(6): e39608. doi: 10.1371/journal.pone.0039608.Epub 2012 Jun 27
23 Emanuele N, Moritz T, Klein R, Davis MD, Glander K, Khanna A, et al. Ethnicity, race and clinically significant macular edema in the Veterans AffairsDiabetes Trial (VADT). Diabetes Res Clin Pract, 2009, Nov; 86(2): 104-10 doi: 10.1016/j.diabres.2009.08.001. Epub 2009 Aug 31
24 U.S. Renal Data System, USRDS 2013 Annual Data Report: Atlas of Chronic Kidney Disease and End-Stage Renal Disease in the United States,National Institutes of Health, National Institute of Diabetes and Digestive and Kidney Diseases, Bethesda, MD, 2013. Volume 1, table 2.6http://www.usrds.org/atlas.aspx [07.05.2014]
25 DiPiro J, Talbert RL, Yee GC, Matzke GR, Wells BG, Posey LM. Pharmacotherapy: A pathophysiologic approach 9th Ed, McGraw Hill, 2014 based on U.S.Renal Data System, USRDS 2012 Annual Data Report: Atlas of Chronic Kidney Disease and End-Stage Renal Disease in the United States, NationalInstitutes of Health, National Institute of Diabetes and Digestive and Kidney Diseases, Bethesda, MD, 2012
26 U.S. Renal Data System, USRDS 2010 Annual Data Report: Atlas of Chronic Kidney Disease and End-Stage Renal Disease in the United States,National Institutes of Health, National Institute of Diabetes and Digestive and Kidney Diseases, Bethesda, MD, 2010
27 Abbott CA, Garrow AP, Carrington AL, Morris J, Van Ross ER, Boulton AJ. Foot ulcer risk is lower in South-Asian and African-Caribbean compared withEuropean diabetic patients in the U.K.: The North-West diabetes foot care study. Diabetes Care, 2005, Aug; 28(8): 1869-75
28 Franklin GM, Shetterly SM, Cohe JA, Baxter J, Hamman RF. Risk factors for distal symmetric neuropathy in NIDDM. The San Luis Valley DiabetesStudy. Diabetes Care, 1994; 17: 1172-1177
29 Stevens RJ, Kothari V, Adler AI, Stratton IM. The UKPDS risk engine: A model for the risk of coronary heart disease in type II diabetes (UKPDS 56). ClinSci (Lond), 2001, Dec; 101(6): 671-9
30 World Health Organization. Global Health Observatory Data Repository, Life tables by country (http://apps.who.int/gho/data/view.main.61780)
A manuscript reporting on the 7th Mount Hood Meeting held at Stanford University in Palo Alto, CA, 17-19 June,2014, including results of the challenge for all participating models, is being prepared for publication by theMount Hood Modeling Group.
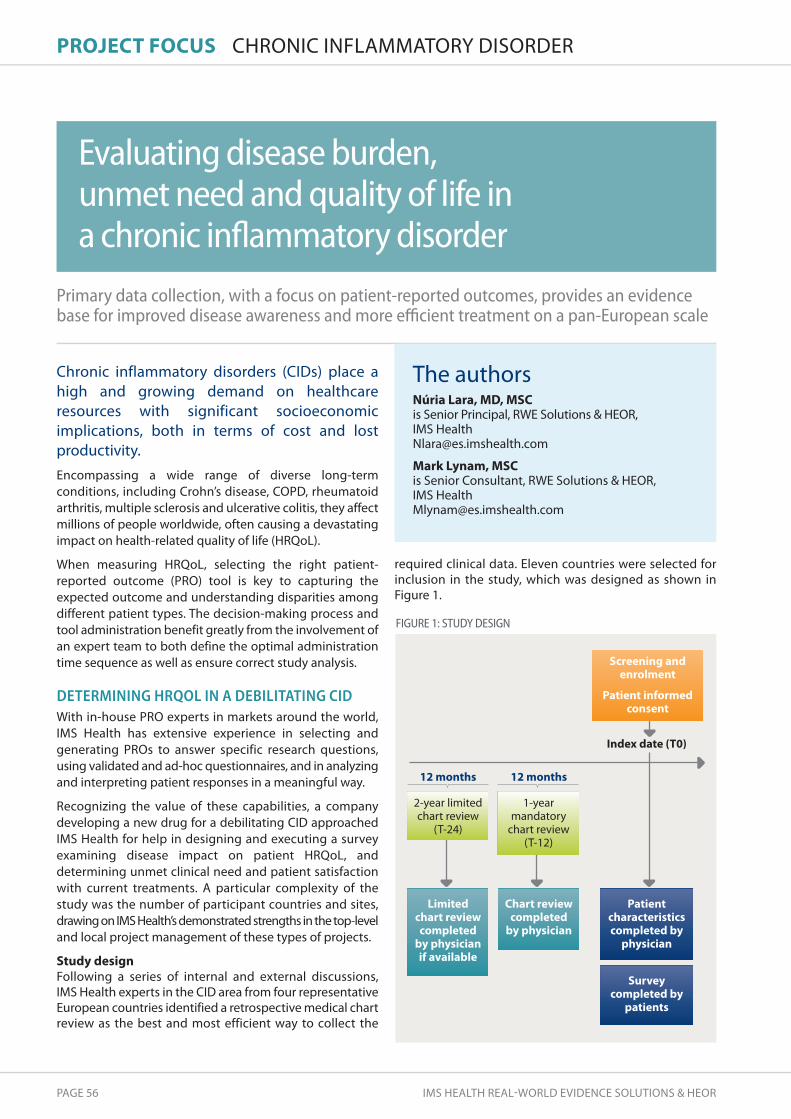
PAGE 56 IMS HEALTH REAL-WORLD EVIDENCE SOLUTIONS & HEOR
PROJECt FOCUs CHRONIC INFLAMMATORY DISORDER
Primary data collection, with a focus on patient-reported outcomes, provides an evidencebase for improved disease awareness and more efficient treatment on a pan-European scale
Chronic inflammatory disorders (CIDs) place ahigh and growing demand on healthcareresources with significant socioeconomicimplications, both in terms of cost and lostproductivity. Encompassing a wide range of diverse long-termconditions, including Crohn’s disease, COPD, rheumatoidarthritis, multiple sclerosis and ulcerative colitis, they affectmillions of people worldwide, often causing a devastatingimpact on health-related quality of life (HRQoL).
When measuring HRQoL, selecting the right patient-reported outcome (PRO) tool is key to capturing theexpected outcome and understanding disparities amongdifferent patient types. The decision-making process andtool administration benefit greatly from the involvement ofan expert team to both define the optimal administrationtime sequence as well as ensure correct study analysis.
DETERMINING HRQOL IN A DEBILITATING CIDWith in-house PRO experts in markets around the world,IMS Health has extensive experience in selecting andgenerating PROs to answer specific research questions,using validated and ad-hoc questionnaires, and in analyzingand interpreting patient responses in a meaningful way.
Recognizing the value of these capabilities, a companydeveloping a new drug for a debilitating CID approachedIMS Health for help in designing and executing a surveyexamining disease impact on patient HRQoL, anddetermining unmet clinical need and patient satisfactionwith current treatments. A particular complexity of thestudy was the number of participant countries and sites,drawing on IMS Health’s demonstrated strengths in the top-leveland local project management of these types of projects.
study designFollowing a series of internal and external discussions, IMS Health experts in the CID area from four representativeEuropean countries identified a retrospective medical chartreview as the best and most efficient way to collect the
required clinical data. Eleven countries were selected forinclusion in the study, which was designed as shown inFigure 1.
Evaluating disease burden,unmet need and quality of life ina chronic inflammatory disorder
FIGURE 1: STUdY dESIGN
Limitedchart reviewcompleted
by physicianif available
Chart reviewcompleted
by physician
12 months 12 months
Patientcharacteristicscompleted by
physician
Index date (t0)
surveycompleted by
patients
screening andenrolment
Patient informedconsent
2-year limitedchart review
(T-24)
1-yearmandatory
chart review(T-12)
The authorsnúria Lara, MD, MsC is Senior Principal, RWE Solutions & HEOR,IMS Health [email protected]
Mark Lynam, MsC is Senior Consultant, RWE Solutions & HEOR, IMS [email protected]

ACCESSPOINT • VOLUME 5 ISSUE 9 PAGE 57
study implementationCombining the knowledge of both global and local IMS Health experts in each of the participant countries, thestudy followed a phased and structured approach (Figure 2),commencing with clarification of the objectives, alignmentwith stakeholder expectations, and definition of rules andcommunication pathways. Regular, scheduled meetingswith the company and local country teams were a key partof the overall process.
study protocol and CRF developmentIMS Health began by preparing a study protocol and CRF inconjunction with the company and CID experts, ensuring clearcase definition in a set of unambiguous inclusion/exclusioncriteria. The most appropriate validated PROs were identifiedand administered (following translation into local language)via short ad-hoc questionnaires to study patients. Theseconsisted of
• EQ-5D generic HRQoL questionnaire to allowcomparison of results to other disease populations aswell as the general population
• Disease-specific hRQoL questionnaire to enable smalldifferences between patients in the study to bedistinguished
• tsQM generic questionnaire to evaluate treatmentsatisfaction related to side effects, effectiveness,convenience and global satisfaction
• Disease-specific work productivity and activityquestionnaire to measure work- and activity-relatedimpact of CID on patients
• Ad-hoc questions on patient knowledge of disease todetermine patients’ understanding of their disease,including possible progression, complications and availabletreatments
• Ad-hoc questions on disease activity to understandpatients’ assessment of current disease activity and collectinformation on treatment preferences.
The licensing of proprietary PROs was handled by IMS Health,along with translation of the validated and ad-hocquestionnaires to the relevant language of each study country.The PROs were translated in accordance with the authors’instructions following pilot testing with a small sample ofpatients. The master versions of the protocol and CRF wereprepared in English and translated to local languages oradapted in English as required for Ethics Committee (EC)presentations or study execution.
site screening and selectionSite selection is a key part of any clinical or observationalstudy given the role of successful patient recruitment in itsoverall success. In this case, the company was keen tomaintain a clear distance from the sites included in order toavoid creating bias and therefore requested IMS Health toselect all participant sites. Investigators from 11 differentcountries were chosen and invited to take part, using theIMS Health internal database of physicians known to havean interest in contributing to observational research.
Potential sites were screened using a questionnairereflective of the study protocol to confirm availability ofevaluable patients, level of interest in the study andability to use an online electronic CRF (eCRF). Siteselection was conducted in the local language by IMS Health local teams in the interests of efficiency andto maximize the rate of acceptance.
Ethics Committees and contractingThe EC process can be time consuming and its efficientmanagement by local experts who understand the culture,language and procedure, is key for an expedited andsuccessful outcome.
In this study, IMS Health local regulatory experts presentedthe study to national and/or local ECs in accordance withlegislation. The same experts also managed contracts withthe study centers – important for ensuring conformity withlocal requirements and sensitivities.
FIGURE 2: THE STUdY FOLLOWEd A PHASEd ANd STRUCTUREd APPROACH
Projectkick-off
studyprotocol & CRF
sitescreening& selection
EthicsCommittees& contracting
Datacollection& sitemanagment
Analysis &reporting
continued on next page
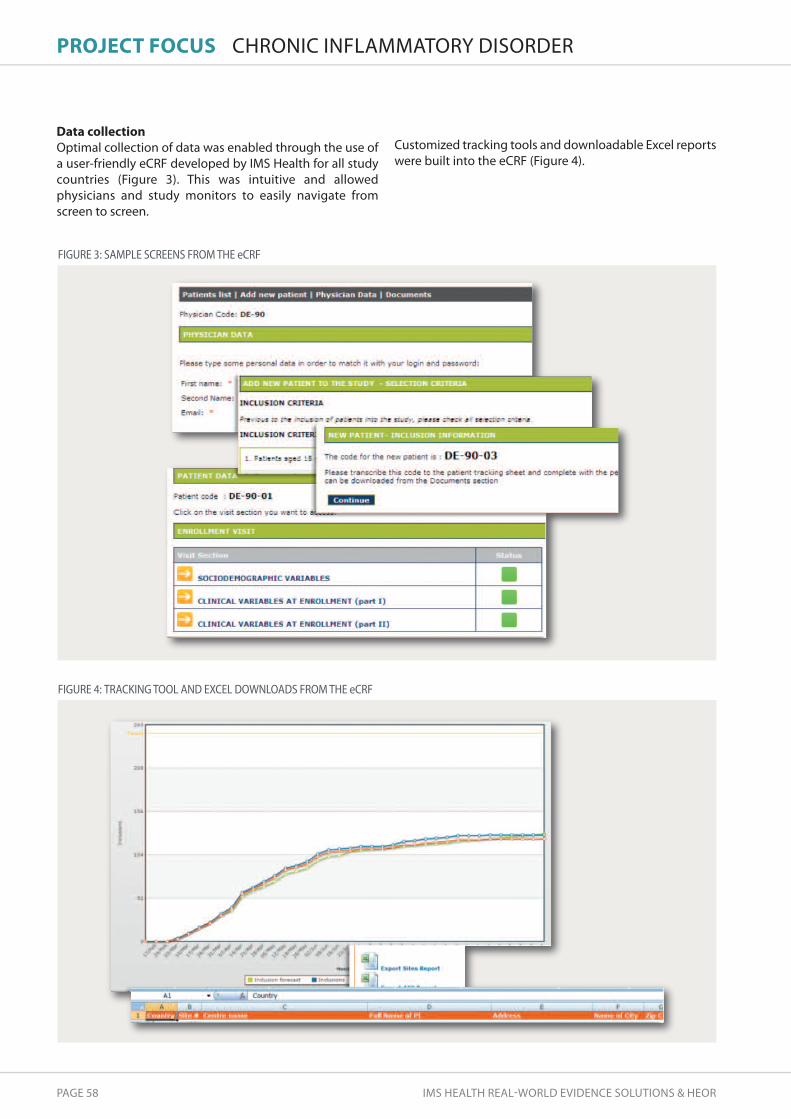
PAGE 58 IMS HEALTH REAL-WORLD EVIDENCE SOLUTIONS & HEOR
PROJECt FOCUs CHRONIC INFLAMMATORY DISORDER
Data collection Optimal collection of data was enabled through the use ofa user-friendly eCRF developed by IMS Health for all studycountries (Figure 3). This was intuitive and allowedphysicians and study monitors to easily navigate fromscreen to screen.
FIGURE 3: SAMPLE SCREENS FROM THE eCRF
Customized tracking tools and downloadable Excel reportswere built into the eCRF (Figure 4).
FIGURE 4: TRACKING TOOL ANd EXCEL dOWNLOAdS FROM THE eCRF

ACCESSPOINT • VOLUME 5 ISSUE 9 PAGE 59
site management When planning site management and monitoring, it isimportant to be aware that the needs of observationalstudies are very different from those of randomized clinicaltrials (RCTs). All too often there is a tendency to overcomplicate this element in observational research asthough it was a RCT, resulting in an unnecessarilyprotracted and expensive process. In this case, once eachsite had received EC approval and a signed contract was inplace, the local CRAs were able to train investigators andtheir teams.
Based on previous successful experiences, and inagreement with the company, IMS Health conductedtelephonic training with each site. This not only allowed thesites to be trained at the most convenient time for them,even at very short notice, but also provided study teamswith the chance to ask more questions than they would beable (or want) to in a group training call.
During the patient recruitment period, regular follow-upcalls were made to the sites by IMS Health to motivatepatient inclusion, resolve queries and check for unreportedserious adverse events. Queries were managed on anongoing basis to maximize data quality and avoidunnecessary delays in study closure, facilitated by theintegration of a query management system in the eCRF.
A number of on-site close-out visits (SCVs) were made forsource data verification. As an important cost driver ofprimary data collection, limiting SCVs to a randomlyselected percentage of sites is recommended.
Analysis and reporting Once all the data had been entered into the eCRF, it wascleaned and the database locked for analysis. Paper PROscompleted by patients were collected on an ongoing basisand entered into a database designed by IMS Health.Reported diseases and co-morbidities were also coded. As a final study step, IMS Health ran the study analysis andreport in accordance with the approved Statistical AnalysisPlan, and documented the results in a statistical report.
REAL-WORLD EVIDENCE THAT IMPACTS PATIENTS’TREATMENTThe findings of the study provided detailed insights into theimpact of the CID on patients’ HRQoL and evidenced theunmet clinical need. They also served to drive awareness ofthe societal impact of the CID and support the company’sefforts to demonstrate the benefits of an early treatmentintervention.
The observational study was successfully executed in 11 European countries. The results have already formed thebasis of several poster presentations at internationalconferences and a further publication is being prepared forpresentation in the most important internationalconference for the CID in question before the end of 2014.Scientifically important conclusions have been drawn fromthe study with the potential for the evidence generated toinfluence clinical practice in the future.
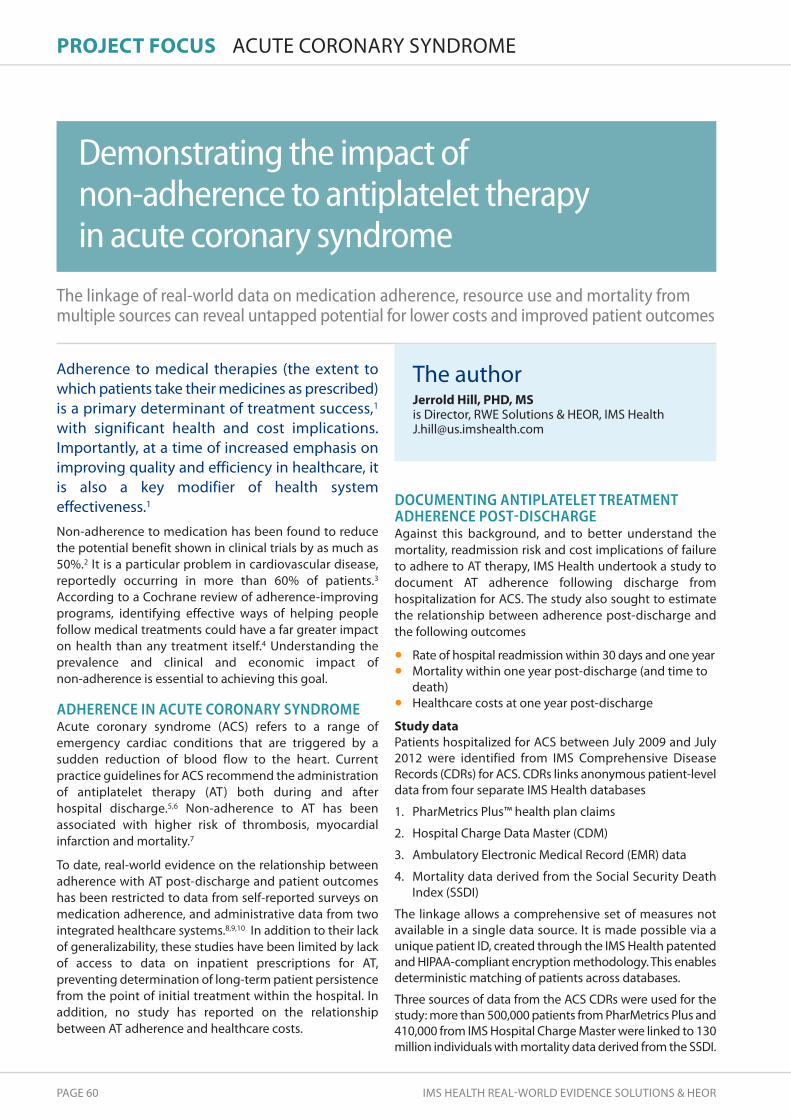
PAGE 60 IMS HEALTH REAL-WORLD EVIDENCE SOLUTIONS & HEOR
PROJECt FOCUs ACUTE CORONARY SYNDROME
The linkage of real-world data on medication adherence, resource use and mortality frommultiple sources can reveal untapped potential for lower costs and improved patient outcomes
Adherence to medical therapies (the extent towhich patients take their medicines as prescribed)is a primary determinant of treatment success,1
with significant health and cost implications.Importantly, at a time of increased emphasis onimproving quality and efficiency in healthcare, itis also a key modifier of health systemeffectiveness.1
Non-adherence to medication has been found to reducethe potential benefit shown in clinical trials by as much as50%.2 It is a particular problem in cardiovascular disease,reportedly occurring in more than 60% of patients.3
According to a Cochrane review of adherence-improvingprograms, identifying effective ways of helping peoplefollow medical treatments could have a far greater impacton health than any treatment itself.4 Understanding theprevalence and clinical and economic impact of non-adherence is essential to achieving this goal.
ADHERENCE IN ACUTE CORONARY SYNDROMEAcute coronary syndrome (ACS) refers to a range ofemergency cardiac conditions that are triggered by asudden reduction of blood flow to the heart. Currentpractice guidelines for ACS recommend the administrationof antiplatelet therapy (AT) both during and after hospital discharge.5,6 Non-adherence to AT has beenassociated with higher risk of thrombosis, myocardialinfarction and mortality.7
To date, real-world evidence on the relationship betweenadherence with AT post-discharge and patient outcomeshas been restricted to data from self-reported surveys onmedication adherence, and administrative data from twointegrated healthcare systems.8,9,10 In addition to their lackof generalizability, these studies have been limited by lackof access to data on inpatient prescriptions for AT,preventing determination of long-term patient persistencefrom the point of initial treatment within the hospital. Inaddition, no study has reported on the relationshipbetween AT adherence and healthcare costs.
DOCUMENTING ANTIPLATELET TREATMENTADHERENCE POST-DISCHARGEAgainst this background, and to better understand themortality, readmission risk and cost implications of failureto adhere to AT therapy, IMS Health undertook a study todocument AT adherence following discharge fromhospitalization for ACS. The study also sought to estimatethe relationship between adherence post-discharge andthe following outcomes
• Rate of hospital readmission within 30 days and one year• Mortality within one year post-discharge (and time to
death)• Healthcare costs at one year post-discharge
study dataPatients hospitalized for ACS between July 2009 and July2012 were identified from IMS Comprehensive DiseaseRecords (CDRs) for ACS. CDRs links anonymous patient-leveldata from four separate IMS Health databases
1. PharMetrics Plus™ health plan claims
2. Hospital Charge Data Master (CDM)
3. Ambulatory Electronic Medical Record (EMR) data
4. Mortality data derived from the Social Security DeathIndex (SSDI)
The linkage allows a comprehensive set of measures notavailable in a single data source. It is made possible via aunique patient ID, created through the IMS Health patentedand HIPAA-compliant encryption methodology. This enablesdeterministic matching of patients across databases.
Three sources of data from the ACS CDRs were used for thestudy: more than 500,000 patients from PharMetrics Plus and410,000 from IMS Hospital Charge Master were linked to 130million individuals with mortality data derived from the SSDI.
demonstrating the impact of non-adherence to antiplatelet therapyin acute coronary syndrome
The authorJerrold hill, PhD, Ms is Director, RWE Solutions & HEOR, IMS [email protected]

ACCESSPOINT • VOLUME 5 ISSUE 9 PAGE 61
To be included in the study, patients were required to
• Have an ACS diagnosis and hospitalization inPharMetrics Plus and CDM
• Be enrolled in PharMetrics Plus six months prior to indexhospitalization for ACS with 12 months of follow-up datapost-index or until death within one year post-discharge
• Have data on death status in IMS mortality data • Be prescribed AT at index ACS hospitalization • Be alive more than one month post-discharge
The prerequisite for patients to survive at least one monthwas necessary because the date of death in the databaseis recorded as calendar month and year – not calendarday. As a result, the relationship between period of non-adherence and date of death in the first month wasunknown. Mortality risk was therefore evaluated amongpatients for whom there was at least one month of adherencedata prior to data on death in the subsequent month.
MethodologyPatients with no diagnosis of ACS 180 days prior to hospitaladmission and with confirmed inpatient AT therapy werefollowed until the earlier of 360 days post-discharge or dateof death. Adherence was measured by
• time to first fill post-discharge Four dichotomousvariables measured whether the patient filled aprescription within 30 days, 60 days, 90 days, or withinone year post-discharge. Indicators of early fill datesafter discharge are valuable since risk of mortality andreadmission is highest in the months immediately afterdischarge
• Proportion of days covered (PDC) from days’ supplyon Rx claims This is measured as the percent of daysone year post-discharge or up to the time of the eventof interest (death or readmission) or censure from sample.
• PDC at each month post-discharge for use as theadherence measure in Extended Cox models with timevarying adherence
Unadjusted estimates of study outcomes covered fourcategories of adherence: 0%; 1-39%; 40-79%; ≥80%.Adjusted estimates controlled for patient demographics,hospital characteristics, ACS hospital interventions andcardiovascular risk factors, using logistic regression(mortality, readmission), Cox Proportional Hazards andextended Cox (mortality, readmission) and a GeneralizedLinear Model (costs).
PRINCIPAL STUDY RESULTSThe analysis showed that of the 2,994 patients selected foranalysis, only 50% filled an AT prescription at 30 days post-discharge and only 67% by the end of year one (Figure 1). Patients who filled for AT within 30 days had alower readmission rate (7.4%) compared to those with nofill (14.2%). The greater benefits associated with first AT fillreflected the higher risk of death and readmission in themonths immediately following index discharge.
After adjusting for patient characteristics, high adherenceto AT (>80%) after hospital discharge for ACS was linked to significantly lower mortality (70%), with death increasing markedly as adherence fell below 80% (Figure 2).
FIGURE 1: TIME TO FIRST ANTIPLATELET FILL
Only 50% of patients !lled an ATprescription at 30 days post-discharge
E
Filled Rx for AT within 1 year
67.0%
Filled Rx for AT within 90 days
62.8%
Filled Rx for AT within 60 days
59.9%
Filled Rx for AT within 30 days
50.1%
COXPH Results
0%
1% - <40%
40% - <80%
≥80%
4.1%
4.5%
3.1%
0.7%
Reference group for Cox models is patients not �lling a script for AT post-discharge. P<0.001 for all hazards ratios.
Mortality rate Hazards ratio
1% - <40%
40% - <80%
≥80%
Extended COX Results
Time varying adherence
0.988
0.852
0.289
0.319
(CI: 0.583 - 1.674 )
(CI: 0.512 - 1.418 )
(CI: 0.166 - 0.503)
(CI: 0.187 - 0.544)
Mortality increases markedly as adherencefalls below 80% (unadjusted)
Adjusted results show that the impact of adherenceon mortality is markedly higher when over 80%
FIGURE 2: AdHERENCE ANd MORTALITY ONE YEAR POST-dISCHARGE continued on next page

PAGE 62 IMS HEALTH REAL-WORLD EVIDENCE SOLUTIONS & HEOR
PROJECt FOCUs
Adherence of ≥80% was also associated with substantiallylower readmission rates (Figure 3) and lower totalhealthcare costs at one-year post-hospital discharge.
NEW INSIGHTS FOR IMPROVED OUTCOMES ANDREDUCED COSTSThis study provides new and important evidence-basedinsights into the impact of AT adherence on mortality,readmission risk and costs in ACS. The results revealsignificant opportunities to reduce healthcare costs as wellas improve clinical outcomes in ACS through efforts toincrease AT adherence. In addition, the study demonstratesthe value of linking data across large administrativedatabases. Specifically, the study showed
• The potential to link adherence, healthcare cost/useand mortality data from multiple healthcareadministrative data sources to enhance researchcapabilities, using data sources such as IMS Comprehensive Disease Records for ACS.
• Valuable applications from linking data across multipleadministrative data sources including potentialpreclusion of costly primary data collection; additionof mortality data similar to this study; and linkage oflarge patient populations to extend geographic andprovider coverage, thus increasing confidence togeneralize study results.
ACUTE CORONARY SYNDROME
FIGURE 3: ADHERENCE AND HOSPITAL READMISSION ONE YEARPOST-DISCHARGE (UNADJUSTED)
0%
1%- <40%
40% - <80%
≥80%
P<0.0001 for 30 day and 1-year readmissions
44.8%
39.2%
40.8%
16.9%
Readmission rate
Adh
eren
ce -
PDC
1 World Health Organization. Adherence to long-term therapies: Evidence for action. Geneva: WHO, 20032 Cherry SB, Benner JS, Hussein MA, Tang SS, Nichol MB. The clinical and economic burden of nonadherence with antihypertensive and lipid-loweringtherapy in hypertensive patients. Value in Health, 2009, Jun; 12(4): 489-97
3 Kravitz RL, Hays RD, Sherbourne CD, DiMatteo MR, Rogers WH, Ordway L, Greenfield S. Recall of recommendations and adherence to advice amongpatients with chronic medical conditions. Arch Intern Med, 1993, Aug 23; 153(16): 1869-78
4 Haynes RB, Ackloo E, Sahota N, McDonald HP, Yao X. Interventions for enhancing medication adherence. Cochrane Database Syst Rev 2008;(CD000011)
5 Jneid H, Anderson JL, Scott Wright R, Adams CD, Bridges CR, Casey DE, et al . 2012 ACCF/AHA Focused update of the guidelines for management ofpatients with unstable angina/non-ST elevation myocardial infarction. (Updating the 2007 Guideline and Replacing the 2011 Focused Update): A Reportof the American College of Cardiology Foundation/American Heart Association Task Force on Practice Guidelines. Circulation, 2012; 176: 875-910
6 O'Gara PT, Kushner FG, Ascheim DD, Casey DE, Jr, Chung MK, de Lemos JA, et al. 2013 ACCF/AHA Guideline for the management of ST elevationmyocardial infarction. A report of the American College of Cardiology Foundation/American Heart Association Task Force on Practice Guidelines.Circulation, 2013; 127: 529-555
7 Jarvie JL, Foody JM. Predictors of early discontinuation of dual-antiplatelet therapy: Room for improvement. Circulation, 2010; 22: 946-9488 Valgimigli M, Campo G, Arcozzi C, Malagutti P, Carletti R, Ferrari F, et al. Two-year clinical follow-up after sirolimus-eluting versus bare-metal stentimplantation assisted by systematic glycoprotein IIb/IIIa Inhibitor Infusion in patients with myocardial infarction: Results from the STRATEGY study. J Am Coll Cardiol, 2007; 50: 138-145
9 Ho PM, Peterson ED, Wang L, Magid DJ, Fihn SD, Larsen GC, et al. Incidence of death and acute myocardial infarction associated with stoppingclopidogrel after acute coronary syndrome. JAMA, 2008; 299: 532-539
10 Ho PM, Tsai TT, Wang TY, Shetterly SM, Clarke CL, Go AS, et al. Adverse events after stopping clopidogrel in post–acute coronary syndrome patients:Insights from a large integrated healthcare delivery system. Circ Cardiovasc Qual Outcomes, 2010; 3: 303-308
AcknowledgementThe outstanding scientific merit of this study was recognized with an ISPOR Research Presentation Podium Award followingoral presentation of the findings at the ISPOR 19th Annual International Meeting in Montreal, May 31–June 4, 2014.* Dr Hill gratefully acknowledges the contribution of his co-authors.
*Hill J, Pokras S, Makin C, Schabert VF, Nelson M, Foody J. Non-adherence to antiplatelet therapy after hospitalization for acutecoronary syndrome (ACS) increases readmissions, mortality, healthcare use and costs. Value in Health, 2014; 17: A8

ACCESSPOINT • VOLUME 5 ISSUE 9 PAGE 63
PROJECt FOCUs RWE-BASED DISEASE MANAGEMENT
Insights from RWE can illustrate the value of treatments alongside the full suite of careactivities to inform and enable comprehensive disease management
To operate in a value-oriented healthcaremarketplace, decision makers require newapproaches to disease management that reducecosts while supporting high-quality patientoutcomes. However, with advances in medicalscience and the rising number of novel alternativetherapeutic interventions, disease managementis becoming more complex. New data and toolsare needed to understand how individualtreatment decisions fit into the overallmanagement of a disease to help drive careefficiency in a comprehensive manner. The tremendous growth of real-world evidence is creatingopportunities to transform the decision-makinglandscape. Data-driven insights are increasingly requiredto inform treatment choices and resource allocation forpatient care at a broader level, based on a completepicture of disease management options. Manufacturerscan play a role in supporting patient health at a holisticlevel by expanding their above-the-brand offerings andaligning with external stakeholders seeking to improvepatient outcomes.
RWE-based disease management tools can assist healthcarepayers and providers in their efforts to understand the valueof new treatments alongside the full suite of patient careactivities. For one leading pharmaceutical organization, thedevelopment of such a tool in support of its portfolio haspaved the way for evidence-based discussions withdecision makers on the potential of different diseasemanagement programs to promote efficiencyimprovements and advance patient health.
BUILDING A VALUE PROPOSITION ABOVE THE BRANDThe company was seeking to position itself as a partnerwith several external customers who bear financial risk ofdisease management decisions. To help meet this objective,IMS Health was asked to design and develop a tool for the
company’s customer-facing field team to address questionssurrounding pharmaceutical and healthcare cost, utilizationpatterns and the impact of disease managementalternatives (Figure 1).
MODELING DISEASE MANAGEMENT LEVERS ANDTOTAL HEALTHCARE COSTIMS Health began by collecting cost and utilization data forpatients in three different disease areas from a custom RWE platform that integrates the IMS National PrescriptionAudit (NPA™) database with the IMS PharMetrics Plusdatabase. For each disease, fully-adjudicated pharmacy andmedical claims for patients meeting key inclusion andexclusion criteria were combined to create a longitudinalcohort with a pre-index of 180 days and a follow-up of 360 days. Results of cohort analyses represented total direct medical costs and can be interpreted as the cost ofcare to a fiscal risk-bearing stakeholder in the US, includinghealthcare payers and providers.
The authorsJulie Munakata, Ms is Senior Principal, RWE Solutions & HEORIMS [email protected]
stacey Kowal, Ms is Director, RWE Solutions & HEORIMS Health [email protected]
Cheryl Ferrufino is Senior Consultant, RWE Solutions & HEORIMS Health [email protected]
Beth Wehler, MPh is Consultant, RWE Solutions & HEO IMS [email protected]
Modeling disease management above thebrand with real-world evidence
continued on next page

PAGE 64 IMS HEALTH REAL-WORLD EVIDENCE SOLUTIONS & HEOR
PROJECt FOCUs
Using the output on health service utilization and directmedical costs from the custom RWE platform, IMS Healthdeveloped a total healthcare cost tool to support thecompany’s discussions on direct medical cost trends andthe potential of concepts proven useful in diseasemanagement to change these trends. The concepts were derived from the medical literature to identify ’levers’ that could shift total costs, including patient and physician behaviors, treatments/interventions andhealthcare quality initiatives.
The model compares the current, RWE-based costs ofdisease to the projected costs after applying diseasemanagement levers, with savings estimated by cohortanalyses in the RWE platform. All costs and disease trendsare based on a one-year time horizon. The levers focus on
broad disease concepts as well as above-the-brandtreatment concepts that dovetail with brand-levelpropositions for the company’s product portfolio.
Developed in MS Excel, the tool includes three distinctdisease modules with nationally- and regionally-representative benchmark data presented in a user-friendlyformat. The model enables ad hoc explorations of currentcost trends and the impact of potential actions (levers)using benchmark or custom data inputs. For each disease,model inputs and results can be dynamically viewed acrosschanges in patient age, geographies (national, regional),cost types (allowable medical costs, patient out-of-pocketpayments), care settings (inpatient, outpatient, pharmacy)and pre-defined patient sub-groups (all diagnosed patients,newly diagnosed patients, treated or untreated patients).
FIGURE 1: THE TOTAL HEALTHCARE COST TOOL AddRESSES KEY PAYER ANd PROVIdER QUESTIONS
Change in total healthcare costs
F
Reducing the riskof major bleeds
Relative savings from change in ‘lever’ Current costs
Reducing the riskof ischemic bleeds
Closing thetreatment gap
Improved managementof diabetes co-morbidity
Reducing the likelihoodof readminssion
-20.00% -15.00% -10.00% -5.00% 0.00%
A
FIGURE 2A: HYPOTHETICAL IMPACT OF ALTERNATIVE dISEASE MANAGEMENT ACTIVITIES IN HEART dISEASE - CHANGE IN TOTAL HEALTHCARE COSTS
Questionsanswered by RWE-basedinsights from thetotal healthcarecost tool
Key questionsamong payers &providers facing
a high fiscalburden
• How much am Ispending to providehealthcare and how domy costs compare toothers?
• How do I best allocatelimited resources tomeet population needs?
• How can new treatmentalternatives or treatmentapproaches change costtrends?
• What are the national/regional benchmarks forthe total cost of care across diseases?
• Where are theopportunities to make a meaningful impact on total cost patterns?
• How do treatment options help to shift the cost curve?
Actionableoptions withthe highestimpact on
fiscal savings
RWE-BASED DISEASE MANAGEMENT

ACCESSPOINT • VOLUME 5 ISSUE 9 PAGE 65
Current healthcare costs
C
Future healthcare costs
G
$500m
$450m
$400m
$350m
$300m
$250m
$200m
$150m
$100m
$50m
$0mImproved
managementof diabetes
co-morbidity
R
Absolute savings fromchange in ‘lever’
Closing the
treatmentgap
Reducing the
likelihood ofreadmission
Reducing the risk
of ischemicstroke
Reducingthe risk
of majorbleeds
FIGURE 2b: HYPOTHETICAL IMPACT OF ALTERNATIVE dISEASE MANAGEMENT ACTIVITIES IN HEART dISEASE- CURRENT ANd FUTURE HEALTHCARE COSTS
FIELD-READY TOOL WITH REAL-TIME UPDATESThe field-ready tool presents real-time updates ofprojected impact based on external customer inputs forcosts, population characteristics and potential changes indisease management activities. For example, a payercould compare the likely impact of several new diseasemanagement efforts in heart disease to help informfuture decisions on resource allocation. Figures 2A and 2Bpresent a scenario evaluating the impact of a hypothetical25% improvement from baseline lever values, based onnational benchmark data for one million covered lives.Examples of levers modeled for heart disease are shownin Table 1.
NOVEL DYNAMIC SUPPORT FOR INTERACTIVECUSTOMER DISCUSSIONS Through working with IMS Health, the company hasgained a novel and dynamic tool that leverages RWE tomove beyond the currently published evidence,presenting nationally representative benchmark datawith the ability to quickly view differences across agegroups, geographies, cost types and care settings. Thetool facilitates and informs interactive engagement withexternal customers on several levels. Firstly, byquantifying the magnitude of costs across diseases andhighlighting the value of addressing avoidable outcomesor improving symptom management, it supports thefoundation of the value proposition for the company’sportfolio of products in the disease area. Secondly, byidentifying challenges in disease management at a moremacro level, it helps the field team transition todiscussions around the benefits of the company’s above-the-brand offerings, thereby also serving as a pathway toits suite of resources for improving population health.
TAbLE 1: SELECTEd LEVERS MOdELEd FOR HEARTdISEASE MANAGEMENT
Lever
Closing the treatment gap
Changing the likelihood ofreadmission
Reducing the risk of ischemicstroke
Improving the management ofdiabetes co-morbidity
Reducing the risk of major bleeds
Benefits
Closing the anticoagulant treatment gap intreatment-eligible patients (CHADS2 score of>2) who are not contraindicated fortreatment can improve disease managementand reduce avoidable costs
Improving inpatient care and post-hospitalization treatment can reduce thelikelihood of readmission and associated costs
Effective treatment and disease managementcould potentially reduce the risk of ischemicstroke and stroke-related healthcare costs
Care activities and education efforts can helpreduce the risk of contracting diabetes andreducing any avoidable, excess diabetes-related costs (effective treatment) in patientswith heart disease
Effective disease management withtreatments with a low (or reduced) risk ofavoidable treatment-related bleeding eventscan reduce healthcare costs
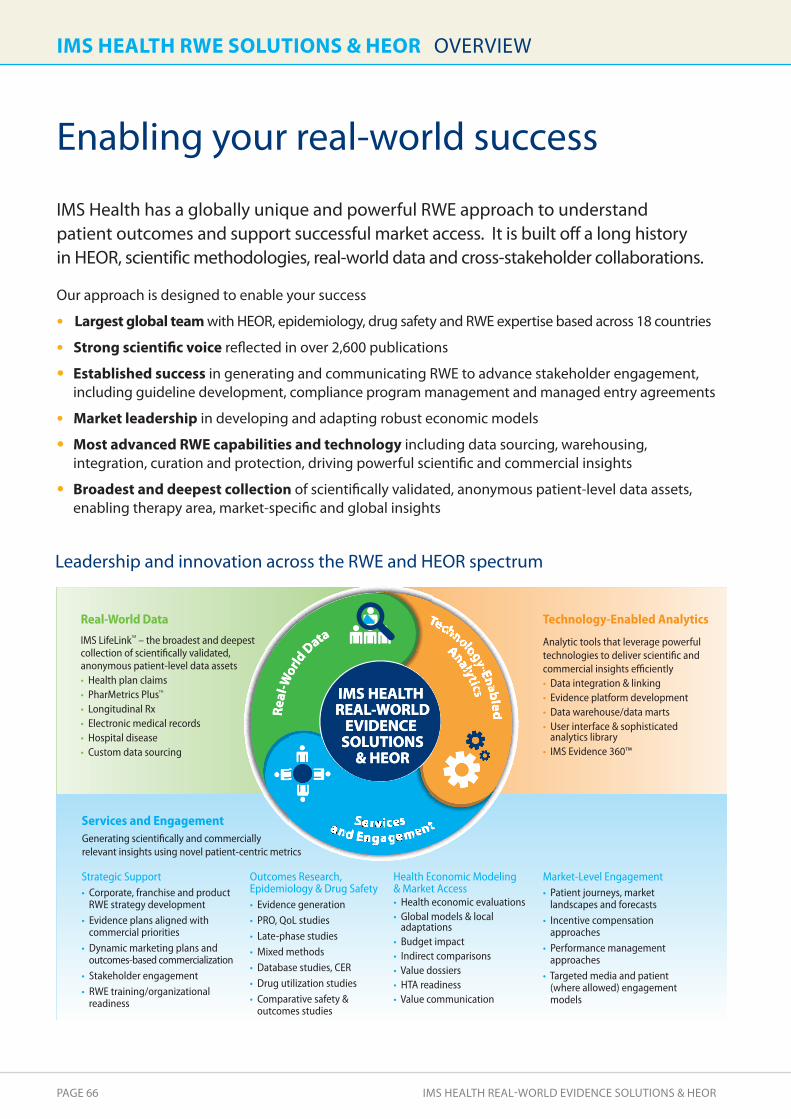
PAGE 66 IMS HEALTH REAL-WORLD EVIDENCE SOLUTIONS & HEOR
IMs hEALth RWE sOLUtIOns & hEOR OVERVIEW
Enabling your real-world success
IMS Health has a globally unique and powerful RWE approach to understand patient outcomes and support successful market access. It is built off a long history in HEOR, scientific methodologies, real-world data and cross-stakeholder collaborations.
Our approach is designed to enable your success
• Largest global team with HEOR, epidemiology, drug safety and RWE expertise based across 18 countries
• strong scientific voice reflected in over 2,600 publications
• Established success in generating and communicating RWE to advance stakeholder engagement,including guideline development, compliance program management and managed entry agreements
• Market leadership in developing and adapting robust economic models
• Most advanced RWE capabilities and technology including data sourcing, warehousing,integration, curation and protection, driving powerful scientific and commercial insights
• Broadest and deepest collection of scientifically validated, anonymous patient-level data assets,enabling therapy area, market-specific and global insights
Leadership and innovation across the RWE and HEOR spectrum
IMS HEALTH REAL-WORLD
EVIDENCE SOLUTIONS
& HEOR
Analytics
Technology-Enabled
Servicesand Engagement
Real
-Wor
ld D
ata
attaaatDDa
o
WWo
-ll-aeR
D
& HEORUTIONSSOL
VIDENCE EORLDW-REAL
TH IMS HEAL LT
dd D
lldrrloorWW
o
Real-World DataIMS LifeLinkTM – the broadest and deepestcollection of scientifically validated,anonymous patient-level data assets • Health plan claims• PharMetrics PlusTM
• Longitudinal Rx• Electronic medical records• Hospital disease• Custom data sourcing
Technology-Enabled Analytics
Analytic tools that leverage powerfultechnologies to deliver scientific andcommercial insights efficiently• data integration & linking• Evidence platform development• data warehouse/data marts• User interface & sophisticated
analytics library• IMS Evidence 360™
Outcomes Research, Epidemiology & drug Safety• Evidence generation• PRO, QoL studies• Late-phase studies• Mixed methods• database studies, CER• drug utilization studies• Comparative safety &
outcomes studies
Strategic Support• Corporate, franchise and product
RWE strategy development • Evidence plans aligned with
commercial priorities• dynamic marketing plans and
outcomes-based commercialization• Stakeholder engagement• RWE training/organizational
readiness
Market-Level Engagement• Patient journeys, market
landscapes and forecasts• Incentive compensation
approaches• Performance management
approaches • Targeted media and patient
(where allowed) engagementmodels
Health Economic Modeling& Market Access• Health economic evaluations• Global models & local
adaptations• budget impact• Indirect comparisons• Value dossiers • HTA readiness• Value communication
Generating scientifically and commercially relevant insights using novel patient-centric metrics
Services and Engagement
ACCESSPOINT • VOLUME 5 ISSUE 9 PAGE 67
IMs hEALth RWE sOLUtIOns & hEOR LOCATIONS
Global scope, local expertise
IMS RWE Solutions & HEOR experts are located in 18 countries worldwide and they have published on projects completed in more than 50 countries on all continents.
Jon Resnick, Vice President and General ManagerOne IMS drive, Plymouth Meeting, PA 19462, USA • Tel: +1 610 834 0800 • [email protected]
Dr. Jacco Keja, Senior Principal210 Pentonville Road, London N1 9JY, UK • Tel: +31 (0) 631 693 939 • [email protected]
Dr. Patrik Sobocki, Senior PrincipalSveavägen 155, SE-113 46 Stockholm, Sweden • Tel: +46 (0) 8 508 999 95 • [email protected]
Your primary contacts
ASIA PACIFICREGIONAL HEADQUARTERS8 Cross Street #21-01/02/03Singapore 048424Tel: +65 6412 7365
EUROPEREGIONAL HEADQUARTERS210 Pentonville RoadLondon N1 9JYUnited KingdomTel: +44 (0) 20 3075 4800
JAPAN Toranomon Towers 4-1-28 ToranomonMinato-ku Tokyo 105-0001 JapanTel: +81 3 5425 9541
LATIN AMERICAREGIONAL HEADQUARTERSInsurgentes Sur # 23755th Floor, Col. TizapanMéxico City d.F. - C.P. 01090 MéxicoTel: +52 55 5089 5205
NORTH AMERICAREGIONAL HEADQUARTERS11 Waterview boulevardParsippany, NJ 07054USATel: +1 973 316 4000
AUSTRALIALevel 5, Charter Grove29-57 Christie StreetSt Leonards, NSW 2065AustraliaTelephone: +61 2 9805 6800
BELGIUMMedialaan 381800 VilvoordebelgiumTel: +32 2 627 3211
CANADA16720 Route TranscanadienneKirkland, Québec H9H 5M3CanadaTel: +1 514 428 6000
CHINA7/F Central TowerChina Overseas PlazaJianguomenwai Avenue, Chaoyang districtbeijing 100001ChinaTel: +86 10 8567 4414
FRANCE29ème EtageTour Ariane5-7 Place de la Pyramide92088 La défense CedexFranceTel: +33 1 41 35 1000
GERMANYErika-Mann-Str. 580636 MünchenGermanyTel: +49 89 457912 6400
ITALYViale Certosa 220155 MilanoItalyTel: +39 02 69 78 6721
SOUTH KOREA9F Handok building735 Yeoksam1-dongKangnam-ku Seoul135-755S. KoreaTel: +82 2 3459 7307
SPAINdr Ferran, 25-2708034 barcelonaSpainTel: +34 93 749 63 00
SWEDENSveavägen 155/Plan911346 StockholmSwedenTel: +46 8 508 842 00
SWITZERLANDTheaterstr. 44051 basleSwitzerlandTel: +41 61 204 5071Tel: +44 (0) 20 3075 4800
TAIWAN18/F 216 Tun Hwa South RoadSec 2Taipei 10669TaiwanROCTel: +886 2 2376 1836
UNITED KINGDOM210 Pentonville RoadLondon N1 9JYUnited KingdomTel: +44 (0) 20 3075 4800
UNITED STATES8280 Willow Oaks Corporate drive, Suite 775Fairfax, Virginia 22031USATel: +1 (703) 992 1025
One IMS drivePlymouth MeetingPA 19462USATel: +1 610 834 0800
For further information, email [email protected] or visit www.imshealth.com/rwe
IMS RWE Solutions & HEOR key office locations

Christopher M. Blanchette, PhD, MsC, MBA, MA • Dr. Christopher Blanchette is a Principal, experienced in leading clinical and health services research programs
and teams in the pharmaceutical industry and consultancy. He is skilled in the use of healthcare databases toassess clinical and economic outcomes, with a particular focus on chronic diseases.
• Prior to joining IMS Health, Chris was Associate Dean for Research & Public Engagement, Director of DataSciences & Business Analytics and an Associate Professor of Public Health Sciences, College of Health &Human Services, University of North Carolina. He was also a Research Health Scientist at the W.G. (Bill)Heffner VA Medical Center, Salisbury, NC.
• Chris is a peer reviewer for the AHRQ and PCORI, editor-in-chief for Drugs in Context, and editorial boardmember for Journal of Medical Economics and Current Medical Research and Opinion. He holds a PhD inPharmaceutical Health Services Research with a concentration in Pharmacoepidemiology and a Master ofScience degree in Epidemiology from the University of Maryland; an MBA in Pharmaceutical & HealthcareMarketing from Saint Joseph’s University; and a Master of Arts degree in Medical Sociology from the Universityof North Carolina.
Karin Berger, MBA• Karin berger is a Principal, with a focus on RWE, PROs and cost-effectiveness evaluation analyses at a national and
international level.• Formerly Managing director of MERG (Medical Economics Research Group), an independent German organization
providing health economics services to the pharmaceutical industry, university hospitals and European Commission, Karin has more than 15 years experience in the health economics arena. She lectures at several universities, has publishedextensively in peer-reviewed journals, and regularly presents at economic and medical conferences around the world.
• Karin graduated as diplom-Kaufmann (German MbA equivalent) from the bayreuth University, Germany, with a specialfocus on health economics.
Yumiko Asukai, MsC• Yumi Asukai is a Principal, specializing in the development of economic models across the product lifecycle and the
interpretation of model outputs for strategic market access and value demonstration. Her expertise in this field spans from early strategic modeling through to global core cost-utility models.
• Yumi’s background includes roles at Fourth Hurdle Consulting and in healthcare and business consulting in San Franciscoand Tokyo, where she focused on comparative studies of health policies between Japan and the US complemented byanalyses of primary data. Yumi has worked extensively in the cardiovascular, oncology and respiratory disease areas andshe is part of a global modeling taskforce for COPd composed of academic and industry members.
• Yumi holds a Master's degree in Health Policy, Planning and Financing from the London School of Hygiene & TropicalMedicine and the London School of Economics, and a bachelor's degree in Political Science from Stanford University.
PAGE 68 IMS HEALTH REAL-WORLD EVIDENCE SOLUTIONS & HEOR
IMs hEALth RWE sOLUtIOns & hEOR EXPERTISE
Expertise in depthThe IMS Health RWE Solutions & HEOR team brings unrivalled experience and specialistknowledge from industry, consulting, government and academia globally, and includesleading scientists in epidemiology, drug safety and risk management. With proven expertisein all key therapy areas, we have a track record of helping clients meet the growing demandsof an increasingly complex pharmaceutical landscape.
Our senior team
Jean-Marc Aubert, M.Eng, MsC• Jean-Marc Aubert is a Senior Principal, supporting healthcare providers, health authorities and payers.• Jean-Marc has extensive pharmaceutical experience ranging from real-world effectiveness and the regulatory process to
sales force, marketing effectiveness and brand performance. His background includes roles as a partner heading businessdevelopment in the healthcare sector at Jalma, as deputy director at CNAMTS (French National Health Insurance Fund forSalaried Workers) and as Chief of Staff of the State Secretary for Health Insurance.
• An expert in the French healthcare system, market access, commercial effectiveness, RWE and HEOR, Jean-Marc holds aMaster’s degree in Engineering and a Master of Science degree, both from École Polytechnique, France; a SpecialistPostgraduate diploma in Statistics and Economics from École Nationale de la Statistique et de l'AdministrationÉconomique (ENSAE); and a Specialist Postgraduate diploma in Economics (dEA) from École des Hautes Études enSciences Sociales (EHESS), France.

Adam Collier, MsC• Adam Collier is a Senior Principal, with responsibility for consulting and data related to IMS Health patient-level data
assets in the UK. He has 18 years commercial experience in the UK and European healthcare industry. • Adam’s background spans pharmaceuticals, consulting and healthcare provision, allowing an unusually broad view of
the challenges inherent across the healthcare arena. He spent nine years at GlaxoSmithKline in roles within customer andtrading strategy, commercial analysis and European marketing, and two years at Accenture, where he also completed asecondment to the Medicines & Healthcare Products Regulatory Agency (MHRA) to work on their patient data assetGPRd (now CPRd). Prior to joining IMS Health, he spent several years with a private healthcare provider.
• Adam holds a Master’s degree in Chemistry from the University of Oxford.
Joe Caputo, BsC• Joe Caputo is Regional Principal, leveraging more than 20 years experience in the pharmaceutical sector to help clients
address the challenges of global reimbursement and market access throughout the drug development program in theAsia-Pacific region. He has led numerous projects involving payer research, value dossiers, local market access modelsand HTA submissions.
• Joe's background includes industry roles in drug development, sales and marketing, and UK and global health outcomes,as well as consulting in health economics. He has wide-ranging knowledge of the drug development process at bothlocal and international level and a unique understanding of evidence gaps in light of reimbursement and market access requirements.
• Joe holds a bachelor's degree in Applied Statistics and Operational Research from Sheffield Hallam University, UK.
Chakkarin Burudpakdee, PhARM. D • dr. Chakkarin burudpakdee is a Principal, with extensive experience in HEOR and strategic consulting, including product
value development and communication, market entry strategies and lifecycle management plans. He has led teams inobservational research, economic modeling, patient and provider surveys, systematic reviews and meta-analyses.
• Prior to joining IMS Health, Chakkarin was VP, Evidence development at MKTXS, where he built and oversaw scientificdirection of the HEOR department and developed relationships with academic institutions around the world thatprovided access to patient-level data for observational research. He began his career as a clinical analyst at ValueMedicsResearch LLC.
• Chakkarin holds a Pharm.d from Philadelphia College of Pharmacy and Science, now University of the Sciences inPhiladelphia, and is a Research Assistant Professor in the College of Health and Human Services, University of NorthCarolina at Charlotte.
nevzeta Bosnic, BA• Nevzeta bosnic is a Principal, focused on managing projects to meet the broad spectrum of client needs in the Canadian
pharmaceutical market.• Formerly director of Economic Consulting at brogan Inc, Nev has led many strategic consulting, policy and data analyses
for pharmaceutical clients, government bodies and academic institutions in Canada. She has extensive knowledge ofpublic and private drug plans across the country and in-depth expertise and experience on the drug reimbursement process.
• Nev holds a bachelor’s degree in business Economics from the School of Economics and business at the University ofSarajevo, bosnia-Herzegovina.
Richard Borrelli, MBA • Richard borrelli is a Principal, leading a team in Canada supporting evidence-based solutions for healthcare stakeholders.
He is recognized for his expertise in leveraging longitudinal patient-level data to better understand and quantify real-world treatment pathways, and heads development of innovative research protocols involving EMR supplemented withpatient and physician feedback.
• Richard has extensive experience leveraging Canadian pharmacy and claims data to evaluate patient utilization ofmedicines. These insights have informed decision making for market access, health economic, sales and marketingdivisions of pharmaceutical companies, as well as payer organizations in the country. Richard also utilizes Canadian EMRto describe indirect and direct burden of illness while evaluating patient real-world outcomes.
• Richard holds an MbA (with distinction) from deGroote School of business, McMaster University, and a bachelor ofCommerce degree from the University of Toronto.
IMs hEALth RWE sOLUtIOns & hEOR EXPERTISE
ACCESSPOINT • VOLUME 5 ISSUE 9 PAGE 69
Ian Bonzani, PhD, BsC • dr. Ian bonzani is a Principal, leveraging his scientific background and consulting experience to help clients create and
implement franchise strategies in the pricing and market access and RWE space. He manages large-scale RWEengagements across stakeholders, functions and geographies.
• With a background that includes roles in the IMS Consulting Group in Europe, Ian has expertise in RWE strategy, franchiseevidence generation strategy, real-world data sourcing, and data marts/technology platforms. He has been involved in awide range of global projects, including RWE planning, large-scale data mart creation and implementation, collaborativeengagement models, and disruptive evidence generation.
• Ian holds a Phd in Regenerative Medicine from Imperial College London (Marshall Scholar) and a bachelor of Sciencedegree in biomedical Engineering from Worcester Polytechnic Institute, Worcester, Massachusetts.
continued on next page

Joshua hiller, MBA• Joshua Hiller is a Senior Principal, supporting the strategic planning and development of IMS Health capabilities for
data sourcing, integration, analytics and studies. He is also currently serving as Alliance director in the company’scollaboration with AstraZeneca for the advancement of RWE.
• during a career that includes roles in market analytics, government and healthcare consulting in both the US and UK,Joshua has led a wide range of projects for clients in the pharmaceutical and biotech sector as well as industryassociations. He has extensive experience in pharmaceutical pricing, contracting, market landscape development,supply management, cross border trade, lifecycle management, competitive defense, generics market drivers andaccount management, with expertise across US and European markets.
• Joshua holds an MbA (beta Gamma Sigma) from Columbia business School, New York, and a bachelor of Sciencedegree in Mathematics from James Madison University, Virginia.
Mitch DeKoven, MhsA• Mitch deKoven is a Principal, leading teams in a variety of projects, including value development plans, retrospective
database studies and observational surveys. • Prior to joining IMS Health, Mitch was an Associate director of Reimbursement and Market Access at ValueMedics
Research LLC. His previous roles include Manager of Reimbursement Services at United bioSource Corporation’s Center forPricing & Reimbursement, Consultant with CHPS Consulting, and Program Manager of the Center for Cancer and blooddisorders Children’s National Medical Center in Washington, dC, a position he held after completing an administrativefellowship with the Johns Hopkins Health System.
• A past president of the board of directors of the Lupus Foundation of America Greater Washington Chapter, Mitch serveson six editorial advisory boards and is a peer reviewer for a number of international healthcare journals. He has alsoauthored several articles. Mitch holds an MHSA from the University of Michigan School of Public Health and a bachelor’sdegree in Spanish from Washington University in St. Louis.
Frank-Ulrich Fricke, PhD, MsC• dr. Frank-Ulrich Fricke is a Principal at IMS Health and Professor for Health Economics, Georg-Simon-Ohm University of
Applied Sciences, Nuremberg in Germany, with a focus on health economic evaluations, market access strategies andhealth policy.
• Formerly a Managing director of Fricke & Pirk GmbH, and previously Head of Health Economics at NovartisPharmaceuticals, Frank-Ulrich has conducted health economic evaluations across a wide range of therapeutic areas,developing a wealth of experience in pricing, health affairs and health policy. As a co-founder of the NIG 21 association, hehas forged strong relationships with health economists, physicians and related researchers working in the Germanhealthcare system.
• Frank-Ulrich holds a Phd in Economics from the bayreuth University, and an MbA equivalent from the Christian-Albrechts-University, Kiel.
Bruce Crawford, MA, MPh, BsC• bruce Crawford is a Senior Principal, with over 20 years consulting experience and expertise in prospective study design,
patient-reported outcome evaluations, cost-effectiveness analyses and reimbursement. • Over the past 13 years, bruce has worked on projects throughout Asia and Japan. He was previously Managing director
Asia and Senior VP at Adelphi, prior to which he was Operations director at Mapi Values. He has worked in managed careand for a major CRO as a health economist, and been involved in research and training with the US FdA, the JapanesePMdA, and the Thailand FdA and National List of Essential drugs committee.
• bruce has written and lectured on pharmacoeconomic and outcomes research methodologies and impacts on studyvalidity, and recently held appointments as Adjunct Project Professor of HTA and Public Policy at Tokyo UniversityGraduate School of Public Policy and as Adjunct Instructor at Kyoto University, School of Medicine and Public Health,dept. of Pharmacoepidemiology. He holds a Master of Arts degree in Economics and a bachelor of Science degree inMathematics and Economics from the University of New Hampshire, and an MPH, specializing in Epidemiology andbiostatistics, from Tufts University School of Medicine.
neil Corner• Neil Corner is a Leader, RWE Solutions, supporting government, academics and the pharmaceutical industry in
understanding and delivering health outcomes data, with a focus on mHealth, integrated patient data and EMRs,including the creation of interactive electronic patient registries.
• Neil has 27 years experience in the pharmaceutical industry in the UK, US, EMEA and Canada, 16 of which were spent atJanssen Pharmaceuticals, including the post of Global Commercial Leader. Prior to joining IMS Health, where his roleshave included international franchise lead for patient and medical data, Neil led Helix Healthcare, a division of Quintiles.
• Neil is the author of several publications on EMR data validation, RWE in the Canadian market and Customer RelationshipManagement. His research and development activities currently focus on the innovative design and construction ofintegrated health data ecosystems to create outcomes in the world of big data.
PAGE 70 IMS HEALTH REAL-WORLD EVIDENCE SOLUTIONS & HEOR
IMs hEALth RWE sOLUtIOns & hEOR EXPERTISE

tim Kelly, MsC, Bs• Tim Kelly is a Vice President, with responsibility for the company’s RWE data assets and data architecture backbone, and
for overseeing platform delivery infrastructure and engagements to ensure at-scale, high-quality data mart deployment. He also leads the client services team supporting data and technology applications.
• Tim’s background includes two decades of life-science experience managing large-scale data warehousing, technology,and analytic applications and engagements. He has worked with many clients in the pharmaceutical and biotech sectors,leveraging deep expertise in information management and modeling, commercial operations and analytics, advancedanalytics, business intelligence, data warehousing and longitudinal analytics.
• Tim holds a Master’s degree in Management Science from Temple University, Philadelphia and a bachelor’s degree inQuantitative business Analysis from Penn State University.
Joseph Kim, PhD, MPh • dr. Joe Kim is a Senior Principal, providing scientific direction in the design and analysis of observational studies across a
wide range of projects. • A trained epidemiologist and statistician, Joe has over 20 years experience in population-based research in the US and Europe.
He was previously Senior director in benefit-Risk Management at Quintiles assisting in the development of pharmacovigilancesystems, risk management plans and benefit-risk evaluation reports, and in the design of post-authorization safety studies.Prior to this, worked in epidemiology at Roche and Amgen.
• For the last 10 years, Joe has taught pharmacoepidemiology and pharmacovigilance at the London School of Hygiene &Tropical Medicine, and more recently on the MPH program at the French School of Public Health in Paris. He holds a Phd inEpidemiology from the University of Minnesota, and an MPH from the Graduate School of Public Health, San diego.
Marla Kessler, MBA• Marla Kessler is a Vice President, heads overall marketing efforts for IMS Health RWE Solutions and is an active leader of
global RWE projects. She helps clients develop commercial strategies for products and portfolios, define evidence plans tosupport them, and coordinate implementation to ensure successful execution.
• Marla has 15 years strategic and business line experience gained through previous leadership roles at McKinsey &Company and Pfizer. during her career at IMS Health she has designed and led RWE boot camps to help clients buildcapabilities in this area across the broader organization, and also developed thought leadership in RWE. This includes co-authoring a major IMS Health benchmarking study exploring variations in RWE supply and demand across thepharmaceutical industry’s top markets.
• Marla holds an MbA from duke University’s Fuqua School of business in durham, North Carolina.
Benjamin hughes, PhD, MBA, MREs, MsC• dr. ben Hughes is a Vice President, leading development of the company’s RWE strategy and offering. He has helped
many clients in the pharmaceutical industry to articulate and implement their RWE strategies through definition ofRWE vision, business cases for RWE investments, capability roadmaps, partnerships, brand evidence reviews, HEORfunction design, RWE training programs and related clinical IT strategies.
• Previously head of the European RWE service line at McKinsey & Co, ben has extensive experience advising healthcarestakeholders on health informatics and RWE-related topics. This includes work on France’s electronic health recordstrategy, EMR adoption strategy for governments across Europe and Asia, data releases to support the UK’stransparency agenda, and the development of payer health analytics and RWE capabilities across countries in Europe.
• A widely published author on health informatics, ben holds a Phd in Medical Informatics from ESAdE barcelona, an MbAfrom HEC Paris, and Masters’ degrees in Research from ESAdE barcelona and in Physics from University College, London.
Kjel A. Johnson, PhARM.D, BCPs, FCCP, FAMCP• dr. Kjel Johnson is a Vice President, focused on developing the company’s oncology data, analytics and informatics
business across key geographies. • Kjel was previously Senior Vice President of Strategy and business development at Magellan Pharmacy Services/ICORE
Healthcare, developing comprehensive specialty management strategies and services for payers. A co-founder of ICORE,he has significant expertise in outsourcing and turn-around strategies, outcomes measures and cost reduction strategiesgained during a career that includes senior roles at deloitte Consulting, UPMC HealthPlan and Coventry Healthcare.
• Principle investigator on more than 40 clinical trials, Kjel has authored over 50 papers and founded Managed CareOncology. He lectures at the University of North Carolina and is a Fellow of the Academy of Managed Care Pharmacistsand the American College of Clinical Pharmacy. Kjel holds degrees from the University of Minnesota and he completeda post-doctoral fellowship at St. Paul Ramsey Medical Center, Minnesota. He is board Certified in Pharmacotherapy.
Jacco Keja, PhD• dr. Jacco Keja is a Senior Principal, drawing on deep expertise in global market access, operational and strategic
pricing, and health economics and outcomes research. • Jacco’s background includes four years as global head of pricing, reimbursement, health outcomes and market access
consulting services at a large clinical research organization and more than 13 years experience in the pharmaceutical industry,including senior-level international and global roles in strategic marketing, pricing and reimbursement and health economics.
• Jacco holds a Phd in biology (Neurophysiology) from Vrije Universiteit in Amsterdam, a Master's degree in Medicalbiology, and an undergraduate degree in biology, both from Utrecht. He is also visiting Professor at the Institute ofHealth Policy & Management at Erasmus University, Rotterdam.
ACCESSPOINT • VOLUME 5 ISSUE 9 PAGE 71
IMs hEALth RWE sOLUtIOns & hEOR EXPERTISE
continued on next page
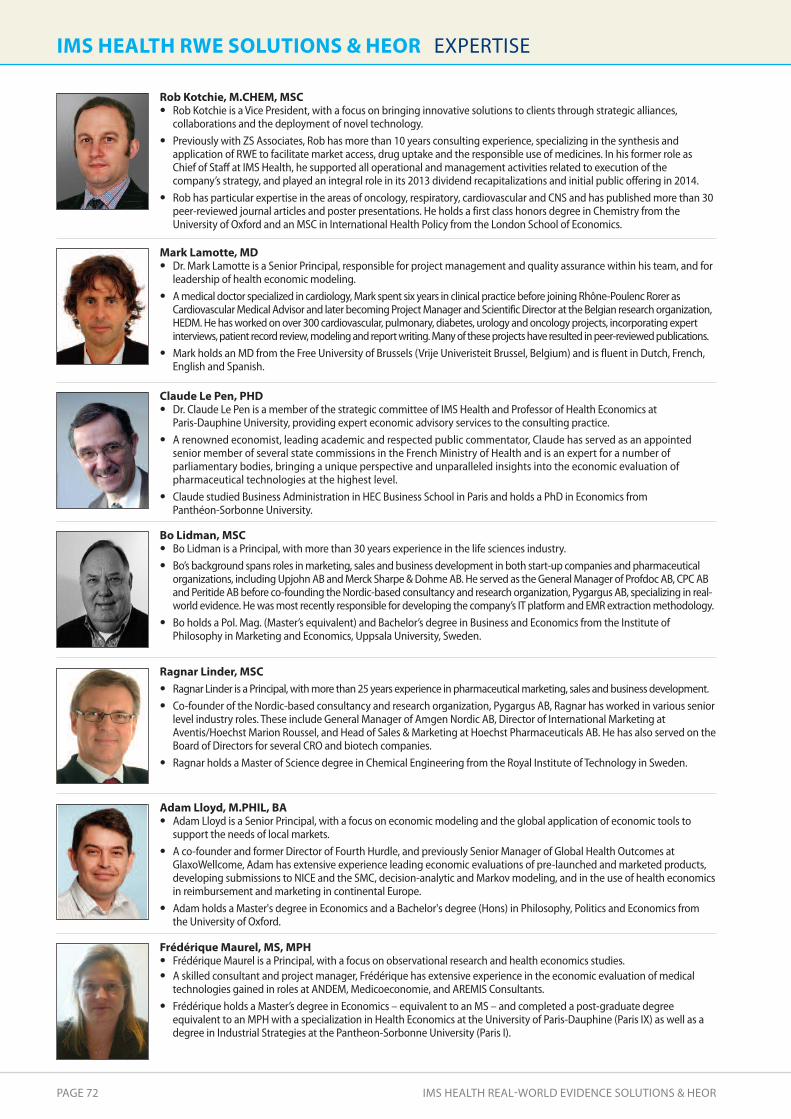
Frédérique Maurel, Ms, MPh• Frédérique Maurel is a Principal, with a focus on observational research and health economics studies.• A skilled consultant and project manager, Frédérique has extensive experience in the economic evaluation of medical
technologies gained in roles at ANdEM, Medicoeconomie, and AREMIS Consultants.• Frédérique holds a Master’s degree in Economics – equivalent to an MS – and completed a post-graduate degree
equivalent to an MPH with a specialization in Health Economics at the University of Paris-dauphine (Paris IX) as well as adegree in Industrial Strategies at the Pantheon-Sorbonne University (Paris I).
Ragnar Linder, MsC• Ragnar Linder is a Principal, with more than 25 years experience in pharmaceutical marketing, sales and business development.• Co-founder of the Nordic-based consultancy and research organization, Pygargus Ab, Ragnar has worked in various senior
level industry roles. These include General Manager of Amgen Nordic Ab, director of International Marketing atAventis/Hoechst Marion Roussel, and Head of Sales & Marketing at Hoechst Pharmaceuticals Ab. He has also served on theboard of directors for several CRO and biotech companies.
• Ragnar holds a Master of Science degree in Chemical Engineering from the Royal Institute of Technology in Sweden.
Adam Lloyd, M.PhIL, BA• Adam Lloyd is a Senior Principal, with a focus on economic modeling and the global application of economic tools to
support the needs of local markets.• A co-founder and former director of Fourth Hurdle, and previously Senior Manager of Global Health Outcomes at
GlaxoWellcome, Adam has extensive experience leading economic evaluations of pre-launched and marketed products,developing submissions to NICE and the SMC, decision-analytic and Markov modeling, and in the use of health economicsin reimbursement and marketing in continental Europe.
• Adam holds a Master's degree in Economics and a bachelor's degree (Hons) in Philosophy, Politics and Economics fromthe University of Oxford.
Bo Lidman, MsC• bo Lidman is a Principal, with more than 30 years experience in the life sciences industry. • bo’s background spans roles in marketing, sales and business development in both start-up companies and pharmaceutical
organizations, including Upjohn Ab and Merck Sharpe & dohme Ab. He served as the General Manager of Profdoc Ab, CPC Aband Peritide Ab before co-founding the Nordic-based consultancy and research organization, Pygargus Ab, specializing in real-world evidence. He was most recently responsible for developing the company’s IT platform and EMR extraction methodology.
• bo holds a Pol. Mag. (Master’s equivalent) and bachelor’s degree in business and Economics from the Institute ofPhilosophy in Marketing and Economics, Uppsala University, Sweden.
Mark Lamotte, MD• dr. Mark Lamotte is a Senior Principal, responsible for project management and quality assurance within his team, and for
leadership of health economic modeling. • A medical doctor specialized in cardiology, Mark spent six years in clinical practice before joining Rhône-Poulenc Rorer as
Cardiovascular Medical Advisor and later becoming Project Manager and Scientific director at the belgian research organization,HEdM. He has worked on over 300 cardiovascular, pulmonary, diabetes, urology and oncology projects, incorporating expertinterviews, patient record review, modeling and report writing. Many of these projects have resulted in peer-reviewed publications.
• Mark holds an Md from the Free University of brussels (Vrije Univeristeit brussel, belgium) and is fluent in dutch, French,English and Spanish.
Claude Le Pen, PhD• dr. Claude Le Pen is a member of the strategic committee of IMS Health and Professor of Health Economics at
Paris-dauphine University, providing expert economic advisory services to the consulting practice.• A renowned economist, leading academic and respected public commentator, Claude has served as an appointed
senior member of several state commissions in the French Ministry of Health and is an expert for a number ofparliamentary bodies, bringing a unique perspective and unparalleled insights into the economic evaluation ofpharmaceutical technologies at the highest level.
• Claude studied business Administration in HEC business School in Paris and holds a Phd in Economics from Panthéon-Sorbonne University.
Rob Kotchie, M.ChEM, MsC• Rob Kotchie is a Vice President, with a focus on bringing innovative solutions to clients through strategic alliances,
collaborations and the deployment of novel technology.• Previously with ZS Associates, Rob has more than 10 years consulting experience, specializing in the synthesis and
application of RWE to facilitate market access, drug uptake and the responsible use of medicines. In his former role asChief of Staff at IMS Health, he supported all operational and management activities related to execution of thecompany’s strategy, and played an integral role in its 2013 dividend recapitalizations and initial public offering in 2014.
• Rob has particular expertise in the areas of oncology, respiratory, cardiovascular and CNS and has published more than 30peer-reviewed journal articles and poster presentations. He holds a first class honors degree in Chemistry from theUniversity of Oxford and an MSC in International Health Policy from the London School of Economics.
PAGE 72 IMS HEALTH REAL-WORLD EVIDENCE SOLUTIONS & HEOR
IMs hEALth RWE sOLUtIOns & hEOR EXPERTISE

ACCESSPOINT • VOLUME 5 ISSUE 9 PAGE 73
Julie Munakata, Ms• Julie Munakata is a Senior Principal, with a focus on global economic modeling, value development planning, and survey
data analysis.• An accomplished researcher and author of more than 25 original articles, Julie has extensive experience in managing
clinical trials, health economic studies and decision analytic modeling work, gained in senior roles at ValueMedicsResearch LLC, the VA Health Economics Resource Center and Stanford Center for Primary Care & Outcomes Research, andWyeth Pharmaceuticals.
• Julie holds an a Master's degree in Health Policy and Management from the Harvard School of Public Health and abachelor’s degree in Psychobiology from the University of California, Los Angeles.
Lisa stockwell Morris, PhD, RPh• dr. Lisa Morris is a Vice President, with global responsibility for LifeLink, the company’s suite of patient-centered insights,
and for developing patient-centered information capabilities within the US, EMEA, and Asia Pacific. • Lisa has many years experience in applying market research tools to answer a wide range of business questions, delivering
customized solutions using LRx, medical and pharmacy claims data, EMRs and other clinically-rich secondary informationsources. Previously Associate director for Health Outcomes Assessment at Wyeth-Ayerst Research, where she incorporatedhealth outcomes and economic information into drug development plans, Lisa has also held roles as a senior manager inthe Outcomes Research group at diversified Pharmaceutical Services (dPS) and United Healthcare Corporation (UHC),managing all aspects of customized health services research projects.
• A registered pharmacist, Lisa holds a doctorate in Pharmacoeconomics with an emphasis on Marketing from theUniversity of South Carolina, where she also received a bachelor’s degree in Pharmacy.
Antonella Porta, MsC • Antonella Porta is a Principal, with a focus on the RWE Solutions Quality Management Program. She brings 15 years of
management experience in quality assurance, compliance and risk management in the pharmaceutical industry andhighly regulated fast-moving consumer goods (FMCG) sector.
• during the course of her career, Antonella has held leadership roles in operational quality, quality systems, remediationprograms, auditing and compliance. She was most recently Quality & Compliance director at Shire, heading the globalLocal Operating Companies’ quality team. Antonella began her management career at Procter & Gamble as Regional Headof External Operation Quality, progressing with roles of increasing responsibility to become latterly Global Head of theMicrobiological Risk Management Program.
• Antonella holds a Master’s degree in Industrial Chemistry from Federico II University in Naples and is currently studying foran MbA at Warwick University, UK.
Joan McCormick, MBA• Joan McCormick is a Principal, leading a team providing strategic advice to companies with new products coming to
market and ongoing consultation on the rules for existing drugs post launch. • Formerly Head of Price Regulation Consulting at brogan Inc, Joan has supported many major pharmaceutical companies
with the preparation of pricing submissions to the Patented Medicine Prices Review board (PMPRb), gaining extensiveinsights into the operation of the Canadian pharmaceutical market.
• Joan holds an MbA from the University of Ottawa, Canada and a bachelor’s degree in Life Sciences from Queen’s Universityin Kingston, Canada.
stefan Plantör, PhD, MBA, MsC• dr. Stefan Plantör is a Principal, with a focus on AMNOG-related projects, including benefit dossiers, as well as reference
price management, health economic evaluations and health policy analyses.• Stefan’s background includes roles as a researcher and five years experience in the pharmaceutical industry. He has also
served as a board member of ProGenerika, the German pharmaceutical association. Over the course of his career, Stefanhas broadened his expertise to include data analyses and decision analytic modeling, authored a number of publicationsin international journals and presented his research at major congresses.
• Stefan holds a Phd in biology from the University of Tübingen, an MbA in International Marketing from the Europeanbusiness School, Reutlingen and an a Master's degree in Microbiology from the Eberhardt-Karls-University (Tübingen).
IMs hEALth RWE sOLUtIOns & hEOR EXPERTISE
Emile schokker, MBA, MsC • Emile Schokker is a Senior Principal, with nearly 20 years of international pharmaceutical and consulting experience
including expertise in launch, brand and portfolio strategy, commercial model redesign and post-merger integration.• Prior to joining IMS Health, Emile was a global senior expert at McKinsey’s global benchmarking service line in belgium,
where he previously served as an associate principal responsible for leading strategic engagements at board and seniormanagement level. He has also worked in leadership roles at Unaxis/Oerlikon in Switzerland, Arthur d. Little in theNetherlands, and Unilever in various international locations.
• Emile holds an MbA from IMd in Lausanne and a Master of Science degree in Applied Physics from the delft University ofTechnology, the Netherlands.
continued on next page

PAGE 74 IMS HEALTH REAL-WORLD EVIDENCE SOLUTIONS & HEOR
IMs hEALth RWE sOLUtIOns & hEOR EXPERTISE
Patrik sobocki, PhD, MsC • dr. Patrik Sobocki is a Senior Principal, with more than 14 years experience in RWE, HEOR and market access. • Patrik’s background spans academia, consulting and the life-science industry within RWE and HEOR, including
international management responsibilities in various senior roles. He was most recently a partner at the Nordic-basedconsultancy and research organization, Pygargus Ab, where he worked with the company’s unique methodology forgenerating population-based RWE based on anonymous patient-level data from EMR and health registers.
• Patrik has conducted numerous health economics projects, outcomes research and epidemiology studies and publishedmore than 40 articles in international peer-reviewed journals. He holds a Phd in Health Economics from the KarolinskaInstitutet, a Master’s degree in Economics and business Administration from the Stockholm School of Economics, and anAssociate Professorship at the Karolinska Institutet.
Daniel simpson, M.BIOChEM• daniel Simpson is a Senior Principal, with responsibility for diabetes portfolios and involvement in the UK CObIC initiative,
focused on moving healthcare commissioning towards patient-based outcome measures. He also takes a leadershipposition on commercial analytics.
• daniel has more than 18 years experience in healthcare and pharmaceutical markets. Over the course of his career he hasworked for all the top 10 pharmaceutical companies and healthcare systems in major markets, delivering insights frompatient-level data to support improved decision making on resource allocation. He previously worked in thehealthcare/pharmaceutical strategy divisions for both Accenture and the Monitor Group.
• Published in a series of conference posters and papers, dan holds a Master’s degree in biochemistry from St Anne’sCollege, University of Oxford.
núria Lara surinach, MD, MsC• dr. Núria Lara is a Senior Principal, with a focus on the design and coordination of local and international observational
and patient-reported outcomes studies.• A former practicing GP and clinical researcher, Núria’s experience spans roles in outcomes research at the Institute of
Public Health in barcelona and in Catalan Health Authorities, and consulting positions within the pharmaceutical andmedical device industries focusing on medical regulatory and pricing affairs, pharmacoeconomics and market access strategies.
• Núria holds an Md (specializing in Family and Community Medicine in barcelona), and a Master’s degree in Public Healthfrom the London School of Hygiene and Tropical Medicine and London School of Economics.
Patrick svarvar, PhD• dr. Patrick Svarvar is a Principal, with more than 15 years pharmaceutical industry experience in HEOR and related
functional areas.• Patrick’s background includes Swedish/Nordic affiliate roles in HEOR and pricing at Pfizer and Schering-Plough as well as
global HEOR roles at AstraZeneca, Pfizer and Merck. Most recently, he was Executive director and Franchise Leader, GlobalHealth Outcomes at Merck. Prior to moving into the industry, he worked for a number of years in health economics andhealth services research at the Swedish Institute for Health Economics (IHE).
• Patrick has been involved in a wide range of HEOR study types across multiple therapeutic categories. He is also experienced inmarket access, health technology assessment, clinical development strategies & processes, strategic pricing & reimbursement,marketing, and payer market research. He holds a Phd in business Administration/Economics from Lund University.
Jon Resnick, MBA• Jon Resnick is a Vice President and General Manager, leading the company’s global RWE & HEOR business, including the
development of RWE strategy, offerings, collaborations and foundational technologies to meet the RWE needs ofhealthcare stakeholders.
• A former Legislative Research Assistant in Washington dC and member of the Professional Health and Social Security stafffor the US Senate Committee on Finance, Jon has 10 years consulting experience at IMS. He was most recently responsiblefor leading the European management consulting team and global HEOR business teams of 300 colleagues, advisingclients on a wide range of strategic, pricing and market access issues.
• Jon holds an MbA from the Kellogg School of Management, Northwestern University, with majors in Management andStrategy, Finance, Health Industry Management, and biotechnology.
Mats Rosenlund, PhD, MPh • dr. Mats Rosenlund is a Principal, with long experience in epidemiology, outcomes research and health economics from
academia, the pharmaceutical industry and consultancy. • Prior to joining IMS Health, Mats was director of Health Economics at OptumInsight and director of Epidemiology and
Health Outcomes at GSK. He was previously a researcher at the Karolinska Institute, a Public Health Official at theKarolinska Hospital, and completed two post-doctoral periods in Italy and Sweden. An affiliated researcher at the Centerfor Pharmacoepidemiology, Clinical Epidemiology Unit, Karolinska Institutet, he has authored more than 20 peer-reviewed articles.
• Mats holds a Phd in Epidemiology, a Master’s degree in Public Health and a bachelor’s degree in Environmental Healthfrom Karolinska Institutet. He has also completed university training in health economics in belgium and the UK.

ACCESSPOINT • VOLUME 5 ISSUE 9 PAGE 75
IMs hEALth RWE sOLUtIOns & hEOR EXPERTISE
Rolin Wade, RPh, Ms• Ron Wade is a Principal and a recognized expert in the applications and limitations of using large retrospective datasets
and late-phase datasets for health economics and outcomes research.• Prior to joining IMS Health, Ron served as a Healthcare Executive and Principal Investigator with Cerner Research and as a
Research director at HealthCore. He also has experience generating evidence to support value messages to managedcare, government payers and public health associations, gained in leadership roles within the pharmaceutical industry.
• A widely published author with expertise in many therapy areas, Ron lectures at colleges of pharmacy and he has hadleadership roles with the American College of Clinical Pharmacy and the Academy of Managed Care Pharmacy. He is alicensed pharmacist and holds a Master's degree in Pharmaceutical Sciences from the University of the Pacific, Californiaand a bachelor of Science degree in Pharmacy.
Massoud toussi, MD, PhD, MsC, MBA • dr. Massoud Toussi is a Principal and Medical director, applying his expertise to assure the quality of outcomes research
and pharmacovigilance. He is also the representative of IMS Health in ENCePP.• Previously head of Global Clinical Research Operations at Cegedim, Massoud has also worked with the French High
Authority for Health (HAS) and various CROs as Project Lead, Scientific Manager and Operations director. His experienceincludes drug safety reporting, natural language processing, database linkage and drug utilization studies.
• Massoud holds an Md from Mashad University in Iran, a Master's degree in Medical Informatics and CommunicationTechnology from Paris VI, a Phd in Medical Informatics from Paris XIII University, and an executive MbA from a jointprogram of Universities of Paris-dauphine and Quebec à Montreal.
Arnaud troubat, PhARM.D, MBA, MhEM• dr. Arnaud Troubat is a Principal, with extensive consulting experience and special expertise in the development of
registration dossiers and market access strategies across a large number of therapeutic areas. • A pharmacist by training, Arnaud began his career at the French pharmaceutical industry association (LEEM). He then
spent a number of years in the pharmaceutical affairs department at ICI, leading regulatory work on registrationsubmissions and reimbursement strategies, before subsequently moving into consulting. Most recently he was director atCarré-Castan Consultants, managing a research team.
• Arnaud holds a doctor of Pharmacy degree and an MbA from IAE Paris and a Master’s degree in Health Economics andManagement from Paris-dauphine University.
Jovan Willford, MBA• Jovan Willford is a Senior Principal, supporting growth strategy, offering development and commercialization of RWE
solutions in the Asia-Pacific region. • Jovan’s background includes more than 10 years strategic advisory experience across payers, providers, life science
organizations and technology companies, including several cross-industry collaborations to advance quality and value ofcare delivery.
• Jovan holds an MbA from the Kellogg School of Management, Northwestern University, with majors in Management andStrategy, Managerial Economics and International business, and an undergraduate degree from the University of Notredame with majors in Marketing and Philosophy.
Ashley Woolmore, D.CLIn PsYCh, MBA• dr. Ashley Woolmore is a Senior Principal, with a focus on developing innovative approaches to help clients reinforce
differentiation through the integration of real-world data into strategic decision making. He has 20 years experience in thelife sciences and healthcare sector.
• Ashley leverages a uniquely diverse background in clinical, healthcare system management and life sciences strategyconsulting in senior advisory roles to support clients across developed and emerging markets on a wide set of healthcaresystem issues. His expertise includes strategy development, healthcare analytics, RWE for strategic insight, populationhealth management applications, and differentiated market access approaches.
• A thought leader with a particular interest in opportunities arising from convergence between the life sciences industryand broader healthcare system, Ashley holds a doctorate in Clinical Psychology from the University of Oxford, an MbA inStrategy from HEC in Paris, and a bachelor of Science (Hons) degree in Natural Sciences and Psychology.
Marc tapies, MBA• Marc Tapies is a Principal, with a focus on market access, health economics and outcomes research.• Prior to his current role at IMS Health, Marc worked within the company’s wholesaler data business in Spain where he was
responsible for wholesaler panel management, design and quality control of data production and the development ofnew offerings based on wholesaler data. As Engagement Manager in the IMS Consulting team in Spain, he led projects inthe areas of commercial effectiveness, market analysis and portfolio management in the pharmaceutical industry. Marcpreviously worked for 5 years in the areas of supply chain management and information technologies.
• Marc holds an MbA from IESE business School and a degree in Industrial Engineering from Universitat Politècnica deCatalunya, Spain.

ABOUt IMs hEALth
IMS Health is a leading global information and technology services company providing clients in the healthcare industrywith comprehensive solutions to measure and improve their performance. By applying sophisticated analytics andproprietary application suites hosted on the IMS One intelligent cloud, the company connects more than 10 petabytes ofcomplex healthcare data on diseases, treatments, costs and outcomes to help its clients run their operations moreefficiently. Drawing on information from 100,000 suppliers, and on insights from more than 45 billion healthcaretransactions processed annually, IMS Health’s approximately 9,500 employees drive results for healthcare clients globally.Customers include pharmaceutical, consumer health and medical device manufacturers and distributors, providers,payers, government agencies, policymakers, researchers and the financial community.Additional information is available at www.imshealth.com
EUROPE210 Pentonville RoadLondon N1 9JYUnited KingdomTel: +44 (0) 20 3075 4800
THE AMERICAS8280 Willow OaksCorporate DriveSuite 775Fairfax, Virginia 22031USATel: +1 (703) 992 1025
ASIA PACIFIC & JAPAN8 Cross Street #21-01/02/03Singapore 048424SingaporeTel: +65 6412 7365
Toranomon Towers 4-1-28 ToranomonMinato-ku Tokyo 105-0001 JapanTel: +81 3 5425 9541
LATIN AMERICAInsurgentes Sur # 2375 5th FloorCol. TizapanMéxico D.F. - C.P. 01090México Tel: +52 55 5089 5205
IMs hEALth REAL-WORLD EVIDEnCE sOLUtIOns AnD hEALth ECOnOMICs & OUtCOMEs REsEARChis based in 18 countries worldwide with regional headquarters in
©2014 IMS Health Incorporated and its affiliates. All rights reserved. Trademarks are registered in the United States and in various other countries.All trademark names are acknowledged as the property of their respective owners.
ACCESSPOINT1014