IMPUTE Example #1 - RTI Internationalsudaansupport.rti.org/sudaan/pdf_files/110Example... · output...
40
Page 1 of 40 IMPUTE Example #1 SUDAAN Statements and Results Illustrated WSHD, CELLMN, LINEAR, and LOGISTIC Imputations IMPBY IMPVAR CLASS PRINT and OUTPUT Input Data Set(s): WIC.SAS7bdat Example Using data from the Women, Infants and Children (WIC) study, impute data for the missing values of baby weight and an indicator of born in the US (yes, no). We use information on the mother’s race and education as imputation class data, although this is intended only for illustration of the general techniques, not as endorsement of such variables as valid predictors in practice. Solution This example shows how SUDAAN performs 4 types of imputation: WSHD multivariate imputation, cell mean imputation, linear and logistic regression imputation. The methods are demonstrated using the WIC data for illustration purposes only. All output in this example was generated using the SAS-callable version of SUDAAN. The following variables from the WIC dataset are of interest in this example: Variable Definition ID Observation number ANALWGT Final Weight RACEMOM Mother’s Race (White, Black, Latina, Other) EDUC Mother’s Education Level (<HS, HS, >HS) BABYWGT Baby Weight (ozs.) BORN_US Indicator for Born in US (1=US born, 2=Foreign born) MOMHOSP Length of Mother’s Hospital Stay (days)
Transcript of IMPUTE Example #1 - RTI Internationalsudaansupport.rti.org/sudaan/pdf_files/110Example... · output...

[Type text] Page 1 of 40
IMPUTE Example #1 SUDAAN Statements and Results Illustrated
WSHD, CELLMN, LINEAR, and LOGISTIC Imputations
IMPBY
IMPVAR
CLASS
PRINT and OUTPUT
Input Data Set(s): WIC.SAS7bdat
Example Using data from the Women, Infants and Children (WIC) study, impute data for the missing values of
baby weight and an indicator of born in the US (yes, no). We use information on the mother’s race
and education as imputation class data, although this is intended only for illustration of the general
techniques, not as endorsement of such variables as valid predictors in practice.
Solution
This example shows how SUDAAN performs 4 types of imputation: WSHD multivariate imputation, cell
mean imputation, linear and logistic regression imputation. The methods are demonstrated using the WIC
data for illustration purposes only. All output in this example was generated using the SAS-callable
version of SUDAAN.
The following variables from the WIC dataset are of interest in this example:
Variable Definition
ID Observation number
ANALWGT Final Weight
RACEMOM Mother’s Race (White, Black, Latina, Other)
EDUC Mother’s Education Level (<HS, HS, >HS)
BABYWGT Baby Weight (ozs.)
BORN_US Indicator for Born in US (1=US born, 2=Foreign born)
MOMHOSP Length of Mother’s Hospital Stay (days)

[Type text] Page 2 of 40
Exhibit 1 contains the SAS code to read in the WIC data and so some preliminary descriptive statistics.
Exhibit 1. SAS-Callable SUDAAN Code to Read In WIC Data LIBNAME in "\\rtints29\sudaan\data\wicwage";
libname out "c:\11winbetatest\examples";
options nocenter linesize=95 pagesize=60;
PROC FORMAT;
value us 1="1=US"
2="2=Foreign";
value resp 0="0=No"
1="1=Yes";
value race 1="1=White"
2="2=Af American"
3="3=Latina"
4="4=Other";
value ed 1="1=<HS"
2="2=HS"
3="3=>HS";
data one; set in.wicwage;
if babywgt=. or born_us=. then respond=0;
else if babywgt ne . and born_us ne . then respond=1;
if born_us=1 then born_us01=1;
else if born_us=2 then born_us01=0;
proc means data=one;
var babywgt;
proc crosstab data=one design=srs;
class born_us / include=missing;
print nsum colper / nsumfmt=f6.0 colperfmt=f7.2 style=nchs;
rformat born_us us.;
rtitle "Born_US Distribution";
PROC RECORDS DATA=one;
subpopx respond=0;
sortby racemom educ;
setenv colwidth=9 labwidth=10 decwidth=0;
PRINT id racemom educ babywgt born_us / babywgtfmt=f9.2;
rtitle "List the Non-Respondents Based on BabyWgt and Born_US";
In Exhibit 1, SUDAAN’s CROSSTAB and RECORDS procedures are used to view the distribution of
the imputation variables prior to performing imputation in SUDAAN. The results of these procedures are
printed below.

[Type text] Page 3 of 40
Exhibit 2. SAS MEANS Results for BABYWGT
The MEANS Procedure
Analysis Variable: BABYWGT Baby Weight (ozs.)
N
N Miss Minimum Mean Maximum
-----------------------------------------------------------
952 1 44.0000000 116.4968487 189.0000000
-----------------------------------------------------------
BABYWGT has one missing value.
Exhibit 3. SUDAAN CROSSTAB Results for BORN_US S U D A A N
Software for the Statistical Analysis of Correlated Data
Copyright Research Triangle Institute June 2012
Release 11.0.0
DESIGN SUMMARY: Variances will be computed using the Taylor Linearization Method,
Assuming a
Simple Random Sample (SRS) Design
Number of observations read : 953
Denominator degrees of freedom : 952
Variance Estimation Method: Taylor Series (SRS)
Born_US Distribution
---------------------------------------
Place of birth -- US
Sample Col
Size Percent
---------------------------------------
Total 953 100.00
. 31 3.25
1=US 753 79.01
2=Foreign 169 17.73
---------------------------------------
BORN_US has 31 missing values.

[Type text] Page 4 of 40
Exhibit 4. SUDAAN RECORDS Output: Listing the 31 Non-Respondents S U D A A N
Software for the Statistical Analysis of Correlated Data
Copyright Research Triangle Institute June 2012
Release 11.0.0
For Subpopulation: RESPOND = 0
List the Non-Respondents Based on BabyWgt and Born_US
------------------------------------------------------------------------
Observation Baby Place of
Number Race- Weight birth --
ID ethnicity Education (ozs.) US
------------------------------------------------------------------------
60 40023 1 1 120.00 .
63 3127 1 1 116.00 .
211 19014 1 1 119.00 .
212 34129 1 1 134.00 .
242 21130 1 1 111.00 .
247 41021 1 1 104.00 .
405 30001 1 1 98.00 .
464 41131 1 2 126.00 .
465 21127 1 2 108.00 .
468 12004 1 2 139.00 .
493 27022 1 2 189.00 .
496 41129 1 2 134.00 .
502 22136 1 2 139.00 .
518 23122 1 2 114.00 .
552 30123 1 2 119.00 .
596 22130 1 2 136.00 .
630 30018 1 2 105.00 .
631 34131 1 2 115.00 .
636 21126 1 3 132.00 .
654 30124 1 3 131.00 .
666 41128 1 3 126.00 .
669 30014 1 3 124.00 .
673 3122 1 3 111.00 .
674 28125 2 2 44.00 .
767 28126 2 2 125.00 .
769 29007 2 2 120.00 .
895 22127 2 3 127.00 .
926 10016 3 2 104.00 .
932 10017 3 3 . .
933 11125 3 3 118.00 .
935 25010 4 3 117.00 .
------------------------------------------------------------------------
Exhibit 4 shows that 31 observations have a missing value for either BABYWGT and/or BORN_US (the
variable RESPOND=0 if either BABYWGT or BORN_US is missing). These values are all considered
nonrespondents. In the next step of this example, PROC IMPUTE is used to impute for these missing
values simultaneously.

[Type text] Page 5 of 40
Exhibit 5. WSHD Imputation proc sort data=one;
by racemom educ;
proc impute data=one seed=66187573 method=wshd icnum;
weight analwgt1;
class born_us;
impby racemom educ;
impvar babywgt born_us;
impname babywgt="babywgt_i" born_us="bornus_i";
impid id;
idvar babywgt born_us;
setenv labwidth=12;
print / donorstat=default means=default percents=all donorsumfmt=f5.0 rsumfmt=f5.0
absdiffmeanfmt=f5.2 reldiffmeanfmt=f5.2 absdiffpctfmt=f5.2
reldiffpctfmt=f6.2;
rformat born_us us.;
output / impute=default filename=out.wshd1 filetype=sas replace;
rtitle "Hot-Deck for Imputing Baby Weight and Born in US";
proc records data=out.wshd1 contents;
setenv labwidth=5 colwidth=9 decwidth=0 colspce=0;
print id racemom educ donorid babywgt born_us babywgt_i bornus_i /
babywgt_ifmt=f8.2 donoridfmt=f5.0 idfmt=f5.0 babywgtfmt=f6.0 born_usfmt=f6.0;
rlabel babywgt_i="Babywgt_i";
rlabel born_us="BornUS";
rlabel bornus_i="BornUS_i";
rtitle "WSHD Imputed Dataset";
proc crosstab data=out.wshd1 filetype=sas design=srs;
class bornus_i born_us / include=missing;
tables born_us*bornus_i;
setenv colwidth=10 labwidth=10;
rlabel bornus_i="BornUS Imputed";
rformat born_us us.;
print nsum / style=nchs;
rtitle "WSHD: See How Born_US is Imputation Revised";
proc freq data=out.wshd1;
tables babywgt*babywgt_i / list missing;
label babywgt_i="Baby Weight Imputed";
title "WSHD: See How BABY_WGT is Imputation Revised";
■ The dataset is first sorted by imputation class variables RACEMOM and EDUC.
■ METHOD=WSHD is used to request the hot-deck imputation (hot-deck is also the default method).
■ Imputation class variables (RACEMOM, EDUC) are listed on the IMPBY statement, in the order in
which the data was sorted.
■ Multivariate imputation will be performed for two variables – BABYWGT and BORN_US. The
output dataset will contain variables BABYWGT_I and BORNUS_I, which will hold the imputed
values for BABYWGT and BORN_US, respectively (see IMPNAME statement).
■ ID is the unique record identifier for this data (see IMPID statement).
■ The PRINT statement is used to obtain additional summary statistics from the DONORSTAT,
MEANS, and PERCENTS groups. The PERCENTS group is requested to obtain imputation statistics

[Type text] Page 6 of 40
within each level of BORN_US. Since BORN_US is to be treated as a categorical outcome variable,
it is included on the CLASS statement.
■ The OUTPUT statement tells IMPUTE to include all the default IMPUTE variables on the output file
WSHD1, in addition to variables on IDVAR statement (BABYWGT and BORN_US).
The summary statistic output from this procedure is presented in Exhibit 6.
Exhibit 6. IMPUTE Results: Default Summary Statistics S U D A A N
Software for the Statistical Analysis of Correlated Data
Copyright Research Triangle Institute June 2012
Release 11.0.0
The Impute Process has completed successfully.
Method: WSHD
Total Records Read from File: 953
Random Number Seed: 66187573
Total Imputation Classes: 13
Total Respondent Records: 922
Total Nonrespondent Records: 31
Total Donor Records Imputation #1: 31
Total Records Imputed: 31
Exhibit 6 provides some useful information about the IMPUTE job. First, the status of the SUDAAN
procedure run (“completed successfully”), the number of valid IMPUTE records (953), and the record of
the user-defined seed are all presented. Following this information are details about the imputation
classes and item respondents and nonrespondents.
The total number of imputation classes is 13, which is the number of cross-classified levels of variables
on the IMPBY statement in which there are respondents, with missing values of IMPBY variables
forming their own levels. There are a total of 922 respondent records, 31 nonrespondent records (missing
value on either BABYWGT or BORN_US), and 31 records imputed.

[Type text] Page 7 of 40
Exhibit 7. IMPUTE Results: DONORSTAT PRINT Group
Hot-Deck for Imputing Baby Weight and Born in US
Imputation #1
Method = WSHD
by: Race-ethnicity, Education.
--------------------------------------------------
Race-
ethnicity
Education Item Item Missing
Resp Non-Resp Donor Data -
Count Count Count Post-imp
--------------------------------------------------
1
Missing 1 0 0 0
1 139 7 7 0
2 229 11 11 0
3 88 5 5 0
2
Missing 0 0 0 0
1 92 0 0 0
2 84 3 3 0
3 45 1 1 0
3
Missing 0 0 0 0
1 104 0 0 0
2 58 1 1 0
3 25 2 2 0
4
Missing 0 0 0 0
1 26 0 0 0
2 13 0 0 0
3 18 1 1 0
--------------------------------------------------
The rows in this table represent the complete cross-classification of the IMBY variables. Only rows with
respondents are considered imputation classes. In this example, there are 13 imputation classes (rows 5,
9, and 13 have no respondents). For each row, the table tells us the number of records considered to be
respondents and nonrespondents, the number of donors contributing to imputation, and the number of
records with missing data post-imputation. So for RACEMOM=1 and EDUC=1, there are 139
respondent records, 7 nonrespondent records (missing either BABYWGT or BORN_US), 7 donors
contributing data, and no records with missing BABYWGT or BORN_US after imputation.

[Type text] Page 8 of 40
Exhibit 8. IMPUTE Results: MEANS PRINT Group Hot-Deck for Imputing Baby Weight and Born in US
Imputation #1
Method = WSHD
Baby Weight (ozs.)
by: Race-ethnicity, Education.
--------------------------------------------------
Race-
ethnicity Rel.
Education Mean - Mean - Abs. Diff.
Pre-imp Post-imp Diff. (%)
--------------------------------------------------
1
Missing 143.00 143.00 0.00 0.00
1 115.08 115.08 0.00 0.00
2 120.11 120.11 0.00 0.00
3 121.60 121.60 0.00 0.00
2
Missing . . . .
1 104.90 104.90 0.00 0.00
2 110.07 110.07 0.00 0.00
3 114.72 114.72 0.00 0.00
3
Missing . . . .
1 121.71 121.71 0.00 0.00
2 114.43 114.43 0.00 0.00
3 129.32 129.28 0.04 -0.03
4
Missing . . . .
1 128.30 128.30 0.00 0.00
2 100.94 100.94 0.00 0.00
3 114.05 114.05 0.00 0.00
--------------------------------------------------
This table tells us the weighted mean of BABYWGT before vs. after hot-deck imputation, within each
imputation class. If no imputation took place within a cell, the weighted mean is the same before vs. after
imputation. For BABYWGT, only one cell had a missing value (RACEMOM=3 and EDUC=3). The
weighted mean did not change very much because there was only one missing value for BABYWGT in
this cell.

[Type text] Page 9 of 40
Exhibit 9. IMPUTE Results: PERCENTS PRINT Group (RACE=1) Hot-Deck for Imputing Baby Weight and Born in US
Imputation #1
Method = WSHD
Place of birth -- US
by: Race-ethnicity, Education, Place of birth -- US.
for: Race-ethnicity = 1.
---------------------------------------------------
Education
Place of Rel.
birth - % Pre- % Post- Abs. Diff.
- US imp imp Diff. (%)
---------------------------------------------------
Missing
1=US 0.00 0.00 0.00 .
2=Foreign 100.00 100.00 0.00 0.00
1
1=US 98.07 98.13 0.06 0.07
2=Foreign 1.93 1.87 0.06 -3.33
2
1=US 98.17 98.27 0.10 0.10
2=Foreign 1.83 1.73 0.10 -5.40
3
1=US 97.34 97.55 0.21 0.21
2=Foreign 2.66 2.45 0.21 -7.82
---------------------------------------------------
This series of tables relates to the BORN_US imputation variable. The PERCENTS print group tells us
the weighted percentages of records in each level of the categorical imputation variable, before vs. after
imputation. For RACEMOM=1 and EDUC=1, the weighted percentage of people in BORN_US=1
changes from 98.07% before hot-deck imputation to 98.13% after hot-deck imputation. The next tables
are for RACEMOM=2, 3, and 4.
[Type text] Page 10 of 40
Exhibit 9. IMPUTE Results: PERCENTS PRINT Group (RACE=2) Hot-Deck for Imputing Baby Weight and Born in US
Imputation #1
Method = WSHD
Place of birth -- US
by: Race-ethnicity, Education, Place of birth -- US.
for: Race-ethnicity = 2.
---------------------------------------------------
Education
Place of Rel.
birth - % Pre- % Post- Abs. Diff.
- US imp imp Diff. (%)
---------------------------------------------------
Missing
1=US . . . .
2=Foreign . . . .
1
1=US 99.51 99.51 0.00 0.00
2=Foreign 0.49 0.49 0.00 0.00
2
1=US 96.85 97.06 0.21 0.22
2=Foreign 3.15 2.94 0.21 -6.65
3
1=US 91.79 92.14 0.35 0.38
2=Foreign 8.21 7.86 0.35 -4.30
---------------------------------------------------
Exhibit 9. IMPUTE Results: PERCENTS PRINT Group (RACE=3) Hot-Deck for Imputing Baby Weight and Born in US
Imputation #1
Method = WSHD
Place of birth -- US
by: Race-ethnicity, Education, Place of birth -- US.
for: Race-ethnicity = 3.
---------------------------------------------------
Education
Place of Rel.
birth - % Pre- % Post- Abs. Diff.
- US imp imp Diff. (%)
---------------------------------------------------
Missing
1=US . . . .
2=Foreign . . . .
1
1=US 22.89 22.89 0.00 0.00
2=Foreign 77.11 77.11 0.00 0.00
2
1=US 27.10 26.38 0.72 -2.65
2=Foreign 72.90 73.62 0.72 0.98
3
1=US 37.78 37.46 0.31 -0.83
2=Foreign 62.22 62.54 0.31 0.51
---------------------------------------------------

[Type text] Page 11 of 40
Exhibit 9. IMPUTE Results: PERCENTS PRINT Group (RACE=4) Hot-Deck for Imputing Baby Weight and Born in US
Imputation #1
Method = WSHD
Place of birth -- US
by: Race-ethnicity, Education, Place of birth -- US.
for: Race-ethnicity = 4.
---------------------------------------------------
Education
Place of Rel.
birth - % Pre- % Post- Abs. Diff.
- US imp imp Diff. (%)
---------------------------------------------------
Missing
1=US . . . .
2=Foreign . . . .
1
1=US 76.64 76.64 0.00 0.00
2=Foreign 23.36 23.36 0.00 0.00
2
1=US 86.08 86.08 0.00 0.00
2=Foreign 13.92 13.92 0.00 0.00
3
1=US 60.04 58.38 1.67 -2.78
2=Foreign 39.96 41.62 1.67 4.17
---------------------------------------------------

[Type text] Page 12 of 40
Exhibit 10. Contents of WSHD Imputed Dataset
S U D A A N
Software for the Statistical Analysis of Correlated Data
Copyright Research Triangle Institute June 2012
Release 11.0.0
SAS Record File OUT.WSHD1
Variables
Name Type Output SAS Description
Format Format
-------------------------------------------------------------
PROCNUM Numeric F2. Procedure Number
DONORID Numeric F8. Donor ID
BABYWGT_I Numeric Babywgt_i
BORNUS_I Numeric US. BornUS_i
BABYWGT Numeric F12. Baby Weight (ozs.)
BORN_US Numeric US. BornUS
RACEMOM Numeric RACE. Race-ethnicity
EDUC Numeric ED. Education
ID Numeric F8. ID
ORIGVAL1 Numeric F12. Original Variable #1
ORIGVAL2 Numeric US. Original Variable #2
ANALWGT1 Numeric F10.2 Analysis
This table shows the contents of the WSHD imputed dataset.
[Type text] Page 13 of 40
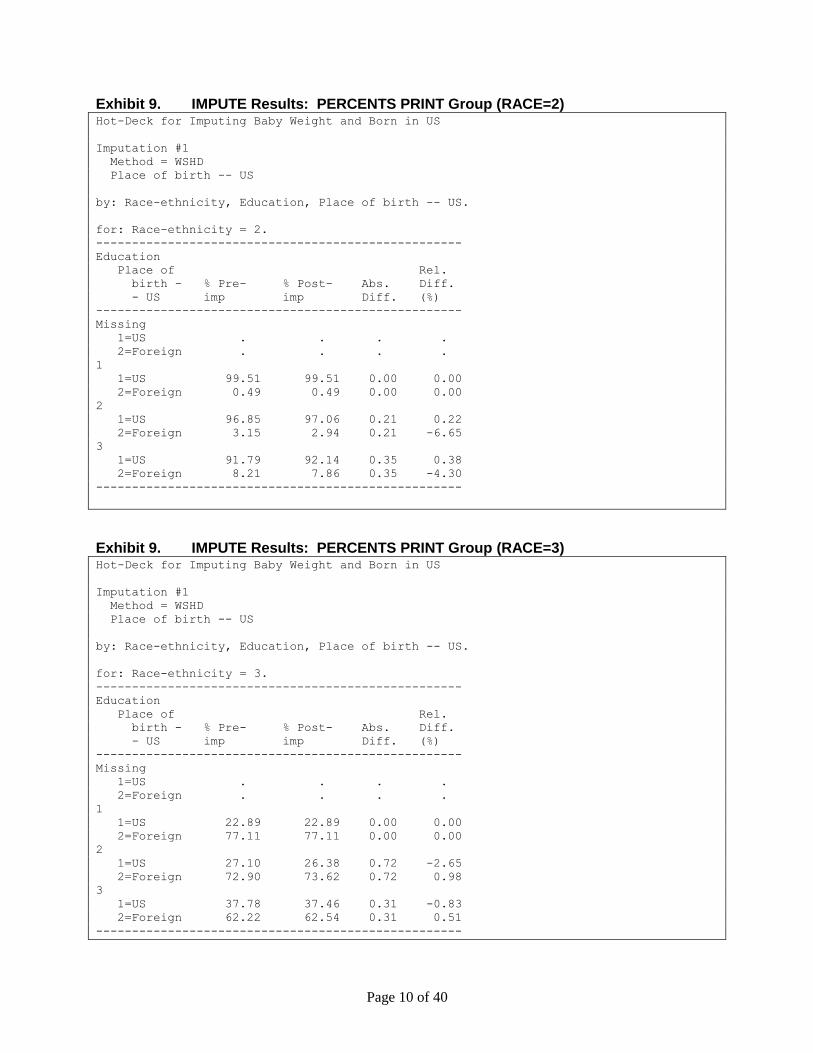
Exhibit 11. First Page of WSHD Imputed Dataset
WSHD Imputed Dataset
by: Observation Number.
---------------------------------------------------------------------------------------------
Observation
Number Baby
Race- Donor Weight Babywgt-
ID ethnicity Education ID (ozs.) BornUS _i BornUS_i
---------------------------------------------------------------------------------------------
1 24004 1 . . 143 2 143.00 2
2 1004 1 1 . 72 1 72.00 1
3 1008 1 1 . 132 1 132.00 1
4 1009 1 1 . 116 1 116.00 1
5 1012 1 1 . 85 1 85.00 1
6 1014 1 1 . 107 1 107.00 1
7 1020 1 1 . 98 1 98.00 1
8 1021 1 1 . 133 1 133.00 1
9 1023 1 1 . 108 1 108.00 1
10 1025 1 1 . 139 1 139.00 1
11 1130 1 1 . 90 1 90.00 1
12 2003 1 1 . 131 1 131.00 1
13 3012 1 1 . 95 1 95.00 1
14 3018 1 1 . 132 2 132.00 2
15 3127 1 1 14015 116 . 116.00 1
16 3128 1 1 . 116 1 116.00 1
17 4001 1 1 . 121 1 121.00 1
18 4005 1 1 . 91 1 91.00 1
19 4008 1 1 . 69 1 69.00 1
20 4017 1 1 . 65 1 65.00 1
21 4022 1 1 . 122 1 122.00 1
22 4128 1 1 . 97 1 97.00 1
23 4130 1 1 . 107 1 107.00 1
24 4134 1 1 . 120 1 120.00 1
25 6012 1 1 . 118 1 118.00 1
26 7122 1 1 . 121 1 121.00 1
27 8001 1 1 . 128 1 128.00 1
28 8020 1 1 . 130 2 130.00 2
29 8025 1 1 . 139 1 139.00 1
30 10129 1 1 . 113 1 113.00 1
31 11004 1 1 . 137 1 137.00 1
32 11009 1 1 . 125 2 125.00 2
33 11126 1 1 . 133 1 133.00 1
34 12010 1 1 . 116 1 116.00 1
35 14001 1 1 . 96 1 96.00 1
36 14003 1 1 . 104 1 104.00 1
37 14005 1 1 . 138 1 138.00 1
38 14008 1 1 . 92 1 92.00 1
39 14013 1 1 . 143 1 143.00 1
40 14015 1 1 . 110 1 110.00 1
---------------------------------------------------------------------------------------------
There are 953 records on the output dataset WSHD1. This is the first page of the output dataset. It is
sorted by RACEMOM and EDUC. DONORID is missing except when imputation takes place. On those
records, DONORID is the ID of the donor record. So for ID=3127 (record 15), BORN_US is missing.
The random donor from the same race and education level is DONORID (ID)=14015 (last line of this
table), who contributed a value of BORN_US=1.

[Type text] Page 14 of 40
Exhibit 11. WSHD Imputed Dataset (continued)
WSHD Imputed Dataset
by: Observation Number.
---------------------------------------------------------------------------------------------
Observation
Number Baby
Race- Donor Weight Babywgt-
ID ethnicity Education ID (ozs.) BornUS _i BornUS_i
---------------------------------------------------------------------------------------------
859 35016 3 2 . 115 1 115.00 1
860 35024 3 2 . 94 2 94.00 2
861 36001 3 2 . 121 1 121.00 1
862 36006 3 2 . 128 1 128.00 1
863 36016 3 2 . 112 1 112.00 1
864 37003 3 2 . 108 1 108.00 1
865 37004 3 2 . 105 1 105.00 1
866 37005 3 2 . 104 2 104.00 2
867 37023 3 2 . 124 1 124.00 1
868 40001 3 2 . 118 1 118.00 1
869 3015 3 3 . 145 1 145.00 1
870 4015 3 3 . 171 1 171.00 1
871 7008 3 3 . 149 2 149.00 2
872 9003 3 3 . 128 2 128.00 2
873 10007 3 3 . 144 2 144.00 2
874 10013 3 3 . 127 2 127.00 2
875 10017 3 3 9003 . . 128.00 2
876 10020 3 3 . 123 2 123.00 2
877 10024 3 3 . 177 1 177.00 1
878 10131 3 3 . 120 1 120.00 1
879 11010 3 3 . 120 2 120.00 2
880 11125 3 3 37010 118 . 118.00 1
881 13129 3 3 . 115 2 115.00 2
882 24008 3 3 . 137 1 137.00 1
883 24013 3 3 . 123 2 123.00 2
884 24130 3 3 . 92 2 92.00 2
885 24135 3 3 . 123 1 123.00 1
886 26022 3 3 . 119 2 119.00 2
887 27013 3 3 . 145 2 145.00 2
888 32018 3 3 . 120 1 120.00 1
889 37010 3 3 . 134 1 134.00 1
890 37016 3 3 . 121 2 121.00 2
891 37018 3 3 . 120 1 120.00 1
892 37019 3 3 . 90 2 90.00 2
893 37021 3 3 . 132 2 132.00 2
894 37024 3 3 . 117 2 117.00 2
895 37128 3 3 . 81 1 81.00 1
896 1024 4 1 . 151 1 151.00 1
897 3019 4 1 . 104 1 104.00 1
---------------------------------------------------------------------------------------------
In this page of the dataset, we are looking at the imputation class cell RACEMOM=3 and EDUC=3:
BABYWGT is missing for ID=10017. It is imputed with DONORID=9003 to
BABYWGT_i=128.
BORN_US is missing for ID=11125, which is imputed with DONORID=37010 to
BORNUS_i=1.

[Type text] Page 15 of 40
Exhibit 12. CROSSTAB Results: BORN_US: Original vs. Imputed
Variance Estimation Method: Taylor Series (SRS)
WSHD: See How Born_US is Imputation Revised
Sample Size
by: Place of birth -- US, BornUS Imputed.
-------------------------------------------------
Place of BornUS Imputed
birth --
US Total 1=US 2=Foreign
-------------------------------------------------
Total 953 781 172
. 31 28 3
1=US 753 753 0
2=Foreign 169 0 169
-------------------------------------------------
WSHD: See How BABY_WGT is Imputation Revised
The 31 missing values for BORN_US were hot-deck imputed to either 1=US born (n=28) or 2=Foreign
Born (n=3).
Exhibit 13. SAS FREQ Results: BABYWGT: Original vs. Imputed
The FREQ Procedure
Cumulative Cumulative
BABYWGT babywgt_i Frequency Percent Frequency Percent
-------------------------------------------------------------------------
. 128 1 0.10 1 0.10
44 44 2 0.21 3 0.31
45 45 1 0.10 4 0.42
48 48 2 0.21 6 0.63
51 51 1 0.10 7 0.73
52 52 3 0.31 10 1.05
55 55 1 0.10 11 1.15
61 61 1 0.10 12 1.26
62 62 1 0.10 13 1.36
63 63 1 0.10 14 1.47
64 64 1 0.10 15 1.57
65 65 2 0.21 17 1.78
67 67 1 0.10 18 1.89
69 69 1 0.10 19 1.99
70 70 1 0.10 20 2.10
71 71 2 0.21 22 2.31
72 72 3 0.31 25 2.62
73 73 2 0.21 27 2.83
75 75 4 0.42 31 3.25
76 76 2 0.21 33 3.46
.
.
.
more records
The single missing value for BABYWGT was imputed to a value of 128. All other values remained as is.
Only the first page of BABYWGT values is included here.

[Type text] Page 16 of 40
Exhibit 14 contains the SAS code to implement the cell mean imputation method.
Exhibit 14. SAS-Callable SUDAAN Code: Cell Mean Imputation
***********************************************
* Cell Mean Imputation
***********************************************;
proc impute data=one method=cellmn icnum;
weight analwgt1;
impby racemom educ;
impvar babywgt;
impname babywgt="babywgt_i";
impid id;
idvar babywgt;
setenv labwidth=12;
print / donorstat=default means=default rsumfmt=f5.0 absdiffmeanfmt=f5.2
reldiffmeanfmt=f5.2;
output / impute=default filename=out.cellmn filetype=sas replace;
rformat racemom race.;
rformat educ ed.;
rtitle "CELLMN Imputation for Baby Wgt";
proc records data=out.cellmn contents;
setenv labwidth=8 colwidth=6 decwidth=0 colspce=0;
print id racemom educ donorid babywgt babywgt_i / babywgt_ifmt=f6.2;
rlabel babywgt_i="babywgt_i";
rtitle "CELLMN Imputed Dataset";
proc freq data=out.cellmn;
tables babywgt*babywgt_i / list missing;
label babywgt_i="Baby Weight Imputed";
title "CELLMN: See How BABY_WGT is Imputation Revised";
■ Recall the dataset has already been sorted by imputation class variables RACEMOM and EDUC.
■ METHOD=CELLMN is used to request the cell mean imputation. We do not need the SEED option
for METHOD=CELLMN.
■ Imputation class variables (RACEMOM, EDUC) are listed on the IMPBY statement, in the order in
which the data was sorted.
■ Imputation will be performed for one variable in this example – BABYWGT (categorical covariates
like BORN_US are not accommodated in cell mean imputation). The output dataset will contain
variable BABYWGT_I, which will hold the imputed values for BABYWGT (see IMPNAME
statement).
■ ID is the unique record identifier for this data (see IMPID statement).
■ The PRINT statement is used to obtain additional summary statistics from the DONORSTAT and
MEANS groups (the PERCENTS group is not available with cell mean imputation because
categorical imputation variables are not accommodated with cell mean imputation).
■ The OUTPUT statement tells IMPUTE to include all the default IMPUTE variables on the output file
CELLMN, in addition to variables on the IDVAR statement (BABYWGT).
The summary statistic output from this procedure is presented in Exhibit 15.

[Type text] Page 17 of 40
Exhibit 15. Cell Mean Imputation: Default Summary Statistics S U D A A N
Software for the Statistical Analysis of Correlated Data
Copyright Research Triangle Institute June 2012
Release 11.0.0
The Impute Process has completed successfully.
Method: CELLMN
Total Records Read from File: 953
Total Imputation Classes: 13
Total Respondent Records: 952
Total Nonrespondent Records: 1
Total Records Imputed: 1
Exhibit 15 provides some useful information about the IMPUTE job. First, the status of the SUDAAN
procedure run (“completed successfully”) and the number of valid IMPUTE records (953) are presented.
Following this information are details about the imputation classes and item respondents and
nonrespondents.
The total number of imputation classes is 13, which is the number of cross-classified levels of variables
on the IMPBY statement in which there are respondents, with missing values of IMPBY variables
forming their own levels. There are a total of 952 respondent records, 1 nonrespondent record (missing
value on BABYWGT), and 1 record imputed.

[Type text] Page 18 of 40
Exhibit 16. Cell Mean Imputation: DONORSTAT Group
CELLMN Imputation for Baby Wgt
Imputation #1
Method = CELLMN
by: Race-ethnicity, Education.
------------------------------------------
Race-
ethnicity
Education Item Item Missing
Resp Non-Resp Data -
Count Count Post-imp
------------------------------------------
1
Missing 1 0 0
1 146 0 0
2 240 0 0
3 93 0 0
2
Missing 0 0 0
1 92 0 0
2 87 0 0
3 46 0 0
3
Missing 0 0 0
1 104 0 0
2 59 0 0
3 26 1 0
4
Missing 0 0 0
1 26 0 0
2 13 0 0
3 19 0 0
------------------------------------------
The rows in this table represent the complete cross-classification of the IMBY variables. Only rows with
respondents are considered imputation classes. In this example, there are 13 imputation classes (rows 5,
9, and 13 have no respondents). For each row, the table tells us the number of records considered to be
respondents and nonrespondents, and the number of records with missing data post-imputation. So for
RACEMOM=3 and EDUC=3, there are 26 respondent records, 1 nonrespondent record (missing
BABYWGT), and no records with missing BABYWGT after imputation.

[Type text] Page 19 of 40
Exhibit 17. Cell Mean Imputation: MEANS Group
CELLMN Imputation for Baby Wgt
Imputation #1
Method = CELLMN
Baby Weight (ozs.)
by: Race-ethnicity, Education.
--------------------------------------------------
Race-
ethnicity Rel.
Education Mean - Mean - Abs. Diff.
Pre-imp Post-imp Diff. (%)
--------------------------------------------------
1
Missing 143.00 143.00 0.00 0.00
1 115.08 115.08 0.00 0.00
2 120.11 120.11 0.00 0.00
3 121.60 121.60 0.00 0.00
2
Missing . . . .
1 104.90 104.90 0.00 0.00
2 110.07 110.07 0.00 0.00
3 114.72 114.72 0.00 0.00
3
Missing . . . .
1 121.71 121.71 0.00 0.00
2 114.43 114.43 0.00 0.00
3 129.32 129.32 0.00 0.00
4
Missing . . . .
1 128.30 128.30 0.00 0.00
2 100.94 100.94 0.00 0.00
3 114.05 114.05 0.00 0.00
--------------------------------------------------
WSHD: See How BABY_WGT is Imputation Revised
This table tells us the weighted mean of BABYWGT before vs. after cell mean imputation, within each
imputation class. If no imputation took place within a cell, the weighted mean is the same before vs. after
imputation. For BABYWGT, only one cell had a missing value (RACEMOM=3 and EDUC=3). With
cell mean imputation, the original weighted mean of the imputation class (based on respondents) is
maintained after imputation.

[Type text] Page 20 of 40
Exhibit 18. Contents of Cell Mean Imputed Dataset
S U D A A N
Software for the Statistical Analysis of Correlated Data
Copyright Research Triangle Institute June 2012
Release 11.0.0
SAS Record File OUT.CELLMN
Variables
Name Type Output SAS Description
Format Format
-------------------------------------------------------------
PROCNUM Numeric F2. Procedure Number
DONORID Numeric F8. Donor ID
BABYWGT_I Numeric babywgt_i
BABYWGT Numeric F12. Baby Weight (ozs.)
RACEMOM Numeric RACE. Race-ethnicity
EDUC Numeric ED. Education
ID Numeric F8. ID
ORIGVAL Numeric F12. Original Variable
ANALWGT1 Numeric F10.2 Analysis
This table shows the contents of the CELLMN imputed dataset.

[Type text] Page 21 of 40
Exhibit 19. First Page of Cell Mean Imputed Dataset
CELLMN Imputed Dataset
by: Observation Number.
------------------------------------------------------------------
Observation
Number Race- Baby
ethni- Educa- Donor Weight babyw-
ID city tion ID (ozs.) gt_i
------------------------------------------------------------------
1 24004 1 . . 143 143.00
2 1004 1 1 . 72 72.00
3 1008 1 1 . 132 132.00
4 1009 1 1 . 116 116.00
5 1012 1 1 . 85 85.00
6 1014 1 1 . 107 107.00
7 1020 1 1 . 98 98.00
8 1021 1 1 . 133 133.00
9 1023 1 1 . 108 108.00
10 1025 1 1 . 139 139.00
11 1130 1 1 . 90 90.00
12 2003 1 1 . 131 131.00
13 3012 1 1 . 95 95.00
14 3018 1 1 . 132 132.00
15 3127 1 1 . 116 116.00
16 3128 1 1 . 116 116.00
17 4001 1 1 . 121 121.00
18 4005 1 1 . 91 91.00
19 4008 1 1 . 69 69.00
20 4017 1 1 . 65 65.00
21 4022 1 1 . 122 122.00
22 4128 1 1 . 97 97.00
23 4130 1 1 . 107 107.00
24 4134 1 1 . 120 120.00
25 6012 1 1 . 118 118.00
26 7122 1 1 . 121 121.00
27 8001 1 1 . 128 128.00
28 8020 1 1 . 130 130.00
29 8025 1 1 . 139 139.00
30 10129 1 1 . 113 113.00
31 11004 1 1 . 137 137.00
32 11009 1 1 . 125 125.00
33 11126 1 1 . 133 133.00
34 12010 1 1 . 116 116.00
35 14001 1 1 . 96 96.00
36 14003 1 1 . 104 104.00
37 14005 1 1 . 138 138.00
38 14008 1 1 . 92 92.00
39 14013 1 1 . 143 143.00
------------------------------------------------------------------
There are 953 records on the output dataset CELLMN. This is the first page of the output dataset. It is
sorted by RACEMOM and EDUC. For METHOD=CELLMN, DONORID is either missing (records
without imputation) or -1 (records with imputation).

[Type text] Page 22 of 40
Exhibit 19. Cell Mean Imputed Dataset (continued) CELLMN Imputed Dataset
by: Observation Number.
------------------------------------------------------------------
Observation
Number Race- Baby
ethni- Educa- Donor Weight babyw-
ID city tion ID (ozs.) gt_i
------------------------------------------------------------------
859 35016 3 2 . 115 115.00
860 35024 3 2 . 94 94.00
861 36001 3 2 . 121 121.00
862 36006 3 2 . 128 128.00
863 36016 3 2 . 112 112.00
864 37003 3 2 . 108 108.00
865 37004 3 2 . 105 105.00
866 37005 3 2 . 104 104.00
867 37023 3 2 . 124 124.00
868 40001 3 2 . 118 118.00
869 3015 3 3 . 145 145.00
870 4015 3 3 . 171 171.00
871 7008 3 3 . 149 149.00
872 9003 3 3 . 128 128.00
873 10007 3 3 . 144 144.00
874 10013 3 3 . 127 127.00
875 10017 3 3 -1 . 129.32
876 10020 3 3 . 123 123.00
877 10024 3 3 . 177 177.00
878 10131 3 3 . 120 120.00
879 11010 3 3 . 120 120.00
880 11125 3 3 . 118 118.00
881 13129 3 3 . 115 115.00
882 24008 3 3 . 137 137.00
883 24013 3 3 . 123 123.00
884 24130 3 3 . 92 92.00
885 24135 3 3 . 123 123.00
886 26022 3 3 . 119 119.00
887 27013 3 3 . 145 145.00
888 32018 3 3 . 120 120.00
889 37010 3 3 . 134 134.00
890 37016 3 3 . 121 121.00
891 37018 3 3 . 120 120.00
892 37019 3 3 . 90 90.00
893 37021 3 3 . 132 132.00
894 37024 3 3 . 117 117.00
895 37128 3 3 . 81 81.00
896 1024 4 1 . 151 151.00
897 3019 4 1 . 104 104.00
------------------------------------------------------------------
In this page of the dataset, we are looking at the imputation class cell RACEMOM=3 and EDUC=3.
BABYWGT is missing for ID=10017. It is imputed with the weighted mean of this cell, which is 129.32
(recall that the hot deck imputed value was 128.00 using the seed value specified in the procedure call).

[Type text] Page 23 of 40
Exhibit 20. SAS FREQ Results: BABYWGT: Original vs. Imputed
The FREQ procedure
BABYWGT babywgt_i Frequency Percent Frequency Percent
--------------------------------------------------------------------------
. 129.3169082 1 0.10 1 0.10
44 44 2 0.21 3 0.31
45 45 1 0.10 4 0.42
48 48 2 0.21 6 0.63
51 51 1 0.10 7 0.73
52 52 3 0.31 10 1.05
55 55 1 0.10 11 1.15
61 61 1 0.10 12 1.26
62 62 1 0.10 13 1.36
63 63 1 0.10 14 1.47
64 64 1 0.10 15 1.57
65 65 2 0.21 17 1.78
67 67 1 0.10 18 1.89
69 69 1 0.10 19 1.99
70 70 1 0.10 20 2.10
71 71 2 0.21 22 2.31
72 72 3 0.31 25 2.62
73 73 2 0.21 27 2.83
75 75 4 0.42 31 3.25
76 76 2 0.21 33 3.46
77 77 3 0.31 36 3.78
78 78 1 0.10 37 3.88
79 79 2 0.21 39 4.09
80 80 4 0.42 43 4.51
81 81 3 0.31 46 4.83
82 82 2 0.21 48 5.04
83 83 4 0.42 52 5.46
84 84 2 0.21 54 5.67
85 85 8 0.84 62 6.51
86 86 3 0.31 65 6.82
87 87 5 0.52 70 7.35
88 88 6 0.63 76 7.97
89 89 2 0.21 78 8.18
90 90 7 0.73 85 8.92
.
.
.
More data
The single missing value for BABYWGT was imputed to a value of 129.32, the weighted mean of the
imputation cell. All other values remained as is. Only the first page of BABYWGT values is included
here.
[Type text] Page 24 of 40
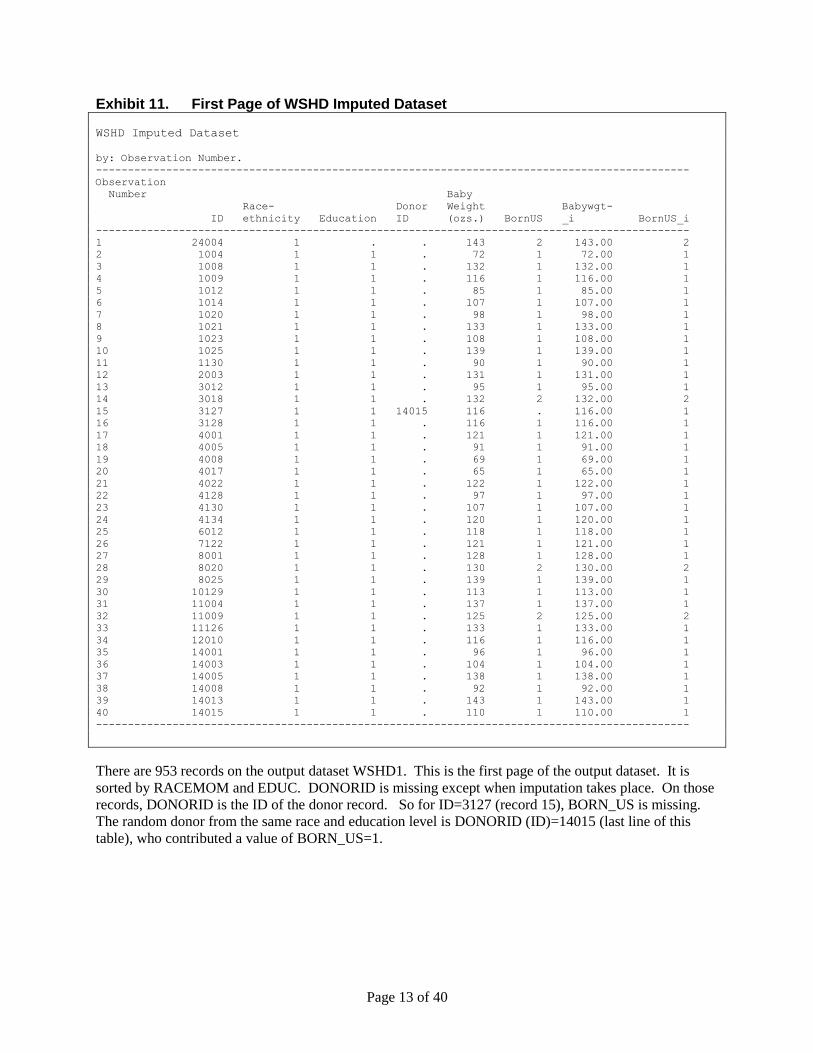
Exhibit 21 contains the SAS code to implement the linear regression imputation method. Note an
interesting equality between the cell mean and linear regression methods: they yield the same results if
we fit a fully saturated linear interaction model based on the categorical imputation class variables
defined in the cell mean method. We demonstrate this equality here.
Exhibit 21. SAS-Callable SUDAAN Code: Linear Regression Imputation
*********************************************************
* Linear Regression Imputation
*********************************************************;
proc impute data=one method=linear;
weight analwgt1;
class racemom educ;
impby _one_;
impmodel racemom educ racemom*educ;
impvar babywgt;
impname babywgt="babywgt_i";
impid id;
idvar babywgt racemom educ;
setenv labwidth=12;
print / donorstat=default means=default rsumfmt=f5.0 absdiffmeanfmt=f5.2
reldiffmeanfmt=f5.2;
output / impute=default filename=out.linear filetype=sas replace;
rtitle "Linear Regression for Imputing Baby Weight";
proc records data=out.linear contents;
setenv labwidth=8 colwidth=9 decwidth=2 colspce=0;
print id racemom educ donorid babywgt babywgt_i / idfmt=f6.0;
rlabel babywgt_i="BabyWgt_i";
rtitle "Linear Regression Imputed Dataset";
proc freq data=out.linear;
tables babywgt*babywgt_i / list missing;
label babywgt_i="Baby Weight Imputed";
title "Linear Regression: See How BABY_WGT is Imputation Revised";
■ Recall the dataset has already been sorted by imputation class variables RACEMOM and EDUC.
■ METHOD=LINEAR is used to request linear regression imputation. We do not need the SEED
option for METHOD=LINEAR.
■ To get the same imputation results as cell mean imputation, we fit the imputation class variables
RACEMOM and EDUC as categorical main effects in the model and we include the interaction term.
RACEMOM and EDUC are listed on the IMPMODEL and CLASS statements.
■ The IMPBY statement includes the SUDAAN variable _ONE_ to indicate that the whole sample
represents a single imputation class.
■ Imputation will be performed for BABYWGT. The output dataset will contain variable
BABYWGT_I, which will hold the imputed values for BABYWGT (see IMPNAME statement).
■ ID is the unique record identifier for this data (see IMPID statement).
■ The PRINT statement is used to obtain additional summary statistics from the DONORSTAT and
MEANS groups (the PERCENTS group is not available with linear regression imputation because
categorical imputation variables are not accommodated with linear regression imputation).

[Type text] Page 25 of 40
■ The OUTPUT statement tells IMPUTE to include all the default IMPUTE variables on the output file
LINEAR, in addition to variables on the IDVAR statement (BABYWGT, RACEMOM, EDUC). The
IMPMODEL variables are not included by default on the output dataset.
The summary statistic output from this procedure is presented in Exhibit 22.
Exhibit 22. Linear Regression Imputation: Default Summary Statistics
S U D A A N
Software for the Statistical Analysis of Correlated Data
Copyright Research Triangle Institute June 2012
Release 11.0.0
The Impute Process has completed successfully.
Method: LINEAR
Total Records Read from File: 953
Total Respondent Records: 952
Total Nonrespondent Records: 1
Total Records Imputed: 1
Exhibit 22 indicates the linear regression imputation procedure “completed successfully” and the number
of valid IMPUTE records=953. There are 952 respondent records, 1 nonrespondent record (missing value
on BABYWGT), and 1 record imputed.

[Type text] Page 26 of 40
Exhibit 23. Linear Regression Imputation: DONORSTAT Group
Linear Regression for Imputing Baby Weight
Imputation #1
Method = LINEAR
by: SUDAAN Reserved Variable One.
------------------------------------------
SUDAAN
Reserved
Variable Item Item Missing
One Resp Non-Resp Data -
Count Count Post-imp
------------------------------------------
1 952 1 0
------------------------------------------
There are 952 respondent records, 1 nonrespondent record (missing BABYWGT), and no records with
missing BABYWGT after imputation.

[Type text] Page 27 of 40
Exhibit 24. Linear Regression Imputation: MEANS Group
Linear Regression for Imputing Baby Weight
Imputation #1
Method = LINEAR
Baby Weight (ozs.)
by: SUDAAN Reserved Variable One.
--------------------------------------------------
SUDAAN
Reserved Rel.
Variable Mean - Mean - Abs. Diff.
One Pre-imp Post-imp Diff. (%)
--------------------------------------------------
1 116.62 116.63 0.01 0.01
--------------------------------------------------
This table tells us the weighted mean of BABYWGT before vs. after cell mean imputation. For
BABYWGT, only one cell had a missing value (RACEMOM=3 and EDUC=3). The weighted mean
went from 116.62 pre-imputation to 116.63 post-imputation.

[Type text] Page 28 of 40
Exhibit 25. Contents of Linear Regression Imputed Dataset
S U D A A N
Software for the Statistical Analysis of Correlated Data
Copyright Research Triangle Institute June 2012
Release 11.0.0
SAS Record File OUT.LINEAR
Variables
Name Type Output Description
Format
------------------------------------------------
PROCNUM Numeric F2. Procedure Number
DONORID Numeric F8. Donor ID
BABYWGT_I Numeric BabyWgt_i
BABYWGT Numeric F12. Baby Weight (ozs.)
RACEMOM Numeric F12. Race-ethnicity
EDUC Numeric F12. Education
_ONE_ Numeric F1. SUDAAN Reserved Variable One
ID Numeric F8. ID
ORIGVAL Numeric F12. Original Variable
ANALWGT1 Numeric F10.2 Analysis
This table shows the contents of the LINEAR imputed dataset.

[Type text] Page 29 of 40
Exhibit 26. First Page of Linear Imputed Dataset
Linear Regression Imputed Dataset
by: Observation Number.
---------------------------------------------------------------------------------
Observation Baby
Number Race- Weight
ID ethnicity Education Donor ID (ozs.) BabyWgt_i
---------------------------------------------------------------------------------
1 24004 1.00 . . 143.00 143.00
2 1004 1.00 1.00 . 72.00 72.00
3 1008 1.00 1.00 . 132.00 132.00
4 1009 1.00 1.00 . 116.00 116.00
5 1012 1.00 1.00 . 85.00 85.00
6 1014 1.00 1.00 . 107.00 107.00
7 1020 1.00 1.00 . 98.00 98.00
8 1021 1.00 1.00 . 133.00 133.00
9 1023 1.00 1.00 . 108.00 108.00
10 1025 1.00 1.00 . 139.00 139.00
11 1130 1.00 1.00 . 90.00 90.00
12 2003 1.00 1.00 . 131.00 131.00
13 3012 1.00 1.00 . 95.00 95.00
14 3018 1.00 1.00 . 132.00 132.00
15 3127 1.00 1.00 . 116.00 116.00
16 3128 1.00 1.00 . 116.00 116.00
17 4001 1.00 1.00 . 121.00 121.00
18 4005 1.00 1.00 . 91.00 91.00
19 4008 1.00 1.00 . 69.00 69.00
20 4017 1.00 1.00 . 65.00 65.00
21 4022 1.00 1.00 . 122.00 122.00
22 4128 1.00 1.00 . 97.00 97.00
23 4130 1.00 1.00 . 107.00 107.00
24 4134 1.00 1.00 . 120.00 120.00
25 6012 1.00 1.00 . 118.00 118.00
26 7122 1.00 1.00 . 121.00 121.00
27 8001 1.00 1.00 . 128.00 128.00
28 8020 1.00 1.00 . 130.00 130.00
29 8025 1.00 1.00 . 139.00 139.00
30 10129 1.00 1.00 . 113.00 113.00
31 11004 1.00 1.00 . 137.00 137.00
32 11009 1.00 1.00 . 125.00 125.00
33 11126 1.00 1.00 . 133.00 133.00
34 12010 1.00 1.00 . 116.00 116.00
35 14001 1.00 1.00 . 96.00 96.00
36 14003 1.00 1.00 . 104.00 104.00
37 14005 1.00 1.00 . 138.00 138.00
38 14008 1.00 1.00 . 92.00 92.00
39 14013 1.00 1.00 . 143.00 143.00
40 14015 1.00 1.00 . 110.00 110.00
41 15008 1.00 1.00 . 123.00 123.00
42 16010 1.00 1.00 . 98.00 98.00
43 16015 1.00 1.00 . 112.00 112.00
---------------------------------------------------------------------------------
There are 953 records on the output dataset LINEAR. This is the first page of the output dataset. It is
sorted by RACEMOM and EDUC. For METHOD=LINEAR, DONORID is either missing (records
without imputation) or -2 (records with imputation).

[Type text] Page 30 of 40
Exhibit 26. Linear Imputed Dataset (continued) Linear Regression Imputed Dataset
by: Observation Number.
---------------------------------------------------------------------------------
Observation Baby
Number Race- Weight
ID ethnicity Education Donor ID (ozs.) BabyWgt_i
---------------------------------------------------------------------------------
861 36001 3.00 2.00 . 121.00 121.00
862 36006 3.00 2.00 . 128.00 128.00
863 36016 3.00 2.00 . 112.00 112.00
864 37003 3.00 2.00 . 108.00 108.00
865 37004 3.00 2.00 . 105.00 105.00
866 37005 3.00 2.00 . 104.00 104.00
867 37023 3.00 2.00 . 124.00 124.00
868 40001 3.00 2.00 . 118.00 118.00
869 3015 3.00 3.00 . 145.00 145.00
870 4015 3.00 3.00 . 171.00 171.00
871 7008 3.00 3.00 . 149.00 149.00
872 9003 3.00 3.00 . 128.00 128.00
873 10007 3.00 3.00 . 144.00 144.00
874 10013 3.00 3.00 . 127.00 127.00
875 10017 3.00 3.00 -2.00 . 129.32
876 10020 3.00 3.00 . 123.00 123.00
877 10024 3.00 3.00 . 177.00 177.00
878 10131 3.00 3.00 . 120.00 120.00
879 11010 3.00 3.00 . 120.00 120.00
880 11125 3.00 3.00 . 118.00 118.00
881 13129 3.00 3.00 . 115.00 115.00
882 24008 3.00 3.00 . 137.00 137.00
883 24013 3.00 3.00 . 123.00 123.00
884 24130 3.00 3.00 . 92.00 92.00
885 24135 3.00 3.00 . 123.00 123.00
886 26022 3.00 3.00 . 119.00 119.00
887 27013 3.00 3.00 . 145.00 145.00
888 32018 3.00 3.00 . 120.00 120.00
889 37010 3.00 3.00 . 134.00 134.00
890 37016 3.00 3.00 . 121.00 121.00
891 37018 3.00 3.00 . 120.00 120.00
892 37019 3.00 3.00 . 90.00 90.00
893 37021 3.00 3.00 . 132.00 132.00
894 37024 3.00 3.00 . 117.00 117.00
895 37128 3.00 3.00 . 81.00 81.00
896 1024 4.00 1.00 . 151.00 151.00
897 3019 4.00 1.00 . 104.00 104.00
898 4009 4.00 1.00 . 141.00 141.00
899 5003 4.00 1.00 . 124.00 124.00
900 5008 4.00 1.00 . 124.00 124.00
901 5009 4.00 1.00 . 174.00 174.00
902 5016 4.00 1.00 . 146.00 146.00
903 5019 4.00 1.00 . 121.00 121.00
---------------------------------------------------------------------------------
In this page of the dataset, we are looking at the imputation class cell RACEMOM=3 and EDUC=3.
BABYWGT is missing for ID=10017. It is imputed with the weighted mean of this cell, which is 129.32
(recall that the cell mean imputed value was also 129.32, as expected, and that the hot deck imputed value
was 128.00 using the seed value specified in the procedure call).

[Type text] Page 31 of 40
Exhibit 27. SAS FREQ Results: BABYWGT: Original vs. Imputed
The FREQ Procedure
Cumulative Cumulative
BABYWGT babywgt_i Frequency Percent Frequency Percent
ƒƒƒƒƒƒƒƒƒƒƒƒƒƒƒƒƒƒƒƒƒƒƒƒƒƒƒƒƒƒƒƒƒƒƒƒƒƒƒƒƒƒƒƒƒƒƒƒƒƒƒƒƒƒƒƒƒƒƒƒƒƒƒƒƒƒƒƒƒƒƒƒƒƒƒ
. 129.3169082 1 0.10 1 0.10
44 44 2 0.21 3 0.31
45 45 1 0.10 4 0.42
48 48 2 0.21 6 0.63
51 51 1 0.10 7 0.73
52 52 3 0.31 10 1.05
55 55 1 0.10 11 1.15
61 61 1 0.10 12 1.26
62 62 1 0.10 13 1.36
63 63 1 0.10 14 1.47
64 64 1 0.10 15 1.57
65 65 2 0.21 17 1.78
67 67 1 0.10 18 1.89
69 69 1 0.10 19 1.99
70 70 1 0.10 20 2.10
71 71 2 0.21 22 2.31
72 72 3 0.31 25 2.62
73 73 2 0.21 27 2.83
75 75 4 0.42 31 3.25
76 76 2 0.21 33 3.46
77 77 3 0.31 36 3.78
78 78 1 0.10 37 3.88
79 79 2 0.21 39 4.09
80 80 4 0.42 43 4.51
81 81 3 0.31 46 4.83
82 82 2 0.21 48 5.04
83 83 4 0.42 52 5.46
84 84 2 0.21 54 5.67
85 85 8 0.84 62 6.51
86 86 3 0.31 65 6.82
87 87 5 0.52 70 7.35
88 88 6 0.63 76 7.97
89 89 2 0.21 78 8.18
90 90 7 0.73 85 8.92
.
.
.
More data
The single missing value for BABYWGT was imputed to a value of 129.32, which is the weighted mean
of the cell defined as RACEMOM=3 and EDUC=3 (see the cell mean results). All other values remained
as is. Only the first page of BABYWGT values is included here.

[Type text] Page 32 of 40
Exhibit 28 contains the SAS code to implement the logistic regression imputation method for the binary
0/1 variable BORN_US01.
Exhibit 28. SAS-Callable SUDAAN Code: Logistic Regression Imputation ********************************************************
* LOGISTIC Imputation
********************************************************;
proc crosstab data=one design=srs;
class born_us01 racemom educ / include=missing;
print nsum colper / nsumfmt=f6.0 colperfmt=f7.2 style=nchs;
rformat born_us01 usa.;
rtitle "Distribution of Model Variables";
PROC RECORDS DATA=one;
subpopx born_us01=.;
setenv colwidth=9 labwidth=10 decwidth=0;
PRINT id racemom educ born_us01;
sortby racemom educ;
rtitle "Born in US Non-Respondents via SUBPOPX";
proc impute data=one method=logistic seed=66187573 ;
weight analwgt1;
class racemom educ;
impby _one_;
impmodel racemom educ racemom*educ;
impvar born_us01;
impname born_us01="bornus01_i";
impid id;
idvar born_us01 racemom educ;
setenv labwidth=12;
print / donorstat=default rsumfmt=f5.0;
setenv labwidth=12 colwidth=7 decwidth=4;
print / means=default;
output / impute=default filename=out.logistic filetype=sas replace;
rformat born_us01 usa.;
rtitle "Logistic Regression for Imputing Born in US";
proc crosstab data=out.logistic filetype=sas design=srs;
class born_us01 bornus01_i / include=missing;
tables born_us01*bornus01_i;
setenv colwidth=10 labwidth=10;
rlabel bornus01_i="BornUS Imputed";
rformat born_us01 usa.;
print nsum / style=nchs;
rtitle "LOGISTIC: See How Born_US is Imputation Revised";
proc records data=out.logistic contents;
setenv labwidth=8 colwidth=9 decwidth=0 colspce=0;
print id racemom educ donorid born_us01 bornus01_i / idfmt=f6.0;
rlabel bornus01_i="bornus_i";
rtitle "LOGISTIC Imputed Dataset";
■ Recall the dataset has already been sorted by imputation class variables RACEMOM and EDUC.
■ METHOD=LOGISTIC is used to request logistic regression imputation. We use the SEED option for
METHOD=LOGISTIC.

[Type text] Page 33 of 40
■ We fit the imputation class variables RACEMOM and EDUC as categorical main effects in the model
and we include the interaction term. RACEMOM and EDUC are listed on the IMPMODEL and
CLASS statements.
■ The IMPBY statement includes the SUDAAN variable _ONE_ to indicate that the whole sample
represents a single imputation class.
■ Imputation will be performed for the 0/1 variable BORN_US01. The output dataset will contain
variable BORNUS01_I, which will hold the imputed values for BORN_US01 (see IMPNAME
statement).
■ ID is the unique record identifier for this data (see IMPID statement).
■ The PRINT statement is used to obtain additional summary statistics from the DONORSTAT and
MEANS groups.
■ The OUTPUT statement tells IMPUTE to include all the default IMPUTE variables on the output file
LOGISTIC, in addition to variables on the IDVAR statement (BORN_US01, RACEMOM, EDUC).
The IMPMODEL variables are not included by default on the output dataset.
The distribution of BORN_US01 and the model covariates is presented next.
Exhibit 28. Distribution of BORN_US01 (variable to be imputed) Variance Estimation Method: Taylor Series (SRS)
Distribution of Model Variables
---------------------------------------
BORN_US01
Sample Col
Size Percent
---------------------------------------
Total 953 100.00
. 31 3.25
0=Foreign 169 17.73
1=US 753 79.01
---------------------------------------
There are 31 missing values for BORN_US01.

[Type text] Page 34 of 40
Exhibit 29. Distribution of Race/Ethnicity (model covariate) Variance Estimation Method: Taylor Series (SRS)
Distribution of Model Variables
---------------------------------------
Race-ethnicity
Sample Col
Size Percent
---------------------------------------
Total 953 100.00
1 480 50.37
2 225 23.61
3 190 19.94
4 58 6.09
---------------------------------------
Exhibit 30. Distribution of Education (model covariate)
Variance Estimation Method: Taylor Series (SRS)
Distribution of Model Variables
---------------------------------------
Education
Sample Col
Size Percent
---------------------------------------
Total 953 100.00
Missing 1 0.10
1 368 38.61
2 399 41.87
3 185 19.41
---------------------------------------

[Type text] Page 35 of 40
Exhibit 31. Listing of the Missing Values for BORN_US01
S U D A A N
Software for the Statistical Analysis of Correlated Data
Copyright Research Triangle Institute June 2012
Release 11.0.0
For Subpopulation: BORN_US01 = .
Born in US Non-Respondents via SUBPOPX
by: Observation Number.
------------------------------------------------------------
Observation
Number Race-
ID ethnicity Education BORN_US01
------------------------------------------------------------
15 3127 1 1 .
58 19014 1 1 .
73 21130 1 1 .
99 30001 1 1 .
119 34129 1 1 .
131 40023 1 1 .
138 41021 1 1 .
186 12004 1 2 .
246 21127 1 2 .
257 22130 1 2 .
261 22136 1 2 .
272 23122 1 2 .
283 27022 1 2 .
302 30018 1 2 .
306 30123 1 2 .
346 34131 1 2 .
381 41129 1 2 .
383 41131 1 2 .
390 3122 1 3 .
424 21126 1 3 .
450 30014 1 3 .
451 30124 1 3 .
475 41128 1 3 .
625 28125 2 2 .
626 28126 2 2 .
627 29007 2 2 .
684 22127 2 3 .
832 10016 3 2 .
875 10017 3 3 .
880 11125 3 3 .
945 25010 4 3 .
------------------------------------------------------------

[Type text] Page 36 of 40
The summary statistics output from the IMPUTE procedure is presented in Exhibit 32.
Exhibit 32. Logistic Regression Imputation: Default Summary Statistics
S U D A A N
Software for the Statistical Analysis of Correlated Data
Copyright Research Triangle Institute June 2012
Release 11.0.0
Logistic imputation of BORN_US01 for _ONE_=1
Number of zero responses : 168
Number of non-zero responses : 753
Independence parameters have converged in 9 iterations.
The Impute Process has completed successfully.
Method: LOGISTIC
Total Records Read from File: 953
Total Respondent Records: 922
Total Nonrespondent Records: 31
Total Records Imputed: 31
Exhibit 32 indicates the logistic regression imputation procedure “completed successfully” and the
number of valid IMPUTE records=953. There are 922 respondent records, 31 nonrespondent record
(missing value on BORN_US), and 31 records imputed. The model will be fit on those records with both
non-missing BORN_US and non-missing covariates.

[Type text] Page 37 of 40
Exhibit 33. Logistic Regression Imputation: DONORSTAT Group
Logistic Regression for Imputing Born in US
Imputation #1
Method = LOGISTIC
by: SUDAAN Reserved Variable One.
------------------------------------------
SUDAAN
Reserved
Variable Item Item Missing
One Resp Non-Resp Data -
Count Count Post-imp
------------------------------------------
1 922 31 0
------------------------------------------
There are 922 respondent records, 31 nonrespondent records (missing BORN_US01), and no records with
missing BORN_US01 after imputation.
Exhibit 34. Logistic Regression Imputation: MEANS Group
Logistic Regression for Imputing Born in US
Imputation #1
Method = LOGISTIC
BORN_US01
by: SUDAAN Reserved Variable One.
----------------------------------------------------
SUDAAN
Reserved Mean - Rel.
Variable Mean - Post- Abs. Diff.
One Pre-imp imp Diff. (%)
----------------------------------------------------
1 0.8115 0.8184 0.0070 0.8567
----------------------------------------------------
This table tells us the weighted mean of BORN_US01 (proportion born in US) before vs. after logistic
regression imputation. The weighted percentage went from 81.15% pre-imputation to 81.84% post-
imputation.

[Type text] Page 38 of 40
Exhibit 35. Distribution of BORN_US Before vs. After Imputation
Variance Estimation Method: Taylor Series (SRS)
LOGISTIC: See How Born_US is Imputation Revised
Sample Size
by: BORN_US01, BornUS Imputed.
-------------------------------------------------
BORN_US01 BornUS Imputed
Total 0=Foreign 1=US
-------------------------------------------------
Total 953 169 784
. 31 0 31
0=Foreign 169 169 0
1=US 753 0 753
-------------------------------------------------
All 31 missing values for BORN_US01 were imputed via logistic regression to BORN_US01=1 (born in
US).
Exhibit 36. Contents of Linear Regression Imputed Dataset S U D A A N
Software for the Statistical Analysis of Correlated Data
Copyright Research Triangle Institute June 2012
Release 11.0.0
SAS Record File OUT.LOGISTIC
Variables
Name Type Output SAS Description
Format Format
--------------------------------------------------------------
PROCNUM Numeric F2. Procedure Number
DONORID Numeric F8. Donor ID
BORNUS01_I Numeric USA. bornus_i
BORN_US01 Numeric USA. BORN_US01
RACEMOM Numeric F12. Race-ethnicity
EDUC Numeric F12. Education
_ONE_ Numeric F1. SUDAAN Reserved Variable One
ID Numeric F8. ID
ORIGVAL Numeric USA. Original Variable
ANALWGT1 Numeric F10.2 Analysis
This table shows the contents of the LOGISTIC imputed dataset.

[Type text] Page 39 of 40
Exhibit 37. First Page of Logistic Imputed Dataset LOGISTIC Imputed Dataset
by: Observation Number.
---------------------------------------------------------------------------------
Observation
Number Race-
ID ethnicity Education Donor ID BORN_US01 bornus_i
---------------------------------------------------------------------------------
1 24004 1 . . 0 0
2 1004 1 1 . 1 1
3 1008 1 1 . 1 1
4 1009 1 1 . 1 1
5 1012 1 1 . 1 1
6 1014 1 1 . 1 1
7 1020 1 1 . 1 1
8 1021 1 1 . 1 1
9 1023 1 1 . 1 1
10 1025 1 1 . 1 1
11 1130 1 1 . 1 1
12 2003 1 1 . 1 1
13 3012 1 1 . 1 1
14 3018 1 1 . 0 0
15 3127 1 1 -3 . 1
16 3128 1 1 . 1 1
17 4001 1 1 . 1 1
18 4005 1 1 . 1 1
19 4008 1 1 . 1 1
20 4017 1 1 . 1 1
21 4022 1 1 . 1 1
22 4128 1 1 . 1 1
23 4130 1 1 . 1 1
24 4134 1 1 . 1 1
25 6012 1 1 . 1 1
26 7122 1 1 . 1 1
27 8001 1 1 . 1 1
28 8020 1 1 . 0 0
29 8025 1 1 . 1 1
30 10129 1 1 . 1 1
31 11004 1 1 . 1 1
32 11009 1 1 . 0 0
33 11126 1 1 . 1 1
34 12010 1 1 . 1 1
35 14001 1 1 . 1 1
36 14003 1 1 . 1 1
37 14005 1 1 . 1 1
38 14008 1 1 . 1 1
39 14013 1 1 . 1 1
40 14015 1 1 . 1 1
41 15008 1 1 . 1 1
---------------------------------------------------------------------------------
There are 953 records on the output dataset LOGISTIC. This is the first page of the output dataset. It is
sorted by RACEMOM and EDUC. For METHOD=LOGISTIC, DONORID is either missing (records
without imputation) or -3 (records with imputation). On this page, we see that ID=3127 is imputed to
BORNUS_i=1.

[Type text] Page 40 of 40