Improving the treatment of Severe Acute Malnutrition …discovery.ucl.ac.uk/1306755/1/1306755.pdf1...
202
1 Improving the treatment of Severe Acute Malnutrition in Childhood: A randomized controlled trial of Synbiotic-enhanced therapeutic food with long term follow-up of post-treatment mortality and morbidity Marko Kerac Thesis submitted to University College London in part fulfilment of the degree of: PhD Centre for International Health & Development, Institute of Child Health, UCL
-
Upload
trinhxuyen -
Category
Documents
-
view
216 -
download
0
Transcript of Improving the treatment of Severe Acute Malnutrition …discovery.ucl.ac.uk/1306755/1/1306755.pdf1...
1
Improving the treatment of
Severe Acute Malnutrition in Childhood:
A randomized controlled trial of Synbiotic-enhanced therapeutic food
with long term follow-up of post-treatment mortality and morbidity
Marko Kerac
Thesis submitted to University College London in part fulfilment of the
degree of:
PhD
Centre for International Health & Development, Institute of Child Health,
UCL
2
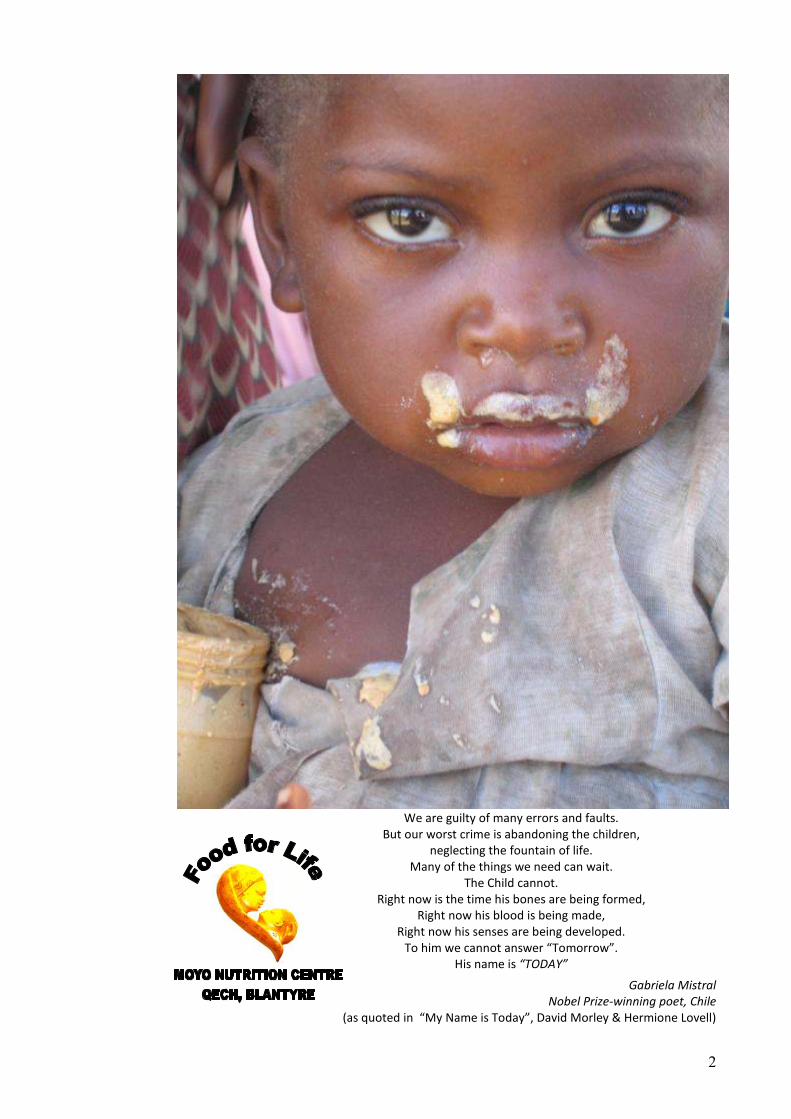
We are guilty of many errors and faults.
But our worst crime is abandoning the children,
neglecting the fountain of life.
Many of the things we need can wait. The Child cannot.
Right now is the time his bones are being formed,
Right now his blood is being made,
Right now his senses are being developed.
To him we cannot answer “Tomorrow”.
His name is “TODAY”
Gabriela Mistral
Nobel Prize-winning poet, Chile
(as quoted in “My Name is Today”, David Morley & Hermione Lovell)

I, Marko Kerac, confirm
information has been derived from other sources, I confirm that this has been indicated.
…………………………………
Marko Kerac
Declaration
I, Marko Kerac, confirm that the work presented in this thesis is my own. Where
information has been derived from other sources, I confirm that this has been indicated.
…………………………………
3
that the work presented in this thesis is my own. Where
information has been derived from other sources, I confirm that this has been indicated.

4
Abstract
BACKGROUND
Tackling severe acute malnutrition (SAM) is a global public health priority. This thesis explores
two major influences on treatment outcomes:
-Treatment efficacy
-Patient-related risk factors
OBJECTIVES
1. To explore whether a pre/probiotic mixture (Synbiotic2000 Forte™) improves treatment
outcomes (nutritional and clinical) in children affected by SAM.
2. To describe long term outcomes from SAM and identify key mortality risk factors.
METHODS
All 1024 malnourished children admitted to a therapeutic feeding centre in Malawi from July
2006 to March 2007 were eligible for:
The PRONUT study (Pre and PRObiotics in the treatment of severe acute malNUTrition): 795
were recruited into a randomised, double-blind, placebo-controlled trial. They received Ready-
to-Use Therapeutic Food either with or without Synbiotic2000 Forte™. Primary outcome was
nutritional cure (weight-for-height >80% of NCHS median).
The FUSAM study (Long term Follow-Up after Severe Acute Malnutrition): all children known
to be still alive were followed up ≥1 year post discharge.
RESULTS
In PRONUT, nutritional cure was similar in both groups: 54%(215/399) for Synbiotic-enhanced
RUTF and 51%(203/396) for controls (p=0.40). Main secondary outcomes were also similar
(p>0.05).
Overall mortality from SAM was 41%(427/1024). Mortality was highest during initial inpatient
treatment: 23%(238/1024). In FUSAM, 8%(84/1024) more died within 90 days of admission and
10%(105/1024) during long term follow-up. Cox regression identified HIV, low weight-for-
height, low mid-upper arm circumference and low weight-for-age as major risk factors for
death (p<0.001).
CONCLUSIONS
In this high-mortality setting, Synbiotic2000 ForteTM, did not improve clinical or nutritional
outcomes from SAM. A more promising strategy to improve outcomes might be to tackle the
major risk factors for SAM mortality: HIV and severity of malnutrition disease. It is likely that
earlier treatment would be beneficial. This is a focus of current strategies for both HIV and
malnutrition. Rollout of such programmes should be supported and their impact on SAM
evaluated.

5
Abbreviations & acronyms
ARV Antiretroviral drugs (for treating HIV infection)
BF Breast feeding (or breast-fed)
BMS Breast-milk substitute
CIHD Centre for International Health & Development, UCL, London
CF Complementary foods / feeding
CFR Case fatality rate
CHW Community Health Worker
CMAM Community Management of Acute Malnutrition
CSB Corn Soy Blend
CTC Community-based Therapeutic Care (original term for CMAM)
DHS Demographic and Health Survey
DSMB Data safety and monitoring board
EBF Exclusive breast-feeding (or exclusively breast-fed)
EBM Expressed breast milk
ENN Emergency Nutrition Network, Oxford
GAM Global Acute Malnutrition ( = SAM + MAM)
HA Height-for-Age
HAM Height-for-Age % of median
HAZ Height-for-Age Z-score
HCW Healthcare worker
HIV Human Immunodeficiency Virus
Infant(s)U6m Infant(s) aged under 6 months (=0 to 5.9months)
IQR Inter-quartile range
ITT Intention to treat
IYCF Infant and Young child feeding
LAB Lactic acid bacteria
LBW Low Birth Weight
LNS Lipid nutrient supplement
MAM Moderate Acute Malnutrition
MDG Millennium Development Goal(s)
MoH Ministry of Health
MUAC Mid-Upper Arm Circumference
NCHS National Centre for Health Statistics (Growth references)
NGO Non-Governmental Organization
NRU Nutritional Rehabilitation Units
SAM Severe Acute Malnutrition
SC Stabilization Centre
SS Supplementary Suckling
SFP Supplementary Feeding Programme (for moderate acute malnutrition)
TFC Therapeutic Feeding Centre
TFP Therapeutic Feeding Programme (for severe acute malnutrition)
WA Weight-for-age
WAM Weight-for-age % of median
WAZ Weight-for-age Z-score
WH Weight-for-height
WHM Weight-for-height % of median
WHZ Weight-for-height Z-score
WHO World Health Organization
WHO-GS World Health Organization Child Growth Standards, 2006
UN United Nations
6
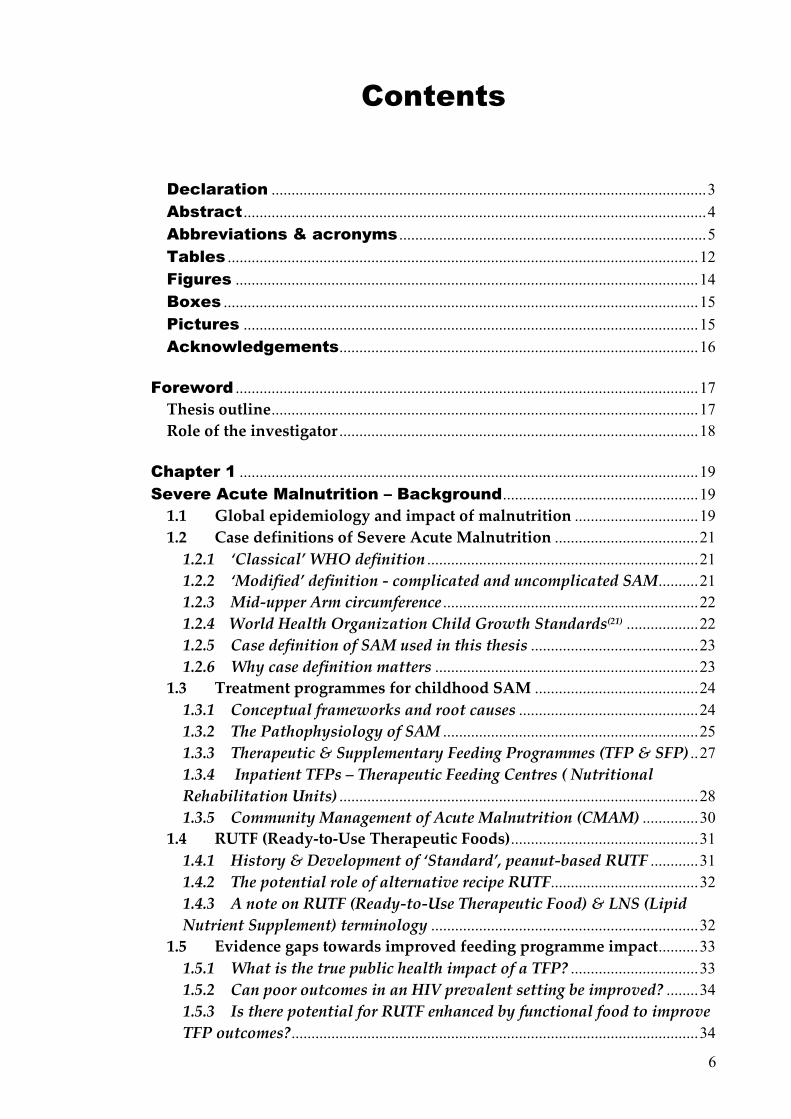
Contents
Declaration ............................................................................................................. 3
Abstract .................................................................................................................... 4
Abbreviations & acronyms ............................................................................. 5
Tables ...................................................................................................................... 12
Figures .................................................................................................................... 14
Boxes ....................................................................................................................... 15
Pictures .................................................................................................................. 15
Acknowledgements .......................................................................................... 16
Foreword .................................................................................................................... 17
Thesis outline ........................................................................................................... 17
Role of the investigator .......................................................................................... 18
Chapter 1 ................................................................................................................... 19
Severe Acute Malnutrition – Background ................................................. 19
1.1 Global epidemiology and impact of malnutrition ............................... 19
1.2 Case definitions of Severe Acute Malnutrition .................................... 21
1.2.1 ‘Classical’ WHO definition .................................................................... 21
1.2.2 ‘Modified’ definition - complicated and uncomplicated SAM .......... 21
1.2.3 Mid-upper Arm circumference ................................................................ 22
1.2.4 World Health Organization Child Growth Standards(21) .................. 22
1.2.5 Case definition of SAM used in this thesis .......................................... 23
1.2.6 Why case definition matters .................................................................. 23
1.3 Treatment programmes for childhood SAM ......................................... 24
1.3.1 Conceptual frameworks and root causes ............................................. 24
1.3.2 The Pathophysiology of SAM ................................................................ 25
1.3.3 Therapeutic & Supplementary Feeding Programmes (TFP & SFP) .. 27
1.3.4 Inpatient TFPs – Therapeutic Feeding Centres ( Nutritional
Rehabilitation Units) .......................................................................................... 28
1.3.5 Community Management of Acute Malnutrition (CMAM) .............. 30
1.4 RUTF (Ready-to-Use Therapeutic Foods) ............................................... 31
1.4.1 History & Development of ‘Standard’, peanut-based RUTF ............ 31
1.4.2 The potential role of alternative recipe RUTF..................................... 32
1.4.3 A note on RUTF (Ready-to-Use Therapeutic Food) & LNS (Lipid
Nutrient Supplement) terminology ................................................................... 32
1.5 Evidence gaps towards improved feeding programme impact .......... 33
1.5.1 What is the true public health impact of a TFP? ................................ 33
1.5.2 Can poor outcomes in an HIV prevalent setting be improved? ........ 34
1.5.3 Is there potential for RUTF enhanced by functional food to improve
TFP outcomes? ...................................................................................................... 34

7
Chapter 2 …………………………………………………………………………37
Aims & Objectives ................................................................................................ 37
2.1 Hypotheses ................................................................................................... 37
2.2.1 Study 1 – PRONUT (Pre and PRObiotics in the treatment of severe
acute malNUTrition) ........................................................................................... 38
2.2.2 Study 2 – FUSAM (Long term Follow-up after an episode of
Severe Acute Malnutrition) ................................................................................ 38
Chapter 3 ................................................................................................................... 39
Setting, participants & methods ................................................................... 39
3.1 Setting ............................................................................................................ 39
3.1.1 Malawi, the warm (but malnourished) heart of Africa ..................... 39
3.1.2 Therapeutic Feeding Programmes in Malawi ...................................... 40
3.1.3 MOYO nutrition ward, Department of Paediatrics, Queen Elizabeth
Central Hospital, College of Medicine, Blantyre. ........................................... 41
3.2 Study participants: the MOYO case definition of SAM ...................... 42
3.3 Study participants: the MOYO patient care pathway .......................... 43
3.3.1 Admission routes to MOYO ................................................................... 43
3.3.2 Initial assessment and treatment in MOYO (including
anthropometry) .................................................................................................... 43
3.3.3 Inpatient treatment ................................................................................. 44
3.3.4 OTP (Outpatient) treatment .................................................................. 45
3.3.5 Discharge from MOYO TFP ................................................................... 46
3.3.6 HIV & CD4 testing ................................................................................... 46
3.3.7 HIV treatment ........................................................................................... 47
3.3.8 Other TFP-related services: SFP, TB, disability ................................. 47
3.3.9 Patient flow summary & cohorts enrolled in PRONUT & FUSAM 47
3.4 Methods: quality control systems ............................................................ 49
3.4.1 Anthropometry ......................................................................................... 49
3.4.2 Patient records systems .......................................................................... 51
3.4.3 Patient held records ................................................................................. 52
3.4.4 Staff training and supervision ............................................................... 52
3.5 Methods: the ‘verbal map’ and patient follow-up ................................ 53
3.6 Ethical Approval .......................................................................................... 54
Chapter 4 ................................................................................................................... 55
‘PRONUT’ Study ...................................................................................................... 55
4.1 Aim ................................................................................................................. 55
4.1.1 Objectives: ................................................................................................. 55
4.2 Methods ........................................................................................................ 56
4.2.1 Study design .............................................................................................. 56
4.2.2 Setting & participants ............................................................................. 56
4.2.3 Interventions ............................................................................................. 56
4.2.4 Trial Safety & Sepsis monitoring .......................................................... 58
4.2.5 Outcome variables ................................................................................... 60

8
4.2.6 Sample size ................................................................................................ 60
4.2.8 Blinding ..................................................................................................... 61
4.2.9 Statistical methods & data handling ................................................... 62
4.3 RESULTS ...................................................................................................... 63
4.3.1 Study flow chart ....................................................................................... 63
4.3.2 Patient characteristics at baseline ........................................................ 64
4.3.3 Main outcomes – programme cure and mortality ............................... 65
4.3.4 Secondary outcomes – carer reported clinical symptoms .................. 69
4.3.5 Kaplan-Meier time-to-death analysis .................................................. 71
4.3.6 Subgroup Analyses ................................................................................... 72
Chapter 5 ................................................................................................................... 73
‘FUSAM’ study ......................................................................................................... 73
5.1 Aims ............................................................................................................... 73
5.1.1 Objectives: ................................................................................................. 73
5.2 Methods ........................................................................................................ 74
5.2.1 Study design .............................................................................................. 74
5.2.2 Setting & participants ............................................................................. 74
5.2.3 Outcome variables ................................................................................... 74
5.2.4 Data sources and measurement ............................................................. 76
5.2.5 Bias ............................................................................................................. 77
5.2.6 Study Size .................................................................................................. 79
5.2.7 Quantitative variables ............................................................................ 79
5.2.8 Statistical methods .................................................................................. 79
5.2.9 Ethics .......................................................................................................... 81
5.3 Results - Study flow chart and summary outcomes ............................. 82
5.3.1 FUSAM summary - total survivors ...................................................... 83
5.3.2 FUSAM summary - total mortality ...................................................... 83
5.3.3 FUSAM summary - Total unknown final outcome ............................ 83
5.4 Results – Baseline patient profile at admission to MOYO ................. 84
5.4.1 Age & sex profile ...................................................................................... 84
5.4.2 Nutritional profile ................................................................................... 85
5.4.3 Malnutrition severity (weight-for-height, weight-for-age and
height-for-age z-scores) ....................................................................................... 86
5.4.4 HIV related profile ................................................................................... 87
5.4.5 Clinical profile ............................................................................................. 88
5.4.6 Past medical history ................................................................................... 89
5.4.7 Family and socioeconomic status ......................................................... 90
5.5 What explains mortality or survival? Kaplan-Meier failure curves and
Cox regression ........................................................................................................... 92
5.5.1 Kaplan-Meier failure curve – all patients ............................................ 92
5.5.2 Kaplan-Meier failure curves – by HIV .................................................. 93
5.5.3 What explains adverse SAM outcomes – malnutrition severity? .... 94
5.5.4 What explains adverse SAM outcomes – HIV status? ....................... 97

9
5.5.5 What explains adverse SAM outcomes – baseline clinical severity of
illness? ................................................................................................................... 98
5.5.6 What explains adverse SAM outcomes – risk factors in past medical
history? ................................................................................................................ 100
5.5.7 What explains adverse SAM outcomes – family and socioeconomic
risk factors? ......................................................................................................... 101
5.6 Results - Profile of children found at long term FUSAM follow-up 104
5.6.1 Recurrence of malnutrition ................................................................... 105
5.6.2 Clinical progress since discharge ......................................................... 106
5.6.3 Access to supplementary feeding following discharge ................. 107
5.6.4 Access to TB services ............................................................................. 108
5.6.5 Access to HIV services ........................................................................... 109
5.6.6 TFP-based nutrition education sessions: do they improve knowledge
or affect mortality? ............................................................................................ 112
5.7 Results - Growth catch-up in the ex-SAM child ................................. 114
5.7.1 Overall z-score changes during treatment ......................................... 114
5.7.2 Z-score changes during treatment, by HIV status and admission
diagnosis .............................................................................................................. 116
5.7.3 Weight-for-height changes during treatment ................................ 119
5.7.4 Weight-for-age changes during treatment.......................................... 120
5.7.5 Height-for-age changes during treatment .......................................... 121
5.8 Results - Growth catch-up compared to sibling controls .................. 122
5.8.1 Weight-for-height, weight-for-age and height-for-age compared to
sib controls .......................................................................................................... 122
5.8.2 Weight-for-height compared to sib controls, by birth order .......... 123
5.8.3 Weight-for-age compared to sib controls, by birth order ............... 124
5.8.4 Height-for-age compared to sib controls, by birth order ................ 125
Chapter 6 ................................................................................................................. 126
DISCUSSION ........................................................................................................... 126
6.1 PRONUT ..................................................................................................... 126
6.1.1 Key findings ............................................................................................ 126
6.1.2 Strengths and weaknesses .................................................................... 126
6.1.3 Meaning of the study and implications for future policy and
research ................................................................................................................ 130
6.2 FUSAM ........................................................................................................ 131
6.2.1 Key findings ............................................................................................ 131
6.2.2 Strengths and weaknesses .................................................................... 132
6.2.3 Meaning of the study: generalizability ............................................... 133
6.2.4 Comparison with other related studies .............................................. 134
6.2.5 Implications for policy and practice ................................................... 135
6.2.6 Unanswered questions and future research ....................................... 137

10
Chapter 7 ................................................................................................................. 139
CONCLUSIONS ...................................................................................................... 139
REFERENCES ......................................................................................................... 140
APPENDICES .......................................................................................................... 147
Annex A. Research articles – summary list ....................................... 147
A.1 Directly related to thesis ................................................................ 147
A.2 Related to theme of Severe Acute Malnutrition ................. 147
Annex B. Presentations to meetings – summary ............................ 148
B.1 Policy & General meetings (directly & indirectly PhD-
related) .................................................................................................................. 148
B.2 Academic Meetings (directly and indirectly related to
PhD) 148
Annex C. Ethical approvals and patient consent forms .............. 151
C.1 PRONUT ethical approval ............................................................... 151
C.1.1 Original .............................................................................................. 151
C.1.2 Update ............................................................................................... 152
C.2 Informed voluntary consent form (English) ........................... 153
C.3 Informed voluntary consent form (Chichewa) ..................... 154
C.4 FUSAM ethical approval form ....................................................... 155
Annex D. MOYO Ward forms and protocols ........................................ 156
D.1 Weight chart ........................................................................................... 156
D.2 Drug and inpatient symptom chart ............................................ 157
D.3 Protocol for assessing inpatient symptoms and appetite 158
D.4 Inpatient ‘phased feeding’ protocol .......................................... 159
D.5 OTP protocols ........................................................................................ 166
Annex E. PRONUT study forms and questionnaires ...................... 170
E.1 Recruitment and consent ............................................................... 170
E.2 Baseline anthropometry .................................................................. 171
E.3 Baseline clinical profile ................................................................... 172
E.4 Baseline geographical details and verbal map ................... 176
E.5 Socioeconomic profile ...................................................................... 179
E.6 OTP review .............................................................................................. 181

11
Annex F. PRONUT study additional details and results ............. 183
F.1 RUTF quality control: concentration of Synbiotic
organisms ............................................................................................................ 183
F.2 Possible probiotic sepsis laboratory protocol ..................... 184
F.3 Baseline clinical characteristics (detailed) .......................... 185
F.4 Baseline family and socioeconomic status (detailed) .... 186
Annex G. FUSAM study forms and questionnaires ......................... 187
G.1 Main study form .................................................................................... 187
G.2 Anthropometry (including sibling anthropometry and
clinical status) .................................................................................................. 191
G.3 HIV status and testing ...................................................................... 192
Annex H FUSAM study additional details and results ................ 193
H.1 Baseline patient profile at admission to MOYO.................. 193
H.1.1 Subtype of wasting ..................................................................... 193
H.1.2 Malnutrition severity at admission - details ................. 194
H.1.3 HIV profile ....................................................................................... 195
H.1.4 Clinical profile ............................................................................... 196
H.1.5 Past medical history .................................................................. 197
H.1.6 Family profile ................................................................................. 198
H.1.7 Socioeconomic profile .............................................................. 199
Annex I. Research article – PRONUT study, The Lancet, 2009 200
Annex J. Research article – HIV and SAM, Malawi Medical
Journal 2009 .......................................................................................................... 209
Annex K. Research article – MOYO Chart, Tropical Doctor,
2009 215
K.1 Original description of MOYO chart .......................................... 215
K.2 Latest version of the MOYO chart, as field tested in
Ethiopia, 2009 ................................................................................................... 219

12
Tables
Table 1 NCHS and WHO growth norms used to define SAM ....................................... 22
Table 2 WHO '10 Step' treatment of SAM ..................................................................... 29
Table 3 RUTF nutrient profile ........................................................................................ 31
Table 4 Main baseline patient characterisitcs ................................................................. 64
Table 5 Main PRONUT study outcomes ........................................................................ 65
Table 6 Details of timing of death: stratified by admission episode; inpatient or
outpatient care; HIV status .............................................................................................. 67
Table 7 Patient characteristics at point of entry to outpatient care (=point of discharge
from inpatient care) ......................................................................................................... 68
Table 8 Clinical outcomes (carer reported symptoms) ................................................... 69
Table 9 Indicators of Synbiotic safety ............................................................................ 70
Table 10 Main PRONUT study outcomes – main subgroup analysis ............................ 72
Table 11 Age and sex of MOYO patients, by final outcome .......................................... 84
Table 12 Nutritional diagnosis of MOYO patients at admission .................................... 85
Table 13 Weight-for-height, weight-for-age and height-for-age mean z-scores at
admission ........................................................................................................................ 86
Table 14 Baseline HIV profile ........................................................................................ 87
Table 15 Baseline clinical profile ................................................................................... 88
Table 16 Past medical history ......................................................................................... 89
Table 17 Family profile ................................................................................................... 90
Table 18 Socioeconomic status & residence ................................................................... 91
Table 19 Kaplan-Meier failure function showing early mortality probability at 30 and
90 days, and late mortality probability at 1 and 2 years after admission to programme 93
Table 20 Cox regression exploring baseline anthropometry as a predictor of death at 2
years ................................................................................................................................ 94
Table 21 Cox regression exploring baseline anthropometry as a risk factor for death in
1st 90 days vs. all deaths, by HIV serostatus ................................................................... 95
Table 22 Cox regression exploring discharge anthropometry as a risk factor for death,
by HIV serostatus ............................................................................................................ 96
Table 23 Cox regression exploring signs and symptoms of HIV disease a risk factor for
death in 1st 90 days vs. all deaths, by HIV serostatus ..................................................... 97
Table 24 Cox regression exploring clinical status at admission as a risk factor for death
in 1st 90 days vs all deaths, by HIV serostatus ................................................................ 99
Table 25 Cox regression exploring past medical history as a risk factor for death in 1st
90 days vs all deaths, by HIV serostatus ....................................................................... 100
Table 26 Cox regression exploring family risk factors for death in 1st 90 days vs all
deaths, by HIV serostatus .............................................................................................. 102
Table 27 Cox regression exploring socioeconomic risk factors for death in 1st 90 days vs
all deaths, by HIV serostatus ......................................................................................... 103
Table 28 Recurrence of malnutrition in children followed up at long term FUSAM visit:
by mortality and by HIV status ..................................................................................... 105
Table 29 Inpatient admissions, outpatient visits and clinical symptoms at long term
FUSAM visit: by mortality and by HIV status ............................................................. 106
Table 30 Access and duration of supplementary feeding post discharge from TFP ..... 107
Table 31 TB treatment described at long term follow-up visit ..................................... 108
Table 32 HIV related services: antiretrovirals (ARVs) and cotrimoxazole prophylaxis
....................................................................................................................................... 109
Table 33 Parental HIV status & treatment described at long term follow-up visit ....... 110
Table 34 Sibling HIV status & where tested ................................................................. 111
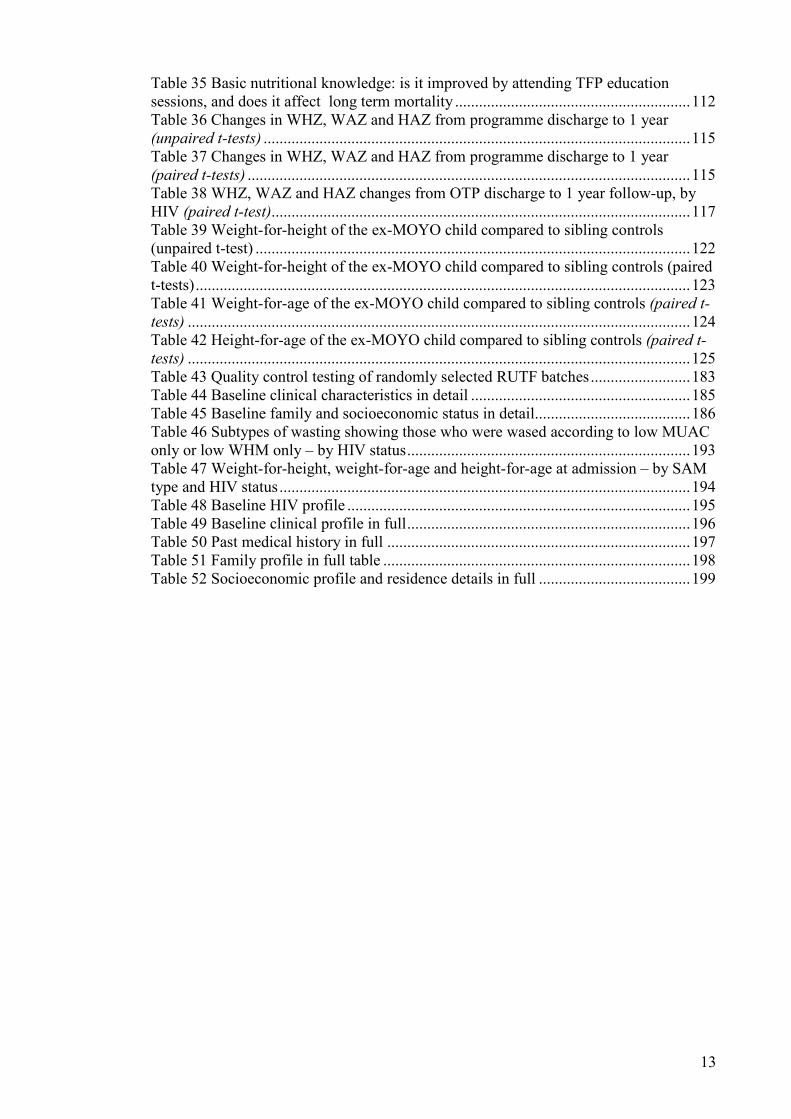
13
Table 35 Basic nutritional knowledge: is it improved by attending TFP education
sessions, and does it affect long term mortality ........................................................... 112
Table 36 Changes in WHZ, WAZ and HAZ from programme discharge to 1 year
(unpaired t-tests) ........................................................................................................... 115
Table 37 Changes in WHZ, WAZ and HAZ from programme discharge to 1 year
(paired t-tests) ............................................................................................................... 115
Table 38 WHZ, WAZ and HAZ changes from OTP discharge to 1 year follow-up, by
HIV (paired t-test)......................................................................................................... 117
Table 39 Weight-for-height of the ex-MOYO child compared to sibling controls
(unpaired t-test) ............................................................................................................. 122
Table 40 Weight-for-height of the ex-MOYO child compared to sibling controls (paired
t-tests) ............................................................................................................................ 123
Table 41 Weight-for-age of the ex-MOYO child compared to sibling controls (paired t-
tests) .............................................................................................................................. 124
Table 42 Height-for-age of the ex-MOYO child compared to sibling controls (paired t-
tests) .............................................................................................................................. 125
Table 43 Quality control testing of randomly selected RUTF batches ......................... 183
Table 44 Baseline clinical characteristics in detail ....................................................... 185
Table 45 Baseline family and socioeconomic status in detail....................................... 186
Table 46 Subtypes of wasting showing those who were wased according to low MUAC
only or low WHM only – by HIV status ....................................................................... 193
Table 47 Weight-for-height, weight-for-age and height-for-age at admission – by SAM
type and HIV status ....................................................................................................... 194
Table 48 Baseline HIV profile ...................................................................................... 195
Table 49 Baseline clinical profile in full ....................................................................... 196
Table 50 Past medical history in full ............................................................................ 197
Table 51 Family profile in full table ............................................................................. 198
Table 52 Socioeconomic profile and residence details in full ...................................... 199

14
Figures
Figure 1 Causes of death in under-5 children worldwide ............................................... 19
Figure 2 Life course and intergenerational effects of malnutrition................................. 20
Figure 3 Complicated and uncomplicated malnutrition .................................................. 21
Figure 4 Conceptual illustration of continuous processes and discrete categories in
'malnutrition'.................................................................................................................... 23
Figure 5 UNICEF conceptual framework for malnutrition ............................................. 24
Figure 6 Structure of and patient 'flow' within a CMAM TFP ....................................... 30
Figure 7 Map of health centres and their catchment areas in Blantyre district ............... 41
Figure 8 Admission routes to MOYO nutrition ward ..................................................... 43
Figure 9 Flow chart overview of SAM treatment with short, mid and long term
outcomes ......................................................................................................................... 48
Figure 10 Identification of possible probiotic associated sepsis ..................................... 59
Figure 11 Kaplan-Meier time-to-death graph, by HIV status. All deaths in the study are
shown. ............................................................................................................................. 71
Figure 12 FUSAM study flow chart - all admissions to MOYO .................................... 82
Figure 13 Kaplan Meier failure curve, all patients in the study. ..................................... 92
Figure 14 Kaplan Meier failure curves, by HIV serostatus ............................................ 93
Figure 15 Outcome of FUSAM visit (n=667 patients eligible for visit) ....................... 104
Figure 16 Carer reported problems with SFP (n=450) ................................................. 107
Figure 17 Reported changes in feeding practices (n=152 who reported having changed)
....................................................................................................................................... 113
Figure 18 Box plots showing WHZ, WAZ and HAZ at baseline, OTP discharge and at
1 year follow-up. ........................................................................................................... 114
Figure 19 Box plots showing baseline, OTP and 1 year WHZ, WAZ and HAZ, by HIV
status ............................................................................................................................. 116
Figure 20 Box plots showing baseline, OTP and 1 year WHZ, WAZ and HAZ, by
admission oedema, in HIV seronegative patients ......................................................... 118
Figure 21 Box plots showing baseline, OTP and 1 year WHZ, WAZ and HAZ, by
admission oedema, in HIV seropositive patients .......................................................... 118
Figure 22 Weight-for-height z-scores in HIV seronegative children............................ 119
Figure 23 Weight-for-height z-score changes in HIV seropositive children ................ 119
Figure 24 Weight-for-age z-score changes in HIV seronegative children .................... 120
Figure 25 Weight-for-age z-score changes in HIV seropostive children ...................... 120
Figure 26 Height-for-age z-score changes in HIV seronegative children ..................... 121
Figure 27 Height-for-age z-score changes in HIV seropostive children ....................... 121
Figure 28 Boxplot showing weight-for-height, weight-for-age and height-for-age of the
ex-MOYO child (M) compared to sibling controls (S). n(MOYO)=386. n(sibling
controls)=277 ................................................................................................................ 122
Figure 29 Boxplot showing weight-for-height of the MOYO child at 1 year compared to
sibling controls. ............................................................................................................. 123
Figure 30 Boxplot showing weight-for-age of the MOYO child at 1 year compared to
sibling controls. ............................................................................................................. 124
Figure 31 Boxplot showing height-for-age of the MOYO child at 1 year compared to
sibling controls. ............................................................................................................. 125
Figure 32 Onset of stunting, wasting and underweight (Shrimpton et al, Pediatrics,
2001) ............................................................................................................................. 137
15
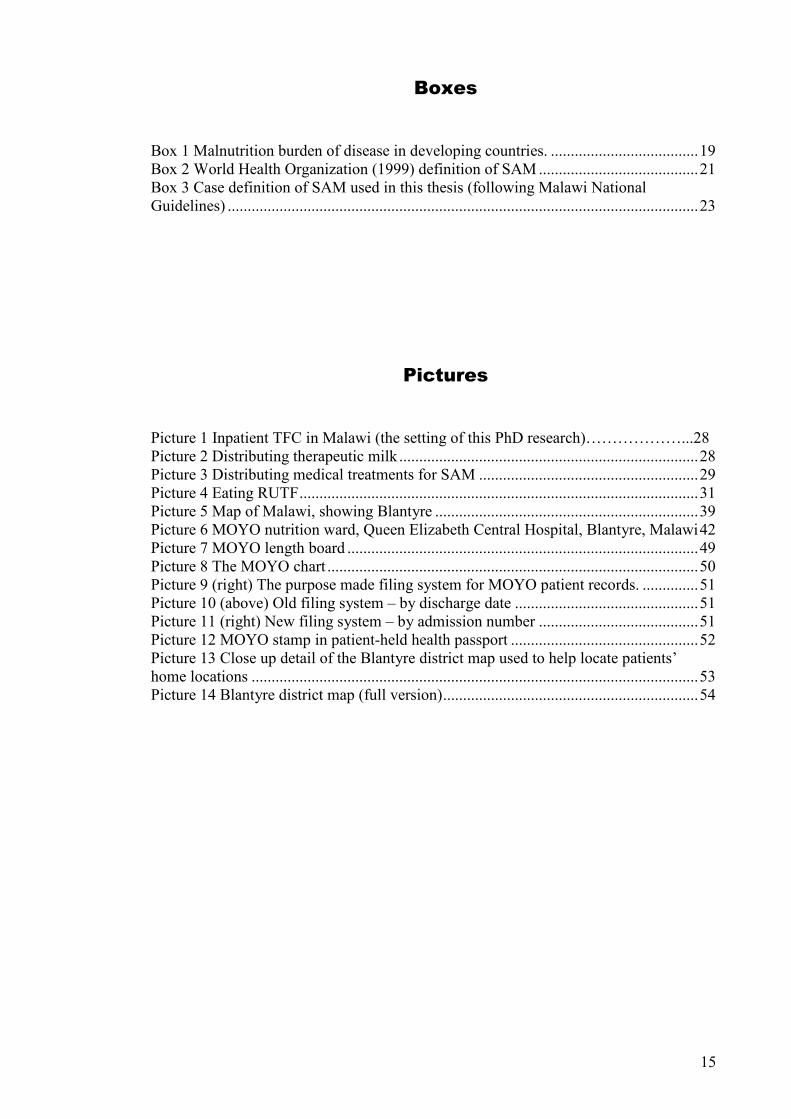
Boxes
Box 1 Malnutrition burden of disease in developing countries. ..................................... 19
Box 2 World Health Organization (1999) definition of SAM ........................................ 21
Box 3 Case definition of SAM used in this thesis (following Malawi National
Guidelines) ...................................................................................................................... 23
Pictures
Picture 1 Inpatient TFC in Malawi (the setting of this PhD research)………………...28
Picture 2 Distributing therapeutic milk ........................................................................... 28
Picture 3 Distributing medical treatments for SAM ....................................................... 29
Picture 4 Eating RUTF .................................................................................................... 31
Picture 5 Map of Malawi, showing Blantyre .................................................................. 39
Picture 6 MOYO nutrition ward, Queen Elizabeth Central Hospital, Blantyre, Malawi 42
Picture 7 MOYO length board ........................................................................................ 49
Picture 8 The MOYO chart ............................................................................................. 50
Picture 9 (right) The purpose made filing system for MOYO patient records. .............. 51
Picture 10 (above) Old filing system – by discharge date .............................................. 51
Picture 11 (right) New filing system – by admission number ........................................ 51
Picture 12 MOYO stamp in patient-held health passport ............................................... 52
Picture 13 Close up detail of the Blantyre district map used to help locate patients’
home locations ................................................................................................................ 53
Picture 14 Blantyre district map (full version) ................................................................ 54

16
Acknowledgementsa
This PhD is dedicated to the children, families and staff of MOYO nutrition ward, Malawi. I am deeply
grateful to them and to all whose great help and support made this work possible:
- Special thanks are due to my inspiring supervisors, Dr Andrew Seal and Professor Andrew Tomkins.
I also thank, in Malawi:
- Sr Agnes Malamula (sister-in-charge); Professor James Bunn (lead clinician), and all the staff of MOYO
- The PRONUT field team: Hilda Khengere, Charity Mbendera, Christina Mhango, Theresa Nnensa,
Mary Katundu, Agnes Kango’mbe Bwanali, Monica Matola, Joseph.Msimuko, German Chauluka;
- Friends and colleagues in the Department of Paediatrics, College of Medicine
- Word Alive Church ‘ICOCA’ team: for HIV counselling and testing services to MOYO patients
- Dr Mary Bunn & the paediatric palliative care team: for clinical support to MOYO patients
- Dr Peter Moons and the ARV clinic team: for clinical support to MOYO patients
- Professor Elizabeth Molyneux: Head of Department of Paediatrics
- Professor Tom Heikens: Department of Paediatrics
- Professor Joseph Mfutso-Bengo: College of Medicine
- Dr George Chagaluka: co-author of FUSAM study
- Dr Hannah Blencowe: data entry (PRONUT) and Mr Bob Zumani: data entry (FUSAM)
- Mr Michael Moore; Ms Brigitte Denis; Dr Katherine Gray; Professor Malcolm Molyneux: Malawi-
Liverpool-Wellcome Trust: microbiological support
- Valid Malawi: Dr Paluku Bahwere, Mrs Theresa Banda and all in the Lilongwe office
- Valid Nutrition Malawi: Mr Happy Botha and all the RUTF factory team
In UK / Europe:
- Data Safety Monitoring Board: Professor Elizabeth Molyneux; Dr Therese Hesketh; Dr Sonia Lewycka
- Medipharm Sweden, in particular Ingrid Persson, Lennart Persson and Margot Hallin: for supplying
Synbiotic for the PRONUT study & providing laboratory support
- Dr James Soothill, Institute of Child Health London: support with probiotic microbiology
- Professor Stig Bengmark, UCL: advice on probiotic dosing and usage
- Mark Myatt: initial statistics advice
- Dr Jolene Skordis-Worrall, Pascal Odent and Carlos Grijalva-Eternod, UCL CIHD: statistics advice
- Professor Tim Cole, UCL Institute of Child Health, London: statistics advice
- Dr Jennifer Mindell, Dr Andrew Hayward, Dr Angela Bhan, Dr Donal O’Sullivan, Professor Anne
Johnson and Professor Azeem Majeed: for supporting me to stay on at UCL as an academic clinical
fellow in public health and continue my research into malnutrition and complete this thesis
- PhD examiners Dr Barbara Golden & Professor Stephen Allen
- Professor Anthony Costello, Director, and all friends and colleagues at the UCL Centre for International
Health & Development
- Valid UK office staff, especially Dr Kate Sadler, my line-manager .
PRONUT paper co-authors:
- Professor James Bunn, Dr Andrew Seal, Mrs Mariam Thindwa, Professor Andrew Tomkins, Dr Kate
Sadler, Dr Paluku Bahwere, Dr Steve Collins
- Lancet reviewers and editors for helpful comments on the first version of the submitted paper
Institutional and funding support from:
Valid International (via a DFID-funded core grant from CONCERN) - In particular I thank Valid directors Drs Steve Collins & Alistair Hallam
UNICEF Malawi - In particular I thank Roger Mathisen and Stanley Chintkewe for support with the FUSAM study
Personal
I also dedicate this thesis to:
- The memory of Dr Jack Piachaud – my first mentor in International Health and wise guide for many
years - who is hugely missed but never forgotten
- My parents, Nada and Djordje: for the foundations and example they gave me and for their wonderful
love and support which makes everything possible
- Professor Anne Nesbitt: my first inspirational boss on MOYO ward from 2003 to 2004
- Professor James Bunn and family: for continued inspiration both on and beyond MOYO
- Finally – but most importantly - my wife Hannah, and my children, Toma and Milena: for the many
blessings they bring to my life, and for sustaining and motivating me always.
a Please also see foreword for details of role of PhD student
17
Foreword
Severe Acute Malnutrition (SAM) affects an estimated 19 million children worldwide(1). It is
responsible for over 1 million deaths each year(2). The past decade has seen important advances
in how SAM is treated(3). Yet in many settings, notably those where HIV is prevalent, mortality
remains unacceptably high(4). The work presented in this thesis is a small contribution towards
wider efforts to better understand and more effectively tackle SAM.
Thesis outline
In Chapter 1 I present the background to this thesis, outlining definitions of, treatment
approaches to, and challenges around severe acute malnutrition. I highlight therapeutic food as
a key intervention within the SAM treatment package and argue that a long term perspective is
important to evaluating the true success and public health impact of treatment.
In Chapter 2 I present the research hypotheses, aims and objectives
In Chapter 3 I describe the core methodology, focusing on the study setting and population: all
children admitted to MOYO nutritional rehabilitation unit, Queen Elizabeth Central Hospital,
Blantyre, Malawi.
In Chapter 4 I describe the PRONUT study (Pre and PRObiotics in the treatment of severe
acute malNUTrition), a randomised, double-blind efficacy trial.
In Chapter 5 I describe the FUSAM (Follow-up of Severe Acute Malnutrition) study, a
longitudinal cohort study describing long term outcomes of all patients admitted to MOYO.
In Chapter 6 I discuss key findings from the two studies and their implications for current and
future nutrition treatment programmes
In Chapter 7 I conclude with recommendations for policy and research
The Appendices contain study forms, questionnaires, expanded results tables and other
materials which are not included in the main body of the thesis for reasons of space and flow.
Also listed are publications and presentations arising directly from and closely related to the
research described.
18
Role of the investigator
This thesis would not have been possible without the help and support of many individuals
and organizations listed in the acknowledgements. My involvement in nutrition research began
in September 2003 during a year working as a junior doctor in the Paediatric Department of the
College of Medicine, Queen Elizabeth Central Hospital, Malawi. Following a Public Health for
Developing Countries MSc at the London School of Hygiene & Tropical Medicine (2004-5), I
returned to Malawi in January 2006. Again full time in-country and working as a clinician in the
paediatric department, mainly on ‘MOYO’ nutrition ward, I was also principal investigator of
PRONUT, the core study of my PhD. I was responsible for developing and implementing an
earlier version of the PRONUT protocol. This involved managing a ward-based research team,
developing detailed clinical protocols, data collection instruments and the study database. I also
expanded the scope of the study beyond its originally perceived remit. When it became
apparent that long term patient follow-up was important both to PRONUT and its several sub-
studies, I was co-applicant for a UNICEF grant funding the FUSAM study. I was responsible for
the PRONUT / FUSAM database and led the major data analysis described in this thesis. For the
published version of PRONUT I was lead author, writing the first version of the paper, co-
ordinating and editing inputs from co-authors and submitting the final version.
19
Chapter 1
Severe Acute Malnutrition –
Background
1.1 Global epidemiology and impact of malnutrition
Child malnutrition is a major international public health problem with consequences for both
individuals and societies. Of 555 million children aged 0 to 5 years living in developing
countries(1):
177 million (32.0%) are stunted (=chronic malnutrition)
19 million (3.5%) are severely wasted (=severe acute malnutrition)
112 million (20.2%) are underweight (=mixed malnutrition)
Box 1 Malnutrition burden of disease in developing countries.
Source: Lancet Nutrition Series, 2008
The importance of malnutrition highlighted by a role in 6 of 8 Millennium Development Goals
(MDGs)(5),(6):
• MDG 1 (Eradicate extreme poverty and halve hunger) and MDG 4 (Reduce child mortality)
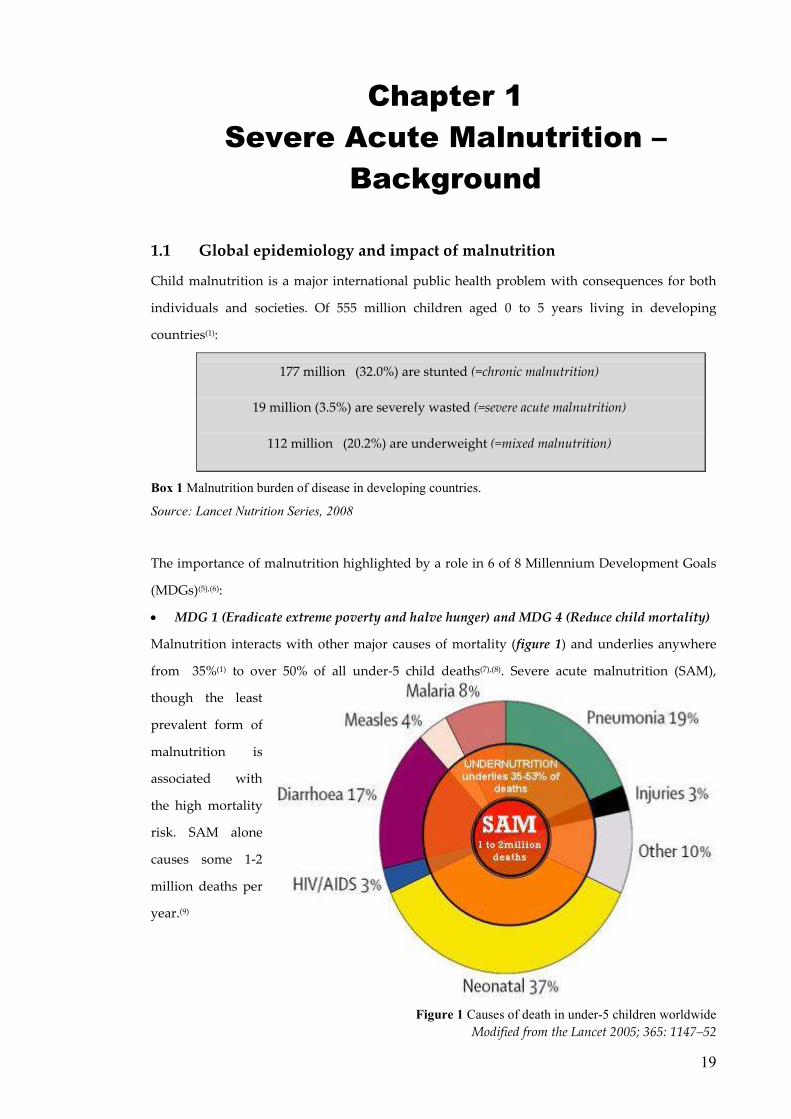
Malnutrition interacts with other major causes of mortality (figure 1) and underlies anywhere
from 35%(1) to over 50% of all under-5 child deaths(7),(8). Severe acute malnutrition (SAM),
though the least
prevalent form of
malnutrition is
associated with
the high mortality
risk. SAM alone
causes some 1-2
million deaths per
year.(9)
Figure 1 Causes of death in under-5 children worldwide
Modified from the Lancet 2005; 365: 1147–52
20
Malnutrition also has implications for:
• MDG 2 - Universal primary education: malnutrition impairs school performance(10);
• MDG 3 - Gender equality: malnourished girls are less likely to stay in school and receive
the education so vital to their empowerment(11);
• MDG 5 - Maternal Health: malnourished girls not reaching their full adult physical
potential are at increased risk of maternity-related problems(12);
• MDG 6 - Combat HIV/AIDS, malaria & other diseases: nutrition and infection interact:
malnutrition can increase vulnerability to and severity of infection; infection can contribute
to a worsening of malnutrition(13),(14)
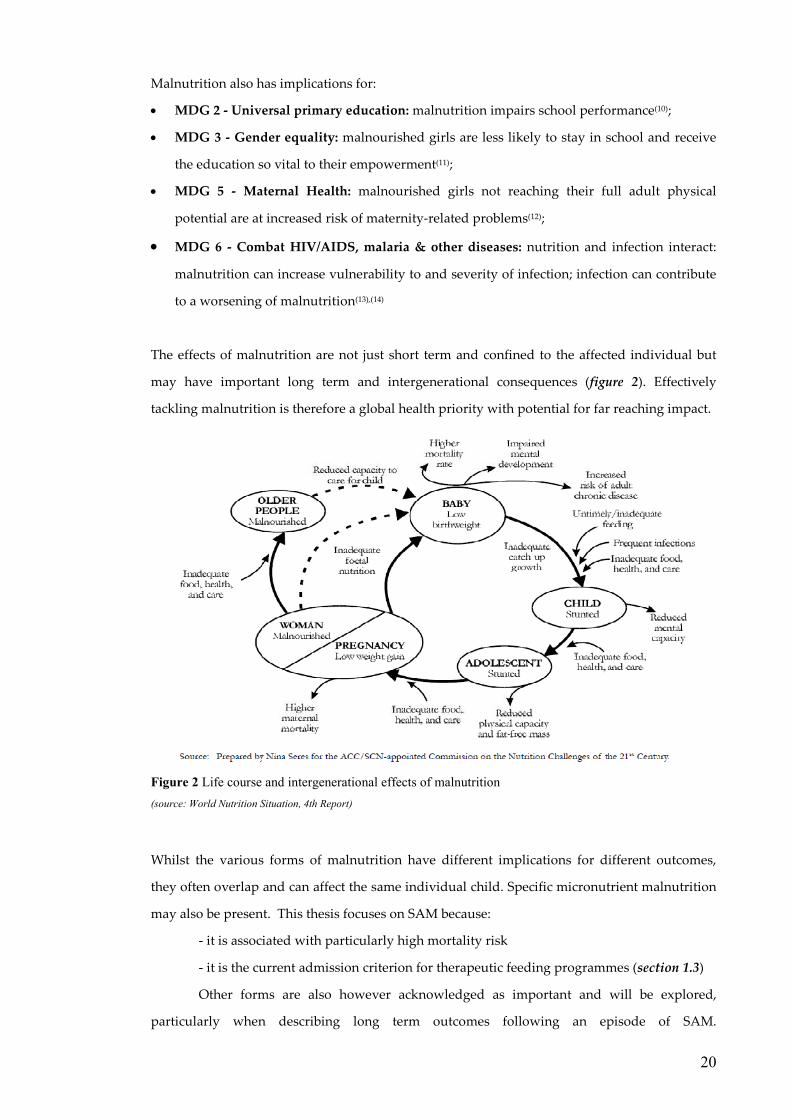
The effects of malnutrition are not just short term and confined to the affected individual but
may have important long term and intergenerational consequences (figure 2). Effectively
tackling malnutrition is therefore a global health priority with potential for far reaching impact.
Figure 2 Life course and intergenerational effects of malnutrition
(source: World Nutrition Situation, 4th Report)
Whilst the various forms of malnutrition have different implications for different outcomes,
they often overlap and can affect the same individual child. Specific micronutrient malnutrition
may also be present. This thesis focuses on SAM because:
- it is associated with particularly high mortality risk
- it is the current admission criterion for therapeutic feeding programmes (section 1.3)
Other forms are also however acknowledged as important and will be explored,
particularly when describing long term outcomes following an episode of SAM.

1.2 Case definitions of
Severe acute malnutrition
oedematous malnutrition
SAM is treated, details of the case definition have
1.2.1 ‘Classical’ WHO
In the seminal 1999 guideline
and other senior health workers”
Weight-for-height <
Box 2 World Health Organization (1999) definition of SAM
At the time, the median was based on
references. Weight-for height <70%
SAM. This is similar but not identical to
population nutritional status
for possible entry to feeding and other treatment
1.2.2 ‘Modified’ definition
In a 2003 letter to the Lancet, Collins & Yates
WHO definition. The aim was to differentiate between children who could be safely treated
outpatients and those who needed
considered alongside anthropometric
Case definitions of Severe Acute Malnutrition
evere acute malnutrition (SAM) encompasses both wasting (loss of
tous malnutrition, commonly known as kwashiorkor. Reflecting
, details of the case definition have evolved over recent years:
WHO definition
seminal 1999 guideline, “Management of severe malnutrition: a manual for
and other senior health workers”(15), the World Health Organization define
height <-3 standard deviations (z-scores) from a reference median
(WHZ<-3)
or
oedematous malnutrition
World Health Organization (1999) definition of SAM
At the time, the median was based on National Centre for Health Statistics (NCHS) growth
for height <70% of the median (<70% WHM) was also recognised
but not identical to WHZ <-3. Whilst the former
al status, WHM became the commonest criterion for assessing individual
for possible entry to feeding and other treatment programmes(16).
‘Modified’ definition - complicated and uncomplicated SAM
In a 2003 letter to the Lancet, Collins & Yates(17) proposed an important modification to
WHO definition. The aim was to differentiate between children who could be safely treated
outpatients and those who needed more intensive inpatient care.
considered alongside anthropometric status:
In this new classification, children with
moderate acute malnutrition (70% to <80%
WHM or -3 to -2 WHZ)
were also considered
care.
Figure 3 Complicated and uncomplicated
malnutrition
Source: Adapted from FANTA Technical note
8. Community-based Therapeutic Care.
Grobler-Tanner & Collins, 2004
21
loss of body mass) and
Reflecting changes in the way
over recent years:
“Management of severe malnutrition: a manual for physicians
rganization defined SAM as:
reference median
National Centre for Health Statistics (NCHS) growth
of the median (<70% WHM) was also recognised as defining
was ideal for reporting
for assessing individuals
proposed an important modification to the
WHO definition. The aim was to differentiate between children who could be safely treated as
inpatient care. Clinical features were
n this new classification, children with
moderate acute malnutrition (70% to <80%
2 WHZ) and complications
also considered eligible for inpatient
Complicated and uncomplicated
Adapted from FANTA Technical note
based Therapeutic Care.
Tanner & Collins, 2004(18)

22
1.2.3 Mid-upper Arm circumference
Mid-upper arm circumference (MUAC) reflects muscle and subcutaneous fat mass and is a
useful marker of acute malnutrition. Evidence suggests strong associations between low MUAC
and high mortality(19). Whilst not noted in the WHO 1999 guidelines, many countries and
organizations currently use MUAC <110mm as an independent criterion defining SAM in
children aged 6 to <60 months(16). A major advantage is simplicity and suitability for community
health workers who are increasingly engaged in field-based case finding. With new WHO
growth standards, the threshold has been changed from <110mm to <115mm(20) (see below).
1.2.4 World Health Organization Child Growth Standards(21)
In 2006, WHO released new growth curves aiming to set an international standard of how
children “should grow when free of disease and when their care follows healthy practices such
as breastfeeding and non-smoking”(22). A May 2009 joint statement from WHO and UNCIEF
endorsed the new standards for identifying SAM(20). Whilst they are a considerable technical
improvement on the old growth references(23), it is important to recognise key differences
between NCHS and WHO-defined SAM, notably in terms of potential clinical caseload(16):
Table 1 NCHS and WHO growth norms used to define SAM
NCHS WHO
KEY CHARACTERISITICS
Type of growth curve Reference Standard
ACUTE MALNUTRITION CASE DEFINITIONS
Oedematous malnutrition =
SAM (irrespective of
weight-for-height)
Yes Yes
SAM (% of median) <70% weight-for-height
(WHM)
not used
SAM (z-score) <-3z weight-for-height
(WHZ)
<-3z weight-for-height
(WHZ)
MUAC-defined SAM
( 6 to <60m children)
<110mm <115mm
IMPLICATIONS FOR CLINICAL CASELOAD
relative numbers of 6 to <60 month children diagnosed with:
SAM, as defined by:
WHZ (NCHS) to WHZ (WHO)
1 (reference) Increase in numbers
diagnosed
( 2 to 4x increase )(20)
SAM defined by:
WHM (NCHS) to WHZ (WHO)
1 (reference)
Large increase in numbers
diagnosed
( 8x increase in one study )(24)

23
1.2.5 Case definition of SAM used in this thesis
The fieldwork described in this thesis was done in Malawi from January 2006 to September
2008. At this time, Malawi national guidelines(25) defined SAM as:
Weight-for-height <70% median (NCHS references)
or
kwashiorkor (oedematous malnutrition)
or
MUAC <11cm
Box 3 Case definition of SAM used in this thesis (following Malawi National Guidelines)
This definition is consistent with international best practice. Also consistent with international
best practice, summary anthropometry in this thesis is expressed mainly as z-scores. As will be
described in detail in chapter 3, National guidelines recognised complicated and uncomplicated
SAM but the study setting at the time had no separate outpatient centres for direct treatment of
uncomplicated disease. Children with uncomplicated SAM were thus admitted and treated
together with children who had SAM plus complications.
1.2.6 Why case definition matters
The reason for reviewing case definitions is to emphasise that each will select a slightly different
group of patients. Since nutritional status is a continuum, diagnosing a discrete category of
SAM is inevitably challenging. Though anthropometry is key, it is not anthropometry that
matters most. What matters is that it reflects other more important processes and risks, notably
risk of death (see figure). Declining weight-for-height is related to(26) but not synonymous
with(17) increasing risk of mortality. Implications of newer SAM definitions will be discussed in
chapter 6. For now, it is important only to note that findings based on one group should only be
generalised to another with caution.
Figure 4 Conceptual illustration of continuous processes and discrete categories in 'malnutrition'
Shaded arrow indicates the progressive nature of the risks. The boxes indicate that for practical programme use, categories necessary.
severe acute malnutrition
normally nourished
mild / moderate acute malnutrition
well Moderately impaired physiology ���� increased disease vulnerability
( appetite OK )
Severe impaired physiology ���� high risk of illness ( appetite decreased )
Clinical
status
Nutritional
status
DEATH Risk of
death

1.3 Treatment programmes for
Approaches to SAM have
PhD fieldwork. To contextualise
to different types of treatment programme,
1.3.1 Conceptual frameworks and r
Ideal strategies for tackling SAM involve a range of approaches, with resources allocated in
proportion to cost-effectiveness and impact.
problem can be tackled at three
• Primary prevention
• Secondary prevention
• Tertiary prevention
These can also be understood using
Figure 5 UNICEF conceptual framework for malnutrition
(Source: State of the World’s Children 1998)
Treatment programmes for childhood SAM
Approaches to SAM have evolved considerably over recent years, even over
contextualise the research results in this thesis and their potential application
to different types of treatment programme, this section gives an overview o
Conceptual frameworks and root causes
Ideal strategies for tackling SAM involve a range of approaches, with resources allocated in
effectiveness and impact. A public health perspective recognises that
can be tackled at three levels(27):
revention = reducing the development (incidence) of SAM
Secondary prevention = reducing prevalence of SAM by earlier detection of or better
treatment shortening the duration of an episode of
malnutrition
Tertiary prevention = reducing the negative impacts of established SAM
n also be understood using the UNICEF conceptual framework below:
UNICEF conceptual framework for malnutrition
(Source: State of the World’s Children 1998)
24
over recent years, even over time spanning this
their potential application
this section gives an overview of common strategies.
Ideal strategies for tackling SAM involve a range of approaches, with resources allocated in
A public health perspective recognises that the
= reducing the development (incidence) of SAM
lier detection of or better
treatment shortening the duration of an episode of
impacts of established SAM
the UNICEF conceptual framework below:

25
1.3.2 The Pathophysiology of SAM
Understanding the pathophysiology of SAM is key to optimising its treatment. Whilst some
details remain to be elucidated (e.g. why kwashiorkor is more common in some populations
than others; what is its exact cause(28)), many features are well understood and help shape and
guide treatment strategies. The main features of SAM are outlined in detail in J.C.Waterlow’s
authoritative book “Protein-Energy Malnutrition”(29) and are summarized from that source
below:
• “A child with SAM is not just a scaled-down version of a normal child and must be
treated accordingly.
• When deprived of ‘normal’ nutrition over a period of time, the body often ‘adapts’,
to the new state with changes in metabolism, structure and organ function.
• There is preferential loss of muscle, fat and probably of skin (tissues which in
resting state have relatively low metabolic activity) whilst essential organs like the
brain are relatively well preserved.
• Electrolyte and mineral balance is often disturbed. e.g. serum potassium levels are
low; total body sodium is high but there is a paradoxical tendency to serum
hyponatremia (a very poor prognostic sign); serum and urine phosphorous is low
• Anaemia is common (though different studies suggest different underlying causes)
• There are adverse effects on organ structure and function:
o Cardiac impairment: with corresponding risk of cardiac failure
o Liver impairment: notably if there are fatty infiltrations (fatty liver is often
associated with kwashiorkor but is also found in marasmus)
o Reduced pancreatic enzyme production
o Impaired gut function: due to a multiplicity of causes ranging from a
damaged epithelium to disturbed gut microflora and leading to several
effects including reduced absorptive capacity and weakened immune
barrier function
o Impaired renal function: including a reduced ability to excrete acid and
sodium and a reduced ability to concentrate urine
o Skin changes: most notably the ‘flaky paint dermatosis’ of kwashiorkor
o Impaired nervous system structure and function (though the brain is
relatively protected from nutritional adversity, it is important to note that
the protection is not absolute)
• There are important metabolic changes, including impaired capacity for heat
production, with corresponding higher risk of hypothermia
• Endocrine changes include:

26
o Those that reflect or determine short term issues e.g. impaired insulin
function and impaired ability to manage blood sugars leading to risk of
hypoglycaemia; increased glucocorticoid production
o Those that influence long term growth e.g. thyroid hormone and
somatomedin
• Trace elements are often depleted and can contribute to poor overall outcomes e.g.
selenium, zinc and vanadium(30),(31)
• The immune system is impaired and contributes to greater vulnerability to
infection; greater potential severity of infection; altered manifestations of infection
(e.g. children with severe SAM may not be able to mount a febrile response as
would be normal).”
Treatment strategies, notably those pioneered at the Tropical Metabolism Research Unit in
Jamaica in the 1970’s to 1990’s recognised and took account of these pathophysiological
features. Excellent outcomes were achieved by a multifaceted approach which directly
addressed the core problems e.g.:
• Specially formulated feeds which take into account common micronutrient and
electrolyte deficiencies as well as energy and protein needs
• A ‘phased’ approach to treatment whereby a physiologically vulnerable child is
first ‘stabilized’ before moving onto a more nutrient-dense ‘recovery phase’ diet
• Careful rehydration to avoid fluid overload and potential death from heart failure
• Routine antibiotics in light of the high infection risk
This structured, pathophysiologically-informed approach was eventually taken up by the
World Health Organization and became the basis of the “10 steps” treatment guideline
described in the next section (see in particular table 2).
The same pathophysiological understanding still underpins all current treatments for SAM.
Since appetite is affected by and thus becomes a clinically useful proxy of the severity of
pathophysiological compromise, it is one of the key clinical features used to assess children at
admission to treatment. A poor or absent appetite reflects a vulnerable and sick child with
complicated SAM (see figure 3) in need of intensive inpatient treatment and close monitoring.
In contrast, an active appetite reflects a child with uncomplicated SAM: he/she may have
anthropometrically defined SAM but is clinically stable enough to be considered for home-
based treatment.

27
1.3.3 Therapeutic & Supplementary Feeding Programmes (TFP & SFP)
Therapeutic Feeding Programmes (TFPs) are the mainstay of current SAM treatment. They
focus on established SAM (tertiary prevention), though in-programme activities such as health
education may have secondary and primary preventive effects on SAM recurrence in the same
family or community. The aim of a TFP is to minimise mortality and morbidity by restoring
normal nutritional status.
An important part of the TFP treatment package is a diet of therapeutic food. This is
defined by a micro and macronutrient content specially formulated for SAM(9). As indicated by
the pathophysiology of SAM, other treatments such as antibiotics for infection are also essential
and are provided as routine.
Supplementary Feeding Programmes (SFPs) are closely related to TFPs but focus on
moderate acute malnutrition (MAM). Similar to TFPs, they aim to restore normal nutritional
status through provision of supplementary foods such as corn-soy blend. Numbers of children
affected by MAM are considerably greater than by SAM and SFPs are thus important in their
own right. Individual mortality risk is however lower, so the general approach is outpatient
based and less intensive. Relevant to this thesis, SFPs serve two key roles:
• In an ideal setting, SFPs would prevent severe wasting because they would enrol and
treat children before their malnutrition becomes severe. (Pre-empting kwashiorkor
would be more difficult given no clearly defined prodromal phase to predict which
children will develop disease)
• Following successful therapeutic treatment of SAM, children are often referred to an
SFP. In this role, SFPs monitor continued wellbeing and aim to prevent relapse. If such
a SFP ‘safety net’ is not present, some TFPs keep children enrolled for longer or adjust
their discharge criteria to a higher weight-for-height target.

28
1.3.4 Inpatient TFPs – Therapeutic Feeding Centres ( Nutritional Rehabilitation Units)
Traditionally, children with SAM are treated in inpatient TFPs called therapeutic feeding
centres (TFCs) or nutritional rehabilitation units (NRUs). Focus is on case management of the
individual patient. WHO’s 1999 guideline, “Management of severe malnutrition: a manual for
physicians and other senior health workers” is a key resource describing the main features of
TFC care(32). It is based on the pathophysiological understandings described in section 1.3.2.
Phased treatment is central
to the strategy. This
recognises that children
with SAM are vulnerable
and often have very
compromised physiological
systems which need to
recover slowly.
Picture 1 Inpatient TFC in
Malawi (the setting of this
PhD research)
Nutritional treatment in the ‘stabilization phase’ (also known as ‘phase 1’) uses ‘F75’
milk. ‘Rehabilitation’ or ‘phase 2’ progresses to more nutrient dense ‘F100’ milk feeds. Some
protocols suggest an intermediary ‘transition phase’.
F75 and F100 milks can either
be:
- locally made using
commonly available
ingredients fortified with a
micronutrient mix
- imported as a dry powder
‘formula’ milk which needs
reconstitution in heated
water.
Picture 2 Distributing therapeutic milk
29
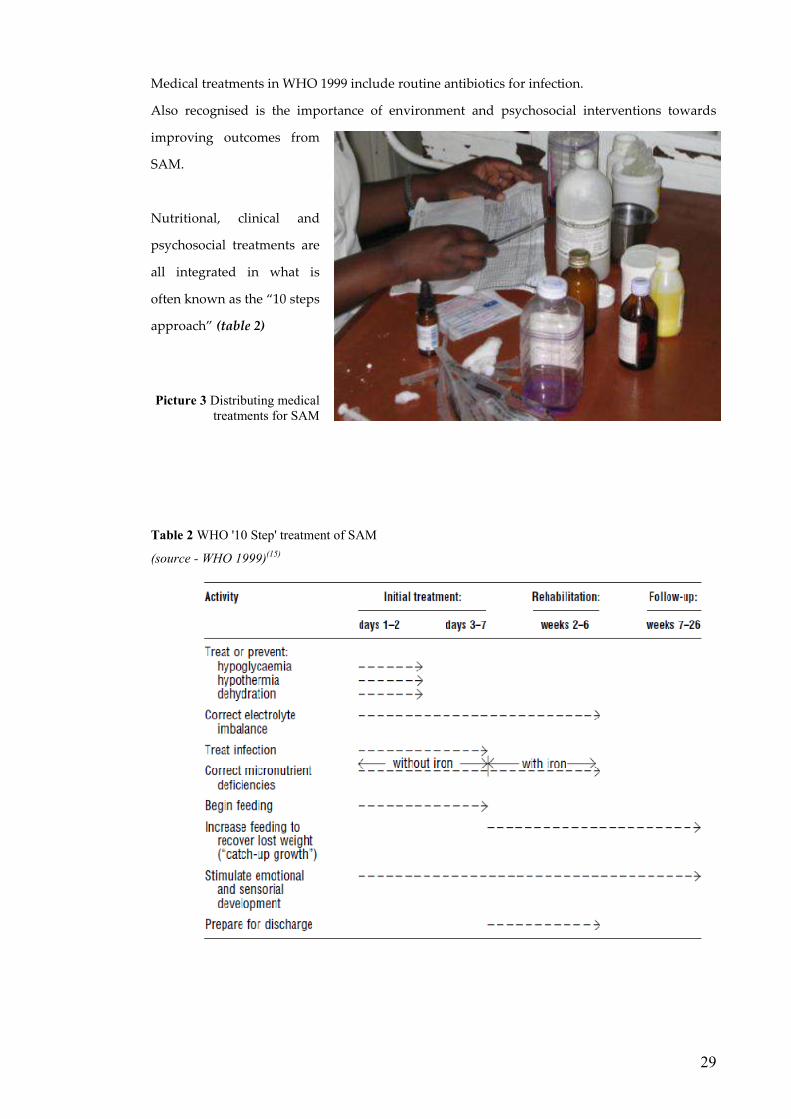
Medical treatments in WHO 1999 include routine antibiotics for infection.
Also recognised is the importance of environment and psychosocial interventions towards
improving outcomes from
SAM.
Nutritional, clinical and
psychosocial treatments are
all integrated in what is
often known as the “10 steps
approach” (table 2)
Picture 3 Distributing medical
treatments for SAM
Table 2 WHO '10 Step' treatment of SAM
(source - WHO 1999)(15)

30
1.3.5 Community Management of Acute Malnutrition (CMAM)
CMAM (originally and still often known as CTC, Community-based Therapeutic Care(33)) is an
integrated TFP strategy which combines with and complements WHO (1999) by focusing on
population coverage(18),(34). It aims to maximise public health impact by treating large numbers
of SAM-affected children. The modified SAM classification is used to distinguish between:
• Sick children (‘complicated’ SAM) who need intensive inpatient care
• Clinically stable, well children (‘uncomplicated’ SAM) who can safely be treated at
home
Though community-based approaches to SAM are not new(35), CTC was the first to formalize a
detailed strategy and framework(36),(18) Key features of the treatment model are(34):
• Access & high coverage - Large numbers of treatment centres ensure easy
access and consequent high programme coverage.
• Timeliness - Active case finding aims to recognise and treat
children before they develop complicated SAM. Most
can thus be admitted to the ‘Outpatient Treatment
Programme’ (OTP). The few with complicated SAM go
via inpatient ‘stabilization centres’ (SCs). Once
clinically improved/stable, they are transferred to the
OTP to complete their treatment
• Sectoral integration - CTC aims to integrate with other programmes (such
as supplementary feeding programmes) and address
wider factors underlying malnutrition.
• Capacity building - CTC aims to empower and encourage local
communities, and existing structures and networks.
The basic principles of CTC/CMAM have since been incorporated into numerous national SAM
guidelines and in 2007 were
endorsed by major UN
agencies(9). The structure of
and ‘flow’ through a typical
programme is illustrated:(37)
Figure 6 Structure of and patient
'flow' within a CMAM TFP
(source Valid CTC Manual,
2006)(37)
Default
31
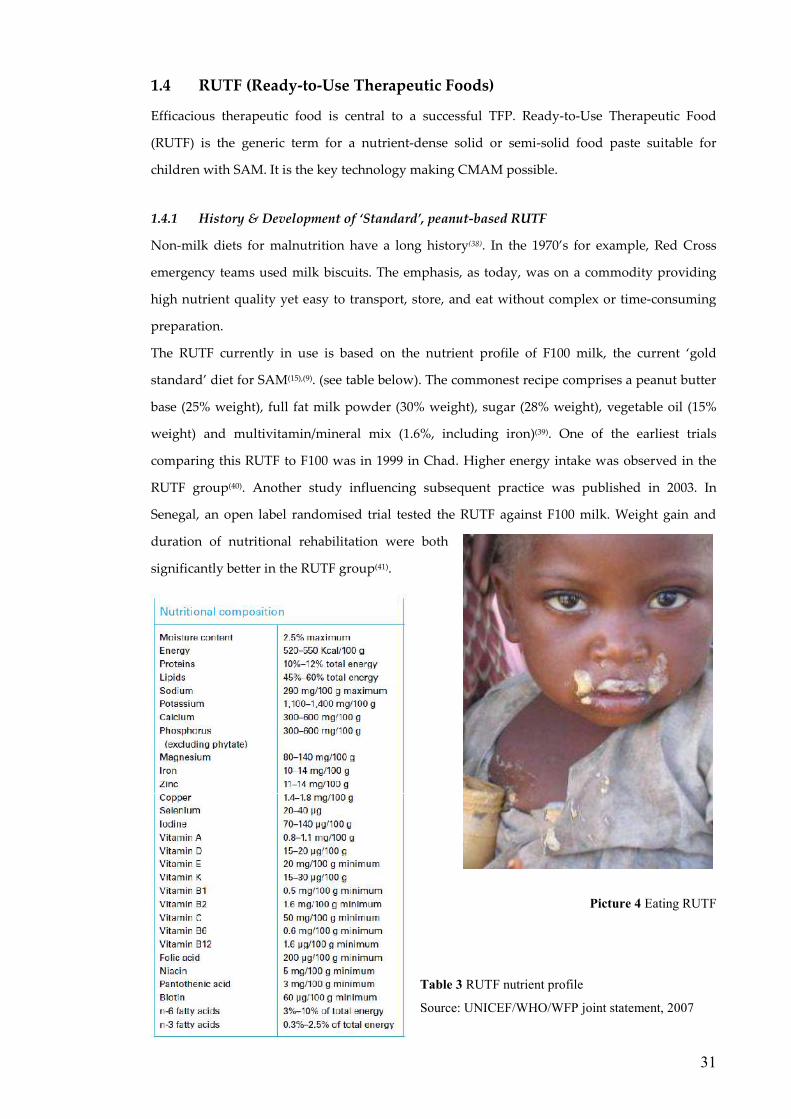
1.4 RUTF (Ready-to-Use Therapeutic Foods)
Efficacious therapeutic food is central to a successful TFP. Ready-to-Use Therapeutic Food
(RUTF) is the generic term for a nutrient-dense solid or semi-solid food paste suitable for
children with SAM. It is the key technology making CMAM possible.
1.4.1 History & Development of ‘Standard’, peanut-based RUTF
Non-milk diets for malnutrition have a long history(38). In the 1970’s for example, Red Cross
emergency teams used milk biscuits. The emphasis, as today, was on a commodity providing
high nutrient quality yet easy to transport, store, and eat without complex or time-consuming
preparation.
The RUTF currently in use is based on the nutrient profile of F100 milk, the current ‘gold
standard’ diet for SAM(15),(9). (see table below). The commonest recipe comprises a peanut butter
base (25% weight), full fat milk powder (30% weight), sugar (28% weight), vegetable oil (15%
weight) and multivitamin/mineral mix (1.6%, including iron)(39). One of the earliest trials
comparing this RUTF to F100 was in 1999 in Chad. Higher energy intake was observed in the
RUTF group(40). Another study influencing subsequent practice was published in 2003. In
Senegal, an open label randomised trial tested the RUTF against F100 milk. Weight gain and
duration of nutritional rehabilitation were both
significantly better in the RUTF group(41).
Picture 4 Eating RUTF
Table 3 RUTF nutrient profile
Source: UNICEF/WHO/WFP joint statement, 2007

32
1.4.2 The potential role of alternative recipe RUTF
Peanut-based RUTF (also widely known under the largest manufacturer’s trade name,
Plumpy’nut) remains dominant in CMAM programmes worldwide. This reflects the rapid and
recent evolution of CMAM. Much of the background research was conducted using the best
known, best validated, formulation described in Chad(40) & Senegal(41). As programmes have
scaled up, so has the manufacturing capacity and demand for this same peanut RUTF. So
however have questions about alternative recipes.
Three issues underlie discussions about alternative RUTF recipes:
i) Cost minimization
RUTF is the main cost component(42) of a CMAM feeding programme. Cheaper but equally
effective recipes would improve cost-effectiveness.
ii) Local ownership & local benefits
Peanuts are not as common or acceptable in all parts of the world as in the African countries
where the peanut RUTF recipe was first developed and tested. Alternative recipes based on
staples such as rice, chickpea or soya have the potential to better support local needs and local
markets(43),(44). Using local ingredients to benefit local economies and make locally tailored
RUTFs was one of the original principles underlying CMAM.
iii) Enhanced efficacy
Alternative recipes have the potential to improve on the efficacy of current ones. This is the
rationale behind addition of a functional food to standard RUTF in this thesis.
1.4.3 A note on RUTF (Ready-to-Use Therapeutic Food) & LNS (Lipid Nutrient Supplement)
terminology
Since this thesis was started, interest in “Ready to Use foods” has blossomed. With the growing
evidence-base underlining RUTF for SAM, investigators and programme managers have been
quick to try other plausible uses. These include for supplementary feeding, for HIV and for
primary prevention of malnutrition. Lacking alternatives, the RUTF recipe originally described
for SAM has been used for all these purposes. RUTF should however have a very precise use
and meaning as a therapeutic food for SAM alone – this is how it is used in this thesis.
Expanded uses do though need to be recognized. This is because functional additives, as
explored in PRONUT may be relevant to conditions other than SAM.

33
“Ready-to-Use” food is a generic term, subsets of which include:
• RUTF = ready-to-use THERAPEUTIC food – for SAM
• RUSF = ready-to-use SUPPLEMENTARY food – for MAM
• RUCF = ready-to-use COMPLEMENTARY food – for general use as a
complementary food or for preventing malnutrition
• RU_F-H = any of the above for HIV
Ideally these would all be tailored to the particular needs of their patient group. Such work is
ongoing.
Lastly, lipid-nutrient supplement (LNS) nomenclature needs to be noted as its use is
increasing. LNS are defined as multiple micronutrient supplements which have lipid as the
primary source of energy(45). RUTF described in this thesis is therefore a type of LNS.
1.5 Evidence gaps towards improved feeding programme impact
A 1996 review of SAM treatment outcomes reported case fatality rates averaging 20-
30% and sometimes as high as 50-60%(46). WHO 1999 guidelines were part of a successful
international initiative addressing the problem(47),(48). CMAM programmes have continued to
build on this success and report data supporting both low mortality and high programme
coverage(49). Given this existing evidence base for SAM treatment, some have argued that
rollout of existing technologies and interventions should now be the international health
priority(50, 51). In this thesis, I fully agree with that sentiment. I would add however that scaling-
up what is known is not incompatible with exploring what is not known. Knowledge gaps with
potential to improve public health impact remain and are the motivation behind the work
described.
1.5.1 What is the true public health impact of a TFP?
Most TFPs report outcomes when children are discharged from their care, typically after 2-3
months treatment. Good outcomes at this stage are important but not necessarily sufficient.
True public health impact depends on sustained, longer term benefit. Illustrating with an
extreme hypothetical example:
- Programme A has a 5% short term, in-programme mortality. Yet if a further 50% of children
die over the subsequent year, there is an obvious problem. This would not necessarily be
identified through routine reporting. Many TFPs have neither the systems nor resources for
long term follow-up.

34
- Programme B has a 30% in-programme mortality. Yet if only 5% of the survivors subsequently
die, then the public health impact is actually greater than in A.
To date, few studies have explored long term outcomes following an episode of SAM. The
FUSAM sub-project addresses this issue. Consistency with and differences from this limited
body of existing research will be discussed in chapter 6.
1.5.2 Can poor outcomes in an HIV prevalent setting be improved?
HIV is well recognised as having a major impact on both presentation and outcomes from
SAM(52). A recent meta analysis shows mortality among HIV infected children with SAM to be
consistently and significantly higher than in those without underlying HIV. (30.4 vs. 8.4%, RR =
2.81, 95% CI 2.04—3.87)(53). Interventions with the potential to improve SAM outcomes in HIV
prevalent settings are therefore important(4): PRONUT describes the potential of functional food
to fulfil this role.
Second, improving SAM outcomes in an HIV prevalent setting requires better
understanding of factors, apart from the HIV itself, which are associated with good or adverse
results. FUSAM addresses this question.
1.5.3 Is there potential for RUTF enhanced by functional food to improve TFP outcomes?
There is increasing international interest in the claim of ‘functional foods’ to confer “health
benefits beyond the provision of essential nutrients.”(54),(55),(56),(57). The PRONUT sub-study
explores the effect of:
• Probiotics - “A preparation of, or a product containing, viable, defined
microorganisms in sufficient numbers, which alter the microflora in a compartment
of the host and by that exert beneficial health effects.”(58)
and
• Prebiotics - “a non-digestible food ingredient that beneficially affects the host by
selectively stimulating the growth and/or activity of one or a limited number of
bacteria in the colon.”(58).
Recognising different but potentially synergistic effects, preparations of pre and probiotics
together are termed “Synbiotics”(58).
For some conditions like diarrhoea, evidence of functional food effect is strong and
based on high quality evidence, notably meta-analysis of randomized controlled trials(59),(60).
Most research however focuses on high income developed countries - where product sales are
high, some $16 billion USD per year for probiotics alone(61). Few studies are set in low income
developing nations - where it is SAM and preventable mortality that are high(62). This represents

35
an important research gap. There are several reasons, all underpinning the PRONUT study,
why functional foods may have a role in the treatment of SAM:
i) Likelihood of benefit via known mechanisms of action
In other patient groups, probiotics and prebiotics are known to have several effects,
including:
• Probiotics preventing diarrhoea (reducing incidence): in 2006 meta-analysis, diarrhoea
of diverse causes was reduced by 34% (95% CI 8% to 53%) and antibiotic associated
diarrhoea by 52% (95% CI 35% to 65%)(60).
• Probiotics for treating diarrhoea (reducing adverse impact and prevalence): the authors
of a 2004 Cochrane review concluded that “Probioics appear to be a useful adjunct to
rehydration therapy in treating acute, infectious diarrhoea” (59). The evidence
underpinning this statement was: reduced risk of diarrhoea at 3 days (relative risk 0.66,
95% CI 0.55 to 0.77); reduced duration of diarrhoea by a mean of 30.5 hours (95% CI
18.5 to 42.5 hours).
• Prebiotics can promote a healthy gut flora: encouraging the growth of ‘good’ organisms
and competitively excluding potentially pathogenic ones(63);
• Probiotics can directly and indirectly modulate the immune system(64). They do this at 3
levels: general (producing nutrients and anti-oxidants); humoral (stimulating IgA
production; inhibiting IgE production; modulating cytokine responses); cellular
(stimulating macrophage and natural killer cell function and promoting growth and
regeneration)
It is biologically plausible that these benefits shown in other patient populations would also
apply to children with SAM. The actions are certainly relevant to SAM, in which the following
are common problems:
• impaired gut function, manifest as diarrhoea and malabsorption(65),(66);
• small bowel overgrowth(67);
• increased intestinal permeability(68),
• enteropathy(69);
• gram negative (enteric) bacteraemia(70),(71);
• suboptimal immune response(72),.
ii) Potential for public health impact
Because CMAM programmes focus on high coverage(34) improved RUTF with even
modest benefits to individual patients could translate to very substantial impacts at public
health level.

36
iii) Concerns about probiotic use in immune compromised populations
Because of the small risk of probiotics causing invasive infection(73), caution is
sometimes recommended in immune compromised patients(74). Better risk-benefit data is vital:
the most vulnerable, most immune-suppressed children with SAM(75) and with HIV(76) are also
those most needing therapeutic improvements.
iv) Availability of a ‘delivery vehicle’ for functional additives: Ready-to-Use Therapeutic Foods (RUTF)
RUTF is a high energy, nutrient dense paste, formulated to WHO standards for the
treatment of SAM(41). It is used in almost all CMAM programmes. As the product is
manufactured in food processing factories and packaged in hermetically sealed containers,
inclusion of functional additives to the standard RUTF recipe can be readily achieved and has
potential for large-scale rollout in feeding programmes.

Page 37
Chapter 2
Aims & Objectives
2.1 Hypotheses
In the two studies described in this thesis, two key factors influencing SAM mortality in a treatment
programme are explored:
i) Treatment efficacy
Therapeutic food is a key intervention in a treatment programme for SAM. Improved
therapeutic food therefore has the potential to improve outcomes.
Hypothesis arising:
i. In an HIV prevalent setting, addition of a pre/probiotic functional food (Synbiotic 2000
Forte™) to a standard diet of Ready-to-Use Therapeutic Food (RUTF) will improve
outcomes from an episode of SAM.
ii) Patient characteristics
If intervention efficacy is held constant or cannot be further enhanced, programme outcomes
might still be improved by addressing patient-related risk factors. Understanding the impact of
characteristics like nutritional status at admission, clinical status, family and socio-economic
status will enable future programmes to better plan and respond to patient needs.
Long term outcomes are of particular relevance since these best reflect the true public health
impact of treatment. (i.e. minimizing long term mortality and morbidity are the most important
programme goals but may not necessarily be reflected by short term, in-programme outcomes)
Hypotheses arising:
i. Short term and medium term outcomes, as routinely reported by therapeutic feeding
programmes, adequately reflect long term outcomes following an episode of SAM
ii. Post-SAM catch up growth is complete and comparable to family (sibling) controls
iii. a. Common risk factors underlie both short and longer term mortality
b. Access to post-SAM treatment services (supplementary feeding for all children and
TB / HIV services as clinically indicated) is associated with improved long term
outcomes
Page 38
2.2 Aims & Objectives
2.2.1 Study 1 – PRONUT (Pre and PRObiotics in the treatment of severe acute malNUTrition)
Aim
To determine the efficacy of a probiotic/ prebiotic functional food (Synbiotic2000 ForteTM) for
improving clinical and nutritional outcomes from SAM in a HIV prevalent setting
Objectives:
To determine whether addition of Synbiotic 2000 Forte™ to a standard Ready-to-Use Therapeutic
Food (RUTF) diet will result in:
i. A greater proportion of children achieving nutritional cure following SAM
ii. Reduced mortality from SAM
iii. Improvements to other programme-relevant clinical and nutritional outcomes:
a. less readmissions; less nutritional failures
b. improved weight gain;
c. shorter length of stay in-programme;
d. less diarrhoea and other clinical problems
2.2.2 Study 2 – FUSAM (Long term Follow-up after an episode of Severe Acute Malnutrition)
Aim
To describe long term (≥ 1 year post-discharge) mortality & morbidity following an episode of SAM
Objectives:
i. To describe the occurrence and timing of in-programme and post-treatment deaths
following an episode of SAM
ii. To describe the extent of catch-up growth in the year following an episode of SAM
iii. To identify risk factors for mortality from SAM:
a. Risk factors at original admission
b. Risk factors related to post-SAM care
c. To determine whether risk factors for short term mortality are similar to
those for late deaths

Page 39
Chapter 3
Setting, participants & methods
3.1 Setting
3.1.1 Malawi, the warm (but malnourished) heart of Africa
The research described in this thesis was set in MOYO (= ‘life’ or ‘health’ in the local language,
Chichewa) therapeutic feeding ward, Queen Elizabeth Central Hospital, Blantyre city, Blantyre
district, Malawi. Malawi is a densely populated, landlocked country whose 2008 GDP per capita of
$800 (purchasing power parity basis) ranks it 220th of 229 countries(77).. Of 13.9 million people, 85%
live in rural areas and work predominantly as smallholder farmers(78). Climate is sub-tropical with a
rainy season lasting from approximately November to May each year. The staple crop, maize, is
planted near the beginning of the rains and harvested around the time rains end.
Often and aptly described as “The Warm Heart of Africa”, Malawi also has a less welcome
reputation for high prevalence of malnutrition. The 2004 Demographic & Health survey reports:
• 22% of under-5 children are underweight
• 48% of under-5 children are stunted
• 5.2% of under-5 children are wasted & 1.6% are severely wasted
Consistent with this poor nutritional status,
under-5 mortality is 133/1000 live births.
The number of children affected by SAM
regularly peaks during the rainy season
(also the ‘hungry’ season) when:
- many families have to ration what little
food is still left over from last year’s harvest.
- incidence and prevalence of water related
diseases like malaria and diarrhoea peaks.
Together, these result in adverse nutrition-
infection interactions(79) and exacerbate
already prevalent background malnutrition.
Picture 5 Map of Malawi, showing Blantyre
Page 40
3.1.2 Therapeutic Feeding Programmes in Malawi
For many years, Malawi had a network of about 92 NRU-style inpatient therapeutic feeding
programmes. A poor harvest in 2001 was one of several factors resulting in a 2002 ‘famine’(80). This
renewed focus on tackling SAM.
In 2003, new national guidelines were developed, based on the WHO(1999) NRU model of
care. Ministry of Health, UNICEF and international NGO Action Against Hunger were key players
in a major national strategy of guideline dissemination, training and quality improvement.
Around 2003, some of the earliest community-based approaches to SAM were also being
developed in Malawi. A locally manufactured RUTF had been successfully produced and validated
– two key projects actually based in MOYO(81),(82). Operational research in central region was
pioneering the outpatient-based model of care central to CMAM(83). This growing evidence-base,
backed by inspired national and international leadership, resulted in Malawi being one of the first
countries to adopt a national CMAM strategy(25).
The shift from NRU-style to CMAM-style TFPs led to many programmes having to adapt
and evolve. MOYO was among those changing its approach to SAM. It illustrates a typical
transition process:(84)
• Up to 2003, care was fully inpatient based;
• In mid 2003; outpatient-based rehabilitation began, but with children returning to
MOYO rather than to a local OTP for review and RUTF collection;
• Just prior to this PhD, RUTF replaced F100 milk in transition phase.
• In mid 2008, (after PRONUT had finished but whilst long term FUSAM visits were
still under way) a full CMAM programme began in Blantyre district, continuing the
transition towards outpatient / public health focused treatment.

Page 41
3.1.3 MOYO nutrition ward, Department of Paediatrics, Queen Elizabeth Central Hospital,
College of Medicine, Blantyre.
‘Moyo’ nutrition ward for children with SAM is one of several paediatric wards of Queen Elizabeth
Central Hospital, Blantyre. Queen’s is the clinical base for the College of Medicine, Malawi’s only
medical school. As a teaching hospital, Queen’s is also a tertiary referral centre. However, though
the clinical and diagnostic expertise is greater than elsewhere in the country, there is not always
significantly more that can be offered in terms of medical treatments. Certainly for SAM, the clinical
caseload is thus more typical of a large district hospital than a tertiary referral centre†. According to
the 2008 National Census, the district served comprises an:
• Urban Blantyre population of 661,444
• Rural Blantyre population of 338,047
The network and distribution of health centres
in Blantyre district is shown opposite. Two
also have attached inpatient NRUs which
share the SAM caseload with MOYO.
Numbers admitted to these are small in
comparison.
Most malnourished children present either
direct to Queen’s or arrive via local health
centres after initial assessment by community-
based health workers.
Queens and Moyo are part of the government
health service and all services are provided
free of charge.
Figure 7 - Map of health centres and their
catchment areas in Blantyre district
(source: M.Kerac, from ArcView files obtained from the Malawi National Spatial Data Centre, Lilongwe)
The approximate area of urban Blantyre is outlined in grey.
Approximate scale of this map at the widest points is 80km North-South and 40km East-West
† The only exception to this are very small numbers of post-surgical patients referred to MOYO for nutritional
support.

Page 42
3.2 Study participants: the MOYO case definition of SAM
All patients admitted to MOYO nutrition ward were eligible for the PRONUT study and later for
FUSAM. Following Malawi National Guidelines(25) and consistent with international guidelines(9),
the MOYO admission criterion and case definition of SAM was:
• Weight-for-height <70% of median (NCHS reference)
or
• Mid-Upper Arm Circumference (MUAC) <11cm
or
• Kwashiorkor (oedematous malnutrition)
CMAM was only started in Blantyre district in 2008, so the distinction into complicated or
uncomplicated SAM was not applicable. All patients identified as having SAM were admitted for
initial inpatient treatment (see discussion, chapter 6 for generalizability implications). Also
sometimes admitted were a small number borderline SAM cases: mostly high risk children such as
those rapidly dropping down growth chart centiles or HIV positive and sick.
Picture 6 MOYO nutrition ward, Queen Elizabeth Central Hospital, Blantyre, Malawi

Page 43
ACCIDENT & EMERGENCY: Initial Assessment
Not malnutrition �
Sent to other paediatric ward or
home as appropriate
Severe Acute Malnutrition
Severe Acute Malnutrition but very sick,
needing intensive nursing
� initially admitted to ‘Special Care’ ward then transferred to MOYO once stable
MOYO nutrition ward
(Severe Acute Malnutrition)
but initially missed or develops during
time spend on another ward
� sent to MOYO for assessment and possible transfer
3.3 Study participants: the MOYO patient care pathway
3.3.1 Admission routes to MOYO
All children presenting to Queen’s hospital were first seen in the Accident and Emergency (A&E)
area. Here they were assessed, triaged and referred according to clinical indication:
Figure 8 Admission routes to MOYO nutrition ward
The thick line represents how most children are admitted to MOYO, dotted arrows represent occasional cases
Initial assessment in A&E included routine weight and clinical assessment, looking specifically for
oedema or visible wasting. Most SAM was thus identified and referred direct to MOYO. Borderline
cases of possible SAM were frequently sent to MOYO for definitive assessment: weight-for-height,
MUAC and oedema. Small numbers of patients arrived on MOYO via other paediatric wards.
3.3.2 Initial assessment and treatment in MOYO (including anthropometry)
This comprised:
i) Anthropometry
Measurement of weight, length and MUAC followed research standards(85). (see 3.6.1 for details)
ii) Clinical assessment
Every patient was assessed by a MOYO clinician as soon as possible after admission. If admitted
out-of hours, core details would be taken by the nurse in-charge or on-call doctor and full details

Page 44
completed the next day. This allowed important urgent treatment to be started immediately (e.g.
second or third line antibiotics)
iii) Early feeds whilst awaiting assessment
All children arriving on MOYO would be given an early feed of F75 milk. This was to minimise any
risk of hypoglycaemia whilst awaiting assessment and admission to the main ward.
3.3.3 Inpatient treatment
This comprised two main treatments delivered in parallel according to clinical indication:
a) Nutritional treatments
The quantity of therapeutic feeds, both milk and RUTF was adjusted according to the child’s weight
using standard charts in the national guidelines.
i) Stabilization phase (Phase 1)
All children were initially fed F75 therapeutic milk given every 3 hours, including overnight. This
“stabilization” phase lasted a minimum of 1 night.
ii) Transition phase (Tr)
Criteria for progression to transitional feeds were clinical improvement and return of active
appetite, defined as easily finishing the prescribed volume of F75 milk (as reported by main carer).
Consistent with new CMAM guidelines(37) but slightly different to WHO guidelines (which
recommend F100 milk for transitional phase), Ready-to-Use Therapeutic Food (RUTF)(41) was
introduced to the diet at this stage. A full RUTF prescription provided 200 kcal energy, per kg body
weight, per day. For a 7 kg child (median NRU admission weight) this was approximately 300g
RUTF/day. Recognising that not all children would be able or physiologically ready to eat the entire
RUTF target amount at this stage, F75 was continued. Mothers were instructed to give initially
small amounts of RUTF (e.g ½ teaspoonful every 3 hours, alongside the milk ration) and to
gradually increase that amount as guided by the child’s appetite. As a guide to what the full target
amount should ultimately be, they were each given a small ‘ticket’ with the number of RUTF pots
per day pictured, plus the same amount expressed as teaspoons per 3 hours. Feeding instructions
stressed that mothers should never to try to force the child to eat beyond what he/she demanded.
Page 45
Similar to phase 1, Tr lasted for a minimum of 1 night. (see appendix D for MOYO guidelines
on phase progression).
iii) Rehabilitation phase (Phase 2)
Active appetite reflects clinical improvement and again was the main criterion for moving forwards
from transition phase. When easily eating at least ¾ of his/her RUTF target ration, a child had by
definition moved him/herself onto phase 2 and hence this was a much more child / physiologically
led process - in contrast to traditional phase transition, when the in-change clinician made the
decision when the child was ready to move to phase 2. As long as clinically also well at this point,
the child was ready for transfer to home-based rehabilitation at the next available opportunity
(discharges from the ward were done twice a week).
During phase 2, free fluids and other foods (e.g. likuni phala – a popular local brand of maize-based
porridge fortified with micronutrients) were also allowed alongside the RUTF. F75 milk was
stopped at this stage.
b) Clinical treatments
These were given according to clinical indication and again followed standard guidelines. At
admission, all children had a PCV (packed cell volume, testing for anaemia) and thick film testing
for malaria. Transfusions were rarely done: usually only in cases where anaemia was both very
severe and clinically symptomatic.
All children had empirical antibiotic treatment with co-trimoxazole. In cases of presumed
sepsis, 2nd or3rd line antibiotics were also used. These are described in detail in chapter 4.2.4.
3.3.4 OTP (Outpatient) treatment
Once clinically well and on phase 2 feeds, children were transferred from ward-based care to
outpatient care, to complete their nutritional rehabilitation at home. They took home sufficient
RUTF rations and any other treatment needed (e.g. finishing a course of oral antibiotics)
At fortnightly intervals, they attended outpatient clinics at MOYO for clinical review and to
collect further rations of RUTF. During the study, transport money was reimbursed to minimise
defaulting.

Page 46
3.3.5 Discharge from MOYO TFP
Clinical cure was defined as 2 consecutive visits above or at the target weight of 80% WHM.
Minimum time spent in OTP to successful cure was thus 4 weeks (=2 fortnightly visits). On rare
occasions when a patient had lost weight since last visit but was still >80% WHM, he/she would still
be diagnosed cured but would be brought back for an extra OTP visit to ensure good subsequent
progress.
Maximum time on OTP was 10 weeks (=5 fortnightly visits). If still below target weight
(two consecutive visits at >80% WHM) by this time, a child would be deemed a ‘nutritional failure’
and referred elsewhere for further treatment. The commonest reason for such onward referrals was
HIV or disability. In most such cases nutritional failure was expected and the patient was referred
well in advance of final OTP visit so that transfer to follow-on services should be quick and smooth.
3.3.6 HIV & CD4 testing
Prevalence of HIV on MOYO was over 40%, compared to a national NRU average of 24%(86).
HIV counselling and testing was considered a key element of good patient care and was a
routine part of ward protocols. An opt-out policy was operated whereby all patients and their
carers were offered a test as soon as the child was stable enough to visit the upstairs office where
testing was done. This service was provided by a dedicated team separate to MOYO clinical and
study staff.
Testing protocols involved two ELISA rapid tests (Determine® and Uni-GoldTM), with a
third (Hema StripTM or SD-Bioline) for discordant results. With carer consent, results were stamped
in patient notes and made available to the clinical team in order to guide treatment and facilitate
further referrals as needed. PCR for definitive diagnosis in children <18 months of age was
unavailable. In such cases, cotrimoxazole antibiotic prophylaxis was always started on a
presumptive basis if a child was ELISA seropositive. Advice was given about the need for repeat
testing at >18 months age to get a definitive diagnosis. More complex clinical decisions - such as
whether to start antiretroviral medication - were made on a case-by-case basis. This happened if
other problems such as TB had been excluded or treated yet a child continued to deteriorate. The
timescale for such interventions was almost always after the patient had been discharged from

Page 47
MOYO care. Hence it was not relevant to PRONUT results and only relevant to very small numbers
of children in the FUSAM study.
In around November 2006, CD4 testing became available via a separate project running in
MOYO ward. Being part service provision, part operational research to help guide appropriate
referrals to HIV-related treatments, only HIV positive patients were tested. Testing was done at the
first outpatient visit so that results would be back for the second visit. Patients who died before first
visit would thus have no CD4 result available.
3.3.7 HIV treatment
The key reason for opt-out testing of children and carers was to facilitate timely referral to HIV
treatment services. HIV seropositive patients were treated according to national protocols. These
included referral for antiretroviral (ARV) medication based on clinical staging criteria (notably
persistent malnutrition despite treatment) and CD4 count if available. An ARV waiting list at the
time of the PRONUT study meant that additional inputs rarely started during initial nutritional
treatment.
All HIV positive patients were started on long term co-trimoxazole prophylaxis as soon as
diagnosed.
3.3.8 Other TFP-related services: SFP, TB, disability
Keeping patients monitored and acting as a safety net to prevent nutritional relapse, all patients
discharged from MOYO were referred to their nearest supplementary feeding centre for a further 4
months supplementary feeds. These were located at health centres distributed throughout the
district. SFP programmes used fortified corn-soy blend.
Other common referrals from MOYO were to TB and disability services. These gave specific
support and treatment following relevant protocols.
3.3.9 Patient flow summary & cohorts enrolled in PRONUT & FUSAM
The flow chart on the next page summarises patient flow through the SAM treatment programme.
Possible outcomes at each stage are shaded light blue. PRONUT focuses on medium term outcomes
as reported by most field programmes. FUSAM describes long term outcomes from the whole
cohort of patients originally admitted to the ward.

Page 48
Figure 9 Flow chart overview of SAM treatment with short, mid and long term outcomes
* Default is frequently cited by field programmes, but it is not definitive in the same way other outcomes. It is
the outcome cited when no other can be determined. Common reasons for default include death or clinical
improvement, so that the carer perceives no reason to return for further formal follow-up.
Admission to
MOYO nutrition ward
� Inpatient Death
� Successful transfer to OTP
Inpatient treatment: Phase 1 (F75 milk feeds)
�
Transitional phase (F75 + RUTF) �
Phase 2 (RUTF feeds)
� OTP death
�Readmission
� Transfer out � Treatment
failure � Defaulter*
���� Alive
well or still sick
���� Death
���� Alive
well or still sick
���� Death
���� Alive
well or still sick
� Transfer out � Absconder
���� Alive
well or still sick
Long term outcomes
( ≥1 year after 1st admission)
Short term (inpatient) outcomes
Medium term (OTP)
outcomes
Outpatient treatment programme (OTP):
RUTF feeds
Fortnightly review @ MOYO
� Nutritional cure
���� Death
���� Death

Page 49
3.4 Methods: quality control systems
Several aspects of study methodology are specific to either PRONUT or FUSAM and are described
in their respective chapters. Common to both studies are quality control systems described here:
3.4.1 Anthropometry
High quality anthropometry is important for nutrition-focused research. For both PRONUT and
FUSAM the following equipment was used and measures taken to optimise data quality:
a) Weight measurement - scales
Children were weighed naked (or with underclothes only for older children) on Tanita 1582
digital scales accurate to 20 grams. These were portable enough for inpatient and OTP use in
PRONUT and also for field-based measurement in FUSAM. Calibration was checked every day
using 2.3kg and 5kg reference weights.
b) MUAC measurement – insertion tape
MUAC was measured to the nearest 1 mm using insertion tapes procured by UNICEF. The
same tapes were used for both PRONUT and FUSAM.
c) Length/height measurement – length/height boards
For PRONUT, this was measured to the nearest 1mm using specially adapted locally made
length boards (see picture below – the tape measure has a clear window with red line marking
exact length). For simplicity, only length was measured for all children. In the final study database
children >2 years (whose reference tables are based on height), the length measurement taken on
MOYO was converted to height by subtracting 0.5cm(15).
Picture 7 MOYO length board

Page 50
The MOYO height board was not portable and could not be used for FUSAM field visits. For these,
a “Leicester Height Measure” (Harlow Healthcare) accurate to the nearest 1mm was used to
measure standing height for children ≥2 years. Lengths of children <2 years old was measured
using a Dunmow length mat (Harlow Healthcare). Data collection forms noted whether length or
height was measured and where needed corrections could be made.
d) Age assessment
Age is a key independent variable, and is also critical to calculating anthropometry z-scores. To
minimise errors, study questionnaires asked age and date of birth as separate questions. If answers
were inconsistent, further details could be asked and true age determined with greater accuracy.
e) Repeat measurements
PRONUT followed research standard protocols whereby trained observers measured in pairs(85). If
within set agreement limits, the mean of the two measurements was taken as correct. Otherwise,
both observers would re-measure until their agreement was acceptable. Criteria for repeating were:
• Their two MUAC measurements differ by >5mm
• Their two length measurements differ by >7mm
• The measured length decreased since last measurement
• Length or MUAC increased by >20mm since last visit
f) The MOYO chart
To aid correct classification of weight-for-height/length into SAM or non-SAM, a low cost “MOYO”
slide chart was developed(87). This replaced the traditional weight-for-height/length lookup table
and is described in detail in
appendix K (PhD Research
articles). One feature of the
MOYO chart was a focus on
target weights for discharge
rather than overly frequent
weight-for-height/length
recalculations.
Picture 8 The MOYO chart

Page 51
3.4.2 Patient records systems
To enhance both study and routine data quality, several modifications were made to MOYO’s
patient records systems. These included:
• More detailed entries to admissions and outpatient registers;
These provided information backup in case of lost files and also facilitated quick cross-checking
as needed (e.g. to identify details of a previous admission).
• Training and supporting MOYO staff on the importance of good data management;
• Filing patient notes by sequential admission number rather than discharge date as had
previously been done. This change alone was a key factor in low losses to follow-up for
both PRONUT and FUSAM. Filed
according to the new system, it
was much easier to identify
missing files; easier to refer to
previous admission episodes;
easy to find and organize old
notes for FUSAM long term
follow-up.
Picture 9 (right) The purpose made filing
system for MOYO patient records.
Folders were colour coded: blue for PRONUT
patients; yellow for those not enrolled in
PRONUT; red for inpatient deaths; orange for outpatient deaths. For data protection, the cabinets were locked
and kept on the ward.
Pictures 10 (above) Old filing system – by discharge date
Picture 11 (right) New filing system – by admission number

3.4.3 Patient held records
All children in Malawi were expected to have a health passport documenting health events such as
immunizations, growth and clinical visits.
routine MOYO care. A rubber stamp (see below) was designed to enable key information to be
easily and quickly recorded: admission anthropometry; admission diagnosis; target weight; HIV
3.4.4 Staff training and supervision
The budget for PRONUT included funding for extra
2 nurses; 1 homecraft worker (responsible for therapeutic food preparation)
(secondary school graduates responsible f
general ward tasks). Staff
versions of the study forms.
members of the MOYO team
and anthropometry measurement. During the study, they were directly supervised by MK, the
Patient held records
All children in Malawi were expected to have a health passport documenting health events such as
immunizations, growth and clinical visits. Use was made of this ‘health passport’ to document
routine MOYO care. A rubber stamp (see below) was designed to enable key information to be
easily and quickly recorded: admission anthropometry; admission diagnosis; target weight; HIV
status (coded as “EL
NR(non-reactive)) to protect privacy
whilst simultaneously ensuring
clinicians were aware and could thus
offer appropriate treatments); details
of other relevant conditions such as
TB; details of progress at OTP review
clinics; details o
Whilst designed to enhance routine
clinical care, the MOYO stamp also
benefitted
‘backing up’ key information and
enabling cross checks to be made
when recording patient id number or
anthropometry
paperwork
Picture 12 MOYO stamp in patient
health passport
Staff training and supervision
The budget for PRONUT included funding for extra clinical staff. These
homecraft worker (responsible for therapeutic food preparation)
(secondary school graduates responsible for detailed completion of study questionnaires as well as
Staff received training prior to study start and h
versions of the study forms. All were expected to contribute to routine ward
the MOYO team. They alone however were responsible for study
and anthropometry measurement. During the study, they were directly supervised by MK, the
Page 52
All children in Malawi were expected to have a health passport documenting health events such as
Use was made of this ‘health passport’ to document
routine MOYO care. A rubber stamp (see below) was designed to enable key information to be
easily and quickly recorded: admission anthropometry; admission diagnosis; target weight; HIV
status (coded as “ELISA” R(eactive) or
reactive)) to protect privacy
whilst simultaneously ensuring
clinicians were aware and could thus
offer appropriate treatments); details
of other relevant conditions such as
TB; details of progress at OTP review
clinics; details of treatments given.
Whilst designed to enhance routine
clinical care, the MOYO stamp also
benefitted quality of research data by
‘backing up’ key information and
enabling cross checks to be made
when recording patient id number or
anthropometry on separate study
paperwork.
MOYO stamp in patient-held
health passport
. These included: 1 clinical officer;
homecraft worker (responsible for therapeutic food preparation); 3 patient attendants
or detailed completion of study questionnaires as well as
received training prior to study start and helped feed back on pilot
ward duties alongside other
. They alone however were responsible for study-related paperwork
and anthropometry measurement. During the study, they were directly supervised by MK, the

study principal investigator.
identified and discussed with the responsible st
FUSAM fieldwork was done by 3 senior nurses, supported by the study driver. This meant
that appropriate clinical assessment, advice, and where necessary simple immediate treatment
could be given. It was as important that these visits be of clin
benefit to the study. Again all 3 nurses had regular clinical duties and had a rota to take time off to
do FUSAM visits. Returned forms were checked and quality controlled by a study co
fellow paediatrician, GC.
3.5 Methods: the ‘verbal map’ and
Home follow-up was important for both:
• PRONUT - being able to trace defaulters and find out whether they were alive or dead.
• FUSAM - being able to determine long term outcomes.
It was made possible by using a ‘verbal map’
previous study(84). During their original admission, consenting patients provided detailed
instructions how to reach their home location. An example of a typical (fictional) map is:
“At Bangwe township, turn left just before the Kandodo supermarket minibus stop. Go
straight along the dirt road until you get to the Pentecostal Church. Just opposite the
entrance of the Church there is a group of charcoal sellers. Ask them for Mr Banda,
he will show you the family home, which is just 5 minutes walk away”
Taking an effective verbal map was helped by a physical map held on the ward. This
showed Blantyre district villages, trading centres and schools, and enabled staff to record a help
description of local landmarks en route to the patients’ home.
investigator. Study forms were regularly checked. Problems or inconsistencies
identified and discussed with the responsible staff member.
FUSAM fieldwork was done by 3 senior nurses, supported by the study driver. This meant
that appropriate clinical assessment, advice, and where necessary simple immediate treatment
could be given. It was as important that these visits be of clinical benefit to the patient as of research
benefit to the study. Again all 3 nurses had regular clinical duties and had a rota to take time off to
do FUSAM visits. Returned forms were checked and quality controlled by a study co
GC.
the ‘verbal map’ and patient follow-up
up was important for both:
being able to trace defaulters and find out whether they were alive or dead.
being able to determine long term outcomes.
It was made possible by using a ‘verbal map’ system which had been successfully used in a
. During their original admission, consenting patients provided detailed
instructions how to reach their home location. An example of a typical (fictional) map is:
“At Bangwe township, turn left just before the Kandodo supermarket minibus stop. Go
straight along the dirt road until you get to the Pentecostal Church. Just opposite the
entrance of the Church there is a group of charcoal sellers. Ask them for Mr Banda,
he will show you the family home, which is just 5 minutes walk away”
Taking an effective verbal map was helped by a physical map held on the ward. This
showed Blantyre district villages, trading centres and schools, and enabled staff to record a help
description of local landmarks en route to the patients’ home. Finally, some patients were given a
lift home by the MOYO driver.
This allowed GPS coordinates to
be taken at the house, again
making it possible to find the
residence in the future.
Picture
Blantyre district map
locate patients’ home locations
Page 53
roblems or inconsistencies were
FUSAM fieldwork was done by 3 senior nurses, supported by the study driver. This meant
that appropriate clinical assessment, advice, and where necessary simple immediate treatment
ical benefit to the patient as of research
benefit to the study. Again all 3 nurses had regular clinical duties and had a rota to take time off to
do FUSAM visits. Returned forms were checked and quality controlled by a study co-author and
being able to trace defaulters and find out whether they were alive or dead.
which had been successfully used in a
. During their original admission, consenting patients provided detailed
instructions how to reach their home location. An example of a typical (fictional) map is:
“At Bangwe township, turn left just before the Kandodo supermarket minibus stop. Go
straight along the dirt road until you get to the Pentecostal Church. Just opposite the
entrance of the Church there is a group of charcoal sellers. Ask them for Mr Banda, and
he will show you the family home, which is just 5 minutes walk away”
Taking an effective verbal map was helped by a physical map held on the ward. This
showed Blantyre district villages, trading centres and schools, and enabled staff to record a helpful
Finally, some patients were given a
lift home by the MOYO driver.
This allowed GPS coordinates to
be taken at the house, again
making it possible to find the
residence in the future.
Picture 13 Close up detail of the
Blantyre district map used to help
locate patients’ home locations

Picture 14 Blantyre district map (full version)
The overlay grid helps locate
10km x 10km. The smaller grid being held up is 1km x 1km (the thin lines are not visible on this picture,
though row numbers and column letters can be seen)
3.6 Ethical Approval
The PRONUT study was first
(COMREC) in 2005. Initial plans had been to base the study
Malawi. Updates to the protocol
2006.
FUSAM was granted initial approval as an extension to the PRONUT study in mid 2007.
Final approval was granted in 2008
(please see appendix C for letters from the Ethics committee)
Blantyre district map (full version)
locate the exact location of patients on the map. The large grid (visible blue lines)
10km. The smaller grid being held up is 1km x 1km (the thin lines are not visible on this picture,
though row numbers and column letters can be seen).
Ethical Approval
was first approved by College of Medicine Research & Ethics Committee
2005. Initial plans had been to base the study in a CMAM programme in central
Malawi. Updates to the protocol, including the change of setting to MOYO
FUSAM was granted initial approval as an extension to the PRONUT study in mid 2007.
was granted in 2008 after UNICEF funding was confirmed
for letters from the Ethics committee)
Page 54
. The large grid (visible blue lines) is
10km. The smaller grid being held up is 1km x 1km (the thin lines are not visible on this picture,
approved by College of Medicine Research & Ethics Committee
CMAM programme in central
, including the change of setting to MOYO were approved in late
FUSAM was granted initial approval as an extension to the PRONUT study in mid 2007.
funding was confirmed

Page 55
Chapter 4
‘PRONUT’ Study
4.1 Aim
To determine the efficacy of a probiotic/ prebiotic functional food (Synbiotic2000 ForteTM) for
improving clinical and nutritional outcomes from SAM in a HIV prevalent setting
4.1.1 Objectives:
To determine whether addition of Synbiotic 2000 Forte™ to a standard Ready-to-Use Therapeutic
Food (RUTF) diet will result in:
i) A greater proportion of children achieving nutritional cure following SAM
ii) Reduced mortality from SAM
iii) Improvements to other programme-relevant clinical and nutritional outcomes:
a. less readmissions; less nutritional failures
b. improved weight gain;
c. shorter length of stay in-programme;
d. less diarrhoea and other clinical problems
(please see also chapter 2, for underlying rationale and hypothesis)

Page 56
4.2 Methods
4.2.1 Study design
PRONUT was a double blind, randomized controlled efficacy trial.
4.2.2 Setting & participants
MOYO nutrition ward and its patient profile has been described in chapter 3 of this thesis. All
children admitted to MOYO were eligible for recruitment following written informed consent
To detect a possible subgroup effect, we made a-priori plans for a major secondary analysis.
This subgroup excluded small numbers of children aged <6 or >60 months(88); those with very low
weight (<4kg); cerebral palsy; an obvious dysmorphic syndrome; SAM secondary to major surgical
problems; moderate acute malnutrition (MAM) with complications. Uniting this subgroup was a
plausible biological reason why each ‘type’ of child may not respond so well to a feeding-centred
intervention - e.g. children with disabilities often have growth curves different to those of their
peers(89). The age range was chosen so as to be consistent with standard nutrition reporting and thus
comparable with other studies. The 4kg cut off is often used as a proxy for age <6 months so again
was excluded here for comparability with other studies(90).
Another secondary analysis explored a post-hoc hypothesis that Synbiotic benefits would
be greatest in children during the outpatient phase of SAM treatment. This did not arise from
multiple ‘data trawling’ post-hoc analyses, but follows logically from the original version of the
PRONUT protocol. PRONUT was originally designed in 2004 and was initially set in Dowa district,
Malawi which has an outpatient-based CMAM-style therapeutic feeding programme. In the
original protocol, only outpatients were to be recruited. At the time, this equated to RUTF feeds
(inpatient rehabilitation care used mainly F100 therapeutic milk). Due to logistical issues, the study
was moved to its actual location of Moyo ward, Blantyre, in late 2005. By 2005, RUTF was
increasingly used during final stages of inpatient care, as well as during outpatient care. This
evolution of routine practice led to decision to randomize during latter stages of inpatient care
rather than at entry to outpatient care.
4.2.3 Interventions
As described in chapter 3, treatment on MOYO followed Malawi National Guidelines for
the Management of Acute Malnutrition(25). All children were initially fed “F75” therapeutic milk.
PRONUT began when a child progressed to “rehabilitation” phase feeds. Criteria for progression
were clinical improvement and return of active appetite (easily finishing the prescribed volume of
Page 57
F75 milk). Ready-to-Use Therapeutic Food (RUTF)(41) was introduced into the diet at this stage.
RUTF prescriptions provided 200 kcal energy, per kg body weight, per day. For a 7 kg child
(median NRU admission weight) this was approximately 300g RUTF/day.
Control children received standard RUTF. The intervention group received RUTF with
added Synbiotic2000 Forte™ (Medipharm AB,Kågeröd, Sweden). This had been proven effective in
other studies in other patient groups(91, 92) and as described in section 1.5.3 also therefore had
potential for useful effects in SAM. Freeze-dried Synbiotic powder was factory-mixed into RUTF at
a weight ratio of 1:50. Batches of control RUTF were always made prior to batches of intervention
RUTF to prevent cross-contamination. Synbiotic constituents were:
i) Four different probiotic lactic acid bacteria (LAB): (1011 colony forming units, CFU of
bacteria total)
~ Pediococcus pentosaceus 16:1 LMG P-20608;
~ Leuconostoc mesenteroides 23-77:1 LMG P-20607;
~ Lactobacillus paracasei subsp paracasei F-19 LMG P-17806
~ Lactobacillus plantarum 2362 LMG P-20606
ii) Four prebiotic fermentable bioactive fibres: (2.5g of each per 1011 bacteria)
~ Oat bran (rich in β-glucans); inulin; pectin; resistant starch
For quality control, randomly selected samples of RUTF were regularly sent to Medipharm’s
laboratories in Sweden within a week of manufacture and again after 2 months storage at local
ambient temperature in Malawi. Medipharm’s microbiological culture results showed that
intervention RUTF consistently contained >1x10⁸ CFU of lactic acid bacteria per gram of RUTF. This
equates to a prescribed average dose of >1x10¹⁰ CFU organisms per patient per day (please see
appendix F.1 for details)
Outpatient therapeutic feeding
Once clinically well and easily finishing at least ¾ of their daily RUTF ration, children were
transferred from inpatient care to outpatient treatment, to complete their nutritional rehabilitation
at home. They continued original group allocations of either control or Synbiotic-enhanced RUTF.
RUTF prescriptions remained at 200 kcal energy, per kg body weight, per day. At fortnightly
intervals, children attended outpatient clinics for clinical review and to collect further rations of
RUTF.

Page 58
4.2.4 Trial Safety & Sepsis monitoring
RUTF safety and quality control
The Valid Nutrition RUTF factory in Lilongwe, Malawi (which supplied this study and
mixed the Synbiotic into intervention RUTF) was licensed for the manufacture of food products.
RUTF samples were regularly monitored by the Malawi Bureau of Standards for:
- Conformity to product specifications (macronutrient profile within range; water content
sufficiently low – please see table 3, RUTF nutrient profile )
- Microbiological safety
- Aflatoxin (levels within safe limits)
Data Safety & Monitoring Board (DSMB)
To monitor trial safety, an interim analysis reviewed the main outcomes, % cure and %
deaths. Early Stopping criteria were group differences exceeding the Peto-Haybittle rule (p<0.001),
or serious adverse events(93). Neither occurred.
Probiotic related sepsis & antibiotic regimes
On admission, all children routinely started a 7 day course of co-trimoxazole antibiotics.
Dose was 120mg twice a day (bd) for children weighing <10kg; 240mg bd for children 10-25kg and
480mg bd for those >25kg. HIV seropositive children were continued on long term daily
prophylaxis (dose 120mg co-trimoxazole once a day (od) for children <10kg; 240mg bd for children
10-25kg; 480mg bd for those >25kg). According to clinical need, some also received parenteral 2nd or
3rd line antibiotics. Standard 2nd line regime was chloramphenicol and gentamicin. 3rd line was
ceftriaxone or ciprofloxacin plus gentamicin.
In cases of presumed sepsis in a sick child, a blood culture was taken. To identify possible
probiotic sepsis we developed additional microbiology protocols involving culture on MRS agar
(Oxoid Ltd, Cambridge, UK) and subsequent bacterial subspecies identification (figure 10 and
appendix F.2). These were never needed as no suspicious organisms grew at the initial culture
stage.

Page 59
Figure 10 Identification of possible probiotic associated sepsis

Page 60
4.2.5 Outcome variables
PRIMARY OUTCOME was % of children achieving nutritional cure. This was defined as two
consecutive outpatient visits, a fortnight apart, with weight-for-height ≥ 80% of median (NCHS
reference)
SECONDARY OUTCOMES were:
i) Routine nutrition programme performance indicators: (88),(37)
• Death rate (%)
• Default rate (%) ~ defined as missing two consecutive outpatient visits (approximately 4
weeks without contact). Defaulters were followed up by a mobile team. Deaths at home
were classed as outpatient deaths.
• Nutritional failure rate (%) ~ defined as not achieving cure despite 5 visits (approximately
10 weeks) of follow-up. Failures (most commonly due to underlying HIV) were referred for
further care, including to anti-retroviral (ARV) services.
• Readmissions to hospital (%)
• Maximum weight gain (g/kg/day) ~ calculated using minimum observed inpatient weight
as the baseline weight (this is the closest approximation to ‘dry weight’. It is important to
note however that some children died or absconded whilst still oedematous. Rarely, some
children were discharged to outpatient care despite still having some oedema: this is
consistent with CMAM programmes which safely treat oedematous children at home)
• Length of stay in programme (days)
ii) Carer reported clinical & progress outcomes
Trained study staff used pre-piloted, standardized questionnaires (please see appendix D
for details of these forms). Symptoms were reported and signs recorded daily whilst the child was
an inpatient. At baseline, and at each fortnightly outpatient clinic, carers were asked about
symptoms in the preceding 2 weeks.
4.2.6 Sample size
Data from 2003-4 was used to estimate baseline/control group outcomes(84) A 10% increase
in cure was chosen as clinically relevant. Using α=0.05 and power of 80%, 348 patients per group
were needed to detect an improvement from 65% control group cure in to 75% Synbiotic cure
(StatCalc, EpiInfo v.3.3.2TM, CDC, Atlanta, USA). To account for follow-up losses and ensure
adequate numbers for subgroup analyses, the aim was to recruit 800 patients.

Page 61
4.2.7 Randomization
Sequence generation
A random sequence representing the two study groups was computer generated independently of
the field team. Permuted blocks of 50 (25 group ‘1’, 25 group ‘2’ per block) ensured balanced groups
for interim DSMB safety analysis.
Allocation concealment
Referring to the above ‘master list’, an independent volunteer inserted one of two sticky labels
(printed “Group 1” and “Group 2”) into sealed, opaque, sequentially numbered envelopes.
Implementation
When consenting and eligible patients (those starting transitional phase feeds) went to receive
RUTF for the first time, study staff would open the next numbered envelope to reveal the label
concealed inside. This assigned the patient to one of the two RUTF groups. To ensure the correct
group was maintained for all subsequent RUTF distribution rounds, the label was stuck in the back
page of the child’s health passport, which the carer held at all times.
4.2.8 Blinding
The study was double but not triple blind:
Patients
Taste, colour and texture of standard (control) and intervention (Synbiotic) RUTF were
indistinguishable so patients were blind to their group allocation. A small printed label on the
RUTF bottle lid was the only way to identify the correct group. At the beginning of the study, the
RUTF factory manager decided independently and at random whether group “1” or “2” should
contain Synbiotic.
Field Staff
Project field staff were unaware of whether group “1” or “2” contained the Synbiotic. They
were also blind as to whether a patient was even group “1” or “2” when assessing or managing a
particular patient. Group “1” or “2” allocation was recorded hidden inside the child health passport
for the purpose of correct food distribution but nowhere else on patient or study files. Strict
instructions were given that this should only be referred to by staff distributing RUTF at the end of
the clinic or end of ward round
Investigators

Page 62
All investigators except MK were unaware of study codes. MK was inadvertently
unblinded part way into the study whilst coordinating RUTF quality control testing. I believe the
study design was robust enough to prevent this causing any biases: main outcomes were hard and
objective (e.g. weight, death); other staff remained fully blinded; group randomization,
concealment and allocation were all independent of MK; randomization data was entered and
stored independently from other databases and merged only prior to final data analysis.
4.2.9 Statistical methods & data handling
Data were entered in EpiData 3.1 (EpiData Association, Odense, Denmark, 2003-4). Simple
macros (‘Check’ files) helped ensure high quality data entry, e.g. variables plausible, in-range and
consistent with other related variables. Key data (anthropometry, dates, final outcomes, HIV status)
were double entered. WHO Anthro 2005 v1 (World Health Organization, Geneva) was used to
calculate anthropometric Z-scores using the NCHS reference, still current in Malawi.
Main analyses were performed using SPSSv15 (© SPSS Inc., USA). StatCalc (CDC, Atlanta,
USA, 1993) and Stata Intercooled 10.0TM(StataCorp LP, USA) were used for additional analyses.
Chi-square tables and approximate confidence limits for relative risk were used to examine
categorical data. Normality of continuous variables was explored visually (histogram, Q-Q plots)
and numerically (Kolomogorov-Smirnov and Shapiro-Wilk tests). Either independent t-tests or
Mann-Whitney U tests were performed accordingly.
To assess the role of HIV as a possible confounder or effect modifier, all major analyses
included HIV serostatus (positive or negative) as a stratification level.
Analysis was on an intention-to-treat basis.

Page 63
4.3 RESULTS
4.3.1 Study flow chart
From 12th July 2006 to 7th March 2007, 1024 children were admitted to the ward. Their progress is
summarized in the study flowchart below:
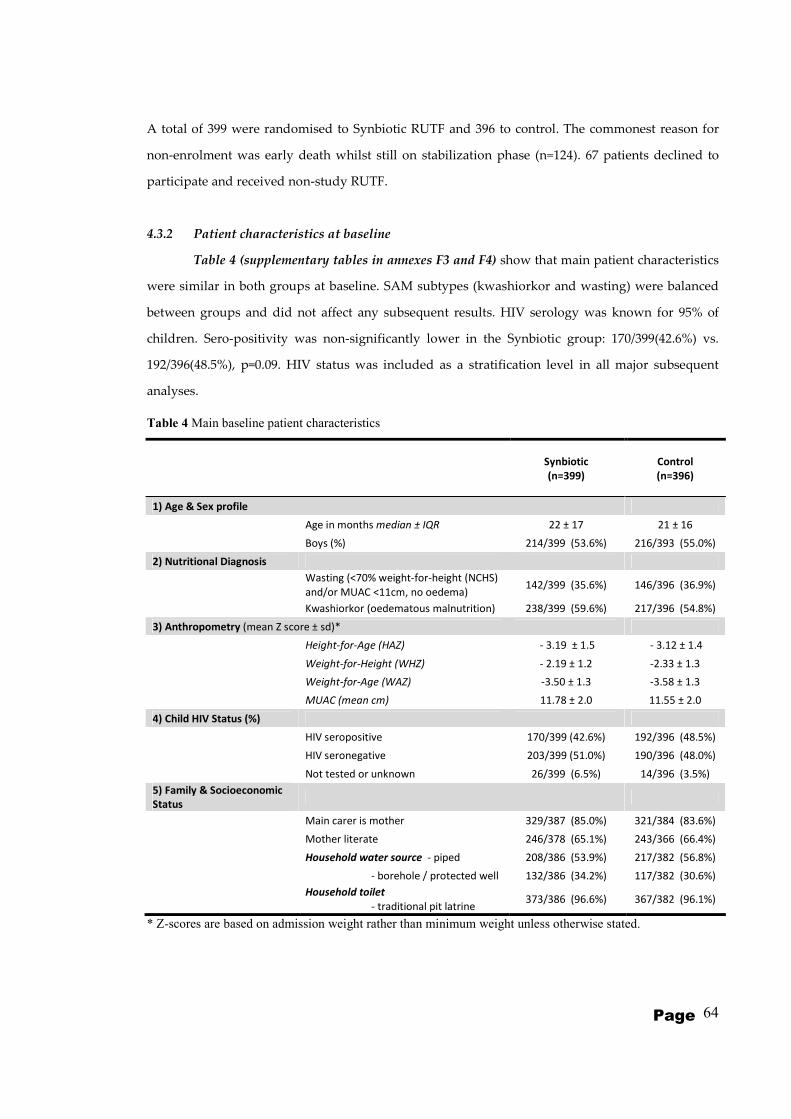
Page 64
A total of 399 were randomised to Synbiotic RUTF and 396 to control. The commonest reason for
non-enrolment was early death whilst still on stabilization phase (n=124). 67 patients declined to
participate and received non-study RUTF.
4.3.2 Patient characteristics at baseline
Table 4 (supplementary tables in annexes F3 and F4) show that main patient characteristics
were similar in both groups at baseline. SAM subtypes (kwashiorkor and wasting) were balanced
between groups and did not affect any subsequent results. HIV serology was known for 95% of
children. Sero-positivity was non-significantly lower in the Synbiotic group: 170/399(42.6%) vs.
192/396(48.5%), p=0.09. HIV status was included as a stratification level in all major subsequent
analyses.
Table 4 Main baseline patient characteristics
Synbiotic
(n=399)
Control
(n=396)
1) Age & Sex profile
Age in months median ± IQR 22 ± 17 21 ± 16
Boys (%) 214/399 (53.6%) 216/393 (55.0%)
2) Nutritional Diagnosis
Wasting (<70% weight-for-height (NCHS)
and/or MUAC <11cm, no oedema) 142/399 (35.6%) 146/396 (36.9%)
Kwashiorkor (oedematous malnutrition) 238/399 (59.6%) 217/396 (54.8%)
3) Anthropometry (mean Z score ± sd)*
Height-for-Age (HAZ) - 3.19 ± 1.5 - 3.12 ± 1.4
Weight-for-Height (WHZ) - 2.19 ± 1.2 -2.33 ± 1.3
Weight-for-Age (WAZ) -3.50 ± 1.3 -3.58 ± 1.3
MUAC (mean cm) 11.78 ± 2.0 11.55 ± 2.0
4) Child HIV Status (%)
HIV seropositive 170/399 (42.6%) 192/396 (48.5%)
HIV seronegative 203/399 (51.0%) 190/396 (48.0%)
Not tested or unknown 26/399 (6.5%) 14/396 (3.5%)
5) Family & Socioeconomic
Status
Main carer is mother 329/387 (85.0%) 321/384 (83.6%)
Mother literate 246/378 (65.1%) 243/366 (66.4%)
Household water source - piped 208/386 (53.9%) 217/382 (56.8%)
- borehole / protected well 132/386 (34.2%) 117/382 (30.6%)
Household toilet
- traditional pit latrine 373/386 (96.6%) 367/382 (96.1%)
* Z-scores are based on admission weight rather than minimum weight unless otherwise stated.

Page 65
4.3.3 Main outcomes – programme cure and mortality
Table 5 shows main study outcomes. Primary outcome, nutritional cure was 53.9% (215/399) in
Synbiotic patients and 51.3% (203/396) in controls (p=0.40). Total deaths during the study period
were also similar between groups: 27.1% (108/399) Synbiotic deaths vs 30.0% (119/396) control
deaths (p=0.31). Other secondary outcomes were also similar. Less than 10% of patients defaulted.
When followed-up in the community after 1st default episode, 19/32 (59.4%) Synbiotic defaulters
and 23/36 (63.9%) controls were seen or reported to be alive and well (p=0.70). Information was
unavailable for only 6/32 (18.8%) Synbiotic defaulters and 4/36 (11.1%) controls (p=0.37) who could
not be located.
Table 5 Main PRONUT study outcomes
Synbiotic
(n=399)
Control
(n=396)
relative risk
or
mean difference
(95% confidence
interval)
p
PRIMARY OUTCOME:
1) NUTRITIONAL CURE (total) 215/399 (53.9%) 203/396 (51.3%) 1.06 (0.93 to 1.21) 0.40
HIV seropositive cures 66/170 (38.8%) 71/192 (37.0%) 1.05 (0.81 to 1.37) 0.71
HIV seronegative cures 145/203 (71.4%) 131/190 (68.9%) 1.04 (0.91 to 1.18) 0.59
SECONDARY OUTCOMES:
2) DEATHS (TOTAL)† 108/399 (27.1%) 119/396 (30.0%) 0.90 (0.72 to 1.12) 0.31
3) OUTPATIENT DEFAULTERS or WARD
ABSCONDERS 27/399 (6.8%) 36/396 (9.0%) 0.74 (0.46 to 1.20) 0.23
4) FAILURES OF NUTRITIONAL
TREATMENT 14/399 (3.5%) 14/396 (3.5%) 0.99 (0.48 to 2.05) 0.98
5) READMISSIONS 27/399 (6.8%) 16/396 (4.0%) 1.67 (0.92 to 3.06) 0.08
6) Other: (transfers out; final outcome
unknown) 8/399 (2.0%) 8/396 (2.0%) 1.12 (0.44 to 2.86) 0.81
7) Rate of weight gain (mean
g/kg/day ± SD) 4.18 ± 4.0 4.14 ± 4.1
0.04 (-0.53 to
0.61) 0.65
8) Length of stay in programme
(median days to cure ± IQR) 37 ± 14 38 ± 13 0.42
Outcomes stratified by treatment phase
~ Deaths (inpatient, during 1st
admission) 61/399 (15.3%) 52/396 (13.1%) 1.16 (0.83 to 1.64) 0.38
~ Deaths (any time during remainder
of study) 47/338 (13.9%) 67/344 (19.4%) 0.71 (0.51 to 1.00) 0.05
total deaths during all inpatient
treatment episodes (incl.
readmissions)
78/486 (16.1%) 74/467 (15.9%) 1.01 (0.76 to 1.36) 0.93
total deaths during all
outpatient treatment episodes
(incl. readmissions)
30/394 (7.6%) 45/387 (11.6%) 0.65 (0.42 to 1.02) 0.06
† Please see table 6 for detailed breakdown of deaths according to phase of treatment.

Page 66
Also in table 5 are main outcomes stratified by treatment phase. There were no group
differences in initial inpatient deaths (p=0.38). Deaths at any time during the remainder of the study
period showed a possible trend in favour of the Synbiotic group: 47/338 (13.9%) vs. 67/344 (19.4%),
p=0.05. Details of deaths during each subsequent readmission episode are shown in table 6. In all,
there were 486 patient admission episodes in the Synbiotic group and 467 in controls. Total deaths
during inpatient care did not differ between groups (p=0.93), but total deaths during outpatient
care showed a possible trend towards being lower in the Synbiotic group (p=0.06). The observed
group differences were greatest:
- during the outpatient phase of the 1st admission episode: 18/324 Synbiotic deaths vs. 39/338 control
deaths, p=0.006.
- among HIV seronegative outpatients (all admission episodes): 3/202 Synbiotic deaths vs. 11/194
deaths, p=0.02.
One related result not shown in table is that weight gain (g/kg/day) during outpatient treatment
was no different in the Synbiotic group compared to controls (p=0.48).
Table 7 explores whether these apparent outpatient difference might be explained by group
imbalances at the point of discharge from 1st admission episode to outpatient care. HIV prevalence
was marginally lower in the Synbiotic outpatient group than in controls: 135/331 (40.8%)
seropositive Synbiotic outpatients compared to 157/341(46.0%) seropositive controls (p=0.17).
Weight-for-height Z-score (WHZ) was also different at OTP baseline, with Synbiotic mean WHZ of
-2.24±1.1 against control mean WHZ of -2.44±1.1 (p=0.02).
Two points are important to note when interpreting this table:
- Nutritional diagnosis refers to that at admission and does not imply that patients were still
oedematous at discharge from the ward. The great majority of children had lost all visible
oedema before discharge. Only a very small number were discharged home with residual
pitting (consistent with CMAM programmes which have good experience of safe
outpatient treatment of clinically stable children with good appetites but minimal oedema)
Since this table excludes those patients who died during initial inpatient care, z-scores cannot be
directly compared with those of all patients at admission to the ward (table 4) and inferences
cannot be made regarding weight changes during the initial treatment. Many patients lost some
weight since their admission – mostly due to loss of oedema. By discharge, most had started to gain
weight.

Page 67
Table 6 Details of timing of death: stratified by admission episode; inpatient or outpatient care; HIV status
Synbiotic Control risk ratio
(95% confidence interval) p-value
All admissions TOTAL PATIENT ADMISSION EPISODES 486 467
TOTAL DEATHS 108/486 (22.2%) 119/467 (25.5%) 0.87 (0.69 to 1.09) 0.24
total deaths during inpatient treatment
episodes 78/486 (16.1%) 74/467 (15.9%) 1.01 (0.76 to 1.36) 0.93
HIV +ve inpatient deaths 47/234 (20.1%) 55/246 (22.4%) 0.90 (0.64 to 1.27) 0.54
HIV -ve inpatient deaths 18/227 (7.9%) 13/207 (6.3%) 1.26 (0.63 to 2.51) 0.51
total deaths during outpatient treatment
episodes 30/394 (7.6%) 45/387 (11.6%) 0.65 (0.42 to 1.02) 0.06
HIV +ve inpatient deaths 26/186 (14.0%) 31/189 (16.4%) 0.85 (0.53 to 1.38) 0.51
HIV -ve outpatient deaths 3/202 (1.5%) 11/194 (5.7%) 0.26 (0.07 to 0.92) 0.02
Admission 1 Total 1st admissions 399 396
Inpatient deaths total 61/399 (15.3%) 52/396 (13.1%) 1.16 (0.83 to 1.64) 0.38
HIV +ve inpatient deaths 34/170 (20.0%) 35/192 (18.2%) 1.10 (0.72 to 1.68) 0.67
HIV -ve inpatient deaths 14/203 (6.9%) 11/190 (5.8%) 1.19 (0.55 to 2.56) 0.65
Outpatient deaths total 18/324 (5.6%) 39/338 (11.5%) 0.48 (0.28 to 0.82) 0.006
HIV +ve outpatient deaths 15/134 (11.1%) 25/155 (16.1%) 0.69 (0.38 to 1.26) 0.23
HIV -ve outpatient deaths 2/182 (0.5%) 11/179 (6.1%) 0.18 (0.04 to 0.80) 0.010
Admission 2 Total 2nd admissions 68 61
Inpatient deaths total 12/68 (17.6%) 19/61 (31.1%) 0.57 (0.30 to 1.07) 0.07
HIV +ve inpatient deaths 9/49 (18.4%) 17/46 (37.0%) 0.50 (0.25 to 1.00) 0.04
HIV -ve inpatient deaths 3/19 (15.8%) 2/15 (13.3%) 1.18 (0.23 to 6.20) 1.0*
Outpatient deaths total 11/56 (19.6%) 3/42 (7.1%) 2.75 (0.82 to 9.24) 0.08
HIV +ve outpatient deaths 10/40 (20.0%) 3/29 (10.3%) 2.42 (0.73 to 8.01) 0.12
HIV -ve outpatient deaths 1/16 (6.3%) 0/13 (0.0%) - 1.0*
Admission 3 Total 3rd admissions 16 10
Inpatient deaths total 5/16 (31.3%) 3/10 (30.0%) 1.04 (0.32 to 3.44) 1.0*
HIV +ve inpatient deaths 4/13 (30.8%) 3/8 (37.5%) 0.82 (0.24 to 2.75) 1.0*
HIV -ve inpatient deaths 1/3 (33.3%) 0/2 (0.0%) - 1.0*
Outpatient deaths total 1/11 (0%) 3/7 (42.9%) 0.21 (0.03 to 1.66) 0.24*
HIV +ve outpatient deaths 1/10 (10.0%) 3/5 (60.0%) 0.17 (0.02 to 1.22) 0.08*
HIV -ve outpatient deaths 0/2 (0.0%) 0/2 (0.0%) - -
Admission 4 Total 4th admissions 3 0 -
Deaths 0 n/a - -
(NB) Note that HIV positive and negatives do not always add up to total because of a small number of unknowns. *Fisher exact

Page 68
Table 7 Patient characteristics at point of entry to outpatient care (=point of discharge from inpatient care)
Synbiotic
(n=331)
Control
(n=341)
relative risk (discrete variables)
or
mean difference
(continuous variables)
(95% confidence interval)
p-value
1) Demographic profile
Age in months (mean ± sd) 30.8 ±25.3 28.4 ± 23.2 2.35 (-1.32 to 6.02) 0.21
Boys (%) 181/331 (54.7%) 186/341 (54.5%) 0.99 (0.86 to 1.13) 0.86
2) Nutritional Diagnosis (at admission to ward)
Wasting (<70% weight-for-height (NCHS)
and/or MUAC <11cm, no oedema)
76/331 (23.0%) 84/341 (24.6%) 0.93 (0.71 to 1.22) 0.61
Kwashiorkor (oedematous malnutrition) 215/331 (65.0%) 201/341 (58.9%) 1.10 (0.98 to 1.24) 0.11
3) Anthropometry (mean Z score ± sd)
Height-for-Age (HAZ) -3.13 ± 1.5 -3.09 ± 1.3 -0.44 (-0.26 to 0.17) 0.69
Weight-for-Height (WFZ) -2.24 ± 1.1 -2.44 ± 1.1 0.20 (0.03 to 0.37) 0.02
Weight-for-Age (WFZ) -3.49 ± 1.2 -3.64 ± 1.1 0.15 (-0.02 to 0.32) 0.08
4) Child HIV Status (%)
HIV seropositive 135/331 (40.8%) 157/341 (46.0%) 0.89 (0.74 to 1.05) 0.17
HIV seronegative 186/331 (56.2%) 179/341 (52.5%) 1.07 (0.93 to 1.23) 0.34
Not tested or unknown 10/331 (3.0%) 5/341 (1.5%) 2.06 (0.71 to 5.96) 0.17
NB. This table includes patients successfully discharged from inpatient care (n=324 Synbiotic group, n=338 control)
plus absconders from inpatient care (n=7 Synbiotic group, n=3 control). Absconders are included since they were also followed up in the community to discover final
outcome (e.g. whether alive and well when seen at community 'default' visit; whether dead at default visit)
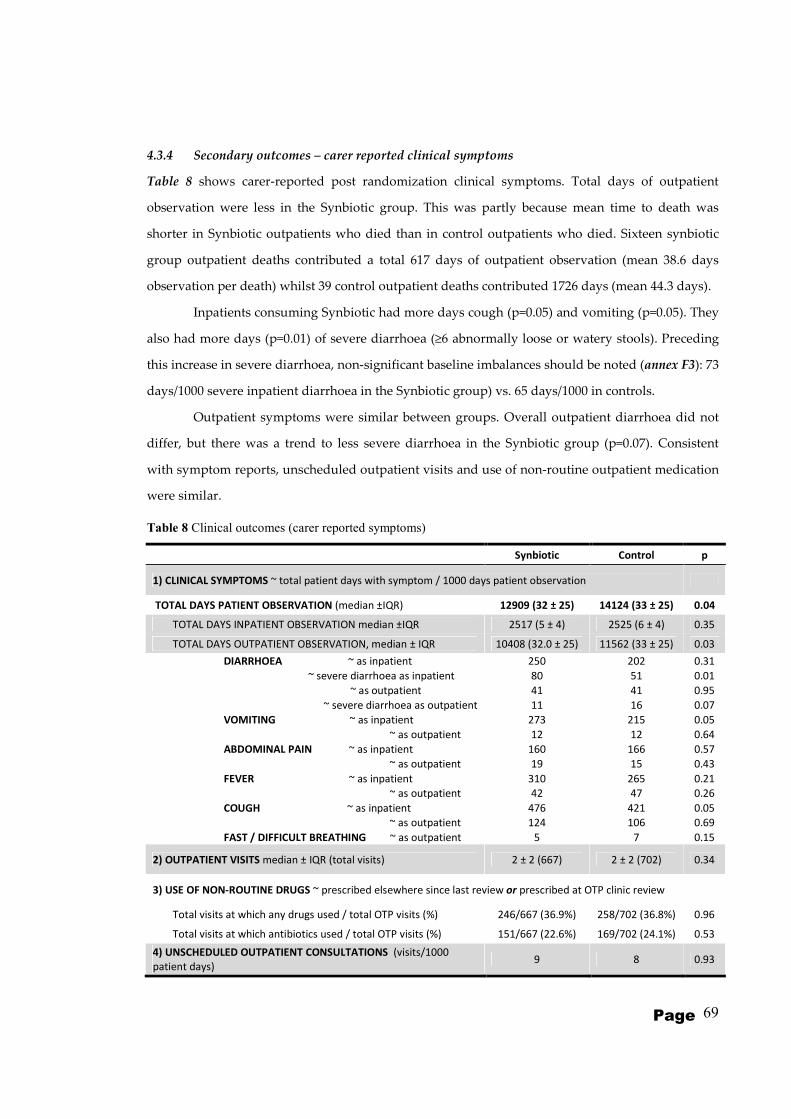
Page 69
4.3.4 Secondary outcomes – carer reported clinical symptoms
Table 8 shows carer-reported post randomization clinical symptoms. Total days of outpatient
observation were less in the Synbiotic group. This was partly because mean time to death was
shorter in Synbiotic outpatients who died than in control outpatients who died. Sixteen synbiotic
group outpatient deaths contributed a total 617 days of outpatient observation (mean 38.6 days
observation per death) whilst 39 control outpatient deaths contributed 1726 days (mean 44.3 days).
Inpatients consuming Synbiotic had more days cough (p=0.05) and vomiting (p=0.05). They
also had more days (p=0.01) of severe diarrhoea (≥6 abnormally loose or watery stools). Preceding
this increase in severe diarrhoea, non-significant baseline imbalances should be noted (annex F3): 73
days/1000 severe inpatient diarrhoea in the Synbiotic group) vs. 65 days/1000 in controls.
Outpatient symptoms were similar between groups. Overall outpatient diarrhoea did not
differ, but there was a trend to less severe diarrhoea in the Synbiotic group (p=0.07). Consistent
with symptom reports, unscheduled outpatient visits and use of non-routine outpatient medication
were similar.
Table 8 Clinical outcomes (carer reported symptoms)
Synbiotic Control p
1) CLINICAL SYMPTOMS ~ total patient days with symptom / 1000 days patient observation
TOTAL DAYS PATIENT OBSERVATION (median ±IQR) 12909 (32 ± 25) 14124 (33 ± 25) 0.04
TOTAL DAYS INPATIENT OBSERVATION median ±IQR 2517 (5 ± 4) 2525 (6 ± 4) 0.35
TOTAL DAYS OUTPATIENT OBSERVATION, median ± IQR 10408 (32.0 ± 25) 11562 (33 ± 25) 0.03
DIARRHOEA ~ as inpatient 250 202 0.31
~ severe diarrhoea as inpatient 80 51 0.01
~ as outpatient 41 41 0.95
~ severe diarrhoea as outpatient 11 16 0.07
VOMITING ~ as inpatient 273 215 0.05
~ as outpatient 12 12 0.64
ABDOMINAL PAIN ~ as inpatient 160 166 0.57
~ as outpatient 19 15 0.43
FEVER ~ as inpatient 310 265 0.21
~ as outpatient 42 47 0.26
COUGH ~ as inpatient 476 421 0.05
~ as outpatient 124 106 0.69
FAST / DIFFICULT BREATHING ~ as outpatient 5 7 0.15
2) OUTPATIENT VISITS median ± IQR (total visits) 2 ± 2 (667) 2 ± 2 (702) 0.34
3) USE OF NON-ROUTINE DRUGS ~ prescribed elsewhere since last review or prescribed at OTP clinic review
Total visits at which any drugs used / total OTP visits (%) 246/667 (36.9%) 258/702 (36.8%) 0.96
Total visits at which antibiotics used / total OTP visits (%) 151/667 (22.6%) 169/702 (24.1%) 0.53
4) UNSCHEDULED OUTPATIENT CONSULTATIONS (visits/1000
patient days) 9 8 0.93

Page 70
Table 9 shows indicators of Synbiotic safety: RUTF was tolerated equally well in both
groups during inpatient care (p=0.77). During outpatient care, less problems eating RUTF were
reported by Synbiotic patients. RUTF (p=0.02). This did not affect the total amount consumed: if
RUTF was left unfinished, the amount was small (just over 1 pot unfinished = approx 1 day’s
ration/14 days) and similar in both groups (p=0.35).
There were no group differences in incidence of sepsis episodes. Similar numbers of
patients needed blood cultures (p=0.89) and similar numbers of blood cultures were positive
(p=0.28). No cases of probiotic-associated sepsis were detected.
Addressing safety concerns about probiotic use in HIV, table 9 also shows deaths stratified
by HIV serostatus. There was no excess mortality among HIV seropositive Synbiotic patients
(p=0.80).
Table 9 Indicators of Synbiotic safety
Synbiotic Control
relative risk
or
mean difference
(95% confidence
interval)
p
1) PROBLEMS WITH RUTF
AS INPATIENT (patient not
tolerating RUTF or clinically
worsening ->needing F100 milk
instead)
6/396 (1.5%) 5/393 (1.3%) 1.19 (0.37 to 3.87) 0.77
AS OUTPATIENT number of visits
with problem/total outpatient
visits (%)
26/667 (3.9%) 48/702 (6.8%) 0.57 (0.36 to 0.91) 0.02
Bottles of RUTF remaining (if ration
unfinished), mean, ± SD 1.17 ± 2.4 1.35 ± 2.3 -0.18 (-0.57 to 0.20) 0.35
2) BLOOD CULTURES & SEPSIS
Blood culture taken 68/399 (17.0%) 69/396 (17.4%) 0.98 (0.72 to 1.33) 0.89
Positive blood culture (of those
taken) 17/68 (25.0%) 23/69 (33.3%) 0.75 (0.44 to 1.27) 0.28
Probiotic associated blood culture
(of those taken) 0 (0%) 0 (0%) - -
3) DEATHS ~ by HIV status
Total HIV seropositive deaths 73/170 (42.9%) 85/192 (44.3%) 0.97 (0.77 to 1.23) 0.80
Total HIV seronegative deaths 21/203 (10.3%) 25/190 (13.1%) 0.79 (0.46 to 1.36) 0.39
4) TOTAL READMISSION EPISODES* 87/399 (21.8%) 71/396 (17.9%) 1.22 (0.92 to 1.61) 0.17
Readmissions who eventually died 29/87 (33.3%) 28/71 (39.4%) 0.85 (0.56 to 1.28) 0.43
* Same patient can have more than one readmission episode. Maximum admission episodes was 4.

Page 71
4.3.5 Kaplan-Meier time-to-death analysis
Figure 11 is a Kaplan-Meier time-to-death graph, split by HIV status, showing all deaths during the
course of the study. The adverse effects of HIV manifest quickly in both Synbiotic and control
patients. In both HIV positive and negative children there were initially more Synbiotic than control
deaths, though as detailed in tables 5 and 6, these early inpatient deaths were statistically not
different between groups. Median time to death was 8(± IQR 8) days in Synbiotic patients who
died, and 11(± IQR 22) days in controls (p=0.004). A log-rank test for overall time-to-death curves
was non-significant (p=0.36). Overall Synbiotic/control differences are non-significant in both HIV
classes.
.
Figure 11 Kaplan-Meier time-to-death graph, by HIV status.
(All deaths in the study are shown)
0
20
10
30
40
50
cum
ula
tive m
ort
alit
y (
%)
192 135(57) 117(17) 111(6) 108(3) 106(2)Control - HIV pos
190 171(19) 168(3) 167(1) 165(2) 165(0)Control - HIV neg
169 121(47) 109(12) 102(7) 101(1) 97(5)Synbiotic - HIV pos
203 186(17) 183(3) 182(1) 182(0) 182(0)Synbiotic - HIV neg
Number at risk (# died)
0 50 100 150 200 250time to death (days)
Synbiotic - HIV neg Synbiotic - HIV pos
Control - HIV neg Control - HIV pos

Page 72
4.3.6 Subgroup Analyses
Analyses were repeated for the pre-specified subgroup of children who we thought might
benefit most from Synbiotic actions: those aged 6 to 60months and without disability or other direct
surgical or other cause of SAM. Overall trends and patterns of difference were similar to the whole
group. Only main subgroup outcomes are shown in the table below:
Table 10 Main PRONUT study outcomes – main subgroup analysis
Synbiotic
(n=333)
Control
(n=318)
relative risk
or
mean difference
(95% confidence
interval)
p
PRIMARY OUTCOME:
1) NUTRITIONAL CURE (total) 189/333 (56.8%) 172/318 (54.1%) 1.05 (0.91 to 1.23) 0.49
HIV seropositive cures 58/141 (41.1%) 58/153 (37.9%) 1.07 (0.84 to 1.36) 0.57
HIV seronegative cures 127/173 (73.4%) 113/154 (73.4%) 1.00 (0.79 to 1.26) 0.99
SECONDARY OUTCOMES:
2) DEATHS (TOTAL) 85/333 (25.5%) 90/318 (28.3%) 0.93 (0.78 to 1.11) 0.42
3) OUTPATIENT DEFAULTERS or WARD
ABSCONDERS 23/333 (6.9%) 30/318 (9.4%) 0.84 (0.61 to 1.15) 0.24
4) FAILURES OF NUTRITIONAL
TREATMENT 11/333 (3.3%) 12/318 (3.8%) 0.93 (0.60 to 1.44) 0.75
5) READMISSIONS 20/333 (6.0%) 11/318 (3.5%) 1.28 (0.97 to 1.68) 0.13
6) Other: (transfers out; final outcome
unknown) 5/333 (1.5%) 3/318 (0.9%) 1.23 (0.71 to 2.11) 0.52
7) Rate of weight gain (mean
g/kg/day ± SD) 4.39 (4.0) 4.14 (4.1)
0.24 (-0.39 to
0.86) 0.45
8) Length of stay in programme
(median days to cure ± IQR) 37 (34 to 48) 38 (34 to 47) 0.66
Outcomes stratified by treatment phase
~ Deaths (inpatient, during 1st
admission) 47/333 (14.1%) 38/318 (11.9%) 1.09 (0.89 to 1.35) 0.41
~ Deaths (any time during remainder
of study) 38/286 (13.3%) 52/280 (18.6%) 0.81 (0.63 to 1.05) 0.09
total deaths during all inpatient
treatment episodes (incl.
readmissions)
59/397 (14.9%) 56/366 (15.3%) 0.98 (0.81 to 1.19) 0.87
total deaths during all
outpatient treatment episodes
(incl. readmissions)
26/338 (7.7%) 34/310 (11.0%) 0.82 (0.61 to 1.10) 0.15
total outpatients deaths
following 1st
admission only 13/238 (5.5%) 30/280 (10.7%) 0.65 (0.40 to 1.01) 0.03

Page 73
Chapter 5
‘FUSAM’ study
(Follow-Up of long term outcomes from
Severe Acute Malnutrition)
5.1 Aims
To describe long term (≥ 1 year post-discharge) mortality and morbidity following an episode of
SAM
5.1.1 Objectives:
i. To describe the occurrence and timing of in-programme and post-treatment deaths
following an episode of SAM
ii. To describe the extent of catch-up growth in the year following an episode of SAM
iii. To identify risk factors for mortality from SAM:
a. Risk factors at original admission
b. Risk factors related to post-SAM care
c. To determine whether risk factors for short term mortality are similar
to those for late deaths

Page 74
5.2 Methods
5.2.1 Study design
FUSAM was a longitudinal cohort study.
5.2.2 Setting & participants
FUSAM participants were all children cared for on ‘MOYO‘ nutrition ward, Queen Elizabeth
Hospital, Blantyre Malawi. All admissions during the period of the PRONUT study from 12th
July 2006 to 14th March 2007 were eligible. This spans both the dry (July to December) and rainy,
‘hungry’ season (December to March). MOYO is profiled in detail in chapter 3.
Those successfully cured in MOYO’s OTP programme were asked to return for ward-
based review on the 1 year anniversary of their cure date. Non-cures and those failing to return
for assessment were followed-up at the home address they had given at original admission.
Where possible and appropriate, information was also collected on siblings of the ex-
MOYO patient and the parents or carer of the ex-MOYO patient.
5.2.3 Outcome variables
FUSAM focused on the following:
PRIMARY OUTCOMES
• Mortality
Total mortality consisted of:
o Short term deaths, whilst still an inpatient on MOYO
o Medium term deaths, within the 1st 90 days of admission but after the inpatient
treatment phase
o Long term deaths, defined as death >90 days following programme admission.
Short plus medium term deaths approximate ‘in-programme’ deaths and are considered
together in FUSAM analyses whilst long term deaths approximate post-treatment deaths. In
reality the division is less distinct since for example: readmissions can be under MOYO care for
longer periods; some children may proceed quickly through the treatment programme and be
discharged from care, yet still die within 90 days of original admission; some carers abscond not
having completed full treatment. The 90 day cut-off was chosen to be consistent with upper
limits of time a patient would normally spend in a therapeutic feeding programme: 10 weeks as
an outpatient before being defined as ‘nutritional failure’ plus a preceding 3 weeks of inpatient
care.
• Long term survival
Defined as seen alive by the FUSAM study team (or reliably reported to be alive) at ≥1year after
the original admission date to MOYO.

Page 75
SECONDARY OUTCOMES
• Anthropometric status at 1 year (catch-up growth):
To calculate weight-for-height, height-for-age and weight-for-age z-scores, we measured the
weight, height, MUAC and exact age of:
o The ex-MOYO child.
Longitudinal data were thus available at: day of admission to MOYO; day of minimum
weight on ward (this was the closest approximation to ‘dry’/non-oedamtous weight,
though it is important to note that some patients died whilst still oedematous); day of
discharge from ward to OTP; each OTP clinic visit (weight and MUAC only); day of
OTP exit; day of 1 year follow-up.
o Siblings - defined as children born to the same mother and living in the same family
The following outcomes variables also served as potential explanatory variables in a
mathematical model exploring which factors predicted long term survival and mortality:
• . Clinical progress in the year since MOYO admission
o Recurrence of acute malnutrition
o Other (non-SAM) health problems resulting in inpatient admission or
outpatient visit
o Clinical symptoms in the previous 2 weeks
These morbidity questions mirrored what was asked about the 2 weeks prior to
original admission to MOYO and at each 2 week interval between OTP visits. In the
case of deaths, it also served as a verbal autopsy report.
• Access to and use of TFP-related services
o For how long, if at all, the child received supplementary feeds following MOYO
discharge?
o Use of TB and HIV-related services, if clinically indicated.
• Health education activities and basic nutrition-related knowledge
o Did the carer attend any health education sessions whilst on MOYO?
o Did any differences result from the health education sessions?
o Did the carer know about basics of nutrition, specifically about Malawi’s ‘six
food groups’ (vegetables, fruits, staples, fats, animal foods, legumes & nuts)
and about ideal duration of breastfeeding?

Page 76
5.2.4 Data sources and measurement
Baseline variables
The following groups of independent variables, all potentially affecting FUSAM outcomes,
were obtained at original admission to MOYO. Measurement details are described in chapter 3
• Age and anthropometry
• HIV status (including CD4 count, at 1st OTP visit, for HIV seropositive children)
• Clinical status in the 2 weeks prior to ward admission
• Signs and symptoms used for clinical staging of HIV disease (according to 2006 WHO
case definitions)(94)
• Past medical history
• Family and socioeconomic status
Sources of baseline variables
Baseline variables were the same as those collected and entered in the PRONUT study
database. Whilst a small number of patients declined to be randomized in PRONUT, routine
clinical data were available on all patients. Additional data, taken on separate PRONUT forms,
were obtained, with permission, from most carers. A key question enabling long term follow-up
was the ‘verbal map’ described in chapter 3.5. This was critical to both low loss to follow-up in
PRONUT, but also laid the ground for the later FUSAM study. All data collection forms, both
routine ward forms and PRONUT/FUSAM-specific data collection forms are shown in Annexes
D and E.
FUSAM data
FUSAM data collection forms are shown in Annex G. A dedicated FUSAM study team
of 3 senior nurses participated in piloting of these forms and were trained to use the final
versions.
FUSAM reviews were done either at MOYO if a carer returned for a 1 year visit, or at a
patient’s home if an address was available to trace the patient. Target time for long term follow-
up was at least 1 year after original discharge from MOYO treatment.
Some minor differences from PRONUT data collection were:
• Measurement of anthropometry.
In PRONUT, two observers had measured in pairs and were able to repeat any measurements
likely to be incorrect: identified by incompatible measurements or implausibly fast growth. In
FUSAM field visits logistical constraints (a small field team) meant that the study nurse
measured alone, with the trained study driver helping steady and reassure the child. When
Page 77
measuring siblings, there were no previous measurements to compare against. In such field
conditions there was greater potential for error and extreme z-scores were therefore considered
more likely to represent measurement errors than a child who is truly very small or very large.
Following standard criteria(95), individuals with extreme z-scores were thus excluded from
anthropometry-related analysis:
- weight-for-height z-scores, WHZ (NCHS) <-4 or > +6 or
- weight-for-age z-score, WAZ (NCHS) <-6 or >+6 or
- height-for-age z-score HAZ (NCHS) <-6 or >+6
Z-scores were calculated from weight, height/length, age and sex variables using ENA for
SMART software, version October 2007(96).
• Dates
In PRONUT, accurate event dates were mostly available since they were observed on the ward.
In FUSAM, especially when asking neighbours about date of death, there was on rare occasions
some uncertainty. Where the month but not exact date was known, the 15th of the month was
taken as the best estimate. If a sibling’s age but not year or month of birth was known, then the
date was estimated as 1st July of the year which would give the stated age.
5.2.5 Bias
Several factors might have biased results:
• Missing data due to logistics constraints
Completing or fully completing the FUSAM questionnaire was not always possible due to
logistical reasons:
- If a home address was not available no visit could be attempted and no information was
available on long term outcomes.
- Due to only one field team, one project vehicle and limited project funding, FUSAM visits
were only made to children known not to have died before the study started in summer 2007.
Some children were known to have died before this time, full FUSAM details were not always
known since the full questionnaire had not yet been developed (e.g. asking about compliance
with supplementary feeding and HIV treatment services).
- Repeat visits to the same address were rarely made for collecting secondary outcomes alone.
(e.g. sibling anthropometry).
• Missing data due to patient confidentiality constraints
In the community setting, it was not always appropriate to ask all the questions covered by the
FUSAM questionnaire. e.g. relatives of neighbours sometimes reported that a family had moved

Page 78
away. In such cases, it was often appropriate to ask whether the ex-MOYO child was alive or
dead, but mostly inappropriate to ask further clinical questions.
• Hawthorne effect
FUSAM children, whether or not also enrolled in PRONUT, were treated in MOYO during the
period of a research study. Though it was primarily a service ward rather than a specialised
research unit, the extra staff, inputs and attention to carefully following protocols may have
affected treatment impact. This possible effect of this cannot be quantified or adjusted for in
analyses and may or may not have implications for generalizability which will be discussed
later.
• Recall bias
This might have occurred if carers of children who died systematically recalled details of care
and clinical progress differently to those who were still alive at FUSAM visit. For example,
carers of children still alive might selectively remember better aspects of their original treatment
and forget the worse aspects. The opposite might be true for carers of children who died as they
seek to understand and explain the death.
• Selection bias due to MOYO admissions system
MOYO admissions are not representative of all SAM in the community and could even under-
represent cases of SAM presenting to the paediatric A&E at Queen Elizabeth Hospital:
- Very sick patients might die in the admissions area or on the special care ward before
transfer to MOYO
- Borderline cases might be missed and wrongly sent to the normal paediatric wards
instead of to MOYO.
Whilst possible, the potential for these selection biases to influence the overall direction or
interpretation of study results is minimal. Firstly, the two biases would likely cancel each other
out: the first would cause underestimation of true SAM mortality; the second would
underestimate SAM survival since it is the mild, low risk cases who are most likely to be
missed.
Furthermore, over the period of this study efforts were made to sensitise all staff in A&E and on
the general wards to correctly identify and transfer children with SAM to MOYO. Nursing
capacity on MOYO was also good. Patients who in previous years might have been admitted to
other wards to receive oxygen or blood or similar were increasingly being looked after on
MOYO itself.
Minimising biases
Exploring whether biases might have affected our overall conclusions, I examined
baseline characteristics (thus not susceptible to recall bias) of all children. Comparing the profile

Page 79
of unknowns against those known alive and those known dead gave some indication of what
the unknown outcome is more likely to have been.
5.2.6 Study Size
Since baseline data for FUSAM relied on admission information collected by PRONUT, study
size was determined by the numbers of children admitted to MOYO during the period of
PRONUT enrolment (see chapter 4.2.6). FUSAM was a follow-on project rather than a
completely separate study. Separate a-priori calculations were not therefore done prior to
FUSAM.
The strength of any positive findings can be easily seen by confidence intervals.
Possible false negative findings can be harder to identify. An advantage of PRONUT in this
respect is that it ranks among the larger SAM-related studies. The original sample size of 400
per group was large enough, at 95% significance, 80% power, and accommodating 100 total
losses to follow-up, to detect an inter-group difference of 65% vs. 75% cure. To show inter
group mortality difference of 25% vs. 15%, 270 patients would be needed per group. Given that
1024 patients were analysed in FUSAM (compared to 796 in PRONUT) it is clear that the effect
of most clinically important exposures, even if unevenly distributed, would likely be observed.
5.2.7 Quantitative variables
Time to event in Kaplan-Meier analysis and Cox regression
Beginning time 0 was date of admission to MOYO ward. Small numbers of patients
died within hours of admission to the ward. So that they would still be counted in the model, all
those who died on day 0 were recoded as 0.5days of FUSAM follow-up. Time to FUSAM
follow-up for other patients was calculated in days by subtracting date of admission from date
of final known outcome (alive, dead or unknown/other).
Time to follow-up was not constant for all patients, and could be longer for some
patients than others because FUSAM visits were organized in batches, according to their home
location. Repeat visits were also sometimes necessary to chase missing information, when for
example a family was away from home when first visited. With only one follow-up team, it was
logistically impossible to visit each patient at a fixed time post admission.
5.2.8 Statistical methods
Data entry and cleaning
Similar to PRONUT, FUSAM data were entered in EpiData 3.1 (EpiData Association, Odense,
Denmark, 2003-4). A dedicated data entry file was written with simple macros (‘Check’ files)
that helped ensure high quality data entry, e.g. variables plausible, in-range and consistent with

Page 80
other related variables. Key data (anthropometry, dates, final outcomes, HIV status) were
double entered. This FUSAM database was then merged with the PRONUT database,
describing complete patient care from original admission to final outcome.
During data cleaning, inconsistent or unexpected results like long times to final
outcome were cross checked against original patient files to ensure no data transcription or
entry errors.
Data analysis
Main analyses were performed using Stata Intercooled 10.0TM(StataCorp LP, USA).
Chi-square tables and approximate confidence limits for relative risk were used to
examine categorical data using StatCalc (CDC, Atlanta, USA, 1993). Where cell numbers are
small, Fisher exact results are noted.
To assess the role of HIV as a possible confounder or effect modifier, major analyses
included HIV serostatus (positive or negative) as a stratification level.
Wealth index
The PRONUT questionnaire recorded wealth-marking asset ownership (e.g. radio
ownership, land ownership, access to electricity, type of water source). These were based on
validated questions from the Malawi 2004 Demographic and Health Survey(97). Principal
component analysis(98) was used to convert the multiple wealth items into a single index divided
into wealth quintiles.
Kaplan-Meier analysis
Time-to-death ‘step-up’ curves rather than ‘step-down’ survival curves are presented,
in accordance with suggested best practice(99). This emphasises mortality as the primary study
outcome, and also better demonstrates inter-group differences.
Cox regression
As evident from the initial curves, the effect of HIV appeared to change over time and
thus violated the proportional hazards assumption. This was confirmed by a formal test using
Schoenfeld residuals. Subsequent analyses are therefore presented stratified by HIV. Other
major adjustor variables (admission oedema, admission age, admission MUAC, admission
WAZ) did not violate the assumption.
As will be discussed, there is no reason to believe that censored children due to
unknown final outcomes had an atypical risk of death compared to non censored children.
Due to tied times to failure especially early on in treatment, the ‘exactp’ option within
Stata’s ‘stcox’ command was specified in all reported regression models. This was
computationally more complex and hence slower but was the appropriate option in this study
given the early tied failures. Using the default option gave minor differences in the detail of the
results but no overall important differences which would have led to different conclusions.

Page 81
5.2.9 Ethics
Following completion of PRONUT, specific permission to follow up children long term was
obtained from the COMREC (College of Medicine Research and Ethics Committee). Funding for
the study was only obtained in mid 2007, so though the idea had been considered for some
time, it was not previously known whether the study would be possible.
Home follow-up is routine in nutrition programmes, follows a previous study based at
MOYO(84) and has the particular advantage of being of direct benefit to the patient: being able to
identify any problems, advise on, and where necessary refer for further care.

Page 82
5.3 Results - Study flow chart and summary outcomes
From 12th July 2006 to 14th March 2007, 1024 children were admitted to MOYO. Long term
outcome information was found on 899/1024(88%). Short, medium and long term outcomes are
summarized in the study flow chart:
Figure 12 FUSAM study flow chart - all admissions to MOYO
Key long term outcomes are defined as:
• Late death = death ≥90 days after original admission to the ward
• Alive = known alive at ≥ 1year after original admission to the ward.
1024 patients admitted to
MOYO nutrition ward
(445 HIV +ve; 459 HIV -ve)
Inpatient death 238
Stabilized to OTP 732
Death (in 1
st 90
days after admission)
84
Readmitted 52
Nutritional fail 37
T/F out 9 Default 72
Other 7
Late death 17
Unknown or other
10
Alive 25
(of whom 1 still sick)
Late death 31
Unknown or other
28
Alive 66
(of whom 4 still sick)
Unknown or other
57
Alive 365
(of whom 7 still sick)
Transfer (T/F) out 12 Absconder 23
Don’t know/other 19
Other / not known
40
Alive 6
(of whom 0 still sick)
Short term
(inpatient)
outcomes
Medium term (OTP)
o Outcomes
OTP cure 471
Long term
outcomes
Late death8
Late death 49
Page 83
5.3.1 FUSAM summary - total survivors
A total of 462/1024(45%) children were known to be still alive at a year or more after discharge
from treatment. Of these 432/462 (94%) were seen in person by the study team and 30/462 (6%)
were reported by family or neighbours to be alive.
Long term survival was greatest amongst children who had been successfully cured
following initial treatment. Of 471 discharged from the OTP as nutritionally cured, 365/471
(77%) were still alive at a year or more after their first admission.
5.3.2 FUSAM summary - total mortality
A total of 427/1024 (42%) children were known to have died. As will be explored in subsequent
analyses, most deaths were early in the programme:
• 238/427 (56%) children died during initial inpatient treatment
• 84/427 (20%) died in the medium term, within 90 days of programme admission
• 105/427 (25%) died over the longer term follow-up period
Most deaths were in children with underlying HIV:
• 274/427 (64%) of all deaths were known seropositive. Differently expressed,
274/445(62%) of known seropositive children died.
• 77/427 (18%) of all deaths were known seronegative. Differently expressed, 77/459
(17%) of known seronegative children died.
• 76/427 (18%) of all deaths were of unknown status. These were almost all very early
ward deaths who died before a test could be done.
5.3.3 FUSAM summary - Total unknown final outcome
Final 1 year status was unknown for 135/1024 (13%) of children originally admitted:
• 45/135 (33%) could not be traced at the address given
• 42/135 (31%) did not give an address in the first place
• 31/135 (23%) had missing notes
• 7/135 (5%) lived too far away for the follow-up team to visit
• 10/135 (7%) were reported alive but at <1year following the original admission. This
happened where a family had moved from their original address and relatives or
neighbours reported that the child was alive when last seen. In such cases, the date of
final outcome was the date of that last reliable sighting. No assumptions were made
about current status of the child at the 1 year visit.

Page 84
5.4 Results – Baseline patient profile at admission to MOYO
In this section I present patient characteristics at admission to the MOYO nutrition ward. The
results columns highlight key issues which will be explored in subsequent analyses:
• Which admission characteristics are associated with death and which with being still
alive ≥1 year later
• Are there any differences between those children who die early (inpatient or OTP
deaths) and those who die late (>90 days after admission)
• Do admission characteristics of children whose 1 year outcome is unknown suggest that
they are more likely to be dead or alive (i.e. is there a likely systematic bias that would
affect the validity of comparing known deaths vs. known live children)
For simplicity, statistical comparisons between the groups are not presented here.
Multivariable analyses will be presented later: these are important and necessary to account for
issues like weight-based z-score indices in oedematous patients. Because of its known adverse
effect on outcomes, relevant results are however stratified by HIV status.
5.4.1 Age & sex profile
Table 11 shows that children who died were younger than those still alive at 1 year. The
youngest group were late deaths. The age of those whose final outcome was unknown was
more similar to survivors than deaths.
Sex ratio on admission was balanced close to 50% for all outcome groups except late deaths,
who have a preponderance of boys.
Table 11 Age and sex of MOYO patients, by final outcome
All patients
(n=1024)
Inpatient or
OTP death
(n=322)
Late death
(n=105)
Alive at ≥1
year post
admission
(n=462)
Unknown 1
year
outcome
(n=135)
Age in months
(median, IQR) 21.5 (15 to 32) 19.4 (13 to 30) 18.8 (12 to 29) 23.3 (17 to 34) 23.8 (16 to 36)
Boys 543/1024(53%) 156/322 (48%) 66/105 (63%) 251/462 (54%) 70/135 (52%)

Page 85
5.4.2 Nutritional profile
Table 12 shows that oedematous SAM was the dominant form of malnutrition, accounting for
almost 70% of admissions. It was most prevalent among HIV negative patients, 85% of whom
had oedematous SAM. Children whose HIV status was unknown had a prevalence of
kwashiorkor somewhere between those who were known seropositive and seronegative.
Risk of death was lower in oedematous than in non-oedematous SAM. Whilst severe
wasting accounted for 27% of all admissions, it accounted for almost half of all deaths. Most
wasted patients had both low weight-for-height and low MUAC. Twelve percent had a low
MUAC <11cm alone; one percent had a normal MUAC but low weight-for-height. (annex H.1)
The admission profile of the unknown final outcome group was again more similar to
those known alive than those known to have died 1 year.
Table 12 Nutritional diagnosis of MOYO patients at admission, according to final outcome
All patients
(n=1024)
Inpatient or
OTP death
(n=322)
Late death
(n=105)
Alive at ≥1
year post
admission
(n=462)
Unknown 1
year
outcome
(n=135)
Kwashiorkor (all) 697/1024 (68%) 175/322 (54%) 45/105 (43%) 383/462 (83%) 94/135 (70%)
In HIV ○- 391/459 (85%) 37/57 (65%) 13/20 (65%) 278/315 (88%) 63/67 (94%)
In HIV ○+ 237/445 (53%) 89/191 (47%) 31/83 (37%) 98/139 (71%) 19/32 (59%)
In HIV unknown 69/120 (58%) 49/74 (66%) 1/2 (50.0%) 7/8 (88%) 12/36 (33%)
Severe wasting (all) 275/1024 (27%) 135/322 (42%) 55/105 (52%) 69/462 (15%) 16/135 (12%)
In HIV ○- 61/459 (13%) 19/57(33%) 7/20 (35%) 33/315 (10%) 2/67 (3%)
In HIV ○+ 184/445 (41%) 92/191 (48%) 48/83 (58%) 32/139 (23%) 9/32 (28%)
In HIV unknown 30/120 (25%) 24/74 (32%) 0/2 (0%) 1/8 (13%) 5/36 (14%)
Not SAM or
unknown
52/1024 (5%) 12/322 (4%) 5/105 (5%) 10/462 (2%) 25/135 (19%)
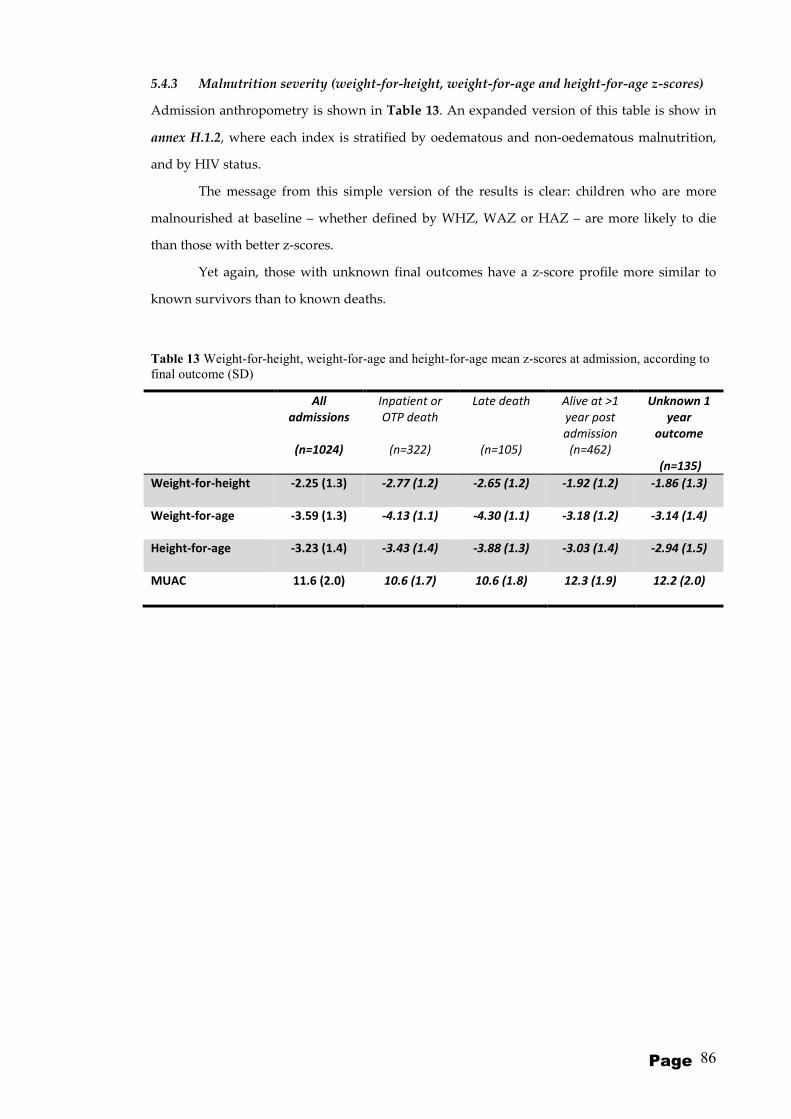
Page 86
5.4.3 Malnutrition severity (weight-for-height, weight-for-age and height-for-age z-scores)
Admission anthropometry is shown in Table 13. An expanded version of this table is show in
annex H.1.2, where each index is stratified by oedematous and non-oedematous malnutrition,
and by HIV status.
The message from this simple version of the results is clear: children who are more
malnourished at baseline – whether defined by WHZ, WAZ or HAZ – are more likely to die
than those with better z-scores.
Yet again, those with unknown final outcomes have a z-score profile more similar to
known survivors than to known deaths.
Table 13 Weight-for-height, weight-for-age and height-for-age mean z-scores at admission, according to
final outcome (SD)
All
admissions
(n=1024)
Inpatient or
OTP death
(n=322)
Late death
(n=105)
Alive at >1
year post
admission
(n=462)
Unknown 1
year
outcome
(n=135)
Weight-for-height -2.25 (1.3) -2.77 (1.2) -2.65 (1.2) -1.92 (1.2) -1.86 (1.3)
Weight-for-age -3.59 (1.3) -4.13 (1.1) -4.30 (1.1) -3.18 (1.2) -3.14 (1.4)
Height-for-age -3.23 (1.4) -3.43 (1.4) -3.88 (1.3) -3.03 (1.4) -2.94 (1.5)
MUAC 11.6 (2.0) 10.6 (1.7) 10.6 (1.8) 12.3 (1.9) 12.2 (2.0)

Page 87
5.4.4 HIV related profile
Table 14 shows that HIV was prevalent in the MOYO population. For ease of interpretation,
only death and survivor columns are shown: the full version of the table with additional
columns for all patients and those with unknown final outcome is in annex H.1.3
HIV status was known for almost 90% of all children. Large numbers of seronegative
children also had symptoms and signs which would traditionally be considered as HIV staging
criteria. Common reasons for them to have a stage 3 or 4 diagnosis include previous admissions
to SFP, TFP and oral candida.
Clinical staging in both HIV seropositive and seronegative patients was more advanced
among patients who died than in those alive at 1 year. CD4 was also lower among deaths,
whether expressed as mean of all values or as % of children below the age-adjusted ‘severely
low’ threshold.
Table 14 Baseline HIV profile, according to final outcome
Inpatient or OTP
death
(n=322)
Late death
(n=105)
Alive at >1 year post
admission
(n=462)
Child HIV status
HIV ○- 57 (18%) 20 (19%) 315 (68%)
HIV ○+ 191 (59%) 83 (70%) 139 (30%)
HIV unknown 74 (23%) 2 (2%) 8 (2%)
HIV staging:
HIV ○- only n=52 n=20 n=307
Stage 0 7 (14%) 3 (15%) 86 (28%)
Stage 1 or 2 6 (12%) 5 (25%) 51 (17%)
Stage 3 35 (67%) 8 (40%) 129 (42%)
Stage 4 4 (8%) 4 (20%) 41 (13%)
HIV staging:
HIV ○+ only n=185 n=83 n=134
Stage 0 14 (8%) 9 (11%) 19 (14%)
Stage 1 or 2 21 (11%) 6 (7%) 26 (19%)
Stage 3 101 (55%) 53 (64%) 65 (49%)
Stage 4 49 (27%) 15 (18%) 25 (18%)
CD4* n=31 n=63 n=93
CD4 severely low
(age adjusted %)† 27 (87%) 40 (63%) 45 (48%)
CD4%, mean (SD) 12.9 (8.4) 17.1 (8.2) 20.5 (10.6)
* Taken for HIV positive patients only, mostly taken at 1st outpatient visit, 2 weeks after
discharge from ward. Small numbers also available for ward patients.
†Age adjusted thresholds for low CD4 were: CD4 <25% for infants aged <12 months; <20% for
those aged 12 to 35 months; <15% for those aged 36 to 59months; <15% for those aged 60
months or older (Source: ARV therapy of HIV infection in infants and children in resource-
limited settings, towards universal access: Recommendations for a public health approach
(2006 revision) World Health Organization)

Page 88
5.4.5 Clinical profile
Table 15 shows the clinical profile of children at admission. For simplicity, only death and alive
at 1 year columns are presented, with the full version of the table in Annex H.1.4.
Several issues are important to note:
- Almost all children present with symptoms of illness other than malnutrition. These were
severe enough to have justified, for most children, visits to OTP clinics or taking of medication
in the two weeks prior to MOYO admission.
- Symptom prevalence was highest in children who died as inpatients or during OTP. For some
but not all symptoms it was lowest in the 1 year survivors.
- Common use of traditional charms (commonly necklaces, bracelets and string waist bands)
may indicate prevalent beliefs in and use of traditional medicines prior to seeking MOYO care.
- Prevalence of breastfeeding until 2 years was low, and lowest among those who died.
- Clinically obvious disability was not uncommon and mostly comprised neurodisability such
as cerebral palsy. Disability was commonest amongst those children who died.
Table 15 Baseline clinical profile, according to final outcome
Inpatient or OTP
death
(n=322)
Late death
(n=105)
Alive at >1 year post
admission
(n=462)
Symptoms in previous 2 weeks
Any 309/311 (99%) 102/105 (97%) 447/460 (97%)
Fever 205/311 (66%) 73/104 (70%) 293/458 (64%)
Diarrhoea 231/310 (75%) 72/105 (69%) 280/456 (61%)
Vomiting 163/313 (52%) 42/105 (40%) 203/458 (44%)
Abdominal pain 123/269 (46%) 37/104 (36%) 188/452 (42%)
Fast or difficult
breathing 45/303 (15%) 20/104 (19%) 62/457 (14%)
Cough 193/308 (63%) 76/105 (72%) 254/459 (55%)
Anorexia 169/294 (57%) 51/104 (49%) 230/454 (51%)
Flaky paint dermatosis 49/306 (16%) 14/104 (13%) 89/452 (20%)
Other 84/314 (27%) 34/104 (33%) 101/454 (22%)
Outpatient consultations in 2 weeks prior to admission (any)
Any 204/271 (75%) 68/102 (67%) 318/456 (70%)
Medication use in last 2 weeks prior to admission
Any 264/296 (89%) 95/103 (92%) 394/450 (88%)
Anaemia
Any (PCV<30) 103/294 (35%) 39/96 (41%) 141/424 (33%)
Severe (PCV <15) 11/294 (4%) 1/96 (1%) 5/424 (1%)
Malaria
(+ve thick blood film) 9/292 (3%) 3/94 (3%) 21/415 (5%)
Has traditional medicine
amulet or charm 87/266 (32%) 25/100 (25%) 108/444 (24%)
Breastfed
(<2 year olds only) 102/192 (53%) 47/69 (68%) 79/243 (33%)
Disability
(any) 24/282 (9%) 9/102 (9%) 22/453 (5%)
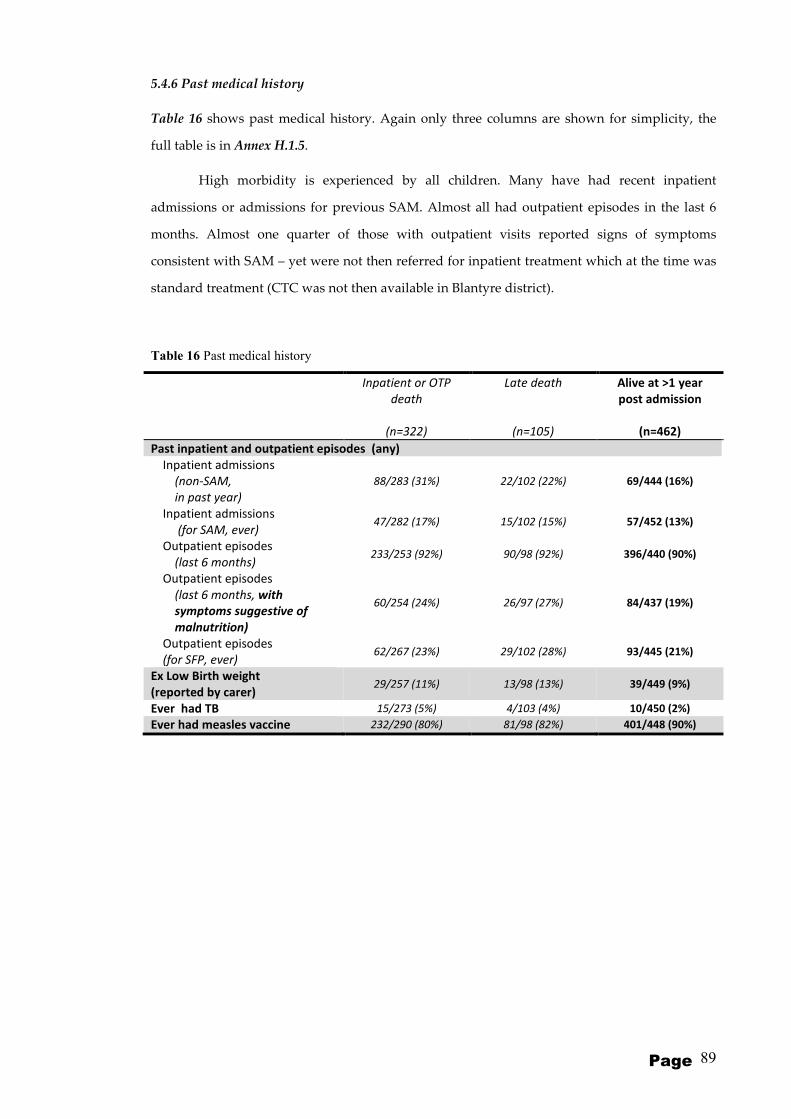
Page 89
5.4.6 Past medical history
Table 16 shows past medical history. Again only three columns are shown for simplicity, the
full table is in Annex H.1.5.
High morbidity is experienced by all children. Many have had recent inpatient
admissions or admissions for previous SAM. Almost all had outpatient episodes in the last 6
months. Almost one quarter of those with outpatient visits reported signs of symptoms
consistent with SAM – yet were not then referred for inpatient treatment which at the time was
standard treatment (CTC was not then available in Blantyre district).
Table 16 Past medical history
Inpatient or OTP
death
(n=322)
Late death
(n=105)
Alive at >1 year
post admission
(n=462)
Past inpatient and outpatient episodes (any)
Inpatient admissions
(non-SAM,
in past year)
88/283 (31%) 22/102 (22%) 69/444 (16%)
Inpatient admissions
(for SAM, ever) 47/282 (17%) 15/102 (15%) 57/452 (13%)
Outpatient episodes
(last 6 months) 233/253 (92%) 90/98 (92%) 396/440 (90%)
Outpatient episodes
(last 6 months, with
symptoms suggestive of
malnutrition)
60/254 (24%) 26/97 (27%) 84/437 (19%)
Outpatient episodes
(for SFP, ever) 62/267 (23%) 29/102 (28%) 93/445 (21%)
Ex Low Birth weight
(reported by carer) 29/257 (11%) 13/98 (13%) 39/449 (9%)
Ever had TB 15/273 (5%) 4/103 (4%) 10/450 (2%)
Ever had measles vaccine 232/290 (80%) 81/98 (82%) 401/448 (90%)

Page 90
5.4.7 Family and socioeconomic status
Table 17 shows the family profile (full table in annex H.1.6). Key results include:
- There is a high prevalence of orphaning:
- Almost a quarter of families have lost a previous child
- There was no obvious pattern in birth order of the MOYO child
- Most mothers reported having had at least primary school education, yet almost a third also
described themselves as illiterate.
- Fathers were overall better educated than mothers, with fewer reports of illiteracy.
Table 17 Family profile
Inpatient or OTP
death
(n=322)
Late death
(n=105)
Alive at >1 year
post admission
(n=462)
Orphan
Mother died 18/264 (7%) 10/102 (10%) 36/457 (8%)
Father died 22/261 (8%) 9/102 (9%) 28/452 (6%)
Both dead 9/240 (4%) 4/91 (4%) 10/410 (2%)
Previous child death in family 76/306 (25%) 24/103 (23%) 110/457 (24%)
Birth order of MOYO child
First 76/272 (28%) 26/103 (25%) 126/453 (28%)
Second 70/272 (26%) 26/103 (25%) 115/453 (25%)
Third 60/272 (22%) 20/103 (19%) 87/453 (19%)
Fourth or later 66/272 (24%) 31/103 (30%) 125/453 (28%)
Maternal education
None 30/254 (12%) 13/98 (13%) 51/433 (12%)
Primary school 164/254 (65%) 70/98 (71%) 303/433 (70%)
Secondary school 60/254 (24%) 15/98 (15%) 79/433 (18%)
Paternal education
None 10/176 (6%) 1/68 (1%) 14/337 (4%)
Primary school 77/176 (44%) 31/68 (46%) 156/337 (46%)
Secondary school 89/176 (51%) 36/68 (53%) 167/337 (50%)
Mother illiterate 88/256 (34%) 35/100 (35%) 160/437 (37%)
Father illiterate 25/233 (11%) 5/93 (5%) 36/423 (9%)
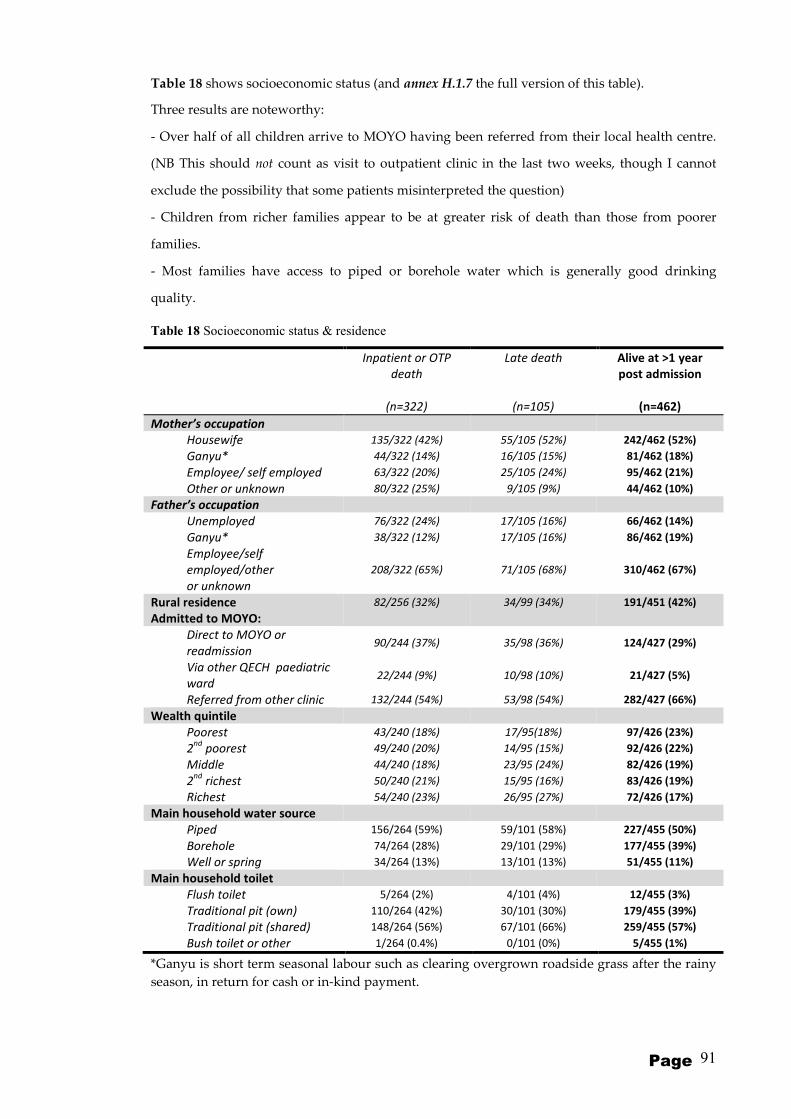
Page 91
Table 18 shows socioeconomic status (and annex H.1.7 the full version of this table).
Three results are noteworthy:
- Over half of all children arrive to MOYO having been referred from their local health centre.
(NB This should not count as visit to outpatient clinic in the last two weeks, though I cannot
exclude the possibility that some patients misinterpreted the question)
- Children from richer families appear to be at greater risk of death than those from poorer
families.
- Most families have access to piped or borehole water which is generally good drinking
quality.
Table 18 Socioeconomic status & residence
Inpatient or OTP
death
(n=322)
Late death
(n=105)
Alive at >1 year
post admission
(n=462)
Mother’s occupation
Housewife 135/322 (42%) 55/105 (52%) 242/462 (52%)
Ganyu* 44/322 (14%) 16/105 (15%) 81/462 (18%)
Employee/ self employed 63/322 (20%) 25/105 (24%) 95/462 (21%)
Other or unknown 80/322 (25%) 9/105 (9%) 44/462 (10%)
Father’s occupation
Unemployed 76/322 (24%) 17/105 (16%) 66/462 (14%)
Ganyu* 38/322 (12%) 17/105 (16%) 86/462 (19%)
Employee/self
employed/other
or unknown
208/322 (65%) 71/105 (68%) 310/462 (67%)
Rural residence 82/256 (32%) 34/99 (34%) 191/451 (42%)
Admitted to MOYO:
Direct to MOYO or
readmission 90/244 (37%) 35/98 (36%) 124/427 (29%)
Via other QECH paediatric
ward 22/244 (9%) 10/98 (10%) 21/427 (5%)
Referred from other clinic 132/244 (54%) 53/98 (54%) 282/427 (66%)
Wealth quintile
Poorest 43/240 (18%) 17/95(18%) 97/426 (23%)
2nd
poorest 49/240 (20%) 14/95 (15%) 92/426 (22%)
Middle 44/240 (18%) 23/95 (24%) 82/426 (19%)
2nd
richest 50/240 (21%) 15/95 (16%) 83/426 (19%)
Richest 54/240 (23%) 26/95 (27%) 72/426 (17%)
Main household water source
Piped 156/264 (59%) 59/101 (58%) 227/455 (50%)
Borehole 74/264 (28%) 29/101 (29%) 177/455 (39%)
Well or spring 34/264 (13%) 13/101 (13%) 51/455 (11%)
Main household toilet
Flush toilet 5/264 (2%) 4/101 (4%) 12/455 (3%)
Traditional pit (own) 110/264 (42%) 30/101 (30%) 179/455 (39%)
Traditional pit (shared) 148/264 (56%) 67/101 (66%) 259/455 (57%)
Bush toilet or other 1/264 (0.4%) 0/101 (0%) 5/455 (1%)
*Ganyu is short term seasonal labour such as clearing overgrown roadside grass after the rainy
season, in return for cash or in-kind payment.
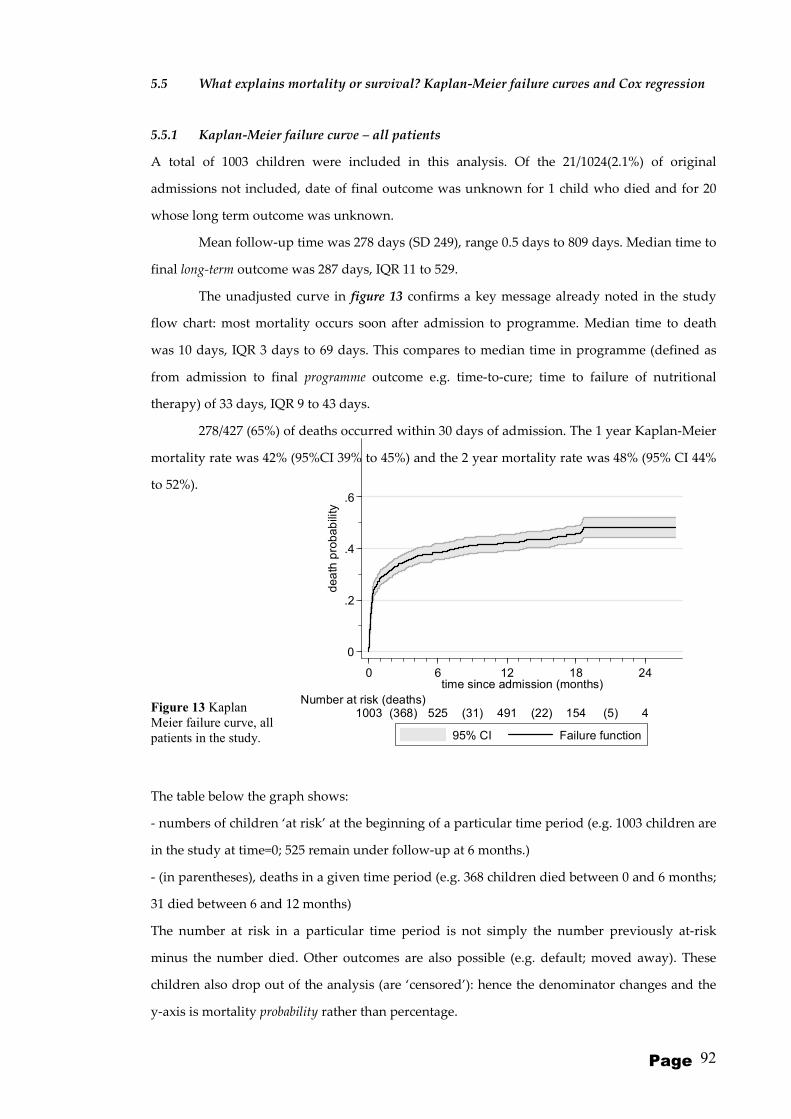
Page 92
0
.2
.4
.6
dea
th p
rob
ab
ility
0 6 12 18 24time since admission (months)
1003 525(368) 491(31) 154(22) 4(5) Number at risk (deaths)
95% CI Failure function
5.5 What explains mortality or survival? Kaplan-Meier failure curves and Cox regression
5.5.1 Kaplan-Meier failure curve – all patients
A total of 1003 children were included in this analysis. Of the 21/1024(2.1%) of original
admissions not included, date of final outcome was unknown for 1 child who died and for 20
whose long term outcome was unknown.
Mean follow-up time was 278 days (SD 249), range 0.5 days to 809 days. Median time to
final long-term outcome was 287 days, IQR 11 to 529.
The unadjusted curve in figure 13 confirms a key message already noted in the study
flow chart: most mortality occurs soon after admission to programme. Median time to death
was 10 days, IQR 3 days to 69 days. This compares to median time in programme (defined as
from admission to final programme outcome e.g. time-to-cure; time to failure of nutritional
therapy) of 33 days, IQR 9 to 43 days.
278/427 (65%) of deaths occurred within 30 days of admission. The 1 year Kaplan-Meier
mortality rate was 42% (95%CI 39% to 45%) and the 2 year mortality rate was 48% (95% CI 44%
to 52%).
Figure 13 Kaplan
Meier failure curve, all
patients in the study.
The table below the graph shows:
- numbers of children ‘at risk’ at the beginning of a particular time period (e.g. 1003 children are
in the study at time=0; 525 remain under follow-up at 6 months.)
- (in parentheses), deaths in a given time period (e.g. 368 children died between 0 and 6 months;
31 died between 6 and 12 months)
The number at risk in a particular time period is not simply the number previously at-risk
minus the number died. Other outcomes are also possible (e.g. default; moved away). These
children also drop out of the analysis (are ‘censored’): hence the denominator changes and the
y-axis is mortality probability rather than percentage.

Page 93
5.5.2 Kaplan-Meier failure curves – by HIV
Failure curves by HIV serostatus illustrate the marked adverse impact of HIV on mortality.
Figure 14 Kaplan Meier failure curves, by HIV serostatus
For both HIV negative and positive patients, most deaths occur soon after admission. For HIV
negative patients, ongoing mortality after the first 90 days does occur but is limited. This
contrasts with HIV positive patients who experience high rates of ongoing mortality, even later
than 1 year post-admission (table 19). HIV related risks are not thus constant over the whole
time period, which is why most of the reported Cox regression tables are presented stratified by
HIV. The Log-rank test for difference between HIV negative and positive mortality was
p<0.0001.
Table 19 Kaplan-Meier failure function showing early mortality probability at 30 and 90 days, and late
mortality probability at 1 and 2 years after admission to programme
Time after admission to programme
30 days 90 days 1 year 2 years
HIV negative
(n=459) 12% (9 to 15) 13% (11 to 17) 16% (13 to 20) 19% (15 to 23)
HIV positive
(n=445) 35% (30 to 39) 46% (42 to 51) 60% (55 to 65) 69% (63 to 74)
0
.2
.4
.6
.8
dea
th p
rob
ab
ility
0 6 12 18 24time since admission (months)
443 185(227) 158(27) 52(14) 1(5)HIV positive459 330(67) 324(3) 100(7) 3(0)HIV negative
Number at risk (deaths)
95% CI 95% CI
HIV negative HIV positive
K ap lan -M e ier f ailu re e st im at es
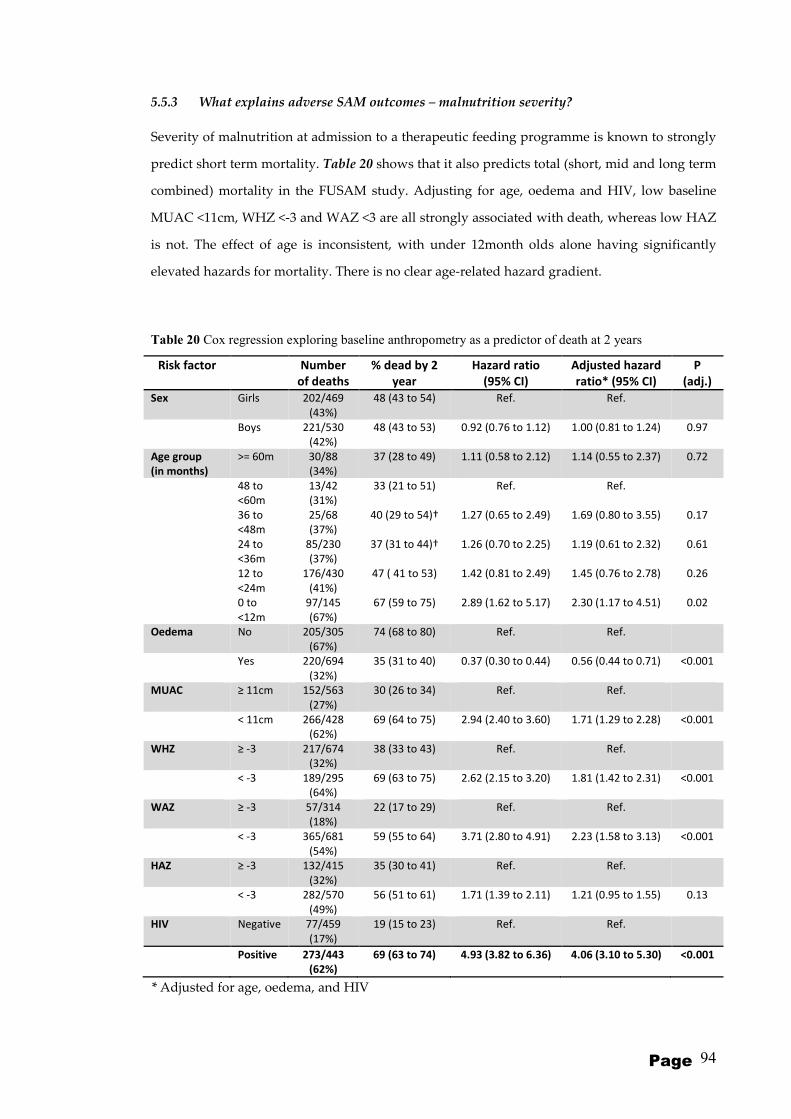
Page 94
5.5.3 What explains adverse SAM outcomes – malnutrition severity?
Severity of malnutrition at admission to a therapeutic feeding programme is known to strongly
predict short term mortality. Table 20 shows that it also predicts total (short, mid and long term
combined) mortality in the FUSAM study. Adjusting for age, oedema and HIV, low baseline
MUAC <11cm, WHZ <-3 and WAZ <3 are all strongly associated with death, whereas low HAZ
is not. The effect of age is inconsistent, with under 12month olds alone having significantly
elevated hazards for mortality. There is no clear age-related hazard gradient.
Table 20 Cox regression exploring baseline anthropometry as a predictor of death at 2 years
Risk factor Number
of deaths
% dead by 2
year
Hazard ratio
(95% CI)
Adjusted hazard
ratio* (95% CI)
P
(adj.)
Sex Girls 202/469
(43%)
48 (43 to 54) Ref. Ref.
Boys 221/530
(42%)
48 (43 to 53) 0.92 (0.76 to 1.12) 1.00 (0.81 to 1.24) 0.97
Age group
(in months)
>= 60m 30/88
(34%)
37 (28 to 49) 1.11 (0.58 to 2.12) 1.14 (0.55 to 2.37) 0.72
48 to
<60m
13/42
(31%)
33 (21 to 51) Ref. Ref.
36 to
<48m
25/68
(37%)
40 (29 to 54)† 1.27 (0.65 to 2.49) 1.69 (0.80 to 3.55) 0.17
24 to
<36m
85/230
(37%)
37 (31 to 44)† 1.26 (0.70 to 2.25) 1.19 (0.61 to 2.32) 0.61
12 to
<24m
176/430
(41%)
47 ( 41 to 53) 1.42 (0.81 to 2.49) 1.45 (0.76 to 2.78) 0.26
0 to
<12m
97/145
(67%)
67 (59 to 75) 2.89 (1.62 to 5.17) 2.30 (1.17 to 4.51) 0.02
Oedema No 205/305
(67%)
74 (68 to 80) Ref. Ref.
Yes 220/694
(32%)
35 (31 to 40) 0.37 (0.30 to 0.44) 0.56 (0.44 to 0.71) <0.001
MUAC ≥ 11cm 152/563
(27%)
30 (26 to 34) Ref. Ref.
< 11cm 266/428
(62%)
69 (64 to 75) 2.94 (2.40 to 3.60) 1.71 (1.29 to 2.28) <0.001
WHZ ≥ -3 217/674
(32%)
38 (33 to 43) Ref. Ref.
< -3 189/295
(64%)
69 (63 to 75) 2.62 (2.15 to 3.20) 1.81 (1.42 to 2.31) <0.001
WAZ ≥ -3 57/314
(18%)
22 (17 to 29) Ref. Ref.
< -3 365/681
(54%)
59 (55 to 64) 3.71 (2.80 to 4.91) 2.23 (1.58 to 3.13) <0.001
HAZ ≥ -3 132/415
(32%)
35 (30 to 41) Ref. Ref.
< -3 282/570
(49%)
56 (51 to 61) 1.71 (1.39 to 2.11) 1.21 (0.95 to 1.55) 0.13
HIV Negative 77/459
(17%)
19 (15 to 23) Ref. Ref.
Positive 273/443
(62%)
69 (63 to 74) 4.93 (3.82 to 6.36) 4.06 (3.10 to 5.30) <0.001
* Adjusted for age, oedema, and HIV

Page 95
Table 21 shows the same risk factors expressed as continuous rather than categorical variables. Due to the non-proportionality of risks, HIV negative and positive
children are shown separately. Adjusted for admission oedema and age, higher admission WHZ, WAZ and MUAC and oedema are all associated with decreased
risk of death. The hazard ratios represent the reduction in risk for each unit increase in z-score or cm of MUAC. As with the previous analysis, low HAZ is not
associated with increased mortality. For HIV negative children, the magnitude of risk reduction per unit improved WHZ, WAZ and MUAC is similar for both short
and long term mortality. For HIV positive patients, adjusted WHZ and MUAC are not associated with short term mortality risk but are highly associated with long
term risk. WAZ is related to both, but more strongly to long term outcomes than short term outcomes, as evidenced by the lower hazard ratio of 0.76 vs 0.85.
Table 21 Cox regression exploring baseline anthropometry as a risk factor for death in 1st 90 days vs. all deaths, by HIV serostatus (adjusted hazard ratios)
Risk factor Hazard ratio for death in 1st
90 days* Hazard ratio for all deaths (short, mid and long term)*
HIV negative p HIV positive p HIV negative p HIV positive p
Sex Boys 0.93 (0.54 to 1.60) 0.80 0.95 (0.71 to 1.28) 0.75 1.12 (0.71 to 1.76) 0.63 0.95 (0.74 to 1.21) 0.69
Age >= 60m 0.60 (0.06 to 6.10) 0.67 0.51 (0.18 to 1.46) 0.21 0.80 (0.20 to 3.32) 0.75 1.31 (0.56 to 3.10) 0.54
48 to <60m Ref. - Ref. - Ref. - Ref. -
36 to <48m 0.82 (0.09 to 7.78) 0.87 0.49 (0.17 to 1.44) 0.20 0.79 (0.18 to 3.56) 0.76 2.17 (0.91 to 5.17) 0.82
24 to <36m 0.86 (0.11 to 7.04) 0.89 0.51 (0.19 to 1.36) 0.18 0.60 (0.16 to 2.18) 0.44 1.45 (0.66 to 3.21) 0.35
12 to <24m 1.81 (0.24 to 13.68) 0.57 0.48 (0.18 to 1.26) 0.14 0.92 (0.28 to 3.00) 0.88 1.77 (0.82 to 3.84) 0.15
0 to <12m 1.78 (0.22 to 14.30) 0.59 0.53 (0.19 to 1.44) 0.21 1.68 (0.48 to 5.86) 0.41 2.57 (1.15 to 5.75) 0.02
Oedema present 0.33 (0.17 to 0.63) 0.001 0.89 (0.65 to 1.22) 0.49 0.35 (0.21 to 0.58) <0.001 0.63 (0.48 to 0.81) <0.001
Admission WHZ���� 0.72 (0.56 to 0.93) 0.01 0.89 (0.76 to 1.03) 0.13 0.72 (0.57 to 0.90) 0.004 0.77 (0.68 to 0.88) <0.001
Admission WAZ���� 0.66 (0.51 to 0.86) 0.002 0.85 (0.73 to 1.00) 0.05 0.66 (0.53 to 0.82) <0.001 0.76 (0.66 to 0.87) <0.001
Admission HAZ���� 0.85 (0.71 to 1.02) 0.10 0.93 (0.83 to 1.05) 0.25 0.85 (0.72 to 1.00) 0.06 0.95 (0.86 to 1.05) 0.33
Admission MUAC���� 0.77 (0.65 to 0.93) 0.005 0.92 (0.83 to 1.03) 0.15 0.77 (0.65 to 0.90) 0.001 0.83 (0.76 to 0.91) <0.001
���� Hazard ratios represent hazard of death for each unit increase. e.g. for 1 z-score increase in admission WHZ, the hazard ratio for death in 1st 90 days for HIV negative
patients is 0.72 (0.56 to 0.93), (=”the risk of death significantly decrease as WHZ improves”).

Page 96
Table 22 explores how discharge anthropometry, adjusted for admission status affects mortality risk. Only those children whose initial OTP outcome was cure are
analysed in this table. This is to avoid autocorrelation: were deaths included, that would be misleading, since anthropometry at death for those who die soon after
admission is very close to anthropometry at admission and anthropometry at admission has already been shown to predict death. So the purpose of this table is to
add some temporal ‘gap’ and discriminate between those who have a better and worse discharge anthropometry whilst controlling for how they were at admission.
The table shows that a better weight gain (in g/kg/day) is associated with significantly less deaths, but in HIV positive patients only. It also shows that
higher discharge MUAC is associated with significantly less death, but in HIV negative patients only. For every 1cm better MUAC at discharge (adjusted for
admission MUAC, oedema, sex, age and admission WAZ), the hazards of death is reduced by 0.41 (95% CI 0.19 to 0.91). Though not significant, there is also a trend
towards the same finding in HIV positive children (p=0.13).
Table 22 Cox regression exploring discharge anthropometry as a risk factor for death, by HIV serostatus
Risk factor Hazard ratio for all deaths (short, mid and long term)*
HIV negative p HIV positive p
Discharge WHZ 0.83 (0.36 to 1.91) 0.67 0.74 (0.41 to 1.32) 0.30
WHZ change (z-scores) 0.56 (0.25 to 1.28) 0.17 0.65 (0.40 to 1.07) 0.09
Weight gain (g/kg/day) 1.01 (0.81 to 1.27) 0.92 0.87 (0.77 to 0.99) 0.03
Discharge WAZ 0.63 (0.20 to 2.00) 0.44 0.68 (0.35 to 1.32) 0.26
WAZ change (z-scores) 0.63 (0.20 to 2.00) 0.44 0.68 (0.35 to 1.32) 0.26
Discharge MUAC (cm) 0.41 (0.19 to 0.91) 0.03 0.73 (0.49 to 1.09) 0.13
MUAC change (cm) 0.59 (0.26 to 1.32) 0.20 0.73 (0.48 to 1.10) 0.13
* Adjusted for admission oedema, age, and sex, WAZ and MUAC

Page 97
5.5.4 What explains adverse SAM outcomes – HIV status?
Hazard ratios in table 23 and subsequent tables are adjusted for sex and age as well as admission oedema and WAZ. This is because they may plausibly
affect clinical, family and socioeconomic variables. For example, carers may selectively prioritize older children or male children when seeking medical care. Hence
even though not associated with mortality on univariate analyses, age and sex are kept in the model. Only MUAC rather than MUAC and WHZ is included because
both are markers of wasting and hence highly correlated with each other. WAZ meanwhile represents another facet of nutritional status and is included. HAZ is not
included since on univariable analysis (table 20) it is not shown to predict mortality.
The strong adverse impact of HIV seropositivity has already been noted in Kaplan-Meier failure curves in section 5.5.2. Table 23 addresses the hypothesis
that more advanced disease, assessed by WHO clinical staging criteria for HIV severity, is associated with worse outcomes. As noted in section 5.4.4, both HIV
positive and HIV negative malnourished children have signs and symptoms consistent with WHO criteria that are usually applied only to HIV positive children.
Both are therefore presented.
Table 23 shows that severity of illness at admission, expressed by WHO clinical stage, is not related to ether short or long term mortality risk. Severely low
CD4 does however predict mortality. The hazard ratio is highest for short term mortality though wide confidence intervals mean it is not statistically significant.
Severely low CD4 (which, is in effect, terminal AIDS) is a highly significant predictor of long term mortality, though the hazard ratio is just 1.89 (1.18 to 3.03).
Table 23 Cox regression exploring signs and symptoms of HIV disease a risk factor for death in 1st 90 days vs. all deaths, by HIV serostatus
Risk factor Hazard ratio for death in 1st
90 days* Hazard ratio for all deaths (short, mid and long term)*
HIV negative p HIV positive p HIV negative p HIV positive p
HIV stage 0 Ref. - Ref. - Ref. - Ref. -
Stage 1 or 2 0.60 (0.16 to 2.30) 0.46 1.11 (0.55 to 2.24) 0.77 1.80 (0.76 to 4.28) 0.19 0.81 (0.46 to 1.43) 0.46
Stage 3 1.47 (0.60 to 3.64) 0.40 0.88 (0.50 to 1.57) 0.67 1.88 (0.92 to 3.83) 0.08 1.14 (0.72 to 1.79) 0.58
Stage 4 0.63 (0.16 to 2.45) 0.51 0.86 (0.46 to 1.63) 0.65 1.22 (0.45 to 3.30) 0.69 1.28 (0.76 to 2.14) 0.35
Severe low CD4
(age-adjusted) n/a - 3.24 (0.92 to 11.4) 0.07 n/a - 1.89 (1.18 to 3.03) 0.008
* Adjusted for admission oedema, age, sex, WAZ and MUAC. NB. Stage 0 represents no signs and symptoms of HIV. Stage 4 represents advanced disease.

Page 98
5.5.5 What explains adverse SAM outcomes – baseline clinical severity of illness?
Table 24 explores clinical factors predicting short and long term mortality. Of symptoms in the previous 2 weeks, diarrhoea in HIV negative patients is associated
with increased hazards of short term mortality. Fast or difficult breathing is associated with short term death in HIV negative patients and long term deaths in HIV
positive patients. In both cases however, the hazards are reduced rather than increased, as might be clinically more plausible. This highlights the risk of multiple
analyses: chance alone may yield statistically significant findings which are not necessarily indicative of real processes or risks.
Other statistically significant findings which are more plausibly real are
- Increased mortality hazards for severe anaemia in HIV negative patients in the short term and for HIV positive patients in the long term.
- Increased mortality hazards for not breastfeeding in HIV negative children for short term mortality alone
- Increased mortality hazards associated with disability. The hazard is elevated for all groups, though wide confidence intervals mean it is only significant for short
term HIV positive deaths and long term HIV negative deaths.

Page 99
Table 24 Cox regression exploring clinical status at admission as a risk factor for death in 1st 90 days vs all deaths, by HIV serostatus
Risk factor Hazard ratio for death in 1st
90 days* Hazard ratio for all deaths (short, mid and long term)*
HIV negative p HIV positive p HIV negative p HIV positive p
Symptoms in previous 2 weeks
Fever 0.66 (0.35 to 1.25) 0.20 0.97 (0.70 to 1.34) 0.84 0.96 (0.58 to 1.58) 0.87 0.85 (0.65 to 1.12) 0.25
Diarrhoea 2.04 (1.05 to 3.97) 0.04 0.81 (0.57 to 1.14) 0.23 1.59 (0.95 to 2.68) 0.08 1.15 (0.88 to 1.51) 0.31
Vomiting 1.71 (0.91 to 3.22) 0.10 1.20 (0.88 to 1.62) 0.25 0.84 (0.52 to 1.37) 0.49 1.23 (0.96 to 1.58) 0.10
Abdominal
pain 1.38 (0.72 to 2.63) 0.33 1.28 (0.92 to 1.78) 0.14 1.41 (0.86 to 2.30) 0.17 0.99 (0.76 to 1.28) 0.92
Fast or
difficult
breathing
0.32 (0.14 to 0.77) 0.01 0.82 (0.54 to 1.25) 0.36 1.12 (0.59 to 2.12) 0.72 0.71 (0.51 to 0.99) 0.04
Cough 0.93 (0.49 to 1.76) 0.83 1.03 (0.75 to 1.42) 0.19 1.06 (0.65 to 1.74) 0.80 1.03 (0.79 to 1.36) 0.80
Anorexia 1.15 (0.58 to 2.28) 0.68 1.21 (0.87 to 1.66) 0.26 0.75 (0.46 to 1.22) 0.25 1.17 (0.91 to 1.51) 0.22
Flaky paint
dematosis 1.00 (0.52 to 1.94) 0.99 0.99 (0.60 to 1.67) 0.99 1.66 (0.93 to 2.96) 0.09 1.14 (0.75 to 1.72) 0.54
Other 0.95 (0.49 to 1.83) 0.87 0.91 (0.65 to 1.26) 0.57 1.10 (0.65 to 1.87) 0.72 1.04 (0.80 to 1.35) 0.78
Outpatient visits (any) 1.65 (0.76 to 3.58) 0.21 1.14 (0.79 to 1.63) 0.49 1.29 (0.75 to 2.20) 0.36 1.03 (0.77 to 1.38) 0.83
Any drugs 1.08 (0.42 to 2.77) 0.88 1.19 (0.68 to 2.11) 0.54 0.80 (0.42 to 1.52) 0.49 1.11 (0.67 to 1.83) 0.69
Anaemia
Any (PCV<30) 0.90 (0.47 to 1.74) 0.76 0.92 (0.66 to 1.28) 0.61 1.08 (0.65 to 1.80) 0.76 1.05 (0.80 to 1.36) 0.73
Severe (PCV <10) 11.95 (1.66 to 86.19) 0.01 1.38 (0.59 to 3.23) 0.45 2.19 (0.66 to 7.23) 0.20 2.62 (1.18 to 5.84) 0.02
Malaria 0.28 (0.04 to 2.18) 0.22 0.93 (0.36 to 2.38) 0.88 0.26 (0.04 to 1.88) 0.18 0.94 to 0.46 to 1.95) 0.88
Has traditional medicine
amulet or charm 1.25 (0.67 to 2.32) 0.48 0.98 (0.67 to 1.42) 0.90 1.40 (0.81 to 2.40) 0.23 1.00 (0.73 to 1.35) 0.99
Not breastfed (<2 year olds
only) 3.06 (1.34 to 6.95) 0.01 1.36 (0.80 to 1.35) 0.13 0.67 (0.36 to 1.26) 0.21 0.98 (0.70 to 1.38) 0.92
Disability (any) 1.97 (0.82 to 4.69) 0.13 2.37 (1.11 to 5.07) 0.03 2.77 (1.43 to 5.34) 0.002 1.76 (0.94 to 3.28) 0.08
* Adjusted for oedema, age, sex , admission WAZ and admission MUAC

Page 100
5.5.6 What explains adverse SAM outcomes – risk factors in past medical history?
Table 25 explores features of a child’s past medical history as a risk factor for death. Differences by HIV serostatus are evidenced by differing hazard ratios, though
few are statistically significant. Ever having had TB is the only factor which significantly increases the hazards of mortality: then only in HIV positive patients and
only for short term deaths alone. The magnitude of this effect is not great: 2.20 (1.18 to 4.10) increased hazards.
Table 25 Cox regression exploring past medical history as a risk factor for death in 1st 90 days vs all deaths, by HIV serostatus
Risk factor Hazard ratio for death in 1st
90 days* Hazard ratio for all deaths (short, mid and long term)*
HIV negative p HIV positive p HIV negative p HIV positive p
Past inpatient and outpatient episodes (any)
Inpatient admissions
(non-SAM, in past year) 0.78 (0.34 to 1.77) 0.54 1.46 (1.03 to 2.05) 0.03 1.03 (0.55 to 1.91) 0.94 1.31 (0.99 to 1.75) 0.06
Inpatient admissions
(for SAM, ever) 0.65 (0.14 to 3.08) 0.58 0.84 (0.59 to 1.28) 0.42 0.49 (0.18 to 1.35) 0.17 1.22 (0.86 to 1.75) 0.27
Outpatient episodes
(last 6 months) 1.60 (0.49 to 5.21) 0.44 1.10 (0.58 to 2.09) 0.76 0.69 (0.34 to 1.40) 0.30 0.69 (0.40 to 1.21) 0.20
Outpatient episodes
(last 6 months, with
symptoms suggestive of
malnutrition)
1.89 (0.82 to 4.34) 0.14 0.75 (0.52 to 1.09) 0.13 1.33 (0.74 to 2.41) 0.34 1.00 (0.74 to 1.36) 1.00
Outpatient episodes
(for SFP, ever) 1.30 (0.62 to 2.72) 0.49 0.72 (0.49 to 1.06) 0.10 0.72 (0.40 to 1.32) 0.29 0.92 (0.69 to 1.23) 0.58
Ex Low Birth weight
(reported by carer) 1.99 (0.79 to 4.98) 0.15 1.17 (0.70 to 1.96) 0.55 1.39 (0.69 to 2.81) 0.36 0.74 (0.49 to 1.12) 0.16
Ever had TB 4.85 (0.50 to 47.11) 0.17 2.20 (1.18 to 4.10) 0.01 2.81 (0.35 to 22.7) 0.33 1.27 (0.77 to 2.09) 0.35
Ever had measles vaccine 1.59 (070 to 3.63) 0.27 0.70 (0.40 to 1.20) 0.19 1.60 (0.71 to 3.58) 0.26 0.96 (0.61 to 1.50) 0.85
* Adjusted for oedema, age, sex, admission WAZ and admission MUAC

Page 101
5.5.7 What explains adverse SAM outcomes – family and socioeconomic risk factors?
Table 26 shows that adjusted for age, sex and admission oedema, WAZ and MUAC, and most types of orphaning have no significant effect on mortality. There is a
possible trend to effect in HIV negative double orphans (p=0.07). Parental education or literacy likewise have no clear effect on mortality. Birth order is statistically
relevant, but only for short term mortality: hazards are increased for third-born HIV positive children and for fourth-born (or later) HIV negative children (though
the wide confidence intervals likely reflect small numbers). Hazards are lowest for children who were second-born.
Table 27 explores socioeconomic risk factors for mortality. Parental occupation does not appear to have a role, and neither does rural residence, water source, or
socioeconomic quintile. There is no clear socioeconomic risk gradient: essential background for interpreting the sole elevated hazard of short term death in 2nd
richest HIV positive patients.
Admission route to MOYO also does not appear to affect mortality risk. There is a non-significant trend towards increased hazards of short term death for those
admitted first to another of the Queen’s hospital paediatric wards and only then to MOYO. This is plausible given that most such admissions were very sick children
admitted to the “Special Care ward” on account of better overnight nursing numbers in the high dependency unit.

Page 102
Table 26 Cox regression exploring family risk factors for death in 1st 90 days vs all deaths, by HIV serostatus
Risk factor Hazard ratio for death in 1st
90 days* Hazard ratio for all deaths (short, mid and long term)*
HIV negative p HIV positive p HIV negative p HIV positive p
Orphan
Mother died 1.48 (0.32 to 6.82) 0.62 1.24 (0.66 to 2.33) 0.50 0.97 (0.35 to 2.70) 0.95 0.72 (0.45 to 1.15) 0.17
Father died 1.88 (0.52 to 6.87) 0.34 1.10 (0.62 to 1.93) 0.75 1.33 (0.52 to 3.42) 0.56 1.35 (0.84 to 2.16) 0.21
Both dead 2.18 (0.43 to 10.94) 0.35 1.27 (0.46 to 3.48) 0.65 2.78 (0.92 to 8.34) 0.07 1.07 (0.47 to 2.45) 0.17
Previous child death in
family 0.59 (0.24 to 1.48) 0.27 1.04 (0.73 to 1.47) 0.84 0.54 (0.26 to 1.14) 0.11 0.89 (0.67 to 1.18) 0.42
Birth order of MOYO child
First 1.43 (0.63 to 3.24) 0.39 1.88 (1.22 to 2.91) 0.005 1.05 (0.55 to 2.02) 0.88 0.95 (0.66 to 1.36) 0.77
Second Ref - Ref. Ref. Ref.
Third 1.11 (0.38 to 3.26) 0.85 1.57 (1.01 to 2.42) 0.04 0.78 (0.35 to 1.74) 0.55 1.03 (0.72 to 1.47) 0.87
Fourth or
later 8.16 (3.06 to 21.71) <0.001 1.66 (1.06 to 2.61) 0.03 0.97 (0.48 to 1.93) 0.92 0.83 (0.58 to 1.18) 0.29
Maternal education
None Ref. Ref. Ref. Ref.
Primary school 1.05 (0.41 to 2.63) 0.93 0.74 (0.42 to 1.30) 0.29 1.06 (0.53 to 2.13) 0.87 0.78 (0.51 to 1.20) 0.27
Secondary school 0.47 (0.13 to 1.76) 0.26 0.84 (0.46 to 1.53) 0.57 0.57 (0.21 to 1.54) 0.27 0.97 (0.60 to 1.57) 0.91
Paternal education
None Ref. Ref. Ref. Ref.
Primary school 1.53 (0.17 to 13.47) 0.70 1.26 (0.51 to 3.12) 0.61 2.84 (0.38 to 21.26) 0.31 0.89 (0.39 to 2.04) 0.79
Secondary school 0.76 (0.08 to 6.93) 0.81 1.28 (0.53 to 3.08) 0.58 2.31 (0.30 to 17.53) 0.42 0.80 (0.35 to 1.84) 0.60
Mother illiterate 1.24 (0.66 to 2.34) 0.51 1.01 (0.70 to 1.48) 0.94 1.16 (0.71 to 1.91) 0.54 0.97 (0.73 to 1.30) 0.85
Father illiterate 1.12 (0.39 to 3.24) 0.21 1.11 (0.61 to 2.05) 0.73 1.05 (0.44 to 2.48) 0.91 0.85 (0.50 to 1.45) 0.56
* Adjusted for oedema, age, sex and admission WAZ and admission MUAC

Page 103
Table 27 Cox regression exploring socioeconomic risk factors for death in 1st 90 days vs all deaths, by HIV serostatus
Risk factor Hazard ratio for death in 1st
90 days* Hazard ratio for all deaths (short, mid and long term)*
HIV negative p HIV positive p HIV negative p HIV positive p
Mother’s occupation
Housewife Ref. Ref. Ref. Ref.
Ganyu 1.37 (0.62 to 3.01) 0.43 1.27 (0.79 to 2.05) 0.33 1.13 (0.62 to 2.05) 0.70 1.03 (0.70 to 1.52) 0.88
Employee/ self employed 1.08 (0.48 to 2.45) 0.86 1.07 (0.73 to 1.57) 0.72 1.45 (0.78 to 2.72) 0.24 0.95 (0.70 to 1.29) 0.74
Other or unknown 1.22 (0.56 to 2.68) 0.61 1.38 (0.91 to 2.11) 0.13 2.51 (1.27 to 4.95) 0.008 1.08 (0.76 to 1.54) 0.65
Father’s occupation
Unemployed Ref. Ref. Ref. Ref.
Ganyu 1.09 (0.40 to 2.96) 0.86 0.77 (0.43 to 1.36) 0.37 0.75 (0.35 to 1.62) 0.47 0.81 (0.51 to 1.30) 0.39
Employee/self
employed/other
or unknown
1.08 (0.50 to 2.33) 0.84 0.85 (0.57 to 1.27) 0.44 0.83 (0.44 to 1.58) 0.58 1.00 (0.72 to 1.38) 0.98
Rural residence 0.97 (0.49 to 1.94) 0.94 0.80 (0.56 to 1.15) 0.22 0.67 (0.39 to 1.13) 0.13 0.82 (0.62 to 1.10) 0.62
Admitted to MOYO:
Direct to MOYO or
readmission Ref. Ref. Ref. Ref.
Via other QECH paediatric
ward 2.77 (0.90 to 8.54) 0.08 1.74 (0.95 to 3.21) 0.07 1.56 (0.60 to 4.07) 0.37 0.90 (0.56 to 1.43) 0.65
Referred from other clinic 0.89 (0.39 to 2.00) 0.77 1.00 (0.69 to 1.46) 0.99 0.68 (0.39 to 1.18) 0.18 0.86 (0.65 to 1.14) 0.29
Wealth quintile
Poorest Ref. Ref. Ref. Ref.
2nd
poorest 1.32 (0.42 to 4.20) 0.64 1.17 (0.63 to 2.14) 0.62 1.35 (0.63 to 2.89) 0.43 0.67 (0.41 to 1.09) 0.10
Middle 0.72 (0.24 to 2.18) 0.56 1.15 (0.67 to 1.98) 0.61 1.11 (0.50 to 2.44) 0.80 0.95 (0.61 to 1.47) 0.82
2nd
richest 1.16 (0.37 to 3.61) 0.80 2.08 (1.19 to 3.65) 0.01 1.49 (0.69 to 3.26) 0.31 0.93 (0.59 to 1.45) 0.75
Richest 0.72 (0.17 to 3.11) 0.66 1.16 (0.70 to 1.94) 0.56 0.95 (0.38 to 2.42) 0.92 0.91 (0.60 to 1.38) 0.66
Main household water source
Piped Ref. Ref. Ref. Ref.
Borehole 1.08 (0.54 to 2.16) 0.83 0.85 (0.59 to 1.24) 0.40 0.72 (0.42 to 1.23) 0.23 0.90 (0.67 to 1.21) 0.50
Well or spring 1.08 (0.46 to 2.55) 0.86 0.92 (0.54 to 1.59) 0.77 1.09 (0.51 to 2.32) 0.83 0.90 (0.60 to 1.37) 0.63
* Adjusted for oedema, age, sex, admission WAZ and admission MUAC

Page 104
5.6 Results - Profile of children found at long term FUSAM follow-up
This section profiles the children found by the FUSAM follow-up team. A total of 667/1024
(65%) original admissions were eligible for a visit. The other 357/1024 (35%) were already
known to have died: 322/1024 (31%) as inpatients or during the first 90 days of outpatient
treatment; a further 35 (3%) after 90 days of original admission, most often following a
readmission episode).
Of the 667 eligible for FUSAM follow-up (figure 15): 436/667 (65%) were seen in person
by the FUSAM study team; 107/667 (16%) were reported on by relatives or neighbours; 44/667
(7%) could not be found at the address given; 42/667 (6%) did not give an address in the first
place; 31/667 (5%) had missing notes so could not be traced; 7/667 (1%) lived too far away to
make a visit possible.
Figure 15 Outcome of FUSAM visit (n=667 patients eligible for visit)
Children found at FUSAM visit to be late deaths were compared against those found to
be still alive. Characteristics of HIV positives children and HIV negative children were also
compared. So that the latter comparison was not confounded by higher HIV-related mortality,
HIV positive children still alive were compared with HIV negative children still alive.
It is important to note minor differences in the denominators in the tables: this reflects
missing information where for example a close relative who was not the primary carer (e.g.
father or grandmother) was answering but did not know details about a treatment, or where it
was inappropriate to ask a neighbour about HIV related issues.
65%
16%
7%
6%
5%
1%
Seen in person by FUSAM
team
Reported on by relatives
or neighbours
Could not be found at
address given
Did not give an address
at original admission
Missing notes
Lived too far away

Page 105
5.6.1 Recurrence of malnutrition
Table 28 shows recurrence of malnutrition reported by carers at FUSAM visit. Recurrence of
both oedematous and non-oedematous malnutrition was significantly higher in children who
were found to have died. Recurrence of non-oedematous malnutrition was also higher in HIV
positive children still alive long term compared to HIV negatives still alive.
At original admission, oedematous malnutrition represented almost 70% of all SAM. In
contrast, recurrences of SAM comprised similar numbers of oedematous and non-oedematous
episodes (13% and 9% overall).
If SAM did recur, it mostly resulted in readmission to inpatient care. Small numbers of
recurrences were treated as outpatients: CMAM services were just starting up in Blantyre
district towards the end of the study period. SAM recurrences in HIV negative patients were
less likely to be admitted than recurrences in HIV positive children.
Table 28 Recurrence of malnutrition in children followed up at long term FUSAM visit: by mortality and
by HIV status
All FUSAM
patients
by long term (≥90day) mortality
(as determined at FUSAM visit)
by HIV status
(children ALIVE at FUSAM visit
only)
(n=543)
Late death
(n=64)
Alive at
> 1year
(n=462)
P†
HIV
positive
(n=139)
HIV
negative
(n=315)
P†
Malnutrition
Recurrence (any)
107/512
(21%)
28/56
(50%)
77/446
(17%) <0.001
30/133
(23%)
44/305
(14%) 0.04
Oedematous
65/510
(13%)
16/55
(29%)
48/445
(11%) <0.001
15/133
(11%)
31/304
(10%) 0.73
Non-
oedematous
44/509
(9%)
13/54
(24%)
30/445
(7%) <0.001
16/132
(12%)
13/305
(4%) 0.002
Admission for
inpatient care
(if SAM)
82/97
(85%)
21/23
(91%)
59/72
(82%) 0.35‡
27/29
(93%)
30/41
(73%) 0.03
† Chi2 test. ‡Fisher exact results where expected cell value is less than 5

Page 106
5.6.2 Clinical progress since discharge
Table 29 summarises clinical progress since discharge from MOYO treatment. Compared to
children found alive at FUSAM, those who died had similar numbers of outpatient visits in the
preceding 6 months but significantly more inpatient admissions. These did not include
admissions or visits immediately before death. Of the 64 late deaths identified at FUSAM, 32/64
(50%) reported dying at home and 21/64 (33%) reported dying in hospital.
Incidence of all symptoms asked about was significantly greater in the 2 weeks prior to
death than in the 2 weeks prior to FUSAM visit for those found still alive. Exact causes of death
could not be determined, but the incidence rate ratio (IRR) was highest for fast breathing (IRR
31.8, 95% CI 19.7 to 53.2) suggesting respiratory disease as the main cause of mortality.
Of patients found alive at FUSAM, HIV positive patients were significantly more likely
than HIV negatives to have been admitted for inpatient care in the past year. They were also
more likely to have had an outpatient consultation in the last 6 months. Except for cough and
fast breathing symptoms in the past two weeks were similar in HIV positive and negative
patients.
Table 29 Inpatient admissions, outpatient visits and clinical symptoms at long term FUSAM visit: by
mortality and by HIV status
All FUSAM
patients
by long term (>90day) mortality
(as determined at FUSAM visit)
by HIV status
(children ALIVE at FUSAM visit
only)
(n=543)
Late death
(n=64)
Alive at
>1year
(n=462)
P†
HIV
positive
(n=139)
HIV
negative
(n=315)
P†
Any inpatient
admissions in last
12 months
(non-SAM)
88/517
(17%)
15/50
(30%)
72/456
(16%) 0.01
35/137
(26%)
34/311
(11%) <0.001
Any outpatient
visits in last 6
months (non-
SAM)
190/496
(38%)
22/44
(50%)
166/446
(37%) 0.10
60/134
(45%)
104/306
(34%) 0.03
Any clinical
symptoms in last 2
weeks
186/501
(37%)
43/46
(93%)
139/442
(31%) <0.001
42/131
(32%)
97/306
(32%) 0.94
Symptoms in last 2 weeks (total patient days with symptom standardized to per 1000 days observation)
Total days of
observation 7014 644 6286 1904 4298
Fever 67 144 60 <0.001 56 63 0.31
Diarrhoea 32 130 23 <0.001 25 22 0.53
Vomiting 17 60 12 <0.001 14 12 0.45
Fast
breathing 14 12 4 <0.001 8 2 <0.001
Cough 45 135 35 <0.001 61 25 <0.001
Oedema 14 98 5 <0.001 6 5 0.64
Other 24 65 19 <0.001 17 20 0.34
† Chi2 test.
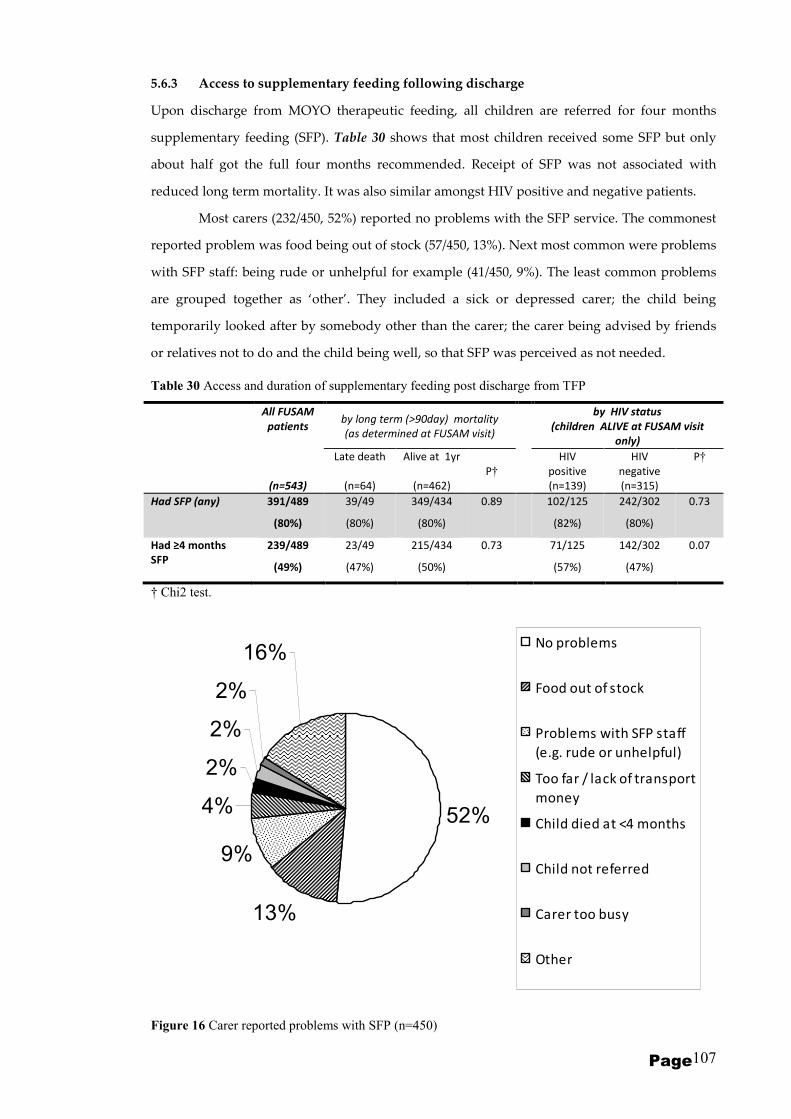
Page 107
5.6.3 Access to supplementary feeding following discharge
Upon discharge from MOYO therapeutic feeding, all children are referred for four months
supplementary feeding (SFP). Table 30 shows that most children received some SFP but only
about half got the full four months recommended. Receipt of SFP was not associated with
reduced long term mortality. It was also similar amongst HIV positive and negative patients.
Most carers (232/450, 52%) reported no problems with the SFP service. The commonest
reported problem was food being out of stock (57/450, 13%). Next most common were problems
with SFP staff: being rude or unhelpful for example (41/450, 9%). The least common problems
are grouped together as ‘other’. They included a sick or depressed carer; the child being
temporarily looked after by somebody other than the carer; the carer being advised by friends
or relatives not to do and the child being well, so that SFP was perceived as not needed.
Table 30 Access and duration of supplementary feeding post discharge from TFP
All FUSAM
patients by long term (>90day) mortality
(as determined at FUSAM visit)
by HIV status
(children ALIVE at FUSAM visit
only)
(n=543)
Late death
(n=64)
Alive at 1yr
(n=462)
P†
HIV
positive
(n=139)
HIV
negative
(n=315)
P†
Had SFP (any) 391/489
(80%)
39/49
(80%)
349/434
(80%)
0.89 102/125
(82%)
242/302
(80%)
0.73
Had ≥4 months
SFP
239/489
(49%)
23/49
(47%)
215/434
(50%)
0.73 71/125
(57%)
142/302
(47%)
0.07
† Chi2 test.
Figure 16 Carer reported problems with SFP (n=450)
52%
13%
9%
4%
2%
2%
2%
16%No problems
Food out of stock
Problems with SFP staff
(e.g. rude or unhelpful)
Too far / lack of transport
money
Child died at <4 months
Child not referred
Carer too busy
Other

Page 108
5.6.4 Access to TB services
Of 543 patients reviewed at FUSAM visit, 39/494 (8%) answering the question about TB
reported ever having treatment. Table 31 shows details of TB treatment and explores differences
amongst: those found dead and those found alive at FUSAM; HIV positive and negative
children found alive at FUSAM. It shows that TB was significantly more prevalent among
children who died and among HIV positive children. In these cases TB most likely reflects high
risk patients. Most cases were diagnosed while the child was still under MOYO TFP care (where
children were investigated on the basis of clinical suspicion e.g. due to a positive family history;
chronic cough; non-response or poor response to other treatments). Small numbers do not allow
easy evaluation of the effect of TB treatment. Most children received the recommended
treatment period of ≥6 months. Those having less than 6 months treatment were more likely to
be late deaths (p=0.04): this may just reflect high risk patients who died within 6 months of start
of treatment rather than being because they didn’t complete treatment. Problems and reasons for
not completing full treatment include: unhelpful TB clinic staff; the child dying whilst still on
treatment. Contact screening and treatment of other children in the family was poor: only 6/39
(15%) carers reported this had been done.
Table 31 TB treatment described at long term follow-up visit
All FUSAM
patients by long term (>90day) mortality
(as determined at FUSAM visit)
by HIV status
(children ALIVE at FUSAM visit
only)
(n=543)
Late death
(n=64)
Alive at 1yr
(n=462)
P†‡
HIV
positive
(n=139)
HIV
negative
(n=315)
P†‡
Ever had TB
treatment
39/494
(8%)
12/46
(26%)
27/439
(6%) <0.001
16/133
(12%)
10/299
(3%) <0.001
IF TB:
Started pre-
MOYO
8/39
(21%)
3/12
(25%)
5/27
(19%) 0.68
4/16
(25%)
1/10
(10%) 0.62
Started whilst
on MOYO ward /
OTP
25/39
(64%)
7/12
(58%)
18/27
(67%) 0.72
11/16
(69%)
7/10
(70%) 1
Started post-
MOYO
6/39
(15%)
2/12
(17%)
4/27
(15%) 1
1/16
(6%)
2/10
(20%) 0.54
If TB:
had ≥6 months
treatment
29/39
(74%)
6/12
(50%)
23/27
(85%) 0.04
13/16
(81%)
9/10
(90%) 1
If TB:
Were other
children
screened or
treated
6/39
(15%)
0/12
(0%)
6/27
(22%) 0.15
3/16
(19%)
3/10
(30%) 0.64
If TB:
No problems
reported with
the treatment
24/39
(62%)
5/12
(42%)
19/27
(70%) 0.15
13/16
(81%)
6/10
(60%) 0.37
† Chi2 test. ‡Fisher exact results where expected cell value is less than 5

Page 109
5.6.5 Access to HIV services
Of 543 patients seen at FUSAM visits, 195 were already known HIV seropositive from their time
in programme. Table 32 describes their treatment, focusing on use of ARV medication and
cotrimoxazole prophylaxis.
A total of 89/159 (56%) children reported having started ARVs. Numbers on ARVs were
20% higher among those still alive than those who died, though this difference was just short of
statistical significance at 0.05 level. Baseline HIV clinical staging was however similar. The effect
of ARV start time could not easily be compared due to small numbers, but it is notable that few
patients who died had started ARVs prior to MOYO.
ARV compliance was good among those reporting: 69/71 (97%) reported last taking
ARVs ‘today’ (or on the day of death if died) and 69/71 (97%) reported last missing a dose more
than a month ago (or more than a month prior to death).
Table 32 HIV related services: antiretrovirals (ARVs) and cotrimoxazole prophylaxis
All HIV positive
FUSAM patients
by long term (>90day) mortality
(as determined at FUSAM visit)
(n=195)
Late death
(n=48)
Alive at 1yr
(n=139)
P†‡
On ARVs 89/159 (56%) 15/35 (42%) 74/122 (61%) 0.06
If on ARVs:
Started pre-MOYO 17/89 (19%) 1/15 (7%) 16/74 (22%) 0.29
Started on MOYO (ward or
OTP) 28/89 (31%) 8/15 (53%) 20/74 (27%) 0.05
Started after MOYO 44/89 (49%) 6/15 (40%) 38/74 (51%) 0.42
Not on ARVs because
assessed not to be eligible
yet
14/159 (9%) 2/35 (6%) 12/122 (10%) 0.74
On cotrimoxazole 149/161 (93%) 33/36 (92%) 115/123 (93%) 0.71
If on cotrimoxazole:
Started pre-MOYO 21/149 (14%) 3/33 (9%) 18/115 (16%) 0.41
Started on MOYO (ward or
OTP) 121/149 (81%) 30/33 (91%) 90/115 (78%) 0.10
Started after MOYO 7/149 (5%) 0/33 (0%) 7/115 (6%) 0.35
If on cotrimoxazole:
Last took dose today or
yesterday 95/149 (64%) 14/18 (78%) 81/115 (70%) 0.52
Last took dose more than a
month ago or never since
OTP
33/149 (22%) 3/18 (17%) 28/115 (24%) 0.56
HIV clinical staging (as recorded at original admission)
0 28/190 (15%) 5/48 (10%) 19/134 (14%) 0.51
1 or 2 31/190 (16%) 5/48 (10%) 26/134 (19%) 0.23
3 99/190 (52%) 30/48 (63%) 65/134 (49%) 0.10
4 32/190 (17%) 8/48 (17%) 24/134 (18%) 0.85
Severely low CD4
(age adjusted) 70/135 (52%) 22/38 (58%) 45/93 (48%) 0.32
† Chi2 test. ‡Fisher exact results where expected cell value is less than 5

Page 110
The striking feature of table 33 is that a large proportion of mothers reported having had an
HIV test, with many of those being tested on MOYO (along with their child – family testing and
counselling was always offered alongside testing for the index child). In contrast, less than 50%
of fathers had been tested. Siblings were even less likely to have been tested. (table 34)
Table 33 Parental HIV status & treatment described at long term follow-up visit
All FUSAM
patients
by long term (>90day) mortality
(as determined at FUSAM visit)
(HIV positive children only)
by long term (>90day) mortality
(as determined at FUSAM visit)
(HIV negative children only)
(n=543)
Late death
(n=48)
Alive at 1yr
(n=139)
P†‡
Late death
(n=14)
Alive at 1yr
(n=315)
P†‡
Maternal HIV
status
HIV +
141/401
(35%)
19/23
(83%)
88/103
(85%) 0.75 -
29/259
(11%) -
HIV -
225/401
(56%)
1/23
(4%)
4/103
(4%) 1
6/6
(100%)
210/259
(81%) 0.60
Never tested
35/401
(9%)
3/23
(13%)
11/103
(11%) 0.72 -
20/259
(8%) -
If tested, when
Pre-MOYO
67/340
(20%)
2/19
(11%)
24/86
(28%) 0.15
1/6
(17%)
36/220
(16%) 1
At MOYO
239/340
(70%)
15/19
(79%)
51/86
(59%) 0.11
4/6
(83%)
164/220
(75%) 0.65
After MOYO
34/340
(10%)
2/19
(11%)
11/86
(13%) 1
1/6
(17%)
20/220
(9%) 0.45
If HIV +
Never had ARVs
(incl. on waiting
list or not yet
eligible)
76/123
(62%)
10/17
(59%)
48/76
(63%) 0.74 -
17/27
(63%) -
Yes, currently
on ARVs
45/123
(37%)
7/17
(41%)
26/76
(34%) 0.79 -
10/27
(37%) -
Paternal HIV
status
HIV +
43/319
(13%)
6/18
(33%)
24/77
(31%) 0.86 -
13/211
(6%) -
HIV -
102/319
(32%)
2/18
(11%)
5/77
(6%) 0.61
4/5
(80%)
87/211
(41%) 0.16
Never tested
174/319
(55%)
10/18
(56%)
48/77
(62%) 0.60
1/5
(20%)
111/211
(53%) 0.20
† Chi2 test. ‡Fisher exact results where expected cell value is less than 5

Page 111
Table 34 Sibling HIV status & where tested
HIV serostatus Where tested (if tested)
HIV (+) HIV (-) Never
tested
Pre-
MOYO
On MOYO After
MOYO
Sib 1 (n=289) 2/258
(1%)
55/258
(21%)
201/258
(78%)
13/47
(28%)
14/47
(30%)
20/47
(43%)
Sib 2 (n=242) 4/213
(2%)
43/213
(20%)
166/213
(78%)
13/43
(30%)
8/43
(19%)
22/43
(51%)
Sib 3 (n=161) 1/140
(1%)
29/140
(21%)
110/140
(79%)
10/28
(36%)
5/28
(18%)
13/28
(46%)
Sib 4 (n=94) 2/86
(2%)
16/86
(19%)
68/86
(79%)
5/16
(31%)
2/16
(13%)
9/16
(56%)
Sib 5 (n=45) 2/45
(4%)
6/45
(13%)
37/45
(82%)
1/6
(17%)
2/6
(33%)
3/6
(50%)
Sib 6 (n=17) 0/14
(0%)
5/14
(36%)
9/14
(64%)
1/4
(25%)
1/4
(25%)
2/4
(50%)
Sib 7 (n=8) 0/7 2/7
(29%)
5/7
(71%)
0/2
(0%)
1/2
(50%)
1/2
(50%)
Sib 8 (n=1) 0/1
(0%)
1/1
(100%)
0/1
(0%)
0/1
(0%)
0/1
(0%)
1/1
(100%)
ALL (n=857) 11/764
(1%)
157/764
(21%)
596/764
(78%)
43/147
(29%)
33/147
(22%)
71/147
(48%)

Page 112
5.6.6 TFP-based nutrition education sessions: do they improve knowledge or affect
mortality?
Of carers reporting, 230/428 (54%) said they attended nutrition education sessions whilst on
MOYO and 198/428 (46%) said they did not. Background maternal education, an important
potential confounder, was the same in those who did and those who did not attend the sessions.
Table 35 explores whether attendance at the education sessions was associated with differences
in knowledge or reported feeding behaviours. It also explores associations between nutrition-
related knowledge and long term mortality.
Table 35 Basic nutritional knowledge: is it improved by attending TFP education sessions, and does it
affect long term mortality?
All FUSAM
patients
By attendance of nutrition
education sessions on MOYO
by long term mortality
(as determined at FUSAM visit)
(n=543)
No
(n=198)
Yes
(n=230)
P† Died
(n=64)
Alive
(n=462)
P†
Maternal education
None 60/511
(12%)
23/187
(12%)
23/218
(11%)
0.58 8/62
(13%)
51/433
(12%)
0.80
Primary 360/511
(70%)
135/187
(72%)
148/218
(68%)
0.35 45/62
(73%)
303/433
(70%)
0.90
Secondary or
more
91/511
(18%)
29/187
(16%)
47/218
(22%)
0.12 9/62
(16%)
79/433
(18%)
0.47
Concerning Malawi’s “6 food groups”
Aware that
there are 6
groups
145/388
(37%)
48/156
(31%)
80/167
(47%)
0.002 17/41
(41%)
126/336
(38%)
0.62
Able to name all
6 food groups
98/388
(25%)
35/156
(22%)
53/167
(32%)
0.06 10/41
(24%)
87/336
(26%)
0.84
Unable to name
any food group
156/388
(40%)
69/156
(44%)
46/167
(28%)
0.002 20/41
(49%)
130/336
(39%)
0.21
Concerning ideal breastfeeding practices
Correctly states
6 months for
starting liquids
358/482
(74%)
148/192
(77%)
178/223
(80%)
0.50 27/46
(59%)
328/424
(77%)
0.005
Correctly states
6 months for
starting solids
351/480
(73%)
143/191
(75%)
175/223
(78%)
0.39 28/46
(61%)
320/422
(76%)
0.03
Correctly states
BF should
continue until at
least 24months
315/480
(66%)
118/182
(65%)
160/222
(72%)
0.12 32/47
(68%)
279/421
(66%)
0.80
States that HIV
positive mother
should stop to
BF at 6 months
290/471
(62%)
131/187
(70%)
130/219
(60%)
0.03 23/44
(52%)
263/416
(63%)
0.15
Changed feeding
practices post-
SAM
152/496
(31%)
7/196
(4%)
141/224
(63%)
<0.001 14/52
(25%)
138/430
(32%)
0.45
† Chi2 test. ‡Fisher exact results where expected cell value is less than 5

Page 113
Summarising the table, knowledge of Malawi’s “6 food groups” was significantly better among
those who attended health education than in those who did not. Carers who were aware of key
breastfeeding facts (stated that infants should be breastfed for 6 months before any solids or
liquids are started – i.e. they correctly described exclusive breastfeeding) were significantly
more likely to have children who were alive at long term follow-up. However, this knowledge
was not related to attendance at MOYO health education.
Significantly more carers who attended health education reported changing feeding
practices since discharge (figure 17 shows details of what changed). This had no obvious effect
on long term mortality. Not shown in the table, 21/230 (9%) of those attending education
sessions were found to have died at the FUSAM visit and 18/198 (9%) of those not attending
also died.
Despite improvements following health education, better knowledge about Malawi’s 6
food groups was also not associated with lower long term mortality.
Figure 17 Reported changes in feeding practices (n=152 who reported having changed)
29%
23%
25%
5%
5%
7% 6%
Offering more varied
foods
Offering more frequent
feeds
Mixing groundnuts into
porridge
More varied foods AND
adding groundnuts
More frequent foods AND
adding groundnuts
More varied AND more
frequent foods
Other

Page 114
5.7 Results - Growth catch-up in the ex-SAM child
In this section I illustrate anthropometric changes both during and after treatment on MOYO.
5.7.1 Overall z-score changes during treatment
Figure 18 illustrates weight-for-height, weight-for-age and height-for-age z-scores at admission
to programme, at OTP discharge (=discharge from programme) and at the long term FUSAM
visit. The patterns of change are distinctive:
• Weight-for-height improves during the programme and continues to improve in
children surviving long term. By ≥1 year, average weight-for-height has corrected to the
expected population z-score of 0.
• Weight-for-age also improves during and after treatment. Unlike weight-for-height,
there is however a persisting deficit of around -1.8 z-scores at ≥1 year.
• Height-for-age shows minimal improvement, either during treatment or ≥1 year after
treatment.
Figure 18 Box plots‡ showing WHZ, WAZ and HAZ at baseline, OTP discharge and at 1 year follow-up.
WHZ admission (n=976); WHZ OTP discharge (n=966); WHZ 1 year (n=386)
WAZ admission (n=1003); WAZ OTP discharge (n=993); WAZ 1 year (n=386)
HAZ admission (n=992); HAZ OTP discharge (n=982); HAZ 1 year (n=386)
(NB n=386 because not all FUSAM children were available to be measured e.g. if in school)
‡ In a boxplot: the box shows the upper and lower quartile values; the line in the middle of the box shows
the median value; the whiskers show the upper and lower adjacent values (those within a 1.5 inter-quartile
range of the nearest quartile); lastly, symbols show any remaining outliers.
weight-for-ageweight-for-height height-for-age
-10
-50
5z-s
core
Ad
mis
sio
n
O
TP
d
/c
FU
SA
M

Page 115
The two tables below t-tests comparing Z-score changes from OTP (programme) discharge to
final 1 year outcomes.
Unpaired t-tests are presented first to reflect what is shown in the box-plot above. The
magnitude of change is greatest for weight-for-height and least for height-for-age. All are
statistically significant:
Table 36 Changes in WHZ, WAZ and HAZ from programme discharge to 1 year (unpaired t-tests)
Mean z-score (SD) Difference
(95% CI)
P value
At OTP discharge
At 1 year follow-
up
1 year - OTP
Weight-for-height
(n=966 and 386) -1.96 (1.5) -0.04 (1.0) 1.92
(1.76 to 2.08) <0.0001
Weight-for-age
(n=993 and 386) -3.42 (1.4) -1.77 (1.1) 1.66
(1.50 to 1.82) <0.0001
Height-for-age
(n=983 and 386) -3.34 (1.4) -2.97 (1.4) 0.37
(0.21 to 0.53) <0.0001
Paired t-tests better reflect individual level changes and are shown in table 37. Magnitude of
these individual-level changes are less than for the groups as a whole. Increases in WHZ and
WAZ from OTP discharge to 1 year follow-up are still statistically significant. HAZ changes are
not:
Table 37 Changes in WHZ, WAZ and HAZ from programme discharge to 1 year (paired t-tests)
Mean z-score (SD) Difference
(95% CI)
P value
At OTP discharge
At 1 year follow-
up
1 year - OTP
Weight-for-height
(n=386) -1.16 (1.1) -0.04 (1.0) 1.11
(0.99 to 1.23) <0.0001
Weight-for-age
(n=386) -2.64 (1.2) -1.77 (1.1) 0.87
(0.77 to 0.98) <0.0001
Height-for-age
(n=386) -3.03 (1.3) -2.97 (1.3) 0.05
(0.04 to 0.15) 0.27

Page 116
5.7.2 Z-score changes during treatment, by HIV status and admission diagnosis
Boxplot 19 follows the same format as figure 18: WHZ, WAZ and HAZ at admission, at OTP
(programme) discharge and at long term FUSAM follow-up. Differences in z-score changes by
HIV status are illustrated first.
a) Changes by HIV status
Patterns of change by HIV are similar to overall patterns of change. WHZ, WAZ and
HAZ at admission and OTP discharge are all higher in HIV negative patients than in HIV
positives. By ≥1 year (see also table 38):
• WHZ has recovered to the reference population mean of 0 in both HIV negative
and positive groups.
• WAZ has significantly improved (p<0.01) in both HIV negative and positive
patients but both groups remain below the reference population mean, WAZ zero.
• HAZ is the most depressed anthropometric index in both HIV positive and
negative patients. There is no improvement following OTP discharge among HIV
negative patients. There is small but statistically significant improvement among
HIV positive patients (a HAZ improvement of 0.37 z-scores, p<0.01)
Figure 19 Box plots showing baseline, OTP and 1 year WHZ, WAZ and HAZ, by HIV status
-10
-50
5
hiv negative hiv positive
z-s
co
re
WHZ WAZ HAZ WHZ WAZ HAZ

Page 117
Table 38 presents formal statistical testing of the changes that can be observed in the box-plot
on the previous page.
Table 38 WHZ, WAZ and HAZ changes from OTP discharge to 1 year follow-up, by HIV (paired t-test)
Mean z-score (SD) Difference
(95% CI)
P value
At OTP discharge
At 1 year follow-
up
1 year - OTP
Weight-for-height
in HIV ○-
(n=268) -1.07 (1.1) -0.12 (1.0) 0.95 (0.82 to 1.08) <0.0001
in HIV ○+
(n=112) -1.32 (1.2) 0.14 (1.0) 1.46 (1.21 to 1.72) <0.0001
Weight-for-age
in HIV ○-
(n=269) -2.45 (1.1) -1.77 (1.1) 0.68 (0.57 to 0.78) <0.0001
in HIV ○+
(n=112) -3.06 (1.1) -1.74 (1.0) 1.31 (1.08 to 1.55) <0.0001
Height-for-age
in HIV ○-
(n=268) -2.83 (1.3) -2.90 (1.3) -0.08 (-1.19 to 0.03) 0.15
in HIV ○+
(n=112) -3.51 (1.2) -3.13 (1.3) 0.37 (0.18 to 0.57) 0.0002
b) Changes by admission problem (oedematous or non-oedematous malnutrition)
Oedematous and non-oedematous malnutrition reflect different underlying patho-physiology.
Oedema also affects admission weight and thus admission weight-for-height and weight-for-
age. In this section therefore I examine whether initial oedema has any longer term impact on z-
score changes. Results in figures 20 and 21 are presented stratified by underlying HIV
serostatus.

Page 118
Patterns and magnitudes of z-score changes split by oedematous or non-oedematous
malnutrition are similar to overall patterns of change.
Figure 20 Box plots showing baseline, OTP and 1 year WHZ, WAZ and HAZ, by admission oedema, in
HIV seronegative patients
Figure 21 Box plots showing baseline, OTP and 1 year WHZ, WAZ and HAZ, by admission oedema, in
HIV seropositive patients
-10
-50
5no oedema oedema
z-s
co
re
-10
-50
5
no oedema oedema
z-s
co
re
Graphs by OEDEMAcat
WHZ WAZ HAZ WHZ WAZ HAZ
Ad
mis
sio
n
OT
P
d/c
FU
SA
M
WHZ WAZ HAZ WHZ WAZ HAZ
Ad
mis
sio
n
OT
P
d/c
FU
SA
M
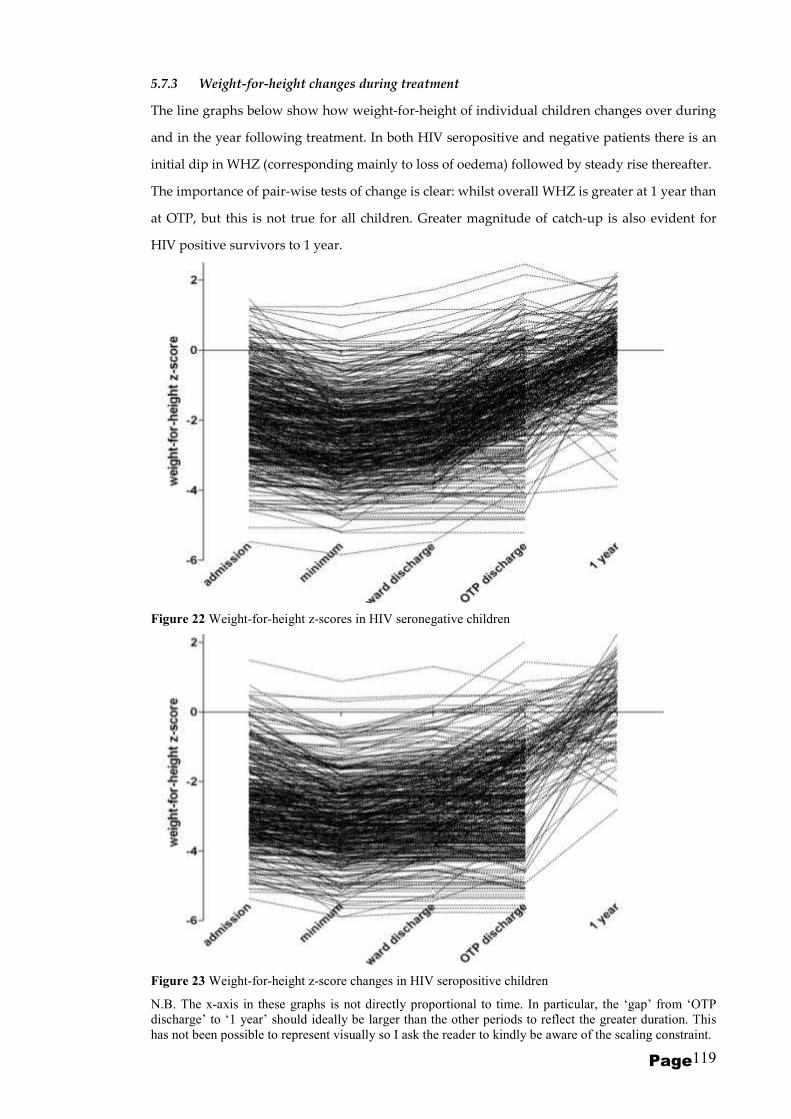
Page 119
5.7.3 Weight-for-height changes during treatment
The line graphs below show how weight-for-height of individual children changes over during
and in the year following treatment. In both HIV seropositive and negative patients there is an
initial dip in WHZ (corresponding mainly to loss of oedema) followed by steady rise thereafter.
The importance of pair-wise tests of change is clear: whilst overall WHZ is greater at 1 year than
at OTP, but this is not true for all children. Greater magnitude of catch-up is also evident for
HIV positive survivors to 1 year.
Figure 22 Weight-for-height z-scores in HIV seronegative children
Figure 23 Weight-for-height z-score changes in HIV seropositive children
N.B. The x-axis in these graphs is not directly proportional to time. In particular, the ‘gap’ from ‘OTP
discharge’ to ‘1 year’ should ideally be larger than the other periods to reflect the greater duration. This
has not been possible to represent visually so I ask the reader to kindly be aware of the scaling constraint.

Page 120
5.7.4 Weight-for-age changes during treatment
As with weight-for-height, the two line graphs below show an initial decrease in weight-for-age
followed by a steady rise thereafter. Again the magnitude of 1 year catch-up is greater in HIV
seropositive than in seronegative patients. Numbers surviving to 1 year are however less in HIV
seropostive patients. The persisting weight-for-age is also evident in both groups.
Figure 24 Weight-for-age z-score changes in HIV seronegative children
Figure 25 Weight-for-age z-score changes in HIV seropostive children
WAZ
WAZ
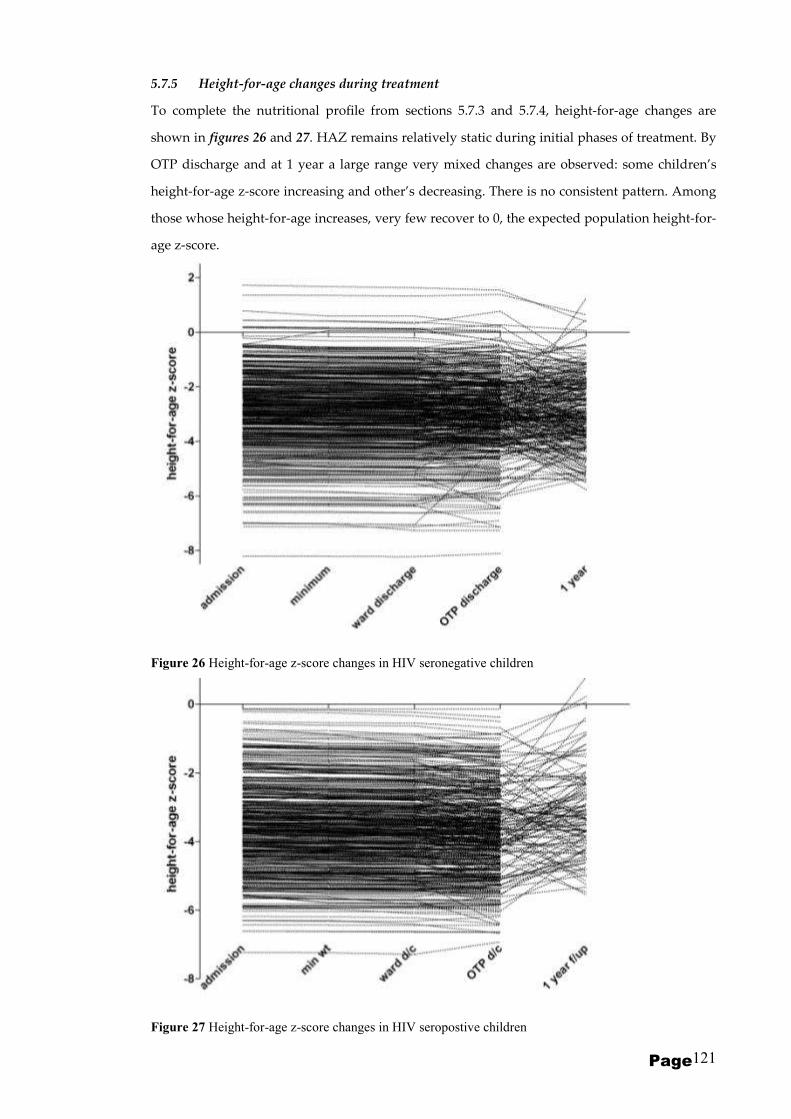
Page 121
5.7.5 Height-for-age changes during treatment
To complete the nutritional profile from sections 5.7.3 and 5.7.4, height-for-age changes are
shown in figures 26 and 27. HAZ remains relatively static during initial phases of treatment. By
OTP discharge and at 1 year a large range very mixed changes are observed: some children’s
height-for-age z-score increasing and other’s decreasing. There is no consistent pattern. Among
those whose height-for-age increases, very few recover to 0, the expected population height-for-
age z-score.
Figure 26 Height-for-age z-score changes in HIV seronegative children
Figure 27 Height-for-age z-score changes in HIV seropostive children
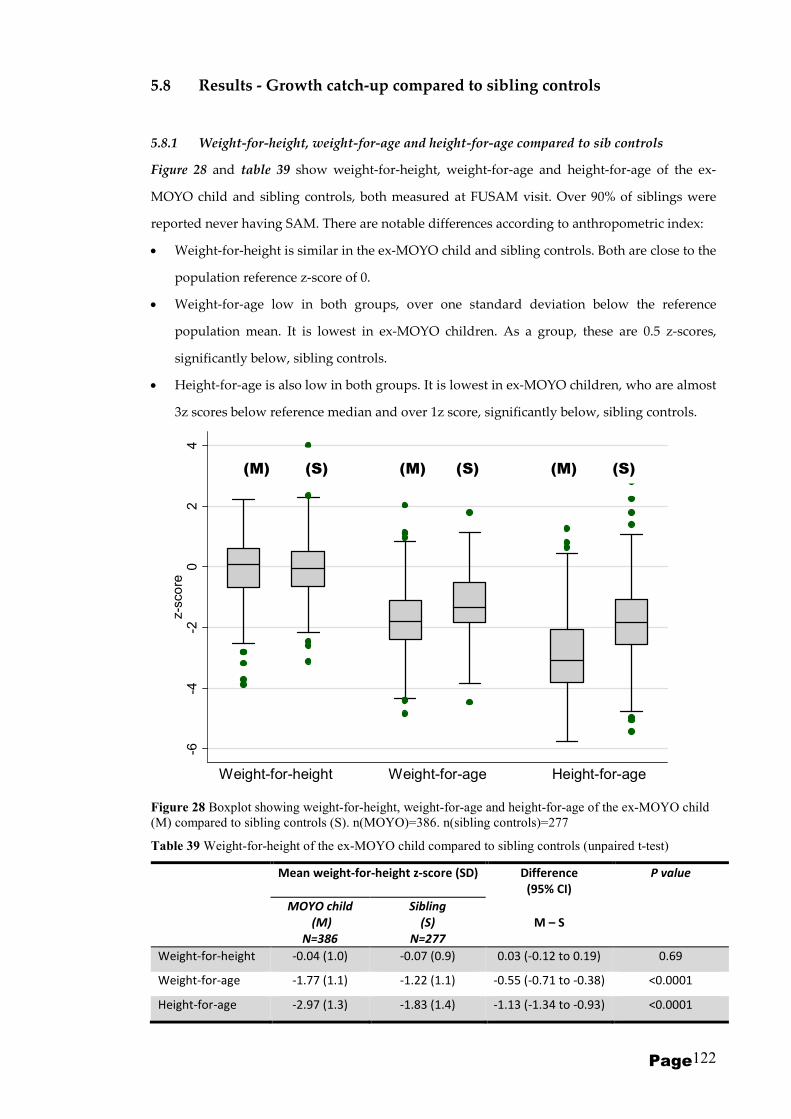
Page 122
5.8 Results - Growth catch-up compared to sibling controls
5.8.1 Weight-for-height, weight-for-age and height-for-age compared to sib controls
Figure 28 and table 39 show weight-for-height, weight-for-age and height-for-age of the ex-
MOYO child and sibling controls, both measured at FUSAM visit. Over 90% of siblings were
reported never having SAM. There are notable differences according to anthropometric index:
• Weight-for-height is similar in the ex-MOYO child and sibling controls. Both are close to the
population reference z-score of 0.
• Weight-for-age low in both groups, over one standard deviation below the reference
population mean. It is lowest in ex-MOYO children. As a group, these are 0.5 z-scores,
significantly below, sibling controls.
• Height-for-age is also low in both groups. It is lowest in ex-MOYO children, who are almost
3z scores below reference median and over 1z score, significantly below, sibling controls.
Figure 28 Boxplot showing weight-for-height, weight-for-age and height-for-age of the ex-MOYO child
(M) compared to sibling controls (S). n(MOYO)=386. n(sibling controls)=277
Table 39 Weight-for-height of the ex-MOYO child compared to sibling controls (unpaired t-test)
Mean weight-for-height z-score (SD) Difference
(95% CI)
P value
MOYO child
(M)
N=386
Sibling
(S)
N=277
M – S
Weight-for-height -0.04 (1.0) -0.07 (0.9) 0.03 (-0.12 to 0.19) 0.69
Weight-for-age -1.77 (1.1) -1.22 (1.1) -0.55 (-0.71 to -0.38) <0.0001
Height-for-age -2.97 (1.3) -1.83 (1.4) -1.13 (-1.34 to -0.93) <0.0001
-6-4
-20
24
z-s
co
re
Weight-for-height Weight-for-age Height-for-agee x- M O YO S iblin gs e x- M O YO S iblin gs e x- M O YO S iblin gs
(M) (S) (M) (S) (M) (S)

Page 123
5.8.2 Weight-for-height compared to sib controls, by birth order
The boxplot and table below explore the hypothesis that size may depend upon birth order. The
MOYO child is presented first for simplicity: 257/925(28%) were actually firstborns. Of the
others, 242/925(26%) were second-born, 188(20%) third-born and 238(26%) fourth-born or later.
It can be seen that weight-for-height of ex-MOYO child is similar to that of all siblings,
no matter what their birth order. Paired t-tests in table 40 confirm no significant differences
between the MOYO child and individual siblings in the same family. An ANOVA test of
multiple means, together with Scheffe’s multiple comparison test gives similar results. All
groups have a z-score close to the reference population mean of zero.
Figure 29 Boxplot showing weight-for-height of the MOYO child at 1 year compared to sibling controls.
(M) = ex MOYO child; S1 = firstborn child in the family; S2 = second-born child etc.
Table 40 Weight-for-height of the ex-MOYO child compared to sibling controls (paired t-tests)
Mean weight-for-height z-score (SD) Difference
(95% CI)
P value
MOYO child
(M)
Sibling
(S)
M – S
Sib 1 (n=53) -0.068 (1.1) -0.24 (0.8) 0.17 (-0.15 to 0.50) 0.28
Sib 2 (n=68) 0.04 (1.0) -0.08 (0.9) 0.12 (-0.16 to 0.40) 0.38
Sib 3 (n=54) -0.00 (0.8) -0.09 (0.9) 0.08 (-0.22 to 0.39) 0.57
Sib 4 (n=25) -0.43 (1.0) 0.12 (1.3) -0.55 (-1.20 to 0.10) 0.09
Sib 5 (n=22) 0.04 (1.2) 0.10 (1.0) -0.05 (-0.64 to 0.53) 0.85
Sib 6 (n=8) -0.17 (1.2) 0.24 (0.9) -0.41 (-1.43 to 0.60) 0.36
Sib 7 (n=6) -0.32 (1.7) 0.35 (0.8) -0.67 (-2.95 to 1.60) 0.48
Sib 8 (n=1) 0.78 0.77 0.01 -
-4-2
02
4z-s
co
re
(M) S1 S2 S3 S4 S5 S6 S7 S8

Page 124
5.8.3 Weight-for-age compared to sib controls, by birth order
Following the same format, weight-for-age z-scores are shown below. Two points are
important:
a) Median weight-for-age of all children in the family is low.
b) Weight-for-age z-score of ex-MOYO children is lower than that of sibling controls,
irrespective of their birth order. Paired t-tests in table 41 show statistically significant
differences. Similar results are obtained using ANOVA multiple mean comparisons or non-
parametric Wilcoxon signed-rank tests.
Figure 30 Boxplot showing weight-for-age of the MOYO child at 1 year compared to sibling controls.
(M) = ex MOYO child; S1 = firstborn child in the family; S2 = second-born child etc.
Table 41 Weight-for-age of the ex-MOYO child compared to sibling controls (paired t-tests)
Mean weight-for-age z-score (SD) Difference
(95% CI)
P value
MOYO child
(M)
Sibling
(S)
M – S
Sib 1 (n=53) -1.82 (1.3) -1.35 (0.9) -0.47 (-0.78 to -0.16) 0.003
Sib 2 (n=68) -1.76 (1.1) -1.11 (1.0) -0.64 (-0.91 to -0.38) <0.0001
Sib 3 (n=54) -1.82 (0.9) -1.41 (1.3) -0.41 (-0.76 to -0.62) 0.02
Sib 4 (n=25) -2.33 (1.1) -1.27 (0.9) -1.07 (-1.66 to -0.48) 0.001
Sib 5 (n=22) -1.71 (1.2) -1.00 (1.0) -0.71 (-1.30 to -0.12) 0.02
Sib 6 (n=8) -2.05 (1.3) -0.67 (1.6) -1.38 (-2.74 to -0.02) 0.05
Sib 7 (n=6) -1.96 (1.5) -1.2 (1.3) -0.76 (-2.85 to 1.33) 0.39
Sib 8 (n=1) -0.11 0.51 -0.63 -
-4-2
02
4z-s
co
re
(M) S1 S2 S3 S4 S5 S6 S7 S8

Page 125
5.8.4 Height-for-age compared to sib controls, by birth order
Again following the same format, height-for-age z-scores of ex-MOYO children compared to
sibling controls are shown. Two points are notable:
a) Height-for-age of all children is low. It is approximately 2 z-scores below normal for firstborn
though to fifth-born sibs. Group sizes of sibs 6, 7 and 8 are too small to comment.
b) Height-for-age of ex-MOYO children is lower than that of sibling controls, Paired t-tests in
table 31 show statistically significant differences. Similar results are obtained using either
ANOVA with Scheffe’s multiple comparison test or non-parametric Wilcoxon signed-rank tests.
Height-for-age deficit in the ex-MOYO child is more marked than the weight-for-age deficit and
ranges from 0.8 to over 1.6 z-scores.
Figure 31 Boxplot showing height-for-age of the MOYO child at 1 year compared to sibling controls.
(M) = ex MOYO child; S1 = firstborn child in the family; S2 = second-born child etc.
Table 42 Height-for-age of the ex-MOYO child compared to sibling controls (paired t-tests)
Mean height-for-age z-score (SD) Difference
(95% CI)
P value
MOYO child
(M)
Sibling
(S)
M – S
Sib 1 (n=53) -3.09 (1.2) -1.78 (1.1) -1.31 (-1.68 to -0.95) <0.0001
Sib 2 (n=68) -3.08 (1.2) -1.66 (1.2) -1.43 (-1.77 to -1.09) <0.0001
Sib 3 (n=54) -3.06 (1.0) -2.24 (1.6) -0.83 (-1.24 to -0.41) 0.0002
Sib 4 (n=25) -3.54 (1.3) -1.95 (1.2) -1.59 (-2.26 to -0.93) <0.0001
Sib 5 (n=22) -3.03 (1.0) -1.64 (1.2) -1.39 (-2.00 to -0.77) 0.0001
Sib 6 (n=8) -3.35 (1.3) -1.19 (2.2) -2.16 (-4.13 to 0.18) 0.04
Sib 7 (n=6) -3.30 (0.9) -2.50 (2.0) -0.80 (-2.76 to 1.16) 0.34
Sib 8 (n=1) -1.21 -0.16 -1.04
-6-4
-20
2z-s
co
re
(M) S1 S2 S3 S4 S5 S6 S7 S8

Page 126
Chapter 6
DISCUSSION
Since they address two distinct factors underlying SAM outcomes, PRONUT and FUSAM will first
be discussed in separate sections. A final conclusion will draw together final implications of both
studies.
6.1 PRONUT
6.1.1 Key findings
In the MOYO setting, Synbiotic2000 ForteTM, prescribed in RUTF at an average daily dose of
>1010 organisms per day, had no significant effect improving pre-specified nutritional or clinical
outcomes from SAM. Even though negative, this is an important finding. PRONUT is, to my
knowledge, one of the largest probiotic/prebiotic RCTs to date. It is also one of very few based in a
low-income, high mortality, developing country. Putting the 795 patients in context, a 2004
Cochrane review of probiotics in the treatment of diarrhoea included 1917 patients from 23 studies,
only 2 of which were set in “high child and adult mortality” countries(59); a 2006 Lancet meta-
analysis of probiotics in diarrhoea prevention had 4844 patients from 34 trials, only 1 of which was
developing country and community based(60).
A post-hoc observation of reduced outpatient mortality amongst children receiving
Synbiotic is interesting. If true, it is also important clinically. I emphasise that this observation
should not be over-interpreted, but do believe that it justifies further research.
6.1.2 Strengths and weaknesses
Study strengths
Biological plausibility of observed results
A lack of Synbiotic efficacy for SAM inpatients might be because these children are the
most vulnerable, with greatest impairment of all physiological systems(72). Some causes of early
death are unlikely to be affected by known Synbiotic actions e.g. re-feeding syndrome and
electrolyte imbalance(100),(101).
Page 127
Possible benefits for children surviving inpatient care is consistent with known Synbiotic
effects like immune stimulation and improved gut environment and integrity. These take time and
cannot occur until organ, cellular and immune functions have begun to recover. Such recovery
would be greatest in outpatients after initial discharge – as was observed. Repeat admissions, which
imply repeat episodes of severe illness would dilute any inter-group differences - also consistent
with observed results, where outpatient differences are most pronounced during 1st episode of
outpatient care but attenuated when all subsequent admission episodes are taken into account.
Antibiotics may also plausibly modulate the observed inpatient/outpatient differences. In-
vitro testing showed cotrimoxazole sensitivity in 2 of 4 Synbiotic organisms. Following standard
protocols, all inpatients received cotrimoxazole. Half also had parenteral antibiotics. Children who
were HIV seropositive continued on long term cotrimoxazole prophylaxis after ward discharge
during and after outpatient treatment. Antibiotics may have reduced gut colonization by and hence
efficacy of Synbiotic. In contrast, HIV negative outpatients, in whom the possible outpatient
Synbiotic effect was strongest, received no antibiotics.
Use of definitive outcomes for maximal relevance and applicability to developing country SAM settings
Hard outcomes like nutritional cure and death are rare in functional food studies(60),(102).
Examining them, PRONUT stands out as directly relevant to nutrition policy makers; to
programme managers(88); and, most importantly, to families and communities whose children die as
a result of SAM(103).
Generalizability
For maximal generalizability to ‘real world’ nutrition programmes, PRONUT was set in a
government hospital providing routine service work. A key decision was to enrolled a typical
rather than selected patient caseload(104). Included were children with disabilities and other
conditions whose growth patterns are commonly abnormal(105). PRONUT was powered to explore
both whole-group and sub-group effects.
Minimal losses to follow-up
Another strength of the study was that we found final outcome for all but 26/795 (3.2%) of
randomised patients. This was made possible because of the efforts of a dedicated community team
and minimises the follow-up bias which is a common problem for field based studies in developing
countries.
Safety
In MOYO’s high-risk patients, no excess sepsis, particularly no Synbiotic-associated sepsis,
is important. No excess mortality was observed, as was discussed in one recent study on
Page 128
probiotics/prebiotics in severe pancreatitis(106). Increased inpatient vomiting, severe diarrhoea and
cough, and a non-significant increase in inpatient mortality were noted. One explanation for these
observations is chance. Known probiotic effects do not offer a clear explanatory mechanism for
these findings. Increased severe diarrhoea may be due to osmotic effect of prebiotics. It would be
interesting therefore for future studies to distinguish prebiotic and probiotic effects. With continued
careful monitoring of risks as well as benefits, we believe that further work using these functional
foods in HIV and SAM is justified.
Study weaknesses
Several limitations could also explain the predominantly negative results:
Synbiotic sharing and cross contamination
Though inter-group RUTF sharing was discouraged, it cannot be excluded. Faeco-oral
probiotic cross-contamination was also possible(107). Dilution of true group differences would result.
Such sharing and contamination would be maximal whilst patients were living closely together
during inpatient care. It would be minimal during home-based treatment as close neighbours on
different groups are unlikely. This would also plausibly explain our observed trends towards group
differences during outpatient treatment alone.
Synbiotic specificity
Probiotics and prebiotics are large and diverse groups, each with specific effects in specific
patients. This heterogeneity, combined with a paucity of other data on their use in the treatment of
SAM, makes comments on the consistency of PRONUT findings with other studies difficult.
Relevant to this current study, previous work (using Bifidobacterium bifidum with Streptococcus
thermophilus probiotics) found an effect on CD4 and diarrhoea in HIV positive patients(108); whilst
another study (using Lactobacillus GG) have found no effect in healthy Malawian children(109).
Hoping to demonstrate proof of principle in SAM, PRONUT used a probiotic/prebiotic with a
proven track record in other patient groups(91),,(110),(92). Another formulation might have shown
different results.
Possible suboptimal Synbiotic dose
Probiotics have approximately linear dose-response effects, at least on diarrhoea outcomes.
The commonly accepted efficacy ‘threshold’ is >108 organisms per day (102). Regular quality control
checks showed that prescribed doses were >1010 CFU per day, comfortably above this lower limit.
Higher doses are possible in principle, but might not be possible in practice given the cost of a log
unit dose increase. Also perhaps responsible for negative results is a suboptimal consumed dose of
RUTF (and thus of Synbiotic mixed into the RUTF). This might have happened at home if carers
Page 129
shared the RUTF with other children. PRONUT had only carer reports rather than direct
observation to confirm non-sharing and compliance. Adequate weight gain was however also
consistent with the RUTF being eaten rather than shared to any important extent.
Synbiotic dose regime & gut colonization
Probiotics are often ingested as a single large bolus dose. PRONUT patients consumed
RUTF (and thus Synbiotic) in divided amounts spread throughout the day. Probiotic effects depend
on successful transit through the upper gastrointestinal (GI) tract to sites of action in the small and
large intestines. Some probiotic organisms always die during transit. Larger single doses (perhaps
timed away from antibiotic administration – there was occasionally overlap with our regime) might
have colonized the gut better and had more effect. Resources were unavailable to directly confirm
the success of the PRONUT regime and adequate colonization had to be assumed based on other
research(107). It is plausible in SAM given the fact that gastric acidity, normally a barrier to live
probiotic transit, is reduced.
Prebiotic effects
The four prebiotics in Synbiotic may have caused non-specific overgrowth of enteric flora
which mitigated against the probiotic component. Unfortunately stool cultures were not done to
test this possibility. This is another issue for future research: probiotics alone or pro/prebiotic
combinations for malnutrition?
Lack of clinical effects
Clinical effects like reduced diarrhoeal or respiratory symptoms would have been
consistent with known probiotic effects. Clinical effects might also have suggested mechanisms for
the possible reduction in outpatient mortality. One isolated outpatient finding was reduced severe
diarrhoea – though again patient numbers were small. Beneficial clinical manifestations make a true
outpatient mortality effect more likely - but equally their absence does not exclude a true effect.
Benefits can be subtle, at immune system level for example. Another possibility is that true
symptom differences were missed, obscured by the noise inherent to any self-reported variable.
Group imbalances in days of outpatient observation might also have played a role. To address such
limitations, future work might add laboratory-measured clinical response indicators(108).
Unbalanced groups at entry to outpatient care
At randomization, groups appeared well balanced. Minor differences at point of entry to
outpatient care (lower % HIV; less malnourished according to WHZ in the Synbiotic group) raise
the possibility of confounding or bias at this point
Page 130
6.1.3 Meaning of the study and implications for future policy and research
Overall outcomes observed in PRONUT study highlight the need for effective,
evidence-based SAM interventions. Control group cures were low, 51.3%(203/396) and deaths
high, 30.0%(119/396). Such statistics are unfortunately not unusual(46),(4),(53). HIV and late
presentation to care, with complications of SAM already present are major factors underlying
these poor outcomes. In this setting, Synbiotic2000 ForteTM, prescribed in RUTF at an average
daily dose of >1010 organisms per day did not improve outcomes from current therapies. There
is therefore no evidence at present, either from PRONUT or from other studies, to recommend
routine use of functional additives to standard RUTF.
An observation of reduced mortality in Synbiotic outpatients is important to explore in
future studies. Since PRONUT was not designed to look at outpatients alone, bias, confounding
or chance cannot be excluded as an explanation for this finding. An effect is however
biologically plausible. SAM associated enteropathy is a particularly important problem which
probiotics may address. Since PRONUT was published, a ‘viewpoint’ article in the Lancet
argued that enteropathy may account for a far greater proportion of malnutrition than currently
recognised(111). If true, this would make future exploration of other functional additives even
more important: not just for children with SAM but for those with other less acute but more
prevalent forms of malnutrition(112). Future studies using probiotics in malnutrition should focus
on randomising SAM outpatients and possibly even children with moderate malnutrition,
whose treatment is receiving increasing international interest. Such research would nest well in
CMAM (Community Management of Acute Malnutrition) programmes, which focus on early
identification and outpatient treatment of children with malnutrition. In discussing current
results, this is exactly the patient group who might benefit most from any true
probiotic/prebiotic effects.

Page 131
6.2 FUSAM
6.2.1 Key findings
In the HIV prevalent MOYO setting, overall SAM mortality is markedly above SPHERE targets
of <10%(88). In total, 427/1024 (41%) of children admitted for treatment are known to have died.
Mortality was highest during initial inpatient treatment: 23%(238/1024). In FUSAM,
8%(84/1024) more died within 90 days of admission and 10%(105/1024) during long term
follow-up. These FUSAM deaths may not have been noted by many nutrition programmes
which only monitor patients in the short and medium term.
To properly interpret these results, it is important to note key subgroups. Though still
short of SPHERE standards, these give a much more optimistic perspective of TFP performance:
• Mortality probability among HIV negative patients is 19% (95% CI 15 to 23%) overall.
This compares to overall 69% (63 to 74%) 2 years mortality for HIV positive patients.
• Late mortality is less among HIV negative patients than among HIV positive. 90 day
HIV negative mortality is 13%(11 to 17%) and rises by 6%. This contrasts a 23% rise in
HIV positive mortality, from the 90 day ‘baseline’ of 46% (42 to 51%).
• If a child achieves initial programme cure, the chances of long term survival are good:
365/471 (77%) of cures were still alive at a year or more after their first admission.
HIV was the biggest single risk factor for both short and long term mortality, associated
with over 4 times the hazard of death. Increased severity of wasting and underweight at
original admission were also significantly associated with increased total mortality as well as
increased 90 day mortality. Oedematous patients were less likely to die both short and long
term. This contrasts some historical studies where kwashiorkor was associated with excess
mortality(26). It may reflect differences in the local pathophysiology of kwashiorkor, but equally
may just be due to greater awareness and hence earlier presentation of oedematous
malnutrition in Malawi. Age was a risk factor only in <12 month age group, whose hazards
were 2.3 times above the reference 48-60 month age group (adjusting for oedema, HIV and
admission anthropometry)
Mortality hazards for other potential risk factors varied by HIV status and timing of
death. Due to the large number of risk factors explored results should be interpreted with care:
by chance alone 1 in 20 will be statistically significant. Underlying disability was the most
striking, biologically plausible risk factor for both short and long term mortality in both HIV
positive and negative children. Others, including HIV staging and severity of symptoms prior
to admission were not clearly and consistently associated with death. Parental education,
occupation and family socioeconomic status also did not independently affect mortality.

Page 132
The long term anthropometric profile of survivors was mixed. Mean weight-for-height
z-score of children still alive had recovered almost to NCHS reference mean: -0.04(SD1.0,
n=386). This compares to baseline of -1.16(SD1.0). Height-for-age z-score remained low and
unchanged: -2.97(SD 1.3) compared to -3.03(SD 1.4) at baseline. Putting these in context, mean
sibling weight-for-height was -0.07(SD 0.9, n=277) and height-for-age -1.83(SD 1.4, n=277). A
fertile area for future work is to explore these differences: could different interventions have led
to better catch-up growth (especially focusing on HAZ catch-up? Why does one child in a
family but not another develop overt malnutrition? Which packages of care could be developed
to better benefit the whole family? (noting for example the low uptake of HIV testing among
fathers)
6.2.2 Strengths and weaknesses
Strengths
Two key features of FUSAM make it stand out from routine TFP programme data:
The first strength is having information on long term outcomes, up to 2 years after the
original admission date. Many programmes would miss late mortality so would overestimate
their true public health impact.
The second strength is low losses to follow-up. Large numbers of unknown final
outcomes can easily bias results. If the major reason for default is death, programme success
would again be an overestimated. Another possible reason for default is that the child is better
and the carer sees no reason to return for further follow-up: this pattern of defaulting would
underestimate true cures. In FUSAM, we had long term outcome information on 899/1024 (88%)
of children, but we also had baseline profile of those whose final outcome was unknown. For
most variables, this was more similar to known survivors than to known deaths. This allows us
to speculate that more unknowns survived than died and that our overall survival may be an
underestimate.
Weaknesses
FUSAM is closely linked with PRONUT and relies on baseline data collected for the
former. By the time funding was obtained and logistics organised for FUSAM, a large number
of patients had already died. Resource limitations meant that when FUSAM finally started we
were not able to revisit families of already known deaths. Additional FUSAM variables (e.g.
starting and compliance with cotrimoxazole prophylaxis or ARV medications) were not thus
available for all deaths. This missing data may have biased our findings on treatment and post-
treatment factors associated with mortality. This is why the more complete baseline variables

Page 133
rather than FUSAM-only variables were given prominence in the analysis and subject to more
in-depth multivariable analysis.
It is critical to emphasise that FUSAM examined mortality risk factors for patients
already enrolled in treatment. From a public health viewpoint it also important to know risk
factors for all SAM patients in the population. This enables better decisions to be made about
programme enrolment criteria. Whilst often plausible to assume that risk factor within
programme are similar to those in the general population (e.g. HIV seropostivity; more severe
wasting predicting higher risk of death), this cannot be taken as proven. Even if the risk factor
itself is the same, the magnitudes of effect is likely to be different depending on the reference
population.
Several of our variables relied on carer reports of symptoms experienced, family status
and treatment received. This raises the possibility of reporting and recall bias. I suggest that
systematic over or underreporting is unlikely given no consistent, strong associations between
mortality and clinical status, family status and socioeconomic status. However, the increased
‘noise’ inherent to these more subjective, self-reported variables may have obscured small but
real risks.
The last potential bias in our study related to seasonal variations in risk of malnutrition.
Though recruitment was spread over most of a year and captured both rainy (hungry) season
and dry (post-harvest) seasons, there may have been variations in nutritional status depending
on what season a child was admitted and followed up in. Logistical constraints led to variations
in time to follow-up. Had a constant time been possible, perhaps different magnitudes of z-
score change might have been observed. I doubt however that the overall pattern of findings
would have been significantly different. One of the advantages of using sibling controls was
that they were measured at the same time as the ex-MOYO child. Where MOYO-sib differences
are seen they cannot therefore be ascribed solely to seasonal variations.
6.2.3 Meaning of the study: generalizability
Generalizability is the key issue for many studies, and especially so for FUSAM:
i) Generalizability to other settings:
Whilst in many ways a typical resource poor developing country setting, MOYO had
inputs and resources (in terms of staff time, clinical expertise, continuity of drug, food and
equipment supplies) far above many TFPs in Malawi and elsewhere in Sub-Saharan Africa. For
FUSAM, I believe that this strengthens rather than weakens the overall message that patient
profile at admission (notably HIV status and severity of wasting) is the key risk factor for poor
outcomes. If treatment had more of an impact on reducing mortality, then the effect of
Page 134
admission profile would be attenuated and would not be so strongly correlated with mortality.
One might also expect uptake of MOYO or post-MOYO interventions like ARVs, TB treatment,
health education and SFP to have been more clearly related to mortality. If MOYO’s treatments
do not clearly make a great impact on outcomes, then most other treatment programmes are
similarly unlikely to be able to do so.
ii) To CMAM therapeutic feeding programme
Despite its OTP component of care, MOYO is still fundamentally a traditional TFP. It is
reactive in nature, admitting patients coming to the programme rather than going out to
actively case find. This is different to CMAM programmes which actively seek patients with
uncomplicated SAM in the community. The relative impact of pre-TFP status and TFP
treatment may thus also be different.
iii) To feeding programmes which use WHO growth standards
MOYO recruited patients using NCHS-based case definitions of SAM and analysed z-
scores using NCHS growth references. As outlined in the introduction chapter 2.2.4, new WHO
growth standards are now increasingly being used. These label more children with SAM, and
also suggest using an alternative % of weight gain discharge criterion. Again, all of this means
that the risks and magnitude of risk cannot be directly extrapolated from FUSAM to a
programme using WHO standards.
6.2.4 Comparison with other related studies
There are few other studies looking at long term outcomes following SAM. It is important
therefore to briefly review the ones which are present in the literature. The striking issue with
all of these is their age. Pre-HIV it is inevitable that most report better outcomes than FUSAM.
Indeed, the best comparison may be between FUSAM’s HIV negative patients and these
studies:
• Niger, 1992(113)
Of children 174 discharged from a TFP, 107(=61%) were followed up. At 3-16 months follow-up
17% had died. Though compared to FUSAM this appears better, there is clearly much larger
probability of bias due to 39% unknowns, a proportion of whom will have been deaths.
• Zaire, 1987(114)
Page 135
In an endemic malnutrition area, 171 SAM children discharged from hospital were followed up
and 81.6% found still alive at the end of 5 years. Similar to FUSAM, risk of death was highest in
the first year following discharge.
• India, 1999(115)
Discharged SAM children were compared to never malnourished siblings. Different to FUSAM,
the ex-SAM children in this study had better wt/ht than their non-SAM sibs. The reason for the
observation is uncertain and differs from FUSAM, which showed ex-SAM patients as more
malnourished in the long term. Maybe in the Indian setting, the ex-SAM children were
perceived as more vulnerable and therefore got preferential treatment/rations at home.
• Tanzania, 1987(116)
87% of 566 children who had been discharged from an NRU were followed over a year. The
mortality after discharge was 8% and relapse rate was 13%. 75% were well, with good catch-up
of wt/ht, but not ht/age. This mortality is clearly better than in FUSAM, but anthropometry
findings consistent.
• Guinea Bissau, 1995(117)
In this retrospective cohort study, 1038 severely malnourished children (defined by weight-for-
age <60% NCHS standards) were followed up over 3 years. 354 had received nutritional
rehabilitation whereas 684 did not, due to limited programme capacity. Up to 3 years, the
relative risk of death in the rehabilitated group was 0.75 (0.59 to 0.99). The mortality difference
was greatest in the first three months. Weight-for-age z-scores improved from a baseline of -4.52
to -2.76. This is consistent with FUSAM’s partial reversal of low weight-for-age.
6.2.5 Implications for policy and practice
There are four main messages and implications arising from FUSAM. Fortunately, all of these
fit with rather than fight against current policy direction:
First, FUSAM suggests that similar TFP programmes (especially those in HIV prevalent
settings such as sub-Saharan Africa) which only report short and medium term outcomes are

Page 136
likely to be underestimating their mortality, and thus overestimating their true public health
impact. A change of emphasis is urgently needed.
Second, FUSAMs risk factor profile implies that efforts to enrol patients at an earlier
stage of SAM are likely to be beneficial. Such proactive approaches to care, consistent with
CMAM-type nutrition programmes(9) are rapidly rolling out worldwide. FUSAM, rather than
suggesting a change of direction is needed, reaffirms this existing direction. The results firmly
imply that reactive programmes, which like MOYO do not use active case findings, should no
longer be seen as an effective or acceptable approach to SAM.
Third, FUSAM is consistent with a push to earlier ARV therapy as a means of
addressing high mortality amongst HIV positive children. It was striking that starting ARV
treatment, compliance with ARV treatment and compliance with cotrimoxaxole did not seem to
significantly reduce mortality in FUSAM’s HIV positive population. One interpretation is that
this treatment comes too late. Again, a more proactive approach diagnosing and treating HIV
before SAM develops is likely to be important. Such early treatment is now recommended and
many countries are rapidly scaling up access to HIV diagnostic and treatment services(52).
Fourth, a life course and more holistic approach is needed for SAM in general. Even
with WHO growth standards effectively enrolling a larger and less severely wasted group of
children, more proactive approaches are needed to address SAM before it develops. Such
primary prevention strategies could include treatment of MAM but also treating the wider
social and economic circumstances which give rise to malnutrition in the first place. Whilst
these social factors were not independently associated with mortality risk (adjusting for
admission anthropometry) in our study, they are linked to risk of low weight-for-height. An
important observation is that in the year following FUSAM, there were less admissions to
MOYO than seen for many years. This was not obviously due to CMAM (which was only just
rolling out) but, probably, due to a very successful fertilizer subsidy programme which the
government had introduced in an attempt to improve crop yield for the poorest smallholder
farmers in the community.
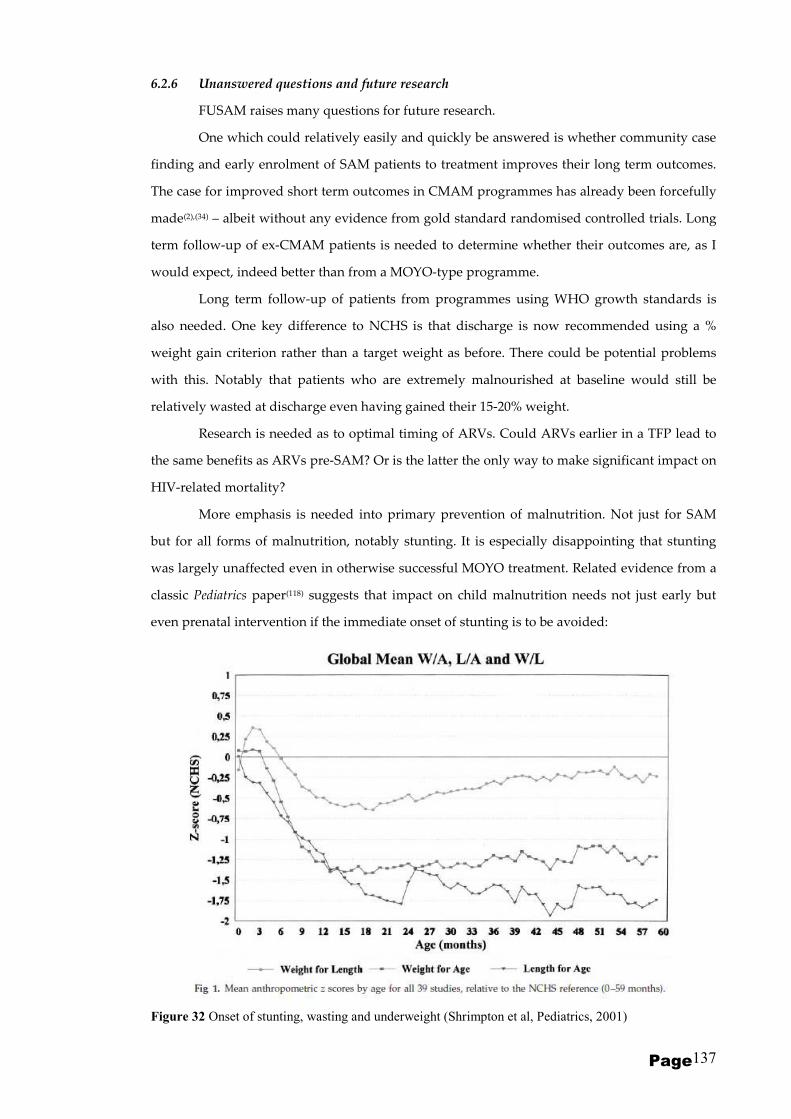
Page 137
6.2.6 Unanswered questions and future research
FUSAM raises many questions for future research.
One which could relatively easily and quickly be answered is whether community case
finding and early enrolment of SAM patients to treatment improves their long term outcomes.
The case for improved short term outcomes in CMAM programmes has already been forcefully
made(2),(34) – albeit without any evidence from gold standard randomised controlled trials. Long
term follow-up of ex-CMAM patients is needed to determine whether their outcomes are, as I
would expect, indeed better than from a MOYO-type programme.
Long term follow-up of patients from programmes using WHO growth standards is
also needed. One key difference to NCHS is that discharge is now recommended using a %
weight gain criterion rather than a target weight as before. There could be potential problems
with this. Notably that patients who are extremely malnourished at baseline would still be
relatively wasted at discharge even having gained their 15-20% weight.
Research is needed as to optimal timing of ARVs. Could ARVs earlier in a TFP lead to
the same benefits as ARVs pre-SAM? Or is the latter the only way to make significant impact on
HIV-related mortality?
More emphasis is needed into primary prevention of malnutrition. Not just for SAM
but for all forms of malnutrition, notably stunting. It is especially disappointing that stunting
was largely unaffected even in otherwise successful MOYO treatment. Related evidence from a
classic Pediatrics paper(118) suggests that impact on child malnutrition needs not just early but
even prenatal intervention if the immediate onset of stunting is to be avoided:
Figure 32 Onset of stunting, wasting and underweight (Shrimpton et al, Pediatrics, 2001)

Page 138
More work is needed on how to optimise outcomes for those who do slip through the
primary prevention nets. What is it about some children in a family that they become severely
malnourished whereas others do not? Which interventions, targeted at which SAM subgroup,
would have most impact minimising the SAM-related mortality and morbidity risks described
in this thesis? Recognizing the particularly high mortality in MOYO, could any interventions
make additional reductions in death there (e.g. stricter implementation of the “10 Steps”
guidelines; a modified feeding protocol; a modified feed)
Finally, as a general principle, I would urge for any future studies to be interventional
rather than just observational in design. As I hope that PRONUT and FUSAM have
demonstrated, observational trials can take advantage of and indeed link rather neatly to
intervention projects. They provide useful background data to help formulate the next
intervention(s). As PRONUT also demonstrated, what is plausible and promising in theory does
not always work as expected (if at all!) in practice. Children with SAM need and deserve the
best possible programmes and policies. These must be both effective and cost-effective The best
possible programmes and policies are those which are robustly evidence-based. This means
gold-standard randomized controlled trials wherever possible.
Page 139
Chapter 7
CONCLUSIONS
Acute malnutrition and in particular outpatient-focused CMAM strategies are currently high on
the international child health and nutrition policy agenda(9). It is important to capitalise on this
and build two concluding messages and implications arising from PRONUT and FUSAM:
1) In PRONUT, addition of a functional food, Synbiotic2000 ForteTM, to standard RUTF did not
improve outcomes. Explanations other than no effect include deaths from causes unaffected by
Synbiotic actions; organism sensitivity to cotrimoxazole antibiotics; Synbiotic sharing or cross-
infection between children; suboptimal dose/dose regime.
The observation of reduced outpatient mortality may be due to bias, confounding or
chance, but is biologically plausible, and could be explored in future studies using different
functional foods. It is relevant not just to SAM but to MAM and other less acute forms of
malnutrition. It would be especially relevant if the recently resurrected hypothesis of
enteropathy-associated malnutrition accounts for more malnutrition than recognised by current
treatment strategies(111).
2) Given the overall negative findings of PRONUT and the risk factors identified in FUSAM, it
is more promising in the short term to pursue high quality, high coverage rollout of existing
interventions. It is important to treat both SAM and HIV as early as possible. Community-based
CMAM-type strategies are likely to play a key role identifying and treating high risk patients as
well as proving long term support to those discharged from treatment.
Opportunities for future research on SAM should be taken. These should focus on community
based strategies and should include work on primary prevention of SAM. The potential to
make a difference to 13 million SAM-affected children and over 1 million SAM-related deaths
has never been better.

Page 140
REFERENCES
1. Black RE, Allen LH, Bhutta ZA, Caulfield LE, de Onis M, Ezzati M, et al. Maternal and
child undernutrition: global and regional exposures and health consequences. Lancet. 2008 Jan
19;371(9608):243-60.
2. Collins S, Dent N, Binns P, Bahwere P, Sadler K, Hallam A. Management of severe
acute malnutrition in children. Lancet. 2006 Dec 2;368(9551):1992-2000.
3. Manary MJ, Sandige HL. Management of acute moderate and severe childhood
malnutrition. BMJ. 2008;337:a2180.
4. Heikens GT, Bunn J, Amadi B, Manary M, Chhagan M, Berkley JA, et al. Case
management of HIV-infected severely malnourished children: challenges in the area of highest
prevalence. Lancet. 2008 Apr 12;371(9620):1305-7.
5. Gillespie S HL. Nutrition and the MDGs: The Relationship Between Nutrition and the
Millennium Development Goals: A Strategic Review of the Scope for DfID's Influencing Role:
IFPRI Report. International Food Policy Research Institute, Washington.2003.
6. UN Millennium Development Goals [database on the Internet] [cited 8.7.2009].
Available from: http://www.un.org/millenniumgoals/.
7. Pelletier DL, Frongillo EA, Jr., Schroeder DG, Habicht JP. The effects of malnutrition on
child mortality in developing countries. Bull World Health Organ. 1995;73(4):443-8.
8. Bryce J, Boschi-Pinto C, Shibuya K, Black RE. WHO estimates of the causes of death in
children. Lancet. 2005 Mar 26;365(9465):1147-52.
9. Community-based management of severe acute malnutrition. A Joint Statement by the
World Health Organization, the World Food Programme, the United Nations System Standing
Committee on Nutrition and the United Nations Children’s Fund. 2007 [(accessed 19 Sept
2010)]; Available from:
http://www.who.int/nutrition/topics/statement_commbased_malnutrition/en/index.html.
10. Simeon DT. School feeding in Jamaica: a review of its evaluation. Am J Clin Nutr. 1998
Apr;67(4):790S-4S.
11. Mukudi E. Nutrition status, education participation, and school achievement among
Kenyan middle-school children. Nutrition. 2003 Jul-Aug;19(7-8):612-6.
12. Nurturing girls: a key to promoting maternal health. Newsl Womens Glob Netw
Reprod Rights. 1991 Jul-Sep(36):20-1.
13. Group HIVW, Miller TL, Agostoni C, Duggan C, Guarino A, Manary M, et al.
Gastrointestinal and Nutritional Complications of Human Immunodeficiency Virus Infection.
Journal of Pediatric Gastroenterology & Nutrition. 2008;47(2):247-53.
14. Mangili A, Murman DH, Zampini AM, Wanke CA. Nutrition and HIV infection: review
of weight loss and wasting in the era of highly active antiretroviral therapy from the nutrition
for healthy living cohort. Clin Infect Dis. 2006 Mar 15;42(6):836-42.
15. WHO. Management of severe malnutrition: a manual for physicians and other senior
health workers. World Health Organisation. World Health Organisation; 1999 [(accessed 19
Sept 2010)]; Available from:
http://www.who.int/nutrition/publications/en/manage_severe_malnutrition_eng.pdf.
16. Kerac M, Egan R, Mayer S, Walsh A, Seal A. New WHO growth standards: roll-out
needs more resources. Lancet. 2009 Jul 11;374(9684):100-2.
17. Collins S, Yates R. The need to update the classification of acute malnutrition. Lancet.
2003 Jul 19;362(9379):249.
18. Grobler-Tanner C, Collins S. Community Therapeutic Care(CTC). A new approach to
managing acute malnutrition in emergencies and beyond: FANTA (Food and Nutrition
Technical Assistance)2004. Report No.: 8 (Technical Report).

Page 141
19. Myatt M, Khara T, Collins S. A review of methods to detect cases of severely
malnourished children in the community for their admission into community-based therapeutic
care programs. Food Nutr Bull. 2006 Sep;27(3 Suppl):S7-23.
20. WHO child growth standards and the identification of severe acute malnutrition in
infants and children. A joint statement by the World Health Organization and the United
Nations Children's Fund. May. 2009 [(accessed 19 Sept 2010)]; Available from:
http://www.who.int/nutrition/publications/severemalnutrition/9789241598163/en/index.html.
21. World Health Organization. The WHO child growth standards. [(accessed 19 Sept
2010)]; Available from: http://www.who.int/childgrowth/standards/en/.
22. Enrolment and baseline characteristics in the WHO Multicentre Growth Reference
Study. Acta Paediatr Suppl. 2006 Apr;450:7-15.
23. de Onis M, Garza C, Habicht JP. Time for a new growth reference. Pediatrics. 1997
Nov;100(5):E8.
24. Isanaka S, Villamor E, Shepherd S, Grais RF. Assessing the Impact of the Introduction
of the World Health Organization Growth Standards and Weight-for-Height z-Score Criterion
on the Response to Treatment of Severe Acute Malnutrition in Children: Secondary Data
Analysis. Pediatrics. 2009 January 1, 2009;123(1):e54-9.
25. Interim Guidelines for the Management of Acute Malnutrtion through Community
Based Therapeutic Care. Government of Malawi. 2007.
26. Prudhon C, Briend A, Laurier D, Golden MHN, Mary JY. Comparison of Weight- and
Height-based Indices for Assessing the Risk of Death in Severely Malnourished Children. Am J
Epidemiol. 1996 July 15, 1996;144(2):116-23.
27. Prevention (medical). Available from:
http://en.wikipedia.org/wiki/Prevention_(medical).
28. Ciliberto H, Ciliberto M, Briend A, Ashorn P, Bier D, Manary M. Antioxidant
supplementation for the prevention of kwashiorkor in Malawian children: randomised, double
blind, placebo controlled trial. Bmj. 2005 May 14;330(7500):1109.
29. Waterlow JC. Protein-Energy Malnutrition (reprint of original 1992 version, with new
supplementary material): Smith-Gordon; 2006.
30. Golden B, Golden M. Plasma zinc and the clinical features of malnutrition. The
American Journal of Clinical Nutrition. 1979 December 1, 1979;32(12):2490-4.
31. GOLDEN MHN, GOLDEN BE. TRACE ELEMENTS. British Medical Bulletin. 1981
January 1, 1981;37(1):31-6.
32. Management of severe malnutrition : a manual for physicians and other senior health
workers. Geneva: World Health Organization; 1999.
33. Khara T, Collins, S. Community-based Therapeutic Care (CTC). ENN (Emergency
Nutrtion Network) Supplement Series No2. November 2004.
34. Collins S, Sadler K, Dent N, Khara T, Guerrero S, Myatt M, et al. Key issues in the
success of community-based management of severe malnutrition. Food Nutr Bull. 2006 Sep;27(3
Suppl):S49-82.
35. Ashworth A. Efficacy and effectiveness of community-based treatment of severe
malnutrition. Food Nutr Bull. 2006 Sep;27(3 Suppl):S24-48.
36. Collins S. Changing the way we address severe malnutrition during famine. Lancet.
2001 Aug 11;358(9280):498-501.
37. Valid, International. Community-based Therapeutic Care (CTC). A Field Manual. Valid
International; 2006 [31.8.2007]; First Edition:[Available from: http://www.validinternational.org.
38. Grobler-Tanner C. Use of Compact Foods in Emergencies FANTA (Food & Nutrition
Technical Assistance) Technical Note No. 3. 2002.
39. Manary M. Local Production and provision of ready-to-use therapeutic food for the
treatment of severe childhood malnutrition. Technical Background Paper for an informal
consultation (November 2005) to discuss community-based management of severe
malnutrition. WHO, UNICEF, SCN. 2005.

Page 142
40. Briend A, Lacsala R, Prudhon C, Mounier B, Grellety Y, Golden MH. Ready-to-use
therapeutic food for treatment of marasmus. Lancet. 1999 May 22;353(9166):1767-8.
41. Diop el HI, Dossou NI, Ndour MM, Briend A, Wade S. Comparison of the efficacy of a
solid ready-to-use food and a liquid, milk-based diet for the rehabilitation of severely
malnourished children: a randomized trial. Am J Clin Nutr. 2003 Aug;78(2):302-7.
42. Bachmann MO. Cost effectiveness of community-based therapeutic care for children
with severe acute malnutrition in Zambia: decision tree model. Cost Eff Resour Alloc. 2009;7:2.
43. Kapil U. Ready to Use Therapeutic Food(RUTF) in the management of severe acute
malnutrition in India. Indian Pediatr. 2009 May;46(5):381-2.
44. Skordis-Worrall J, Kerac M. Localized or centralized control of food production for
treating severe acute malnutrition: echoes of a past child survival revolution? Matern Child
Nutr. 2009 Jul;5(3):195-8.
45. Chaparro CM. Preventing Malnutrition: the potential role of lipid-based nutrient
supplements (LNS). International Food Aid Conference. 2009 [cited 20.11.2009]; Available from:
http://www.fsa.usda.gov/Internet/FSA_File/ifac09_bo3_camila_chaparro0407.pdf.
46. Schofield C, Ashworth A. Why have mortality rates for severe malnutrition remained
so high? Bull World Health Organ. 1996;74(2):223-9.
47. Deen JL, Funk M, Guevara VC, Saloojee H, Doe JY, Palmer A, et al. Implementation of
WHO guidelines on management of severe malnutrition in hospitals in Africa. Bull World
Health Organ. 2003;81(4):237-43.
48. Ashworth A, Chopra M, McCoy D, Sanders D, Jackson D, Karaolis N, et al. WHO
guidelines for management of severe malnutrition in rural South African hospitals: effect on
case fatality and the influence of operational factors. Lancet. 2004 Apr 3;363(9415):1110-5.
49. Collins S. Treating severe acute malnutrition seriously. Arch Dis Child. 2007
May;92(5):453-61.
50. Jones G, Steketee RW, Black RE, Bhutta ZA, Morris SS. (Bellagio Child Health Series 2)
How many child deaths can we prevent this year? Lancet. 2003 Jul 5;362(9377):65-71.
51. Bhutta ZA. Addressing severe acute malnutrition where it matters. Lancet. 2009 Jul
11;374(9684):94-6.
52. Fergusson P, Tomkins A, Kerac M. Improving the management of Severe Acute
Malnutrition in HIV prevalent settings. International Health. 2009;1(1):10-6.
53. Fergusson P, Tomkins A. HIV prevalence and mortality among children undergoing
treatment for severe acute malnutrition in sub-Saharan Africa: a systematic review and meta-
analysis. Trans R Soc Trop Med Hyg. 2008 Dec 4.
54. Hasler CM. Functional Foods: Benefits, Concerns and Challenges--A Position Paper
from the American Council on Science and Health. J Nutr. 2002 December 1, 2002;132(12):3772-
81.
55. Stanton C, Gardiner G, Meehan H, Collins K, Fitzgerald G, Lynch PB, et al. Market
potential for probiotics. Am J Clin Nutr. 2001 Feb;73(2 Suppl):476S-83S.
56. Dekker J, Collett M, Prasad J, Gopal P. Functionality of probiotics - potential for
product development. Forum Nutr. 2007;60:196-208.
57. Katan MB. Health claims for functional foods. BMJ. 2004 January 24, 2004;328(7433):180-
1.
58. Schrezenmeir J, de Vrese M. Probiotics, prebiotics, and synbiotics--approaching a
definition. Am J Clin Nutr. 2001 Feb;73(2 Suppl):361S-4S.
59. Allen SJ, Okoko B, Martinez E, Gregorio G, Dans LF. Probiotics for treating infectious
diarrhoea. Cochrane Database Syst Rev. 2004(2):CD003048.
60. Sazawal S, Hiremath G, Dhingra U, Malik P, Deb S, Black RE. Efficacy of probiotics in
prevention of acute diarrhoea: a meta-analysis of masked, randomised, placebo-controlled
trials. Lancet Infect Dis. 2006 Jun;6(6):374-82.
61. Modest growth for the probiotic market. (2008 Market) Foodprocessing.com: home
page for the food and beverage industry. [updated 19.3.2009]; Available from:
http://www.foodprocessing.com/articles/2008/383.html?page=print.
Page 143
62. Jones G, Steketee RW, Black RE, Bhutta ZA, Morris SS. How many child deaths can we
prevent this year? Lancet. 2003 Jul 5;362(9377):65-71.
63. Gibson GR. Dietary modulation of the human gut microflora using the prebiotics
oligofructose and inulin. J Nutr. 1999 Jul;129(7 Suppl):1438S-41S.
64. Vojislav Peri IM. Minisymposium on functional food: Basic aspects of pre-, pro- and
synbiotics
ARCH GASTROENTEROHEPATOL. 2003;22 ( No 3 - 4 ):65 - 72.
65. Sullivan PB, Mascie-Taylor CG, Lunn PG, Northrop-Clewes CA, Neale G. The
treatment of persistent diarrhoea and malnutrition: long-term effects of in-patient rehabilitation.
Acta Paediatr Scand. 1991 Nov;80(11):1025-30.
66. Fagundes-Neto U. Malnutrition and malabsorption. Arq Gastroenterol. 1982 Apr-
Jun;19(2):91-8.
67. Heikens GT, Schofield WN, Dawson S. The Kingston Project. II. The effects of high
energy supplement and metronidazole on malnourished children rehabilitated in the
community: anthropometry. Eur J Clin Nutr. 1993 Mar;47(3):160-73.
68. Brewster DR, Manary MJ, Menzies IS, O'Loughlin EV, Henry RL. Intestinal
permeability in kwashiorkor. Arch Dis Child. 1997 Mar;76(3):236-41.
69. Campbell DI, Lunn PG, Elia M. Age-related association of small intestinal mucosal
enteropathy with nutritional status in rural Gambian children. Br J Nutr. 2002 Nov;88(5):499-
505.
70. Babirekere-Iriso E, Musoke P, Kekitiinwa A. Bacteraemia in severely malnourished
children in an HIV-endemic setting. Ann Trop Paediatr. 2006 Dec;26(4):319-28.
71. Reed RP, Wegerhoff FO, Rothberg AD. Bacteraemia in malnourished rural African
children. Ann Trop Paediatr. 1996 Mar;16(1):61-8.
72. Reid M, Badaloo A, Forrester T, Morlese JF, Heird WC, Jahoor F. The acute-phase
protein response to infection in edematous and nonedematous protein-energy malnutrition. Am
J Clin Nutr. 2002 Dec;76(6):1409-15.
73. Cannon JP, Lee TA, Bolanos JT, Danziger LH. Pathogenic relevance of Lactobacillus: a
retrospective review of over 200 cases. Eur J Clin Microbiol Infect Dis. 2005 Jan;24(1):31-40.
74. Land MH, Rouster-Stevens K, Woods CR, Cannon ML, Cnota J, Shetty AK.
Lactobacillus sepsis associated with probiotic therapy. Pediatrics. 2005 Jan;115(1):178-81.
75. Waterlow JC, Tomkins A, Grantham-McGregor SM. Protein-energy malnutrition.
London: Edward Arnold; 1992.
76. Ndagije F, Baribwira C, Coulter JBS. Micronutrients and T-cell subsets: a comparison
between HIV-infected and uninfected, severely malnourished Rwandan children. Annals of
Tropical Paediatrics: International Child Health. 2007;27:269.
77. Malawi country profile: UNdata. [cited 14.11.2009]; Available from:
http://data.un.org/CountryProfile.aspx?crName=Malawi
78. CIA World Factbook - Malawi. 2009 [cited 18.11.2009]; Available from:
http://www.cia.gov/cia/publications/factbook/geos/mi.html.
79. Tomkins A, Watson F. Malnutrition and Infection − A review − Nutrition policy
discussion paper No. 5. UNITED NATIONS ADMINISTRATIVE COMMITTEE ON
COORDINATION/SUBCOMMITTEE ON NUTRITION 1989 [cited 18.11.2009. Available from:
http://www.unscn.org/layout/modules/resources/files/Policy_paper_No_5.pdf.
80. Devereux S. STATE OF DISASTER Causes, Consequences & Policy Lessons from
Malawi An ActionAid Report Commissioned by ActionAid Malawi
June. 2002. Available from:
http://www.actionaid.org.uk/_content/documents/malawifamine.pdf.
81. Ndekha MJ, Manary MJ, Ashorn P, Briend A. Home-based therapy with ready-to-use
therapeutic food is of benefit to malnourished, HIV-infected Malawian children. Acta Paediatr.
2005 Feb;94(2):222-5.
82. Manary MJ, Ndkeha MJ, Ashorn P, Maleta K, Briend A. Home based therapy for severe
malnutrition with ready-to-use food. Arch Dis Child. 2004 Jun;89(6):557-61.

Page 144
83. Sadler K. Community-based Therapeutic Care: treating severe acute malnutrition in
sub-Saharan Africa. [PhD]: University College London; 2009.
84. Sadler K, Kerac M, Collins S, Khengere H, Nesbitt A. Improving the Management of
Severe Acute Malnutrition in an Area of High HIV Prevalence. J Trop Pediatr. 2008 May 1.
85. de Onis M, Onyango AW, Van den Broeck J, Chumlea WC, Martorell R. Measurement
and standardization protocols for anthropometry used in the construction of a new
international growth reference. Food Nutr Bull. 2004 Mar;25(1 Suppl):S27-36.
86. Thurstans S, Kerac M, Maleta K, Banda T, Nesbitt A. HIV prevalence in severely
malnourished children admitted to nutrition rehabilitation units in Malawi: geographical &
seasonal variations a cross-sectional study. BMC Pediatr. 2008;8:22.
87. Kerac M, Seal A, Blencowe H, Bunn J. Improved assessment of child nutritional status
using target weights and a novel, low-cost, weight-for-height slide chart. Trop Doct. 2009
Jan;39(1):23-6.
88. Sphere Humanitarian Charter and Minimum Standards in Disaster Response. 2004
[cited 27.7.2009]; Available from:
http://www.sphereproject.org/content/view/27/84/lang,English/.
89. Ozturk M, Akkus S, Malas M, Kisioglu A. Growth Status of Children with Cerebral
Palsy, Indian Paediatrics. 2002;39:834-8.
90. Management of Acute Malnutrition in Infants (MAMI) project. Emergency Nutrition
Network, UCL Centre for International Health & Development, Action Contre la Faim. 2009
[(accessed 19 Sept 2010)]; Available from: http://www.ucl.ac.uk/cihd/research/nutrition/mami
91. Kotzampassi K, Giamarellos-Bourboulis EJ, Voudouris A, Kazamias P, Eleftheriadis E.
Benefits of a synbiotic formula (Synbiotic 2000Forte) in critically Ill trauma patients: early
results of a randomized controlled trial. World J Surg. 2006 Oct;30(10):1848-55.
92. Olah A, Belagyi T, Poto L, Romics L, Jr., Bengmark S. Synbiotic control of inflammation
and infection in severe acute pancreatitis: a prospective, randomized, double blind study.
Hepatogastroenterology. 2007 Mar;54(74):590-4.
93. Pocock SJ. When to stop a clinical trial. BMJ. 1992 Jul 25;305(6847):235-40.
94. World Health Organization. WHO Case definitions of HIV for surveillance and revised
clinical staging and immunological classification of HIV-related disease in adults and children
2006 [cited 12.12.2009. Available from:
http://www.who.int/hiv/pub/guidelines/hivstaging/en/index.html.
95. Dean A, Dean J, Coulombier D, Brendel K, Smith D, Burton A, et al. Epi Info, Version 6:
a word processing, database, and statistics program for public health on IBM-compatible
microcomputers. Centers for Disease Control and Prevention, Atlanta, Georgia, U.S.A., (USER
MANUAL). 1996 [(accessed 19 Sept 2010)]; Available from:
http://www.cdc.gov/epiinfo/Epi6/ei6manl.htm.
96. Emergency Nutrition Assessment (ENA) software for Standardized Monitoring and
Assessment of Relief and Transitions (SMART). Version October 2007. . [(accessed 19 Sept
2010)]; Available from: http://www.nutrisurvey.de/ena/ena.html.
97. NSO. Malawi Demographic and Health Survey: National Statistical Office, Zomba,
Malawi & ORC Macro, Maryland, USA2004.
98. Vyas S, Kumaranayake L. Constructing socio-economic status indices: how to use
principal components analysis. Health Policy Plan. 2006 Nov;21(6):459-68.
99. Pocock SJ, Clayton TC, Altman DG. Survival plots of time-to-event outcomes in clinical
trials: good practice and pitfalls. Lancet. 2002 May 11;359(9318):1686-9.
100. Manary MJ, Hart CA, Whyte MP. Severe hypophosphatemia in children with
kwashiorkor is associated with increased mortality. J Pediatr. 1998 Dec;133(6):789-91.
101. Marinella MA. The refeeding syndrome and hypophosphatemia. Nutr Rev. 2003
Sep;61(9):320-3.
102. Van Niel CW, Feudtner C, Garrison MM, Christakis DA. Lactobacillus therapy for acute
infectious diarrhea in children: a meta-analysis. Pediatrics. 2002 Apr;109(4):678-84.

Page 145
103. Jones G, Steketee RW, Black RE, Bhutta ZA, Morris SS. BELLAGIO 2 How many child
deaths can we prevent this year? Lancet. 2003 Jul 5;362(9377):65-71.
104. Wilcox MH, Sandoe JA. Results of study of probiotic yoghurt drink to prevent
antibiotic-associated diarrhoea are not widely applicable. Online Rapid Response, 13th July
2007, to: Hickson et al. Use of probiotic Lactobacillus preparation to prevent diarrhoea
associated with antibiotics: randomised double blind placebo controlled trial. BMJ.
bmj.39231.599815.55. 2007 [30.11.2007]; Available from:
http://www.bmj.com/cgi/eletters/335/7610/80.
105. Krick J, Murphy-Miller P, Zeger S, Wright E. Pattern of growth in children with cerebral
palsy. J Am Diet Assoc. 1996 Jul;96(7):680-5.
106. Besselink MGH, van Santvoort HC, Buskens E, Boermeester MA, van Goor H,
Timmerman HM, et al. Probiotic prophylaxis in predicted severe acute pancreatitis: a
randomised, double-blind, placebo-controlled trial. The Lancet. 2008 23.2.2008;371(9613):651.
107. Oberhelman RA, Gilman RH, Sheen P, Taylor DN, Black RE, Cabrera L, et al. A
placebo-controlled trial of Lactobacillus GG to prevent diarrhea in undernourished Peruvian
children. J Pediatr. 1999 Jan;134(1):15-20.
108. Trois L, Cardoso EM, Miura E. Use of Probiotics in HIV-infected Children: A
Randomized Double-blind Controlled Study. J Trop Pediatr. 2007 September 17, 2007:fmm066.
109. Galpin L, Manary MJ, Fleming K, Ou CN, Ashorn P, Shulman RJ. Effect of Lactobacillus
GG on intestinal integrity in Malawian children at risk of tropical enteropathy. Am J Clin Nutr.
2005 Nov;82(5):1040-5.
110. Spindler-Vesel A, Bengmark S, Vovk I, Cerovic O, Kompan L. Synbiotics, prebiotics,
glutamine, or peptide in early enteral nutrition: a randomized study in trauma patients. JPEN J
Parenter Enteral Nutr. 2007 Mar-Apr;31(2):119-26.
111. Humphrey JH. Child undernutrition, tropical enteropathy, toilets, and handwashing.
Lancet. 2009 Sep 19;374(9694):1032-5.
112. Bhutta ZA, Nelson EA, Lee WS, Tarr PI, Zablah R, Phua KB, et al. Recent advances and
evidence gaps in persistent diarrhea. J Pediatr Gastroenterol Nutr. 2008 Aug;47(2):260-5.
113. Pecoul B, Soutif C, Hounkpevi M, Ducos M. Efficacy of a therapeutic feeding centre
evaluated during hospitalization and a follow-up period, Tahoua, Niger, 1987-1988. Ann Trop
Paediatr. 1992;12(1):47-54.
114. Hennart P, Beghin D, Bossuyt M. Long-term follow-up of severe protein-energy
malnutrition in Eastern Zaire. J Trop Pediatr. 1987 Feb;33(1):10-2.
115. Banapurmath CR, Prasad SM, Banapurmath S, Kesaree N. Follow-up study of survivors
of severe protein energy manlnutrition. Indian Pediatr. 1999 Feb;36(2):139-43.
116. van Roosmalen-Wiebenga MW, Kusin JA, de With C. Nutrition rehabilitation in
hospital--a waste of time and money? Evaluation of nutrition rehabilitation in a rural district
hospital in South-west Tanzania. II. Long-term results. J Trop Pediatr. 1987 Feb;33(1):24-8.
117. Perra A, Costello AM. Efficacy of outreach nutrition rehabilitation centres in reducing
mortality and improving nutritional outcome of severely malnourished children in Guinea
Bissau. Eur J Clin Nutr. 1995 May;49(5):353-9.
118. Shrimpton R, Victora CG, de Onis M, Lima RC, Blossner M, Clugston G. Worldwide
timing of growth faltering: implications for nutritional interventions. Pediatrics. 2001
May;107(5):E75.

Page 146

Page 147
APPENDICES
Annex A. Research articles – summary list
A.1 Directly related to thesis
2009 i. Bunn J, Thindwa M, Kerac M. Features associated with underlying HIV infection in severe
acute childhood malnutrition: a cross sectional study. Malawi Medical Journal 2009 Vol 21, Issue 3, p 108 http://www.mmj.medcol.mw/issues/vol21_3malnutrition.pdf
ii. Kerac M, Bunn J, Seal A, Thindwa M, Tomkins
T, Sadler
K, Bahwere
P, Collins S.
Treatment of Severe Acute Malnutrition (SAM) using probiotic/prebiotic-enhanced therapeutic food in a HIV prevalent setting: A double-blind efficacy RCT in Malawi(The “PRONUT study” ~ PRObiotics in malNUTrition) – The Lancet, Vol 374, Issue 9684, p 136 to 144, 11
th July 2009. doi:10.1016/S0140-6736(09)60884-9
http://www.thelancet.com/journals/lancet/article/PIIS0140-6736(09)60884-9/abstract iii. Kerac M, Seal A, Blencowe H, Bunn J. Improved Assessment of child nutritional status
using target weights and a novel low-cost weight-for-height slide chart. Tropical Doctor 39(1): 23-26; doi:10.1258/td.2008.080096. http://td.rsmjournals.com/cgi/content/full/39/1/23
A.2 Related to theme of Severe Acute Malnutrition
2009 i. Kerac M, Blencowe H, Grijalva Eternod C, McGrath M, Shoham J, Seal A. Prevalence of
wasting in infants aged <6 months and implications of 2006 WHO Child Growth Standards for selective feeding programmes in nutritionally vulnerable settings. (in press, ADC, accepted December 2010)
ii. Fergusson P, Tomkins A, Kerac M. Improving the management of Severe Acute Malnutrition in HIV prevalent settings. International Health (Review) Vol 1, Issue 1, Sept 2009, p 10-16. doi:10.1016/j.inhe.2009.03.001 http://download.journals.elsevierhealth.com/pdfs/journals/18763413/PIIS187634130900007.pdf
iii. Kerac, M; Egan R; Mayer, S; Walsh A; Seal A. New WHO Growth Standards: rollout needs more resources. The Lancet (Commentary), Vol 374, Issue 9684, p 100 to 101, 11
th July
2009. doi:10.1016/S0140-6736(09)61266-6 http://www.thelancet.com/journals/lancet/article/PIIS0140-6736(09)61264-2/fulltext
iv. Skordis-Worrall, J & Kerac, M. Localized or centralized control of food production for treating severe acute malnutrition: echoes of a past child survival revolution? Maternal and Child Nutrition (Editorial), Vol 5(3) 195-198 http://www3.interscience.wiley.com/journal/122456010/abstract
2008 v. Thurstans S, Kerac M, Maleta K, Banda T, Nesbitt A. HIV prevalence in severely
malnourished children admitted to nutrition rehabilitation units in Malawi: Geographical & seasonal variations, a cross sectional study. BMC Paediatrics 2008, 8:22 doi:10.1186/1471-2431-8-22 http://www.biomedcentral.com/1471-2431/8/22 (published online 21st May 2008)
vi. Sadler K, Kerac M, Collins S, Khengere H, Nesbitt A, Improving the Management of Severe Acute Malnutrition in an Area of High HIV Prevalence, Journal of Tropical Pediatrics. doi: 10.1093/tropej/fmn029 (published online May 1
st 2008)
http://tropej.oxfordjournals.org/cgi/content/abstract/54/6/364
2007 vii. Seal A & Kerac M. ‘Operational implications of the use of the 2006 WHO Growth Standards
in nutrition programmes: secondary data analysis. British Medical Journal, doi:10.1136/bmj.39101.664109.AE (publ. online 23 February 2007) http://www.bmj.com/cgi/content/abstract/334/7596/733
+ response to letter on paper, BMJ online rapid responses http://www.bmj.com/cgi/eletters/334/7596/733
viii. Kerac M & Seal A, ‘The new 2006 WHO Growth standards: What will they mean for
emergency nutrition programmes?’ Field Exchange (commentary), 2006; 28:15-6 (http://www.ennonline.net/fex/current/Fex28.pdf)
Page 148
Annex B. Presentations to meetings – summary
B.1 Policy & General meetings (directly & indirectly PhD-related)
2009 i. SPHERE (Humanitarian Charter & Minimum Standards in Disaster Response), 2010
update meeting Core working group for nutrition Save the Children UK, London, October 22
th to 23
rd
2009 International consultative meeting for the revision of the nutrition components of the Sphere Handbook,
ii. Global Nutrition Cluster Annual Meeting Bonhill House, London UK, October 20
th to 21
st 2009
- Presented summary of MAMI (Management of Acute Malnutrition in Infants) project http://oneresponse.info/GlobalClusters/Nutrition/Documents/GNC%20Annual%20Meeting%20Report%2020-21%20October%202009.pdf http://oneresponse.info/GlobalClusters/Nutrition/Pages/Global%20Cluster%20Meetings.aspx
iii. SPHERE (Humanitarian Charter & Minimum Standards in Disaster Response), 2010 update meeting
Mt Soche Hotel, Blantyre, Malawi, August 10th to 11
th 2009
Malawi consultative meeting for the revision of the nutrition components of the Sphere Handbook, - Presentation on implications of new WHO-Growth standards & latest evidence regarding infants <6months
2007 & before iv. World Bank (International) Development Marketplace 2007 (Health, Population &
Nutrition), World Bank, Washington DC, USA. May 21
st to 23
rd 2007
Poster presentation (finalist project, last 104 / 2800 original applications worldwide): ~ “Community-Therapeutic Care – New Generation” Development of a new, cost-effective therapeutic food for severely malnourished children
http://siteresources.worldbank.org/DEVMARKETPLACE/Resources/finalistsbook.final.pdf (page 13) v. National CTC Review Workshop, Malawi Institute of Management, Lilongwe, Malawi, April 19
th 2006
Lecture presentation (Marko Kerac, representing co-authors: Sadler K, Kerac M, Collins S, Khengere H, Nesbitt A)
~ “CTC experience and protocols, MOYO house, QECH, Blantyre”
B.2 Academic Meetings (directly and indirectly related to PhD)
2009 vi. MAINN (Maternal & Infant Nutrition & Nurture) Conference University of Lancashire, UK, September 7
th 2009
Workshop presentation:( led by Marko Kerac ) Kerac M, McGrath M, Bizouerne C, Wilkinson C, Shoham J, Seal A MAMI (Management of Acute
Malnutrition in Infants). A review of current field management of acutely malnourished infants under six months of age
vii. CAPGAN (Commonwealth Association of Paediatric Gastroenterology & Nutrition) Blantyre, Malawi, August 12
th to 16
th 2009
http://www.mmj.medcol.mw/issues/vol21_3abstracts.pdf Accepted for oral presentation
• Marko Kerac presented: 1) Probiotic/prebiotic-enhanced therapeutic food for treatment of severe acute malnutrition in an HIV prevalent setting: a double-blind efficacy RCT in Malawi. M.Kerac, J.Bunn A.Seal, M.Thindwa, A.Tomkins, K.Sadler,P.Bahwere, S.Collins

Page 149
2) Child growth standards for child health & nutrition programmes treating wasted infants aged <6 months: secondary data analysis of 21 DHS datasets. M.Kerac, M.McGrath, C.Grijalva-eternod, H.Blencowe, J.Shoham, A.Seal
• Co-author presented (presenting author underlined) 3) Long-term follow-up of children treated for severe acute Malnutrition: a longitudinal cohort study. M.Kerac, G Chagaluka, S Collins, P Bahwere, R Mathisen, S Chitekwe, J Bunn. 4) Mortality a year after admission with HIV and severe acute Malnutrition in Malawi: a cohort study. J. Bunn, G.Chagaluka, M.Kerac 5) A review of bacterial infections in malnourished infants aged under 6 months: implications for Case management in developing countries. H.Bailey, M.Kerac, A.Seal. 6) Modification of the Prudhon index for HIV prevalent settings. J.Bunn, V.Nyirongo, M.Kerac
• Accepted for poster presentation (author underlined presented) 7) Evaluating the Moyo chart – a novel, low-cost, weight-for-height slide chart for improved assessment of nutritional status in children. C.Sikorski, M.Kerac, M.Fikremariam,
A.Seal.
8) Routine antibiotics for uncomplicated & complicated severe acute
malnutrition in children aged 6-59 months: a review of the evidence base
underyling current practice. G.Alcoba-Wright, M.Kerac viii. MSF (Medecins Sans Frontiers) Scientific Day London, UK, June 11
th 2009 http://www.msf.org.uk/sciday09.event
Co-author of lecture presentation (presented by Carlos Grijalva-Eternod, representing co-authors Grijalva- Eternod C; Kerac M; Blencowe H, McGrath M; Shoham J; Seal) ~ “Wasting in infants < 6 months: prevalence and implications for emergency feeding programmes of the 2006 WHO Child Growth Standards”
ix. Royal College of Paediatrics & Child Health Spring Meeting (International Health / VSO section)
York, UK, April 1st 2009
http://ichg.org.uk/publications/CHILD2015_Global_Communications_Package_ICHG_VSO_RCPCH_2009.pdf
a) Lecture presentation (Dr Marko Kerac, representing co-authors: Blencowe H; Kerac M; McGrath M; Grijalva-Eternod C; Shoham J; Seal A) ~ “Disease burden and risk-benefit implications of using new WHO Child Growth Standards to diagnose Severe Acute Malnutrition in infants <6 months age: Secondary data analysis of 21 developing country DHS surveys” b) Co-author of lecture presentation (presented by Dr Hannah Blencowe, representing co-authors: Blencowe H; Kerac M; Molyneux E) ~ “'Task-shifting' to reduce neonatal mortality in a tertiary referral hospital in a developing country"
x. UCL Research Student’s poster day – UCL, London, UK, March 6
th 2009
Poster presentation (presented by Dr Marko Kerac, representing co-authors: Kerac M; Blencowe H; McGrath M; Grijalva-Eternod C; Seal A) ~ “Acute Malnutrition in <6 month old infants: Developing country disease burden & implications of the new WHO Child Growth Standards"
2008 xi. Royal Society of Tropical Medicine & Hygiene “Research in Progress” day SOAS, London, UK, December 18
th 2008
Two poster presentations: (presented by Marko Kerac, representing co-authors listed)
a). “PRONUT” Study ~ A double blind randomised controlled trial to evaluate the
efficacy of pre/probiotic enhanced Ready-to-Use Therapeutic Food (RUTF) in the
treatment of severe acute childhood malnutrition. Kerac M; Bunn J; Seal A; Thindwa M;
Bahwere P; Sadler K; Tomkins A; Collins S
b) “Acute Malnutrition in <6 month old infants: Developing country disease burden & implications of the new WHO Child Growth Standards" Blencowe H, Kerac M, McGrath M, Grijalva-Eternod C, Seal A
xii. Institute of Child Health Research Students’ poster day –
Page 150
ICH, London, UK, November 26th 2008
Poster preparation (presented by Dr Andrew Seal, representing co-authors: Kerac M, Blencowe H, McGrath M, Grijalva-Eternod C, Seal A) ~ “Acute Malnutrition in <6 month old infants: Developing country disease burden & implications of the new WHO Child Growth Standards"
2007 xiii. Institute of Child Health Research Students’ poster Day ICH, London, UK, November 28
th 2007
Poster preparation (presented by Dr Andrew Seal, representing co-authors: Kerac M;
Bunn J; Seal A; Thindwa M; Bahwere P; Sadler K; Tomkins A; Collins S)
~ “PRONUT” Study ~ A double blind randomised controlled trial to evaluate the efficacy of pre/probiotic enhanced Ready-to-Use Therapeutic Food (RUTF) in the treatment of severe acute childhood malnutrition
xiv. 11th
COMREC National Research & Dissemination Conference, College of Medicine, Blantyre, Malawi, November 24
th 2007
http://www.medcol.mw/com/Program.pdf
Lecture presentation (Marko Kerac, representing co-authors: Kerac M; Bunn J; Seal
A; Thindwa M; Bahwere P; Sadler K; Tomkins A; Collins S)
~ “PRONUT” Study ~ A double blind randomised controlled trial to evaluate the efficacy
of pre/probiotic enhanced Ready-to-Use Therapeutic Food (RUTF) in the treatment of
severe acute childhood malnutrition
xv. International Policy & Research Planning Workshop: Blantyre Technical Review ~ Improving the Management of Severely Malnourished Children with HIV in Sub-Saharan African,
Queen Elizabeth Central Hospital, Blantyre, Malawi, January 28th-30
th 2007
Three lecture presentations (Marko Kerac, representing co-authors) a) “Increasing therapeutic feeding programme capacity by offering RUTF in place of F100”: Kerac M, Lim J, Bunn J. b) “Potential use & effect of probiotics in severely malnourished Malawian children” Kerac M
c) “Data handling, data quality & longitudinal analysis” Kerac M xvi. 2
nd Malawi Annual HIV Nutrition Meeting,
College of Medicine, Blantyre, Malawi, Jan 27th 2007
Lecture presentation (Marko Kerac, representing co-authors (Kerac M, Bunn J) ~ “Excess mortality risk associated with HIV infection in a large Malawian NRU”
2006 and before xvii. 10
th COMREC (College of Medicine Research & Ethics Committee) National
Research & Dissemination Conference, College of Medicine, Blantyre, Malawi, November 11
th 2006
Lecture presentation (Marko Kerac, representing co-authors: Thurstans S, Kerac M, Maleta K, Banda T, Nesbitt A)
~ “HIV Prevalence in Malawian NRUs”
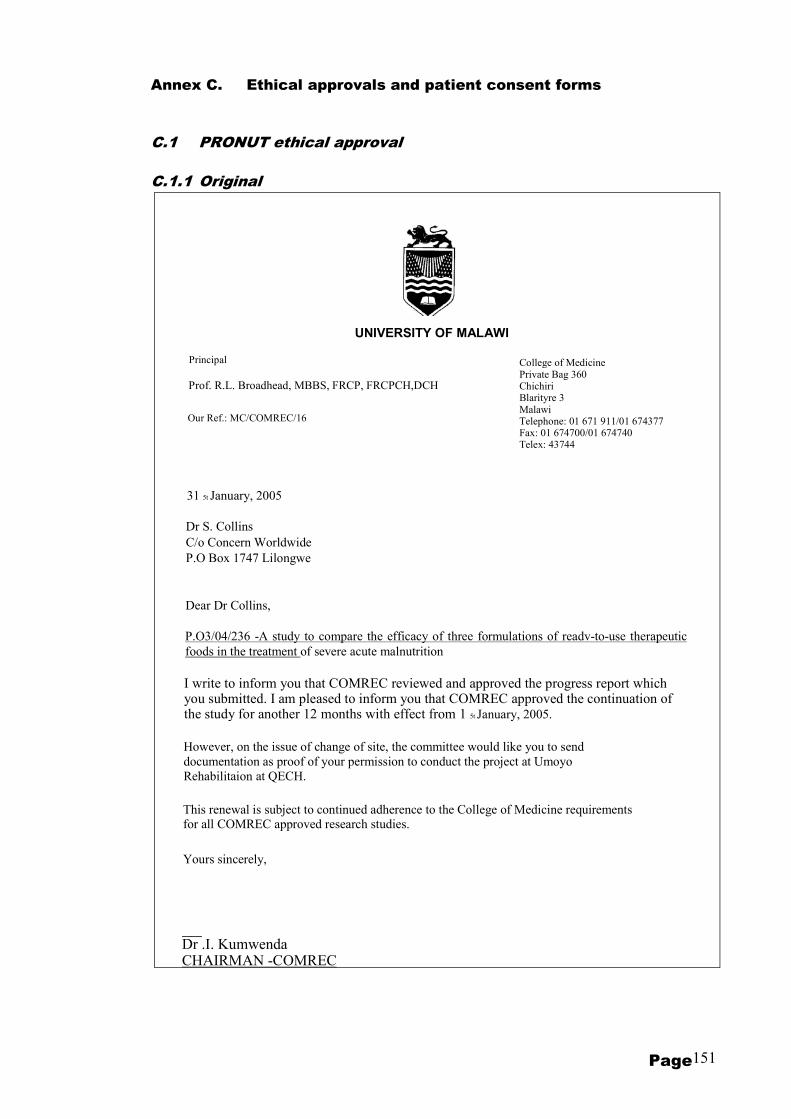
Page 151
Annex C. Ethical approvals and patient consent forms
C.1 PRONUT ethical approval
C.1.1 Original
UNIVERSITY OF MALAWI
Principal College of Medicine Private Bag 360 Chichiri Blarityre 3 Malawi Telephone: 01 671 911/01 674377 Fax: 01 674700/01 674740 Telex: 43744
Prof. R.L. Broadhead, MBBS, FRCP, FRCPCH,DCH
Our Ref.: MC/COMREC/16
31 5t January, 2005
Dr S. Collins
C/o Concern Worldwide
P.O Box 1747 Lilongwe
Dear Dr Collins,
P.O3/04/236 -A study to compare the efficacy of three formulations of readv-to-use therapeutic
foods in the treatment of severe acute malnutrition
I write to inform you that COMREC reviewed and approved the progress report which you submitted. I am pleased to inform you that COMREC approved the continuation of the study for another 12 months with effect from 1 5t January, 2005.
However, on the issue of change of site, the committee would like you to send
documentation as proof of your permission to conduct the project at Umoyo
Rehabilitaion at QECH.
This renewal is subject to continued adherence to the College of Medicine requirements for all COMREC approved research studies.
Yours sincerely,
__ Dr .I. Kumwenda CHAIRMAN -COMREC

C.1.2 Update
Page 152
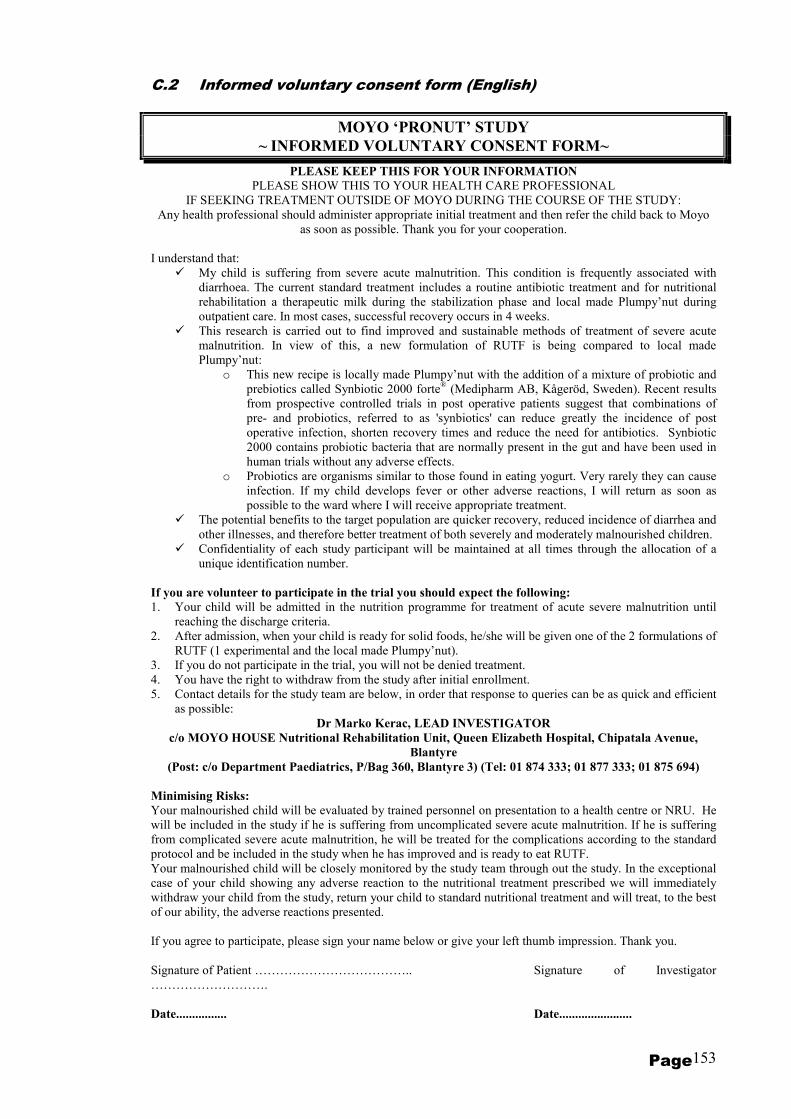
Page 153
C.2 Informed voluntary consent form (English)
MOYO ‘PRONUT’ STUDY
~ INFORMED VOLUNTARY CONSENT FORM~
PLEASE KEEP THIS FOR YOUR INFORMATION
PLEASE SHOW THIS TO YOUR HEALTH CARE PROFESSIONAL
IF SEEKING TREATMENT OUTSIDE OF MOYO DURING THE COURSE OF THE STUDY:
Any health professional should administer appropriate initial treatment and then refer the child back to Moyo
as soon as possible. Thank you for your cooperation.
I understand that:
� My child is suffering from severe acute malnutrition. This condition is frequently associated with
diarrhoea. The current standard treatment includes a routine antibiotic treatment and for nutritional
rehabilitation a therapeutic milk during the stabilization phase and local made Plumpy’nut during
outpatient care. In most cases, successful recovery occurs in 4 weeks.
� This research is carried out to find improved and sustainable methods of treatment of severe acute
malnutrition. In view of this, a new formulation of RUTF is being compared to local made
Plumpy’nut:
o This new recipe is locally made Plumpy’nut with the addition of a mixture of probiotic and
prebiotics called Synbiotic 2000 forte® (Medipharm AB, Kågeröd, Sweden). Recent results
from prospective controlled trials in post operative patients suggest that combinations of
pre- and probiotics, referred to as 'synbiotics' can reduce greatly the incidence of post
operative infection, shorten recovery times and reduce the need for antibiotics. Synbiotic
2000 contains probiotic bacteria that are normally present in the gut and have been used in
human trials without any adverse effects.
o Probiotics are organisms similar to those found in eating yogurt. Very rarely they can cause
infection. If my child develops fever or other adverse reactions, I will return as soon as
possible to the ward where I will receive appropriate treatment.
� The potential benefits to the target population are quicker recovery, reduced incidence of diarrhea and
other illnesses, and therefore better treatment of both severely and moderately malnourished children.
� Confidentiality of each study participant will be maintained at all times through the allocation of a
unique identification number.
If you are volunteer to participate in the trial you should expect the following:
1. Your child will be admitted in the nutrition programme for treatment of acute severe malnutrition until
reaching the discharge criteria.
2. After admission, when your child is ready for solid foods, he/she will be given one of the 2 formulations of
RUTF (1 experimental and the local made Plumpy’nut).
3. If you do not participate in the trial, you will not be denied treatment.
4. You have the right to withdraw from the study after initial enrollment.
5. Contact details for the study team are below, in order that response to queries can be as quick and efficient
as possible:
Dr Marko Kerac, LEAD INVESTIGATOR
c/o MOYO HOUSE Nutritional Rehabilitation Unit, Queen Elizabeth Hospital, Chipatala Avenue,
Blantyre
(Post: c/o Department Paediatrics, P/Bag 360, Blantyre 3) (Tel: 01 874 333; 01 877 333; 01 875 694)
Minimising Risks:
Your malnourished child will be evaluated by trained personnel on presentation to a health centre or NRU. He
will be included in the study if he is suffering from uncomplicated severe acute malnutrition. If he is suffering
from complicated severe acute malnutrition, he will be treated for the complications according to the standard
protocol and be included in the study when he has improved and is ready to eat RUTF.
Your malnourished child will be closely monitored by the study team through out the study. In the exceptional
case of your child showing any adverse reaction to the nutritional treatment prescribed we will immediately
withdraw your child from the study, return your child to standard nutritional treatment and will treat, to the best
of our ability, the adverse reactions presented.
If you agree to participate, please sign your name below or give your left thumb impression. Thank you.
Signature of Patient ……………………………….. Signature of Investigator
……………………….
Date................ Date.......................

Page 154
C.3 Informed voluntary consent form (Chichewa)
MOYO ‘PRONUT’ STUDY ~ FOMU YOVOMEREZA ~
CHONDE SAMALANI BWINO FOMUYI
CHIKALATACHI NDIPO KUMBUKIRANI KUYITENGA NDIKUYIWONETSA KWA DOTOLO
PAMENE MUKUPITA KUKALANDIRA CHITHANDIZO KU ZIPATALA ZINA PA NYENGO YONSE
YA IMENE MULI MUKAFUKUFUKUYU
Kwa onse ogwira ntchito ya chipatala: chonde mutitumizire mwanayo kuno ku MOYO HOUSE mutatha
kumupatsa chitandizo choyambilira. Zikomo.
NDIVOMEREZA KUTI:
~ Mwana wanga akuperewera zakudya zoyenera za magulu, mthupi mwake. Ndipo kutsegula m’mimba kumadza
pafupi pafupi chifukwa chavutoli. Matendawa amagonjetsedwa pakumwa mankhwala opha tizilombo m’mimba mwa
mwanayo ndipo kupereweredwa kwa zakudya kumagonjetsedwa ndi mkaka wokhala ndi zakudya zomanga ndi
kulimbitsa thupi nthawi imene agonekedwa ku chipatala komanso mwanayo akaonetsa kusintha, amapatsidwa
chiponde cha mtedza pamasiku amene akuyendera ku chipatala kuchokera kunyumba. Pa ma sabata anayi, mwanayo
amasonyeza kusintha kusonyeza moyo wathanzi ndithu.
~ Kafukufukuyu akuchitika ndi cholinga choti papezeke njira zabwino zokhalitsa zogonjetsera kupereweredwa kwa
zakudya mthupi mwa mwana. Pachifukwa ichi, chiponde chapangidwanso china chatsopano (chopangidwada kwathu
konkuno):
• Mtundu wa chakudya chimenechi ndicho chiponde cha mtedza, mkaka, sugar chosakanizidwa ndi synbiotic
2000 forte (ndipo muli zipangizo zina zokhala ngati zamu yogati). Mankhwala a synbiotic 2000 forte
(medipharm AB, kagerod,Sweden) ayesedwa ndipo zotsatira zake zaonetsa kuti odwala sangapitilirenso
kugwidwa ndimatenda otsekula m’mimba kapena kuchepekedwa zakudya mthupi, komanso zimathandiza
munthu kuchira msanga. Ndipo mankhwala ena ophera tizilombo toyambitsa matenda mthupi saliofunika
pafupipafupi. Synbiotic 2000 forte anayesedwa kuwanthu popanda chokhumudwitsa chirichonse.
• Probiotics ndi tizirombo tofanana ndi tomwe timapezeka mu Chakudya ngati Yogati, tomwe timayambitsa
matenda mu ana ochepa kwambiri monga kutentha thupi koma kawiri kawiri sitiyambitsa matenda. Ngati
mwana wanga atenda thupi, kapena mavuto ena, ndidzabwelera naye mwansanga ku Chipatala kumene
ndikalandire chithandizo choyenera.
~ Phindu lake kwa ofunika kupatsidwa chakudyachi likuyembekezeka kukhala: kuchira mofulumira, kuchepetsa
matenda otsegula m’mimba ndi matenda ena, komanso kuchiza matenda a kusowa kwa zakudya mthupi.
~ Chinsisi cha mwana aliyense wolandila chithandizo cha zakudya za chiponde (chakudya chokonzeratu chobwezera
thanzi mthupi chopatsidwa kwa anthu amatupi onyentchera chifukwa chamatenda) chidzasungidwa bwino lomwe
posalemba dzina la mwanano m’malo mwake aliyense adzapatsidwa nambala ngati chizindikiro chake.
NGATI MWADZIPEREKA KUTHANDIZA NAWO PA KAFUKUFUKUYU, MUVOMEREZE KUTI:
1. Mwana wanu adzagonekedwa ku chipatala pa ndondomeko yolandira chakudya chamagulu komanso
chakudya cha mankhwala othetsa kusowa kwa zakudya mthupi mpaka nthawi imene adzapezere bwino
ndikutuluka mchipatala.
2. Pamena mwana wanu agonekedwa kuchipatala adzapatsidwa chimodzi mwa zakudya za mitundu iwiri ya
RUTF (chiponde); choyamba chosakaniza mankhwala a synbiotic 2000 forte; chachiwiri chopanda
mankhwala.(pamene mwana wayamba kupeza bwino)
3. Ngakhale musalowe nawo mu kaundula wakafukufukuyu, muli ololedwa kulandila mankhwala ndi
chithandizo.
4. Simulioumilizidwa kukhalamo mkaundula wakafukufuku mukhoza kutulukamo nthawi ina iri yonse.
5. Ngati muli ndi mafunso mukhoza kufunsa kwa:
Dr Marko Kerac, LEAD INVESTIGATOR
c/o MOYO HOUSE Nutritional Rehabilitation Unit, Queen Elizabeth Hospital, Chipatala Avenue, Blantyre
(Post: c/o Department Paediatrics, P/Bag 360, Blantyre 3) (Tel: 01 874 333; 01 877 333; 01 875 694)
CHITETEZO
Mwana wanu adzayesedwa ndipo adzalowa nawo mkaundula wa kafukufuku wa matenda osowa zakudya mnthupi.
Adzapatsidwa chakudya chamankhwala ndiponso chamagulu ndipo adzalembedwa mu kafukufuku pamene mwanayo
wayamba kupeza bwino.
Mwana wanu adzaonedwa pafupi pafupi ndi anthu omwe akonza kafukufukuyu panyengo yonse mwanayo adzakhala
ku chipatala. Ngati mwana wanu adzasonyeza kusagwirizana ndi zakudya zamankhwalazo, adzaimitsidwa
ndikuchotsedwa mukawundula wakafukufukuyo, ndipo adzaperekedwa ku ndondomeko ya zakudya zamagulu kuti
alandile chithandizo choyenera kufikira achire ndithu.
Ngati muvomereza ndi kugwirizana nazo zonse zalembedwazi, chonde lembani dzina lanu pamusipa kapena
kusindikiza chala chanu. Zikomo
PROJECT IYI YAPANGIDWA APURUVU NDI ‘COMREC’ (College of Medicine Research & Ethics Committee),
ref. P03/04/236

Page 155
C.4 FUSAM ethical approval form
UNIVERSITY OF MALAŴI
Principal College of Medicine Private Bag 360 Prof. R.L. Broadhead, MBBS, FRCP, FRCPCH, DCH Chichiri Blantyre 3 Malawi
Telephone: 01 671 911/01 674 377 Fax: 01 674 700/01 674 740
Our Ref.: MC/COMREC/16
Telex: 43744
4th February, 2008 Dr M. Kerac Paediatrics Department P/Bag 360 Blantyre 3 Dear Dr Kerac, P.03/04/236 –A study to compare the efficacy of three formulation of ready-to-use therapeutic foods (RUTF) in the treatment of severe acute malnutrition I write to inform you that COMREC reviewed your revised expansion for follow up of the above research project which you resubmitted. I am pleased to inform you that your request for expansion has been approved. Yours sincerely, Prof. J.M. Mfutso Bengo SECRETARY - COMREC

Page 156
Annex D. MOYO Ward forms and protocols
D.1 Weight chart

Page 157
D.2 Drug and inpatient symptom chart

D.3 Protocol for as
for assessing inpatient symptoms and appetite
Page 158
symptoms and appetite

Page 159
D.4 Inpatient ‘phased feeding’ protocol
Phase 1 (STABILIZATION phase)
WHAT: F75 milk ~ amount according to weight
PHASE 1 PATIENTS ARE SEEN DAILY ON ROUNDS
WHO: ALL patients
EXCEPT:
~ patients <6months old
�give F100 dilute
~ patients with VERY SEVERE oedema
� see chart � reduce feed volume
WHEN: ALL patients get phase 1 on admission.
It should continue for a MINIMUM of 1 day.

Page 160
Phase 1 (STABILIZATION phase)
KEY MESSAGES FOR CARERS
WHAT IS WRONG WITH MY CHILD?WHAT IS WRONG WITH MY CHILD?WHAT IS WRONG WITH MY CHILD?WHAT IS WRONG WITH MY CHILD? He/she is sick with severe malnutrition.
HOW CAN MY CHILD GET BETTER?HOW CAN MY CHILD GET BETTER?HOW CAN MY CHILD GET BETTER?HOW CAN MY CHILD GET BETTER? To get better, the child needs: ~ special medicine-foods (F75 milk; Chiponde) ~ medicines ~ as prescribed by the doctor / nurse WHAT ISWHAT ISWHAT ISWHAT IS PHASE ONE FEEDING?PHASE ONE FEEDING?PHASE ONE FEEDING?PHASE ONE FEEDING? When a child first arrives on MOYO, the body is too sick and weak for normal food ~ it may get sicker unless feeding is done correctly. Phase 1 feeding involves use of a special milk called ‘F75’ ‘F75’ is a special milk made just for sick malnourished children. It helps the body get stronger and prepares it for the next phase of feeding. HOW MUCH F75 MILK DOES MY CHILD NEED?HOW MUCH F75 MILK DOES MY CHILD NEED?HOW MUCH F75 MILK DOES MY CHILD NEED?HOW MUCH F75 MILK DOES MY CHILD NEED? It is important to give the right amount of F75 milk: not too much / not too little. Always keep the ‘ticket’ saying how much milk your child needs:~ always show it to the kitchen staff who will then give you the correct amount HOW OFTEN DOES MY CHILD NEED F75 MILK?HOW OFTEN DOES MY CHILD NEED F75 MILK?HOW OFTEN DOES MY CHILD NEED F75 MILK?HOW OFTEN DOES MY CHILD NEED F75 MILK? F75 needs to be given every 3 hours: 6am; 9am; noon; 3pm; 6pm; 9pm; midnight; 3am. (= 8 feeds per day) Do not miss the night feeds ~ sick children can get worse if feeds are missed. WHAT ABOUT BREAST FEEDING & OTHER FOODS?WHAT ABOUT BREAST FEEDING & OTHER FOODS?WHAT ABOUT BREAST FEEDING & OTHER FOODS?WHAT ABOUT BREAST FEEDING & OTHER FOODS? CHILDREN STILL BREAST FEEDING SHOULD CONTINUE TO BREAST FEED The best time to breast feed is immediately before getting f75 milk No other foods should be given during phase one WHAT SHOULD I DO IF MY CHILD IS HAVING PROBLEMS?WHAT SHOULD I DO IF MY CHILD IS HAVING PROBLEMS?WHAT SHOULD I DO IF MY CHILD IS HAVING PROBLEMS?WHAT SHOULD I DO IF MY CHILD IS HAVING PROBLEMS? The child should be encouraged BUT NEVER FORCED to eat milk If the child is finishing <3/4 of the milk, GET HELP � TELL NURSE / DRS
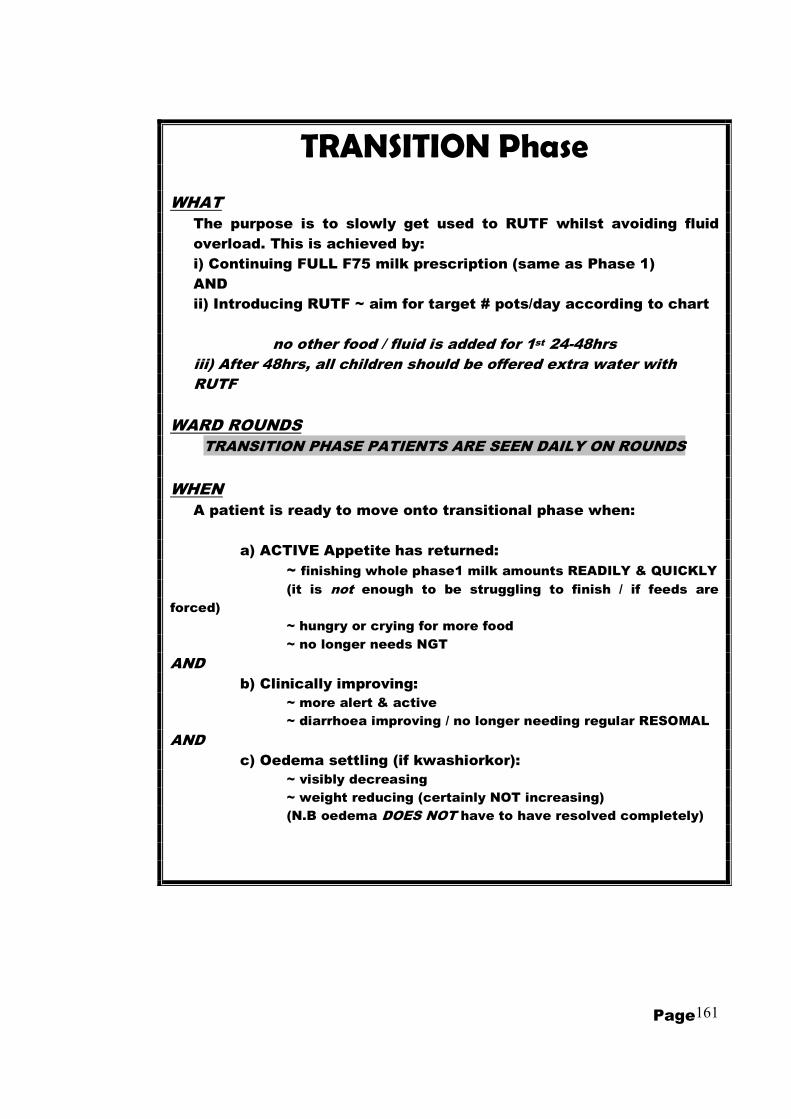
Page 161
TRANSITION Phase
WHAT
The purpose is to slowly get used to RUTF whilst avoiding fluid
overload. This is achieved by:
i) Continuing FULL F75 milk prescription (same as Phase 1)
AND
ii) Introducing RUTF ~ aim for target # pots/day according to chart
no other food / fluid is added for 1st 24-48hrs
iii) After 48hrs, all children should be offered extra water with
RUTF
WARD ROUNDS
TRANSITION PHASE PATIENTS ARE SEEN DAILY ON ROUNDS
WHEN
A patient is ready to move onto transitional phase when:
a) ACTIVE Appetite has returned:
~ finishing whole phase1 milk amounts READILY & QUICKLY
(it is not enough to be struggling to finish / if feeds are
forced)
~ hungry or crying for more food
~ no longer needs NGT
AND
b) Clinically improving:
~ more alert & active
~ diarrhoea improving / no longer needing regular RESOMAL
AND
c) Oedema settling (if kwashiorkor):
~ visibly decreasing
~ weight reducing (certainly NOT increasing)
(N.B oedema DOES NOT have to have resolved completely)

Page 162
TRANSITION Phase
MESSAGES TO GIVE TO CARERS WHAT IS TRANSITION PHASE?WHAT IS TRANSITION PHASE?WHAT IS TRANSITION PHASE?WHAT IS TRANSITION PHASE? “Transition” phase feeds are given to children who are improving, so that they can SLOWLY get used to eating enough RUTF. � Whilst on transition phase, 3 hourly milk feeds should continue exactly as before, BUT:
RUTF is added to the diet WHAT IS RUTF (CHIPONDE)?WHAT IS RUTF (CHIPONDE)?WHAT IS RUTF (CHIPONDE)?WHAT IS RUTF (CHIPONDE)? RUTF is a medicine-food which is:
energy-giving; body-building; health restoring Eating enough RUTF is vital for the child to get better
HOW MUCH RUTF DOES MY CHILD NEED TO EAT TO GET BETTER?HOW MUCH RUTF DOES MY CHILD NEED TO EAT TO GET BETTER?HOW MUCH RUTF DOES MY CHILD NEED TO EAT TO GET BETTER?HOW MUCH RUTF DOES MY CHILD NEED TO EAT TO GET BETTER? The doctor/nurse will tell you how much your child should be aiming to eat per day. This depends on body size: keep your ticket to help you remember. HOW SHOULD THE CHILD EAT HOW SHOULD THE CHILD EAT HOW SHOULD THE CHILD EAT HOW SHOULD THE CHILD EAT RUTFRUTFRUTFRUTF � RUTF should be eaten direct from the pot (using CLEANCLEANCLEANCLEAN hands or spoon) � RUTF will make him/her thirsty & his/her the mouth dry, so: ~ The child should continue to drink milk, every 3 hours, as before. � Eat spoonfuls of RUTF before and between mouthfuls of milk: ~ this will help wash down the RUTF, making it easier to eat. ~ do not wait until after milk to eat RUTF - else the stomach will become too full and the child be unable to eat the RUTF or will vomit. � Sick children may not like to eat, so offer SMALL, REGULAR amounts:: ~ start with a taste only / < ½ spoonful, together with each milk feed ~ graduallygraduallygraduallygradually increase the amount of RUTF taken with each feed. ~ your ticket will show how many spoonfuls of RUTF you should be aiming for with each milk feed once appetite has returned fully WHAT IF MY CHILD IS HAVING PROBLEMS EATING RUTF?WHAT IF MY CHILD IS HAVING PROBLEMS EATING RUTF?WHAT IF MY CHILD IS HAVING PROBLEMS EATING RUTF?WHAT IF MY CHILD IS HAVING PROBLEMS EATING RUTF? � Try mixing a small amount in with the milk to make it easier to swallow � NEVER NEVER NEVER NEVER FORCE FEED! (This will only make a problem worse!!!) If a child is vomiting or refusing RUTF take a break and continue milk feeds alone. Restart slowly. With time, the amount taken will gradually increase. � Make sure the child has no mouth sores / candida: ask the doctor for help! * CHILDREN STILL BREAST FEEDING SHOULD * CHILDREN STILL BREAST FEEDING SHOULD * CHILDREN STILL BREAST FEEDING SHOULD * CHILDREN STILL BREAST FEEDING SHOULD CONTINUE TO BF *CONTINUE TO BF *CONTINUE TO BF *CONTINUE TO BF *

Page 163
Phase 2 (REHABILITATION phase)
WHAT
Phase 2 feeds (on MOYO) include:
i) RUTF (the MOST important food!)
~ should easily finish at least 50% of target q
amount
ii) F75 milk
~ same VOLUME as before
~ reduced FREQUENCY: only SIX times a days
(i.e no longer needs midnight & 3am feeds)
iii) Phala @ 6am, 6pm
iv) Extra water, as desired
WARD ROUNDS
PHASE 2 PATIENTS ARE SEEN ONLY TWICE WEEKLY ON ROUNDS
(but clinical history / feed history is filled daily)
WHEN
A patient is not moved onto phase 2, but moves him/herself
when:
a) Appetite is good enough:
~ is easily able to finish at least 50% of his/her daily RUTF
target
(N.B when reaches target, can have more if wanted)
b) Clinically stable
~ alert & active
~ admission problems improving / improved
� DOES NOT NEED DAILY CLINICAN REVIEW AND
c) (If Kwashiorkor)
~ oedema SETTLING AND is not more than ++
(NB does NOT have to have settled completely)

Page 164
PHASE 2 (REHABILITATION phase)
MESSAGES TO GIVE TO CARERS
The child is continuing to get better and is making good progress: He/she is now almost ready to leave hospital to finish treatment at home
WHY RUTF?WHY RUTF?WHY RUTF?WHY RUTF? RUTF is the most important part of home treatment:
~ To continue to get better it is vital to continue to eat the full ‘target’ amount of RUTF that is given out
~ RUTF should not be shared (it is for malnourished children only)
WHAT ABOUT OTHER FOODS / WHAT ABOUT OTHER FOODS / WHAT ABOUT OTHER FOODS / WHAT ABOUT OTHER FOODS / WHAT IF THE CHILD IS STILL HUNGRY?WHAT IF THE CHILD IS STILL HUNGRY?WHAT IF THE CHILD IS STILL HUNGRY?WHAT IF THE CHILD IS STILL HUNGRY? If still hungry after finishing the daily RUTF ration, it is OK to eat other foods
BUT RUTF should be eaten as priority, before other foods
(children have small stomachs that will easily get filled ~ they will vomit if you try to give too much)
CHILDREN STILL BREAST FEEDING SHOULD CHILDREN STILL BREAST FEEDING SHOULD CHILDREN STILL BREAST FEEDING SHOULD CHILDREN STILL BREAST FEEDING SHOULD CONTINUE TO BREAST FEED REGULARLYCONTINUE TO BREAST FEED REGULARLYCONTINUE TO BREAST FEED REGULARLYCONTINUE TO BREAST FEED REGULARLY
HOW SHOULD THE CHILD EAT RUTF?HOW SHOULD THE CHILD EAT RUTF?HOW SHOULD THE CHILD EAT RUTF?HOW SHOULD THE CHILD EAT RUTF? Basic instructions as for Transitional phase: AND
Since the child is now eating more RUTF, he/she may be more thirsty than usual. He/she can now drink extra milk or water(boiled), according to thirst
OTHEROTHEROTHEROTHER Use soap for child’s hands and face before feeding. Keep food clean and lid on
pot between feeds
With diarrhoea, never stop feeding. Give EXTRA food and EXTRA water.

Page 165
FEED PROBLEMS (moving back a phase)
WHAT
Sometimes, a child gets worse rather than better.
Children who deteriorate during their inpatient stay may need to move
BACK to an earlier feeding phase.
WHEN
A child should move back to phase 1 if:
a) Appetite deteriorates
~ having significant problems eating RUTF
~ refusing RUTF
AND/OR
b) Clinically deteriorates
e.g.:
~ any complication needing IV infusion
~ significant re-feeding diarrhoea
~ tense abdominal distension
AND/OR
c) Oedema worsens / develops fluid overload
~ increasing oedema in a child with kwashiorkor
~ new onset oedema in a child with marasmus
~ rapid increase in size of live
~ other signs of fluid overload (bilateral crepitations;
gallop rhythm; raised JVP)

Page 166
D.5 OTP protocols
(patients and their carers would be directed around various ‘stations’ of the OTP clinic, each focusing on a particular activity)
MOYO OTP: ~ station (1) ~
CLINIC BOOK & WEIGHT
REGISTER child’s arrival in OTP clinic book (check which group ~ 1 or 2 ~ write in CORRECT book)
FILL OTP form:
HMIS #; child initials; today’s date; date originally discharged (to help find details if health passport lost);
which # visit this is(count in passport/ask mother)
WEIGH child (two people to check) If weight changed by more than ( > ) 1kg
� CHECK WEIGHT AGAIN
WRITE weight: FIRST on OTP form ~~~ SECONDLY in health passport
CHECK TARGET WEIGHT(80% wt/ht) and
NUMBER OF VISITS & decide: does this child need to go to station 2 OR direct to station 3?

Page 167
MOYO OTP ~ station (2) ~
LENGTH & MUAC
NEED TO MEASURE LENGTH & MUAC IF… i) CHILD nutritionally ‘CURED’
= REACHED target weight (80% wt/ht) on TWO consecutive visits
OR
ii) ‘FAILURE’ of nutritional Therapy = still not cured on 5th visit / 10 weeks
…if neither of above, go direct to station (3)
work in teams of two but: *** MEASURE INDEPENDENTLY ***
BOTH REMEASURE if:
Difference of more than, >0.7cm btw lengths Difference of more than, >0.5cm btw MUACs
� CALCULATE AVERAGE of measurements
� COMPARE to BASELINE length / MUAC:
BOTH REMEASURE if: Length or MUAC~
decreased OR
increased by > 2cm �
CALCULATE AVERAGE of LAST measures & WRITE FINAL LENGTH/MUAC on OTP sheet
NB NOTE ON SHEET IF MEASURING HEIGHT (standing) rather than LENGTH (lying dow

Page 168
MOYO OTP ~ station (3) ~
RUTF & SYMPTOM QUESTIONNAIRE
Complete patient questionnaire (+ sign who is filling questionnaire)
� If has fever TODAY
� send to Malaria project for MPS / PCV before clinician review (write request in health passport)
� IF ANY PATIENT SICK TODAY
=> ALERT CLINICIAN
MOYO OTP ~ station (4) ~
CLINICAN REVIEW (+/- investigations, as appropriate)
REVIEW OTP FILE (+ send back for review @ appropriate station if needed)
� REVIEW HISTORY
+/- EXAMINE PATIENT: a) Clinically WELL but not cured
or
b)Clinically WELL AND CURED
Clinically NOT well or
NOT YET CURED
Discharge (D/C) to: ~ SFP (Supplementary Feeding Programme)
~ Other, as needed (e.g. ARV/ Cotrim Clin/ Umodzi Pall. Care )
Needs further R/V @ MOYO OTP:
Give date to come back in 2 weeks for: ~ more RUTF
~ further clinical review

Page 169
MOYO OTP ~ station (5) ~ OTP REGISTER
REGISTER child in main OTP register if D/C, write, in red pen:
a) SFP destination b) final height (+change since baseline) c) final MUAC (+ change since baseline)
Give any appropriate medications
Ensure carer understands any follow-up instructions
If D/C: Give & explain SFP form
MOYO OTP ~ station (6) ~
RUTF distribution & clinic book
(check which group ~ 1 or 2 ~ write in correct book)
Give RUTF according to prescription (N.B. children being discharged get sachets rather than bottles)
Collect OTP clinic sheet & ensure all sections filled (return to appropriate station if any missing details)
Carer’s left thumbprint in book
to confirm receipt of transport allowance & RUTF
~ CARER & CHILD CAN GO HOM

Page 170
Annex E. PRONUT study forms and questionnaires
E.1 Recruitment and consent
Page 1/1 PRONUT form 01: RECRUITMENT HMIS no: Y06__/__/__/__
1) RECRUITMENT (all MOYO children are initially considered eligible for study)
1) EXCLUSION CRITERIA: (***** DO NOT RANDOMIZE / INCLUDE IN STUDY *****)
1.1 Is child <6 months (==>needs F100 dilute feeds)
==> IS eligible
2) CONSENT FOR TAKING PART IN STUDY:2.1 If eligible, read consent form in Chichewa (or other appropriate lanuguage)
(ensure understanding / refer any questions to senior investigator before signing) (tick when done)
2.2 If eligible , does carer wish to take part in the study?
if NO ~ 2.2.1) If carer agrees, still complete all forms (to see if any differences btw study/non-study group?)
2.2.2) Thank carer & ask, if possible, to give reason for declining:
if YES~ (give carer copy of study information / consent form)
Name, signature (AND/OR) LEFT THUMBPRINT of carer
Name & signature of person obtaining consent
3) BASIC DETAILS
Ensure routine paperwork, incl weight & drug chart completely filled: (tick when done)
If readmission: WRITE ADMISSIONS REGISTER IN RED: consider whether to use same or new HMIS number:
If ORIGINAL episode: a) AFTER JULY 2006 (i.e. SAME HMIS YEAR) ==> use OLD HMIS number
b) BEFORE JULY 2006 (i.e. OLD HMIS year) ==> use NEW HMIS number
4) ABSOLUTE WITHDRAWL (==> NO MORE RUTF TO BE GIVEN)
4.1 Date of withdrawal: ____ d/_____m/200__
4.2 Timing of withdrawal:
4.3 Give reason: NOT malnutrition 1.1 RENAL (nephrotic / nephritic /other)
give correct Dx & details: 1.2 MALIGNANCY:
1.3 CARDIAC:
1.4 OTHER:
Patient carer request withdrawl
say why if possible
Other
5) ELIGIBILITY FOR PRIMARY ANALYSIS (==> CONTINUE RUTF but NOT for main analysis)
5.1 Eligible for primary analysis
5.2 If no, why not? 1) Cerebral palsy / syndrome 5) Other
2) Age >5years ( 60 months ) DETAILS:
3) Weight <4kg
4) Not SAM (ie wt/ht>70%; >-3Z; MUAC>11.0cm)
DATE: _____ / _____ / 2006 Interviewer Initials:
1 = yes 0 = no
Explain that the study may not start immediately ~ only when the child is eligible for REHABILITATION feeds.
A second, verbal consent will then be requested to confirm willingness to take part
Any decision may be changed at any time without affecting the patient's clinical care
***** WITHDRAWAL FROM STUDY / REVIEW OF ELIGIBILITY*****
3 = OTP, post rnd.
1 = yes: 0 = no
1
3
1 = pre-randomization 2 = IP, post rnd.
2
==> NOT eligible
1 = yes, (<6months) 0 = no (>6m)
does want to take part does NOT want

Page 171
E.2 Baseline anthropometry
Page 1/1 PRONUT form 02: Anthropometry
2) Anthropometry
1) CHILD:1.1 Sex 1 = male 2 = female
1.2 Date of Birth _____ d / ______m / ________y
1.3 Age today (NB check DOB & AGE are consistent and correct) ______yrs/______months
(completed months)
1.4 Is date of birth: 99 = DK
2) BASELINE ANTHROPOMETRY2.1 BASELINE / ADMISSION WEIGHT:
2.1.1 Weight assessed by:
2.1.2 If not study team, is it likely: 0 = wrong: if so, what is 1st correct wt:
2.2 BASELINE OEDEMABoth repeat if any difference in grade:
initials
2.2.1
2.2.2
2.2.4 Oedema assessed by:
2.2.5 If not study team, is it likely: 0 = wrong: if so, what is 1st correct oedema:
2.3 BASELINE LENGTH2.3.1 Which was done? 1 = length (measured lying down)
Both repeat if: >0.7cm difference (or, if readmission, height � or � >2cm)initials
2.3.2
2.3.3 cm
2.4 BASELINE MUAC
Both repeat if: >0.5cm difference (or, if readmission, MUAC� or �>2cm)initials
2.4.1
2.4.2
3) ARRIVAL AT MOYO / TFP3.1 Check admission date(S) on front sheet is correct tick when done
3.2 Admission:3.2.1 admitted via WHERE: circle / code from list below
3.2.2 date orginally admitted/seen: _____ d / ______m / ________y1 = via PSCW2 = readmission from MOYO OTP (if readmission, check old notes)3 = referred from other FEEDING programme (SFP/OTP) - which:4 = referred from other hospital / clinic (NOT feeding cente) - which:5 = other (specify)
date ____d/ _____m/200___
2= others
1 = correct
HMIS no:
Child Initials:
Y06__/__/__/__
.BASELINE WEIGHT
checked by:
rechecked by:
cm
1 = accurate 2 = estimated
2= others
Oedema 2 ? ===> BASELINE OEDEMA
+ ++ +++
1 = study team
MUAC 1 ? ===> MUAC 2 ? ===> MUAC 3 BASELINE MUAC
Oedema 1 ? ===>
1 = study team
0
1 = correct
length 1 ? ===> length 2 ? ===> length 3
2 = height (measured STANDING)
BASELINE LENGTH
0 = referred / came via other1 = direct from home to MOYO (via QECH U5/A&E)
if not direct:

Page 172
E.3 Baseline clinical profile
Page 1/4 PRONUT form 3: Clinical
3) Clinical
1) HISTORY OF PRESENTING COMPLAINT (2 week history)
# days had
problem 0-14 days
Was/Is problem: 1= minor;
2= mod.
3= severe
Where did you go for treatment? select one
(or more)
from list
1.1 Fever
1.2 Diarrhoea
?other:
1.3 Vomiting
1.4 Abdominal pain
1.5 Fast / Difficult breathing
(chest problem~WITH OR WITHOUT cough)
1.6 Cough
(but NO fast or difficult breathing)
1.7 Oedema / swelling (say where started)
1.8 Anorexia
1.9 Flaky paint / kwashiorkor-type rash
1.10 Other(1 - describe)
1.11 Other(2-describe)
1.12 Other(3-describe)
TREATMENTS:
0 = Did not go for any treatment 5 = from shop / marker / stall
1 = Continued treatment from MOYO OTP clinic (e.g cotrim, TB, other….) 6 = from relative/friend/elder
2 = INPATIENT admission where: 7 = from traditional healer
3 = Outpatient/clinic (NOT incl. OTP today) total # visits 8 = other
4 = from pharmacy 99 = DK
2) BREAST FEEDING
2.1 Complementary feeding: at what age were other foods 1st started? ______months
2.2 Breast feeding: Is (NAME) still BF? 1 = yes 0 = no 99 = DK
if no: 3.2.1 How old was he/she when BF stopped? ______yrs/______months
3.2.2 Why was BF stopped (ask re PMTCT advice):
(loss of appetite)
Y06__/__/__/__
In the PREVIOUS 2 WEEKS did (NAME) have:
(if not had, write '0' in 1st column and leave
others blank)
99 = DK (all columns)
Details of treatment:
list
antibiotics any other drugs
(NOT incl. those given today)
HMIS no:
ORS? (1 = yes / 0 = no)
( ≥ 3 abnormally loose or watery stools/24h)
HISTORY

Page 173
Page 2/4
3) PAST MEDICAL HISTORY (ask to see health passport if available)
3.1 Does carer have (NAME)'s health passport?0 = no
3.2 When (NAME) was born, what size was he/she?:3=very small 99 = DK
3.3 TB Has (NAME) had contact with anyone with TB? 1 = yes 0 = no 99 = DK
3.3.1 Is the contact: 1=mother 2=father 3=other male 99 = DK
3.3.2 Is the contact: 99 = DK
3.3.3 Is the contact sputum +ve 1 = yes 0 = no 99 = DK
3.3.4 Did child ever have: prophylaxis (=isoniazid only) 1 = yes 0 = no 99 = DK
treatment(=multiple tabs) 1 = yes 0 = no 99 = DK
3.4 VCT & HIV Ever had an HIV test(before MOYO)? 1 = yes 0 = no 99 = DK
if yes: 3.4.1 Result? 2 = confidential 99 = DK
if (R): 3.4.2 Is (NAME) taking REGULAR cotrim. 1 = yes 0 = no 99 = DK
3.4.3 Is (NAME) on a waiting list for ARVS? 1 = yes 0 = no 99 = DK
3.4.4 Is (NAME) already on ARVS? 1 = yes 0 = no 99 = DK
if yes to 3.4.2 or 3.4.3: start date / planned start date _____d/ _____m/_______y
3.4.5 Service provider 1=QECH 2=DREAM 3 =other:
4) VACCINATIONS (see also health passport)Has (NAME) ever had: ("definate" = documented / "probable" = carer thinks so)
4.1 BCG 0 = no 99 = DK
4.2 DTP3 0 = no 99 = DK
4.3 Measles 0 = no 99 = DK
(N.B if not had measles -> arrange to give if >6 months age)
5) DEVELOPMENT & DISABILITY (show pictures / check definitions)
CAN (NAME) USUALLY :5.1 Walk alone (at least 5 steps) 0=NO (A) 1=YES (A) 2=NO (R ) 3=YES (R ) 99 = DK
5.2 Sit without support 0=NO (A) 1=YES (A) 2=NO (R ) 3=YES (R ) 99 = DK
5.3 Stand with assistance 0=NO (A) 1=YES (A) 2=NO (R ) 3=YES (R ) 99 = DK
5.4 Crawl on hands / knees 0=NO (A) 1=YES (A) 2=NO (R ) 3=YES (R ) 99 = DK
5.5 Walk with assistance 0=NO (A) 1=YES (A) 2=NO (R ) 3=YES (R ) 99 = DK
5.6 Stand alone for >10 seconds 0=NO (A) 1=YES (A) 2=NO (R ) 3=YES (R ) 99 = DK
5.7 Any concerns that (name) cannot do many of things normal for a child his/her age?1 = yes 0 = no 99 = DK
if yes: 5.7.1 Circle any that apply: meningitis
5.7.2 BRIEFLY describe:
5.7.3 What help or support are you getting?2 = Physio 4 = other
1 = Cheshire homes (Feed the Children) 3 = MAP 99 = DK
6) OTHER STUDIES / RESEARCH PROJECTS6.1 Is (NAME) taking part (currently or recently) in any other projects? 1 = yes 0 = no 99 = DK
Ask specificially about: ROTAVIRUS STUDY/ PMTCT/ ANY FEEDING STUDY
if yes: 6.1.1 DETAILS
6.1.2 STUDY ID / REF. No.
Date ____d/____m/200_ Interviewer initials:
if yes:
(A) ssessed
1 = normal (average) size or bigger
1 = yes (official passport)
2 = smaller than average
(R) eported
1 = household 2 = other
2 = yes, probable
2 = other female
0=NOT REACTIVE 1 = REACTIVE
2 = yes(temporary / exercise book)
1 = yes, definite
1 = yes, definite
0 = None
2 = yes, probable
2 = yes, probable1 = yes, definite
NOT had these problems
problems at birth cerebral malaria
problems with hearing or vision problems with hand movements

Page 174
Date ____d/____m/200_ Interviewer initials:
Page 3/4 PRONUT form 3: Clinical
7) FAMILY HISTORY (NOTE DETAILS OF HIV IF KNOWN)
7.1 List all children born to same mother, including any who died
child
oldest (#1)
2
arrow 3
to identify 4
THIS 5
child 6
7
8
9
0 = <8hr 1 = 8-24hr 2 = 24-48h 3 = >48hr
exact:
1) GENERAL1.1 Admission temperature?
1.2 Appearance / conscious level:4=low BCS
1.2.1 if BCS <5: /5
1.3 Dysmorphic features / Cerebral Palsy / Other severe disability 1 = yes 0=no; 99=DK
if yes describe:
(comment on tone / reflexes / head circ ~ as needed)
1.4 Any traditional medicine charms or amulets? 1 = yes 0=no; 99=DK
2) HANDS, HAIR & SKIN (see table for other relevant features)
2.1 gen Hair changes (thin / fragile / discoloured) 0 = nil 1 = mild 2 = mod. 3 = severe
2.2 gen Flaky-paint dermatosis 0 = nil 1 = mild 2 = mod. 3 = severe
2.3 gen Clubbing? 0 = nil 1 = mild 2 = mod. 3 = severe
2.4 (2) Fungal nail infection 1 = yes 0=no; 99=DK
2.5 (2) Skin: (circle which present) papular pruritic eruptions;
herpes zoster; extensive warts; extensive molluscum 1 = yes 0=no; 99=DK
2.6 (4) Kaposi's sarcoma 1 = yes 0=no; 99=DK
3) MOUTH3.1 gen Sores 0 = nil 3 = severe
3.2 (2) Angular chelitis; gingival erythema; recurrent ulcers 1 = yes 0=no; 99=DK
3.3 (3 / 4) Candida 0 = nil 3 = severe
3.4 (3) Oral hairy leucoplakia; ulcerative teeth & gums (circle) 1 = yes 0=no; 99=DK
3.5 (4) Chronic herpes simplex >1 month - on lips OR skin 1 = yes 0=no; 99=DK
CLINICAL EXAMINATIONTIME: (after adm.)
3 =miserable/irritable
2 = moderate1 = mild
1 = mild (tongue) 2 = mod. (also on mouth lining/palate)
details of illness or death(incl month,year death if died)
oC
Approx date of Birth
(day) / month / year
1 = normal & alert
.
2 = lethargy / apathy
Y06__/__/__/__HMIS no:
0=died/ 1=ill/ 2=well

Page 175
4) MAJOR SYSTEMS4.1 (1) Persistent generalised lymphadenopathy (>1cm @ ≥2 sites) 1 = yes 0=no; 99=DK
4.2 (2) Parotid enlargement (persistent, unexplained) 1 = yes 0=no; 99=DK
4.3 (2) Recurrent, chronic URTI 1 = yes 0=no; 99=DK
current, with ≥1 event in last 6/12. e.g sinusitis, otitis media, bronchitis, croup, ear discharge
4.4 (2) Ear discharge (chronic, >1/12) 1 = yes 0=no; 99=DK
4.6 gen Heart failure 3 = unlikely
4.7 gen Dehydration? 0 = nil 1 = mild 2 = mod. 3 = severe
4.8 gen Peripheries 2 = cool 3 = cold
4.9 gen Respiratory distress 2 = mod. 3 = severe
4.10 gen Tachypnoea 0 = no
4.11 gen Chest signs 0 = no
4.12 Is this severe pneumonia? 3 = unlikely
4.13 (2) Hepatosplenomegaly liver cm / Spleen cm 1 = yes 0=no; 99=DK
4.14 OTHER 1 = yes 0 = no
(describe)
4.15 PREVIOUS WEIGHT copy growth chart from passport into file 1 = done 0 = chart n/a
Previous highest weight: WHEN (mth, year) _______ / 0___ WHAT: kg
(see case definitions)(Circle and write "?" if approximate / 99(=DK) if unable to say)
5) OUTPATIENT VISITS: how many in last 6 months (not incl this one) TOTAL #
Ask if any kwash/oedema/malnut NOT resulting in admission) 1 = yes 0 = no 99 = DK
Details:
6) INPATIENT ADMISSIONS: how many in last 6 months (not MOYO/not this one) TOTAL #
(Circle and write "?" if approximate / 99(=DK) if unable to say)
Details:
7) OTHER:7.1 (3) Any persistent diarrhoea (>14 days, unexplained, no response to Rx) 1 = yes 0=no; 99=DK
7.2 (3) Any persistent fever? (>1 month, no response antibiotics/antimalarials) 1 = yes 0=no; 99=DK
7.3 (3) Any MODERATE malnut./SFP (NOT including after NRU discharge)? 1 = yes 0=no; 99=DK
7.4 (3) Ever had pulmonary TB? (WHEN__________________________) 1 = yes 0=no; 99=DK
7.5 (3) Ever had lymph node TB? (WHEN______________) 1 = yes 0=no; 99=DK
7.6 (4) Ever had extrapulmonary / disseminated TB? 1 = yes 0=no; 99=DK
7.7 (3) Unexplained blood problems? (anaemia/neutropenia/thrombocytopenia) 1 = yes 0=no; 99=DK
7.8 (3) Ever had severe recurrent pneumonia? ~ current AND ≥1 in last 6/12 1 = yes 0=no; 99=DK
if yes was child admitted to hosptial? 1 = yes 0=no; 99=DK
did child need oxygen whilst in hospital? 1 = yes 0=no; 99=DK
7.9 (4) Ever had PCP pneumonia? 1 = yes 0=no; 99=DK
7.10 (3) Ever been diagnosed with HIV chronic lung disease or LIP? 1 = yes 0=no; 99=DK
7.11 (4) Recurrent severe bacterial infection? 1 = yes 0=no; 99=DK
(e.g. empyema; pyomyositis; bone or joint infection; meningitis ~ NOT PNEUMONIA)
7.12 (4) CNS problems: HIV encephalopathy; crypro meningitis; lymphoma; PML 1 = yes 0=no; 99=DK
7.13 (4) Other: CMV retinitis; HIV rectal fistula; cryptosporidiosis; isosporiasis; herpes 1 = yes 0=no; 99=DK
7.14 (4) Ever had severe malnutrtion / admitted to NRU (OR CTC programme) 1 = yes 0=no; 99=DK
how many admissions before this? # when LAST admitted
where admitted 1=MOYO 2 = other 99 = DK
did child reach cure? 0 = no 1 =yes: WHEN discharged? 99 = DK
did child have SFP after? 0 = no 1 =yes: WHERE 99 = DK
Date ____d/____m/200_ = CLINICIAN initials
Additional Hx
if yes
1 = yes: describe
1 = warm(normal))
2 = possible1 = definate / probable
0 = nil
1 = definate / probable
1 = mild
1 = yes: note rate
2 = possible

Page 176
E.4 Baseline geographical details and verbal map
Page 1/3 PRONUT form 4: Geography
4) Geography
1 MAIN RESIDENCE (= home of main carer / where child spends MOST time)
1.1 DISTRICT
1.2 TA / WARD
1.3 VILLAGE / TOWNSHIP
1.4 IS RESIDENCE: 99=DK
2) MAP LOCATION (MAIN RESIDENCE)
To help locate residence on map, please state:
2.1 NEAREST (GOVERNMENT) SCHOOL(S)
Name (must include school on the map):
Distance of school from residence:
2.2 NEAREST (GOVERNMENT) HEALTH CENTRE(S)
Name (must include health centre on the map):
Distance of health centre from residence:
2.3 BEST GUESS LOCATION
MAJOR grid square
small grid square letter number
3) ACCESS TO MOYO FROM HOME
Decribe your journey from home to MOYO:
From To
3.1
3.2
3.3
3.4
3.5
3.6
codes: *TRAVEL: 1=walk / 2=bicycle / 3=minibus / 4=ambulance / 5=hitchhike / 6=other
**TIME If possible, estimate # HOURS(99 = DK)
if unable to say in hours: +=short time; ++=medium time; +++=long time(as percieved by carer)
HMIS no: Y06__/__/__/__
1 = urban 2 = rural
Home
LETTER NUMBER
walk
Travel means* Cost (MK)**Time (if known)

Page 177
Page 2/3
4) DIRECTIONS TO RESIDENCE
(start from major local landmark - e.g school, health centre, shop)
Please include names of at least two people to ask to help find house:
+ WHO are they?
1)
2)
3)
5) SECONDARY RESIDENCE (i.e. 'home' village / other place where spends SIGNIFICANT time)
5.1 DISTRICT
5.2 TA/WARD
5.3 VILLAGE / TOWNSHIP
5.4 REASON FOR SECONDARY RESIDENCE
1=work 99 = DK
6) Directions to residence (SECONDARY RESIDENCE ~ if applicable)
Use local clinic / school (ON MAP) as landmark
6.3 Please include names of at least two people to ask to help find house:
+ WHO are they? 1)
2)
6.4 BEST GUESS LOCATION
MAJOR grid square
small grid square letter number
Date ____d/____m/200_ Interviewer initials:
2 = family / 'home' district 3 = farmland 4 = other
LETTER NUMBER
Page 178
Page 3/3 PRONUT form 4: Geography HMIS no: Y06__/__/__/__CHILD INITIALS:
7) DIRECT DROP / GPS (Main residence)7.1 DATE ____d/____m/_______y
7.2 GIVEN LIFT FROM 1 = inpatient discharge 3 = other
7.3 Description of home location:
a) Basic directions from QECH:
b) Where to leave car:
c) Approx time walking from car: mins
d) Landmarks / directions to help find house
7.4 GPS TECHNICAL Number of satellites: #
Accuracy meters
7.5 WAYPOINT NUMBER #
7.6 GPS COORDINATES
7.6.1 Elevation meters
7.6.2 South
o ' . "
7.6.3 Easto ' . "
Date ____d/____m/200_ Driver initials:
2= OTP clinic

Page 179
E.5 Socioeconomic profile
Page 1/2 PRONUT form 05: SES HMIS no:
5) Socio-economic status
1) CARERS
1.1 CARER Who is with child now / answering this questionairre?
6 = other family~ who
7 = other non-family~who
99 =DK
1.2 MAIN (usual) CARER
If main carer is not with child why not:
1.3 PARENTS1.3.1 Is mother alive? 1 = yes 0 = no 99 = DK
if mother alive but is not main carer, why not?
1.3.2 Is father alive? 1 = yes 0 = no 99 = DK
1.3.3 If both alive, are they together? 1 = yes 0 = no 99 = DK
1.4 Mother's D.O.B (if known)
1.5 If DOB not known, how old was mother when (NAME) was born
(99 = DK)
1.6 WHAT IS / WAS MAIN OCCUPATION OF: (describe AND write correct code in box)
1.6.1 Mother describe: code
1.6.2 Father describe: code
1.6.3 (Main carer - if not parent) code
Active Unemployed Inactive
1 = mlimi / ganyu 6 = worked before, seeking work 9 = never worked, not looking
2 = employee 10 = housewife
3 = family business 11 = student
4 = self-employed 12 = other
5 = employer 99 = DK
1.7 LITERACY = Can read/write ~ (use 'test' sentence to check)
1.7.1 Mother 1 = yes 0 = no 99 = DK
1.7.2 Father 1 = yes 0 = no 99 = DK
1.7.3 (MAIN Carer - if not parent) 1 = yes 0 = no 99 = DK
1.8 HIGHEST EDUCATION LEVEL ACHIEVED (write correct code in box)
1.8.1 Mother1.8.2 Father
1.8.3 (MAIN Carer - if not parent)None = 0
Primary S1 = 1 S2 = 2 S3 = 3 S4 = 4 S5 = 5 S6 = 6 S7 = 7 S8 = 8
Secondary F1 = 9 F2 = 10 F3 = 11 F4 = 12 F5 = 13 F6 = 14
Higher University / other higher = 15 other =16_______________ 99 = DK
8 = never worked before, looking
for work
1=same as in qn above
6 = neighbour
Y06__/__/__/__
1 = mother
2 = father
_______d / _______m / 19____
3 = grandmother
2 = other, from list above:
4 = aunt
5 = uncle
99 = DK
years
7 = worked before , not looking
for work

Page 180
Page 2/2
2 FAMILY SOCIOECONOMIC STATUS ~ WEALTH INDEX DHS
2.1 GENERALTenure 99 = DK
How many sleeping rooms are there? (excl. bathroom/storerooms/garage)
How many household members are there? #
(people who usually stay in the same house together; eat meals together; make provisions for food together)
2.2 HOUSEHOLD POSESSIONS & ASSETS In the dwelling is there:
1 = yes 0 = no 99 = DK
1 = yes 0 = no 99 = DK
1 = yes 0 = no 99 = DK
A motorcycle (or motorscooter) 1 = yes 0 = no 99 = DK
1 = yes 0 = no 99 = DK
1 = yes 0 = no 99 = DK
1 = yes 0 = no 99 = DK
A mosquito net 1 = yes 0 = no 99 = DK
A television 1 = yes 0 = no 99 = DK
A cellphone 1 = yes 0 = no 99 = DK
A telephone (landline) 1 = yes 0 = no 99 = DK
A bed with a mattress 1 = yes 0 = no 99 = DK
A sofa set 1 = yes 0 = no 99 = DK
A table and chair(s) 1 = yes 0 = no 99 = DK
A refrigerator 1 = yes 0 = no 99 = DK
A domestic worker not related to household head 1 = yes 0 = no 99 = DK
Do members of household work their own agricultural land? 1 = yes 0 = no 99 = DK
2.3 WATER SOURCES What is the MAIN source of drinking water for the household?
1 = piped INSIDE DU (dwelling unit) 5 = open well (SHARED/PUBLIC) 9 = surface water
2 = piped OUTSIDE DU (in yard/plot); 6 = borehole/protected well (OWN plot) (river, stream, pond, lake, dam)
3 = piped (COMMUNITY stand pipe) 7 = borehole/protected well (SHARED/PUBLIC) 10 = other
4 = open well (OWN yard / plot) 8 = from a spring 99 = DK
2.4 TOILET What is the MAIN type of toilet used by household members?
1 = own (exclusive) flush 4 = traditional pit latrine (SHARED) 7 = no facility (bush / field)
2 = shared flush toilet 5 = VIP (ventilated improved pit) latrine (OWN) 10 = other
3 = traditional pit latrine (OWN) 6 = VIP latrine (SHARED) 99 = DK
2.5 FLOORING What is the MAIN type of flooring in your dwelling?
1 = nicely finished (circle which) 2 = finished ( cement, vinyl/asphalt strips ) 10 = other
(parquet/polished wood; ceramic tiles; carpet)3 = wood or plank
4 = natural materials ( earth / sand / dung ) 99 = DK
2.6 ROOFING What is the MAIN type of roofing in your dwelling?
1 = cement 4 = iron sheets 10 = other
2 = asbestos 5 = natural materials
3 = iron and tiles 99 = DK
2.7 FUEL FOR COOKING What fuel does the household MAINLY use for cooking?
1 = electricity 4 = charcoal, coal or lignite 10 = other
2 = gas (LPG / natural gas / biogas) 5 = wood or straw
3 = paraffin / kerosene 6 = dung 99 = DK
2.8 DOMESTIC ANIMALS goats pigs cattle sheep chickens
How many of the following are owned: (0 if nil, 99 if DK)
Date ____d/____m/200__ Interviewer Initials:
An oxcartA paraffin lamp
Electricity
A bicycle
2 = rented1 = owner
A car (or truck)
3 = other
A radio
THIS REFERS TO THE HOME OF THE MAIN CARER / WHERE THE CHILD USUALLY STAYS

Page 181
E.6 OTP review
Page 1/2 PRONUT form 07: OTP Review HMIS no: Y06__/__/__/__
Child Initials:
7) OTP Review date
1) VISITS
1.1 Date originally discharged from MOYO?1.2 Which number OTP is this? (e.g 1st, 2nd, 3rd etc) visit #
2) ANTHROPOMETRY
2.1 TODAY's WEIGHT:
2.2 ?CURE: ( = target weight (>80% wt/ht) on TWO consecutive visits) 1 = yes 0 = no
2.3 ?NUTRITIONAL FAILURE ( = not cured @ 5th visit/10 weeks OTP) 1 = yes 0 = no
if no, GOTO q.3
2.4 DISCHARGE LENGTH Both repeat if: >0.7cm difference; OR if child shorter OR if grown >2cm
initials
2.4.1
2.4.2 cm
2.4.3
2.4.5 Length increase from baseline cm
2.4.6 Is baseline length likely 1 = correct 0 = incorrect
2.5 DISCHARGE MUAC Both repeat if: >0.5cm difference; OR if MUAC shrunk OR if increased >2cm
initials
2.5.1
2.5.2
2.5.4 MUAC increase from baseline cm
2.5.5 Is baseline MUAC likely 1 = correct 0 = incorrect
3) FOOD & APPETITE3.1
How many bottles were:3.1.1 Given @ last visit # pots given
3.1.2 Average number pots eaten / day # pots eaten/day
3.1.3 Left UNFINISHED # pots unfinished
if any unfinished, why:
3.1.4 IF ALL POTS eaten by child , how many days ago were they finished # days
3.1.5 Any problems eating the RUTF? 1 = yes 0 = no 99 = DK
If YES Describe:
What was done?:
Did it help?
3.2
Is (NAME) getting food from other projects / feed programme? 1 = yes 0 = no 99 = DK
If YES: 3.2.1 Details : what / from who / how much / how often?
if any YES:
MUAC 3MUAC 2MUAC 1
_____d/_____m/______y
.
length 1 length 2 length 3
checked by:
rechecked by:
FINAL LENGTH
FINAL MUAC
cm
CIRCLE HEIGHT if height rather than length measured
_____d/_____m/______y
RUTF (Ready-to-Use Therapeutic Foods)
OTHER FOODS ~ feed programmes / projects
PLEASE CHECK: 1) MUAC @ EVERY VISIT (same rules as below); 2)CD4 at 1st/2 week visit(=routine test)
Page 182
Page 2/2 PRONUT form 07: OTP Review
4) CLINICAL PROGRESS (2 week history)# days had
problem 0-14 days
Was/Is problem: 1= minor;
2= mod.
3= severe
Where did you go for
treatment? select one (or
more) from list
below
Today, is problem:
0 = all gone
1 = better;
2 = same;
3 = worse
4.1 Fever4.2 Diarrhoea
?other:
4.3 Vomiting
4.4 Abdominal pain4.5 Fast / Difficult breathing(chest problem~WITH OR WITHOUT cough)
4.6 Cough (but NO fast or difficult breathing)
4.7 Other(1)
4.8 Other (2)TREATMENTS:
0 = Did not go for any treatment 5 = from shop / marker / stall interviewer
1 = Continued MOYO treatment given @ last visit (e.g cotrim, TB, other….) 6 = from relative / friend / elder initials
2 = INPATIENT admission 7 = from traditional healer
3 = Outpatient/clinic (NOT incl. OTP today) total # visits 8 = other
4 = from pharmacy 99 = DK
5) ANY INPATIENT ADMISSIONS NOT ALREADY MENTIONED? 1 = yes 0 = no 99 = DK
if yes: dates: from to
diagnosis / details:6) ANY OTHER MEDICINES NOT ALREADY MENTIONED? 1 = yes 0 = no 99 = DK
WHAT: x per day # days
6) CLINICAL EXAMINATION
6.1 Detailed examination:~(only if problems / unwell)
6.2 DIAGNOSIS: 1 = well 2 = URTI 3 = LRTI 4 = GE 5=other
7) INVESTIGATIONS NEEDED? 0 = no
7.1 MPS (0 = neg; 1 = +; 2 = ++; 3 = +++)
7.2 PCV PCV %
7.3 OTHER(e.g CXR, mantoux)
7.4 CD 4 (routine test for HIV ® children) RESULT(%)
8) OUTCOME1= POOR ==> severe problem ideally needing readmission
if readmission needed, does carer agree: 1 = yes 0 = no details:
2= FAIR ==> problem(s), but OK for home treatment
3= GOOD/not YET cure ==>needs further review
4= GOOD/CURE ==> FOR D/C (=achieved 80% target wt on TWO consecutive visits)
5= FAILURE OF NUTRITIONAL THERAPY ( = not cured @ 5th visit/10 weeks OTP)
6= Other (e.g transfer out)
9) TTO MEDICATIONS(s) 4 = Iron
1 = cotrimoxazole 5 = other (1)
2 = ARVs started on: 6 = other (2)3 = TB meds started on: 7 = other (3)
10) FOLLOW-UP: 4 = ARV clinic - start date:~
10.1 Clinical 5 = TB clinic
(circle ALL that apply) 2 = ARV staging clinic 6 = Disability clinic: which_______________
3 = Cotrim clinic 7 = Other
10.2 SFP
Date ____d/____m/200_ Clinician initials
Note any relevant details
0 = NONE ~ no routine fup needed
1 = CONTINUE MOYO fup in 2/52
2 = yes(review of Ix ordered @ last visit)
ORS? (1 = yes / 0 = no)
1 = yes (needs today)
Details of treatment:
list antibiotics / ORS /
any other drugs (NOT incl. those given today)
( ≥ 3 abnormally loose or watery stools/24h)
↓ CLINICIAN TO COMPLETE REST OF FORM ↓
ASK RE COTRIM / TB /HIV
0 = no1 = yes: ~ which:~
0 = nil
e.g dose; duration; start date
(circle all that apply ~ incl TB/ARV etc
0 = to do today (tick when done)
In the PREVIOUS 2 WEEKS ,
did (NAME) have:
(if not had, write '0' in 1st column and leave others
blank)
99 = DK (all columns)
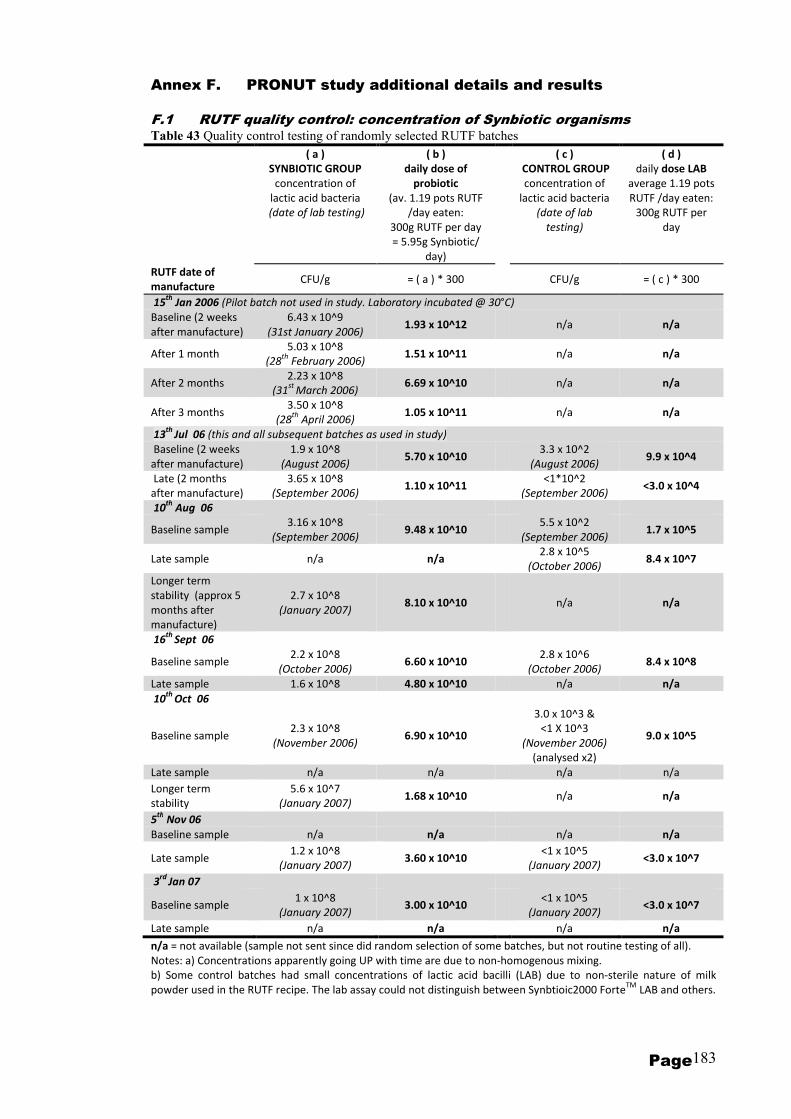
Page 183
Annex F. PRONUT study additional details and results
F.1 RUTF quality control: concentration of Synbiotic organisms Table 43 Quality control testing of randomly selected RUTF batches
( a )
SYNBIOTIC GROUP
concentration of
lactic acid bacteria
(date of lab testing)
( b )
daily dose of
probiotic
(av. 1.19 pots RUTF
/day eaten:
300g RUTF per day
= 5.95g Synbiotic/
day)
( c )
CONTROL GROUP
concentration of
lactic acid bacteria
(date of lab
testing)
( d )
daily dose LAB
average 1.19 pots
RUTF /day eaten:
300g RUTF per
day
RUTF date of
manufacture CFU/g = ( a ) * 300
CFU/g = ( c ) * 300
15th
Jan 2006 (Pilot batch not used in study. Laboratory incubated @ 30°C)
Baseline (2 weeks
after manufacture)
6.43 x 10^9
(31st January 2006) 1.93 x 10^12
n/a n/a
After 1 month 5.03 x 10^8
(28th
February 2006) 1.51 x 10^11
n/a n/a
After 2 months 2.23 x 10^8
(31st
March 2006) 6.69 x 10^10
n/a n/a
After 3 months 3.50 x 10^8
(28th
April 2006) 1.05 x 10^11
n/a n/a
13th
Jul 06 (this and all subsequent batches as used in study)
Baseline (2 weeks
after manufacture)
1.9 x 10^8
(August 2006) 5.70 x 10^10
3.3 x 10^2
(August 2006) 9.9 x 10^4
Late (2 months
after manufacture)
3.65 x 10^8
(September 2006) 1.10 x 10^11
<1*10^2
(September 2006) <3.0 x 10^4
10th
Aug 06
Baseline sample 3.16 x 10^8
(September 2006) 9.48 x 10^10
5.5 x 10^2
(September 2006) 1.7 x 10^5
Late sample n/a n/a 2.8 x 10^5
(October 2006) 8.4 x 10^7
Longer term
stability (approx 5
months after
manufacture)
2.7 x 10^8
(January 2007) 8.10 x 10^10
n/a n/a
16th
Sept 06
Baseline sample 2.2 x 10^8
(October 2006) 6.60 x 10^10
2.8 x 10^6
(October 2006) 8.4 x 10^8
Late sample 1.6 x 10^8 4.80 x 10^10 n/a n/a
10th
Oct 06
Baseline sample 2.3 x 10^8
(November 2006) 6.90 x 10^10
3.0 x 10^3 &
<1 X 10^3
(November 2006)
(analysed x2)
9.0 x 10^5
Late sample n/a n/a n/a n/a
Longer term
stability
5.6 x 10^7
(January 2007) 1.68 x 10^10
n/a n/a
5th
Nov 06
Baseline sample n/a n/a n/a n/a
Late sample 1.2 x 10^8
(January 2007) 3.60 x 10^10
<1 x 10^5
(January 2007) <3.0 x 10^7
3rd
Jan 07
Baseline sample 1 x 10^8
(January 2007) 3.00 x 10^10
<1 x 10^5
(January 2007) <3.0 x 10^7
Late sample n/a n/a n/a n/a
n/a = not available (sample not sent since did random selection of some batches, but not routine testing of all).
Notes: a) Concentrations apparently going UP with time are due to non-homogenous mixing.
b) Some control batches had small concentrations of lactic acid bacilli (LAB) due to non-sterile nature of milk
powder used in the RUTF recipe. The lab assay could not distinguish between Synbtioic2000 ForteTM
LAB and others.

Page 184
KEY:
= no concern re probio sepsis,
NO FURTHER LAB WORK-UP
NEEDED
THE
ORGANISMS
TO IDENTIFY:1) Pediococcus pentosaceus 16:1 LMG P-20608,,
= mid level concern -
STANDARD LAB CULTURES2) Lactobacillus paracasei subsp paracasei F-19 LMG P-17806
= high level concern FURTHER
LAB WORK-UP NEEDED3) Lactobacillus plantarum 2362 LMG P-20606.
4) Leuconostoc mesenteroides 23-77:1 LMG P-20607
-ve +ve
=+ve =+ve = -ve
store
sample
treat initially with standard 2nd line antibiotics -
modifications guided by clinical progress and lab
sensitivites)
IDENTIFICATION & TREATMENT STRATEGY FOR POSSIBLE PROBIOTIC-INDUCED SEPSIS IN MOYO/PAEDIATIRCS PRONUT STUDY
(ACCORDING TO
REFERENCES FROM HPA -
Health Protection Agency UK
& lab pilot, all four probio
organisms WILL grow under
standard blood culture
conditions)
(most non-probiotic
contaminants excluded
by this step)
send back to europe for possible further testing by
PCR/API to confirm whether ENDOGENOUS source or
SYNBIOTIC source
organism obvious /
could NOT be a
probio org e.g
obvious pure growth
salmonella / strep
pneumo
organism not obvious / SUSPICIOUS /
could POSSIBLY be probiotic organism
==>FURTHER CULTURE NEEDED TO
CHARACTERISE FURTHER
2nd culture of suspicious innoculum:
MRS agar culture with vancomycin (the
probio organisms WILL grow on MRS/ ALL
are vanc resistant)
data/safety monitoring committee alerted - will break
codes, check data & MAY have to halt study if any
concerns
further micro sensitivites are available from this step to
support patient care if patient still pyrexial / not
responding to initial treatment
catalase
test / gram
stain of
bacteria
from
culture
might be one of the 4 probiotic
organisms BUT could be an
endogenous lactobacillus from
patient's own GI tract
ALL IN STUDY
'SYNBIOTIC'
SICK PYREXIAL CHILD IN STUDY
(likely low numbers since probiotic-
enhanced food only starts in
rehabilitation phase, once children
more stable)
BLOOD CULTURE TAKEN & arrives in Wellcome lab
(according to CURRENT clinical criteria ==> should not be
any significant increase in numbers of cultures taken)ALL RELEVANT BLOOD CULTURES IDENTIFIED BY STICKER ON BOTTLE & FORM:
F.2 Possible probiotic sepsis laboratory protocol
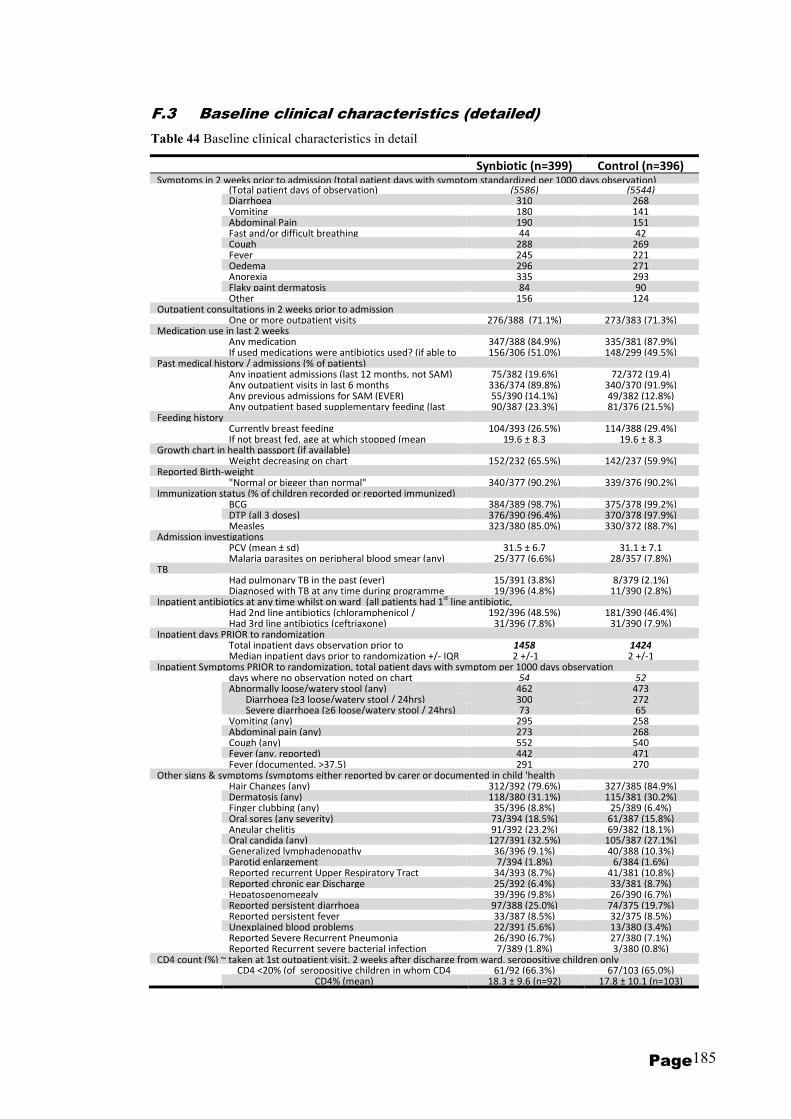
Page 185
F.3 Baseline clinical characteristics (detailed)
Table 44 Baseline clinical characteristics in detail
Synbiotic (n=399) Control (n=396) Symptoms in 2 weeks prior to admission (total patient days with symptom standardized per 1000 days observation) (Total patient days of observation) (5586) (5544) Diarrhoea 310 268 Vomiting 180 141 Abdominal Pain 190 151 Fast and/or difficult breathing 44 42 Cough 288 269 Fever 245 221 Oedema 296 271 Anorexia 335 293 Flaky paint dermatosis 84 90 Other 156 124 Outpatient consultations in 2 weeks prior to admission One or more outpatient visits 276/388 (71.1%) 273/383 (71.3%) Medication use in last 2 weeks Any medication 347/388 (84.9%) 335/381 (87.9%) If used medications were antibiotics used? (if able to 156/306 (51.0%) 148/299 (49.5%) Past medical history / admissions (% of patients) Any inpatient admissions (last 12 months, not SAM) 75/382 (19.6%) 72/372 (19.4) Any outpatient visits in last 6 months 336/374 (89.8%) 340/370 (91.9%) Any previous admissions for SAM (EVER) 55/390 (14.1%) 49/382 (12.8%) Any outpatient based supplementary feeding (last 90/387 (23.3%) 81/376 (21.5%) Feeding history Currently breast feeding 104/393 (26.5%) 114/388 (29.4%) If not breast fed, age at which stopped (mean 19.6 ± 8.3 19.6 ± 8.3 Growth chart in health passport (if available) Weight decreasing on chart 152/232 (65.5%) 142/237 (59.9%) Reported Birth-weight "Normal or bigger than normal" 340/377 (90.2%) 339/376 (90.2%) Immunization status (% of children recorded or reported immunized) BCG 384/389 (98.7%) 375/378 (99.2%) DTP (all 3 doses) 376/390 (96.4%) 370/378 (97.9%) Measles 323/380 (85.0%) 330/372 (88.7%) Admission investigations PCV (mean ± sd) 31.5 ± 6.7 31.1 ± 7.1 Malaria parasites on peripheral blood smear (any) 25/377 (6.6%) 28/357 (7.8%) TB Had pulmonary TB in the past (ever) 15/391 (3.8%) 8/379 (2.1%) Diagnosed with TB at any time during programme 19/396 (4.8%) 11/390 (2.8%) Inpatient antibiotics at any time whilst on ward (all patients had 1
st line antibiotic,
Had 2nd line antibiotics (chloramphenicol / 192/396 (48.5%) 181/390 (46.4%) Had 3rd line antibiotics (ceftriaxone) 31/396 (7.8%) 31/390 (7.9%) Inpatient days PRIOR to randomization Total inpatient days observation prior to 1458 1424 Median inpatient days prior to randomization +/- IQR 2 +/-1 2 +/-1 Inpatient Symptoms PRIOR to randomization, total patient days with symptom per 1000 days observation days where no observation noted on chart 54 52 Abnormally loose/watery stool (any) 462 473 Diarrhoea (≥3 loose/watery stool / 24hrs) 300 272 Severe diarrhoea (≥6 loose/watery stool / 24hrs) 73 65 Vomiting (any) 295 258 Abdominal pain (any) 273 268 Cough (any) 552 540 Fever (any, reported) 442 471 Fever (documented, >37.5) 291 270 Other signs & symptoms (symptoms either reported by carer or documented in child 'health Hair Changes (any) 312/392 (79.6%) 327/385 (84.9%) Dermatosis (any) 118/380 (31.1%) 115/381 (30.2%) Finger clubbing (any) 35/396 (8.8%) 25/389 (6.4%) Oral sores (any severity) 73/394 (18.5%) 61/387 (15.8%) Angular chelitis 91/392 (23.2%) 69/382 (18.1%) Oral candida (any) 127/391 (32.5%) 105/387 (27.1%) Generalized lymphadenopathy 36/396 (9.1%) 40/388 (10.3%) Parotid enlargement 7/394 (1.8%) 6/384 (1.6%) Reported recurrent Upper Respiratory Tract 34/393 (8.7%) 41/381 (10.8%) Reported chronic ear Discharge 25/392 (6.4%) 33/381 (8.7%) Hepatospenomegaly 39/396 (9.8%) 26/390 (6.7%) Reported persistent diarrhoea 97/388 (25.0%) 74/375 (19.7%) Reported persistent fever 33/387 (8.5%) 32/375 (8.5%) Unexplained blood problems 22/391 (5.6%) 13/380 (3.4%) Reported Severe Recurrent Pneumonia 26/390 (6.7%) 27/380 (7.1%) Reported Recurrent severe bacterial infection 7/389 (1.8%) 3/380 (0.8%) CD4 count (%) ~ taken at 1st outpatient visit, 2 weeks after discharge from ward, seropositive children only CD4 <20% (of seropositive children in whom CD4 61/92 (66.3%) 67/103 (65.0%) CD4% (mean) 18.3 ± 9.6 (n=92) 17.8 ± 10.1 (n=103)
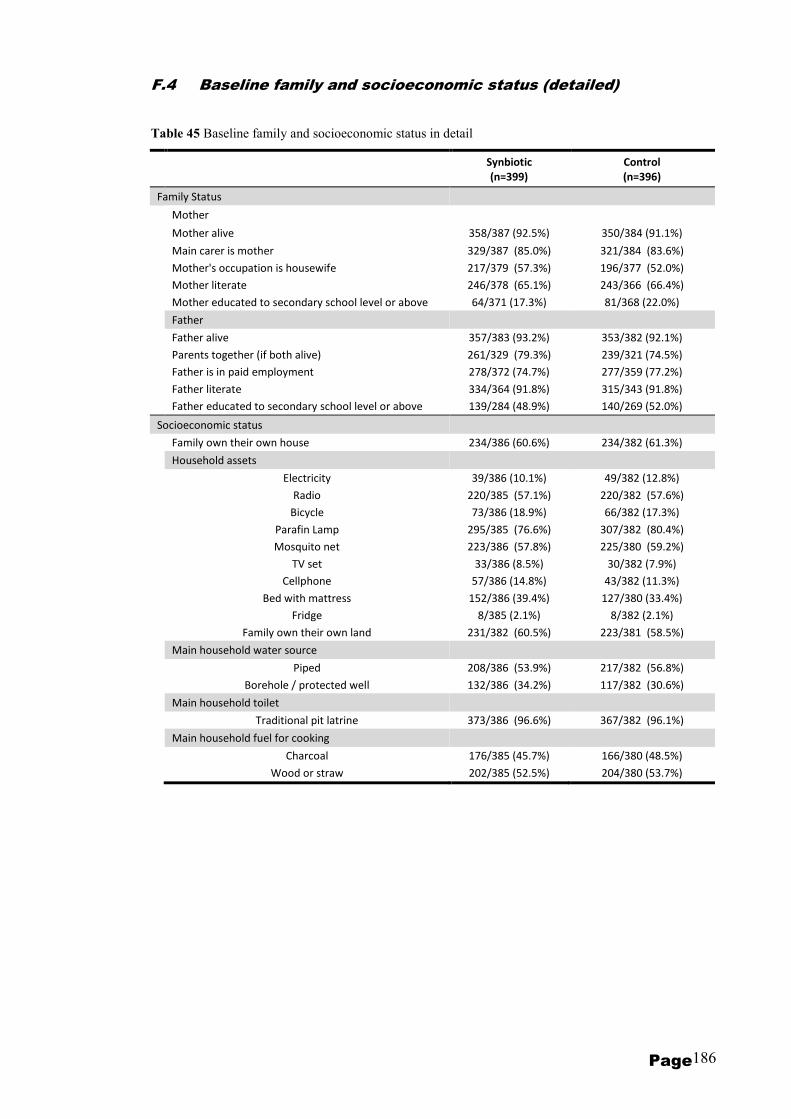
Page 186
F.4 Baseline family and socioeconomic status (detailed)
Table 45 Baseline family and socioeconomic status in detail
Synbiotic
(n=399)
Control
(n=396)
Family Status
Mother
Mother alive 358/387 (92.5%) 350/384 (91.1%)
Main carer is mother 329/387 (85.0%) 321/384 (83.6%)
Mother's occupation is housewife 217/379 (57.3%) 196/377 (52.0%)
Mother literate 246/378 (65.1%) 243/366 (66.4%)
Mother educated to secondary school level or above 64/371 (17.3%) 81/368 (22.0%)
Father
Father alive 357/383 (93.2%) 353/382 (92.1%)
Parents together (if both alive) 261/329 (79.3%) 239/321 (74.5%)
Father is in paid employment 278/372 (74.7%) 277/359 (77.2%)
Father literate 334/364 (91.8%) 315/343 (91.8%)
Father educated to secondary school level or above 139/284 (48.9%) 140/269 (52.0%)
Socioeconomic status
Family own their own house 234/386 (60.6%) 234/382 (61.3%)
Household assets
Electricity 39/386 (10.1%) 49/382 (12.8%)
Radio 220/385 (57.1%) 220/382 (57.6%)
Bicycle 73/386 (18.9%) 66/382 (17.3%)
Parafin Lamp 295/385 (76.6%) 307/382 (80.4%)
Mosquito net 223/386 (57.8%) 225/380 (59.2%)
TV set 33/386 (8.5%) 30/382 (7.9%)
Cellphone 57/386 (14.8%) 43/382 (11.3%)
Bed with mattress 152/386 (39.4%) 127/380 (33.4%)
Fridge 8/385 (2.1%) 8/382 (2.1%)
Family own their own land 231/382 (60.5%) 223/381 (58.5%)
Main household water source
Piped 208/386 (53.9%) 217/382 (56.8%)
Borehole / protected well 132/386 (34.2%) 117/382 (30.6%)
Main household toilet
Traditional pit latrine 373/386 (96.6%) 367/382 (96.1%)
Main household fuel for cooking
Charcoal 176/385 (45.7%) 166/380 (48.5%)
Wood or straw 202/385 (52.5%) 204/380 (53.7%)
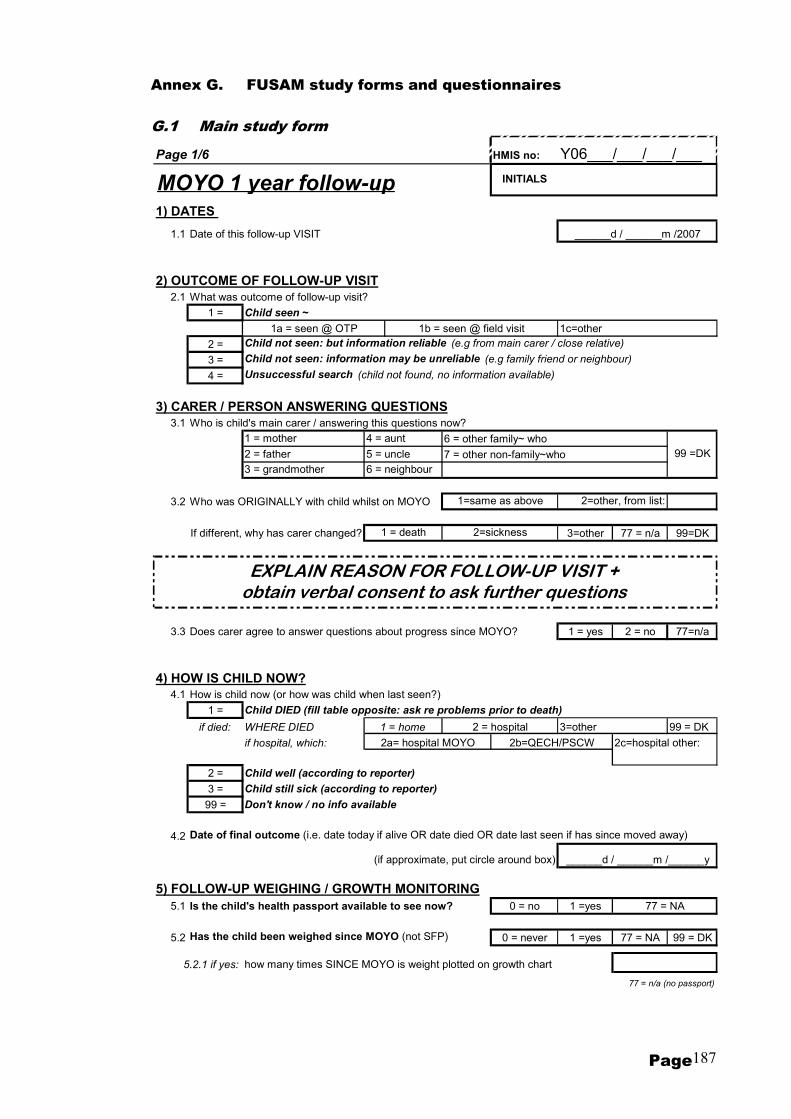
Page 187
Annex G. FUSAM study forms and questionnaires
G.1 Main study form
Page 1/6 HMIS no: Y06___/___/___/___
1) DATES
1.1 Date of this follow-up VISIT
2) OUTCOME OF FOLLOW-UP VISIT2.1 What was outcome of follow-up visit?
1 = Child seen ~
1c=other
2 = Child not seen: but information reliable (e.g from main carer / close relative)
3 = Child not seen: information may be unreliable (e.g family friend or neighbour)
4 = Unsuccessful search (child not found, no information available)
3) CARER / PERSON ANSWERING QUESTIONS3.1 Who is child's main carer / answering this questions now?
6 = other family~ who
7 = other non-family~who
3.2 Who was ORIGINALLY with child whilst on MOYO
If different, why has carer changed? 3=other 77 = n/a 99=DK
3.3 Does carer agree to answer questions about progress since MOYO? 1 = yes 2 = no 77=n/a
4) HOW IS CHILD NOW?4.1 How is child now (or how was child when last seen?)
1 = Child DIED (fill table opposite: ask re problems prior to death)
if died: 3=other 99 = DK
2c=hospital other:
2 = Child well (according to reporter)
3 = Child still sick (according to reporter)
99 = Don't know / no info available
4.2 Date of final outcome (i.e. date today if alive OR date died OR date last seen if has since moved away)
(if approximate, put circle around box)
5) FOLLOW-UP WEIGHING / GROWTH MONITORING5.1 Is the child's health passport available to see now? 0 = no 1 =yes
5.2 Has the child been weighed since MOYO (not SFP) 0 = never 1 =yes 77 = NA 99 = DK
5.2.1 if yes: how many times SINCE MOYO is weight plotted on growth chart
4 = aunt
77 = n/a (no passport)
INITIALS
______d / ______m /2007
______d / ______m /______y
99 =DK
2 = hospital
2a= hospital MOYO 2b=QECH/PSCW
2=other, from list:1=same as above
1a = seen @ OTP 1b = seen @ field visit
1 = mother
3 = grandmother
WHERE DIED
if hospital, which:
2 = father
1 = home
5 = uncle
6 = neighbour
1 = death 2=sickness
MOYO 1 year follow-up
77 = NA
EXPLAIN REASON FOR FOLLOW-UP VISIT + obtain verbal consent to ask further questions
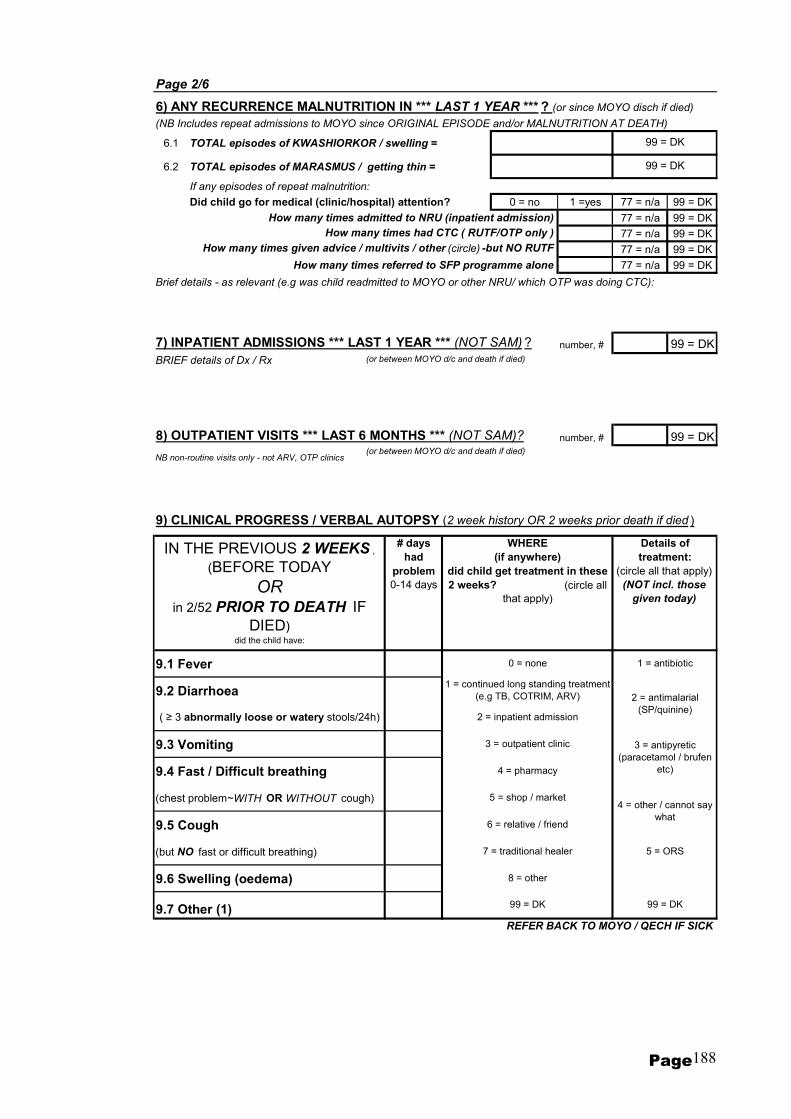
Page 188
Page 2/6
6) ANY RECURRENCE MALNUTRITION IN *** LAST 1 YEAR *** ? (or since MOYO disch if died)
(NB Includes repeat admissions to MOYO since ORIGINAL EPISODE and/or MALNUTRITION AT DEATH)
6.1 TOTAL episodes of KWASHIORKOR / swelling =
6.2 TOTAL episodes of MARASMUS / getting thin =
If any episodes of repeat malnutrition:
Did child go for medical (clinic/hospital) attention? 0 = no 1 =yes 77 = n/a 99 = DK
How many times admitted to NRU (inpatient admission) 77 = n/a 99 = DK
How many times had CTC ( RUTF/OTP only ) 77 = n/a 99 = DK
How many times given advice / multivits / other (circle) -but NO RUTF 77 = n/a 99 = DK
How many times referred to SFP programme alone 77 = n/a 99 = DK
Brief details - as relevant (e.g was child readmitted to MOYO or other NRU/ which OTP was doing CTC):
7) INPATIENT ADMISSIONS *** LAST 1 YEAR *** (NOT SAM) ? number, # 99 = DK
BRIEF details of Dx / Rx (or between MOYO d/c and death if died)
8) OUTPATIENT VISITS *** LAST 6 MONTHS *** (NOT SAM)? number, # 99 = DK
NB non-routine visits only - not ARV, OTP clinics(or between MOYO d/c and death if died)
9) CLINICAL PROGRESS / VERBAL AUTOPSY (2 week history OR 2 weeks prior death if died )
# days had
problem 0-14 days
9.1 Fever
9.2 Diarrhoea
9.3 Vomiting
9.4 Fast / Difficult breathing
(chest problem~WITH OR WITHOUT cough)
9.5 Cough
(but NO fast or difficult breathing)
9.6 Swelling (oedema)
9.7 Other (1)REFER BACK TO MOYO / QECH IF SICK
4 = pharmacy
1 = antibiotic
Details of treatment:
(circle all that apply)
(NOT incl. those
given today)
99 = DK
99 = DK
0 = none
1 = continued long standing treatment
(e.g TB, COTRIM, ARV)
3 = outpatient clinic
2 = inpatient admission
IN THE PREVIOUS 2 WEEKS ,
(BEFORE TODAY
OR in 2/52 PRIOR TO DEATH IF
DIED) did the child have:
( ≥ 3 abnormally loose or watery stools/24h)
WHERE (if anywhere)
did child get treatment in these 2 weeks? (circle all
that apply)
99 = DK
5 = shop / market
6 = relative / friend
7 = traditional healer
8 = other
2 = antimalarial
(SP/quinine)
3 = antipyretic
(paracetamol / brufen
etc)
4 = other / cannot say
what
5 = ORS
99 = DK

Page 189
Page 3/6 MOYO 1 YEAR follow-up: Initials HMIS no: Y06___/___/___/___
10) TB medication
10.1 TB ever? 0 = no 99=DK
10.2 How many months did child have treatment for? # months 77 = n/a 99=DK
10.3 If TB, were other children in family screened or treated 0 = no 1 = yes 77 = n/a 99 =DK
10.4 "Any problems with the treatment?" and/or "Why did child not have full 6 months treatment"
30 = died<6m 99 = DK
11) SFP
11.1 # months 99=DK
11.2 Which SFP did child go to (if did not go, which was nearest)
11.3 "Any problems with the treatment?" and/or "Why did child not have full 4 months SFP"
30 = died<4m 99 = DK
12) COMMUNITY FOOD RATIONS (other than SFP ) *** in your area *** in past year *** ?
12.1 Aside from SFP (above), were any other organizations offering food rations in your area?
0 = no, not aware of any 2 = yes, available, went, & told that child not eligible
1 = yes, food is available but child did not go 3 = yes, available, went AND received food
13) ACTIVITY LEVEL (usual - before illness that led to death if died)
99=DK
14) FEEDING PRACTICES
14.1 Is (oe was) child still breast feeding? 0 = noIf NO: age when
stopped:99 = DK
14.2 Did you attend any health / nutrition education sessions whilst on MOYO 0 = no 1 = yes 99 = DK
14.3 Did you feed your children differently after being on MOYO? 0 = no 1 = yes 99 = DK
if yes, describe (no prompts):
14.4 How many food groups are there?
14.5 What Breast Feeding advice would you give to a new mother in your area:
~ Babies can be given other liquids (e.g water, teas, juices) alongside BF from ~ months
~ Babies can be given other solid foods (e.g porridge, nsima) alongside BF from ~ months
~ Ideally,a baby should BF until he/she is: _____years months 99 = DK
~ If a mother is HIV +ve, when should she stop to BF her child completely?
stop: months
How many months did child attend SFP for? (1 visit only=0.5m)
1=minimal activity 0=in bed all day
2 = started on MOYO ward /OTP 3 = start after MOYO OTP
3 = normal 2=some restriction
31 = still taking
32=not referred
Describe problem:
0 = no problems
Describe problem:
1=chakudya chokhutitsa? 2=chakudya chochokera ku nyama? 3=mafuta? 4=zipatso? 5=masamba?6=gulu la nyemba // 99=knows none
0 = should not BF at all
0 = no problems
1 = yes (in last
24hrs)
name them (circle each group named - no prompts)
66=as long as possible
99 = DK / cannot say
by years
1 = pre-MOYO
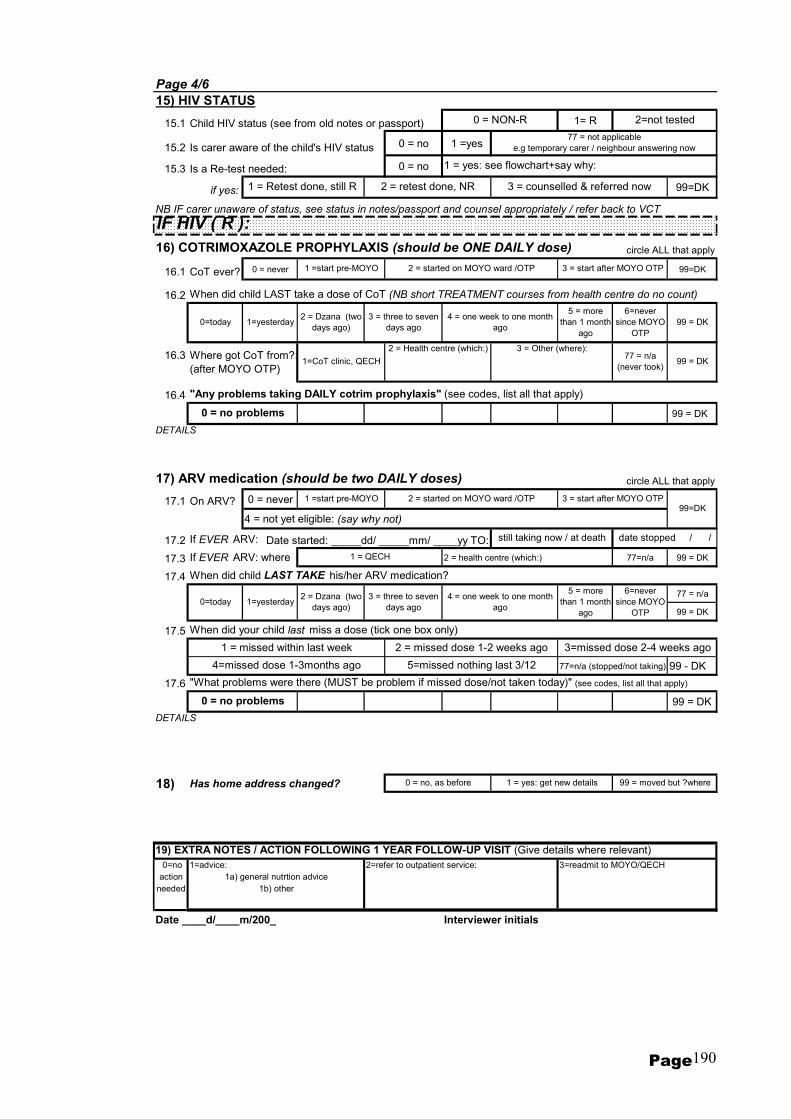
Page 190
Page 4/6
15) HIV STATUS
15.1 Child HIV status (see from old notes or passport) 1= R
15.2 Is carer aware of the child's HIV status 0 = no 1 =yes
15.3 Is a Re-test needed: 0 = no
if yes: 99=DK
NB IF carer unaware of status, see status in notes/passport and counsel appropriately / refer back to VCT
IF HIV ( R ):
16) COTRIMOXAZOLE PROPHYLAXIS (should be ONE DAILY dose) circle ALL that apply
16.1 CoT ever? 0 = never 99=DK
16.2 When did child LAST take a dose of CoT (NB short TREATMENT courses from health centre do no count)
16.3 Where got CoT from?:
(after MOYO OTP)
16.4 "Any problems taking DAILY cotrim prophylaxis" (see codes, list all that apply)
99 = DK
17) ARV medication (should be two DAILY doses) circle ALL that apply
17.1 On ARV? 0 = never
4 = not yet eligible: (say why not)
17.2 If EVER ARV: Date started: _____dd/ _____mm/ ____yy TO:
17.3 If EVER ARV: where 2 = health centre (which:) 77=n/a 99 = DK
17.4 When did child LAST TAKE his/her ARV medication?
77 = n/a
99 = DK
17.5 When did your child last miss a dose (tick one box only)
77=n/a (stopped/not taking) 99 - DK
17.6 "What problems were there (MUST be problem if missed dose/not taken today)" (see codes, list all that apply)
99 = DK
18) Has home address changed?
19) EXTRA NOTES / ACTION FOLLOWING 1 YEAR FOLLOW-UP VISIT (Give details where relevant)
0=no 1=advice: 2=refer to outpatient service: 3=readmit to MOYO/QECH
action
needed
Date ____d/____m/200_ Interviewer initials
1 = Retest done, still R
2 = started on MOYO ward /OTP 3 = start after MOYO OTP
DETAILS
2 = started on MOYO ward /OTP
1 = yes: get new details 99 = moved but ?where0 = no, as before
1 =start pre-MOYO 3 = start after MOYO OTP
still taking now / at death date stopped / /
1a) general nutrtion advice
1b) other
77 = not applicable
e.g temporary carer / neighbour answering now
1 = yes: see flowchart+say why:
1 =start pre-MOYO
3 = counselled & referred now2 = retest done, NR
0 = NON-R 2=not tested
DETAILS
1 = missed within last week
5=missed nothing last 3/12
3=missed dose 2-4 weeks ago
4=missed dose 1-3months ago
2 = missed dose 1-2 weeks ago
0=today
4 = one week to one month
ago
5 = more
than 1 month
ago
0 = no problems
1=yesterday
99 = DK
0=today 1=yesterday
6=never
since MOYO
OTP
2 = Dzana (two
days ago)
3 = three to seven
days ago
0 = no problems
1 = QECH
99=DK
1=CoT clinic, QECH
2 = Health centre (which:) 3 = Other (where):77 = n/a
(never took)
2 = Dzana (two
days ago)
6=never
since MOYO
OTP
99 = DK
5 = more
than 1 month
ago
4 = one week to one month
ago
3 = three to seven
days ago
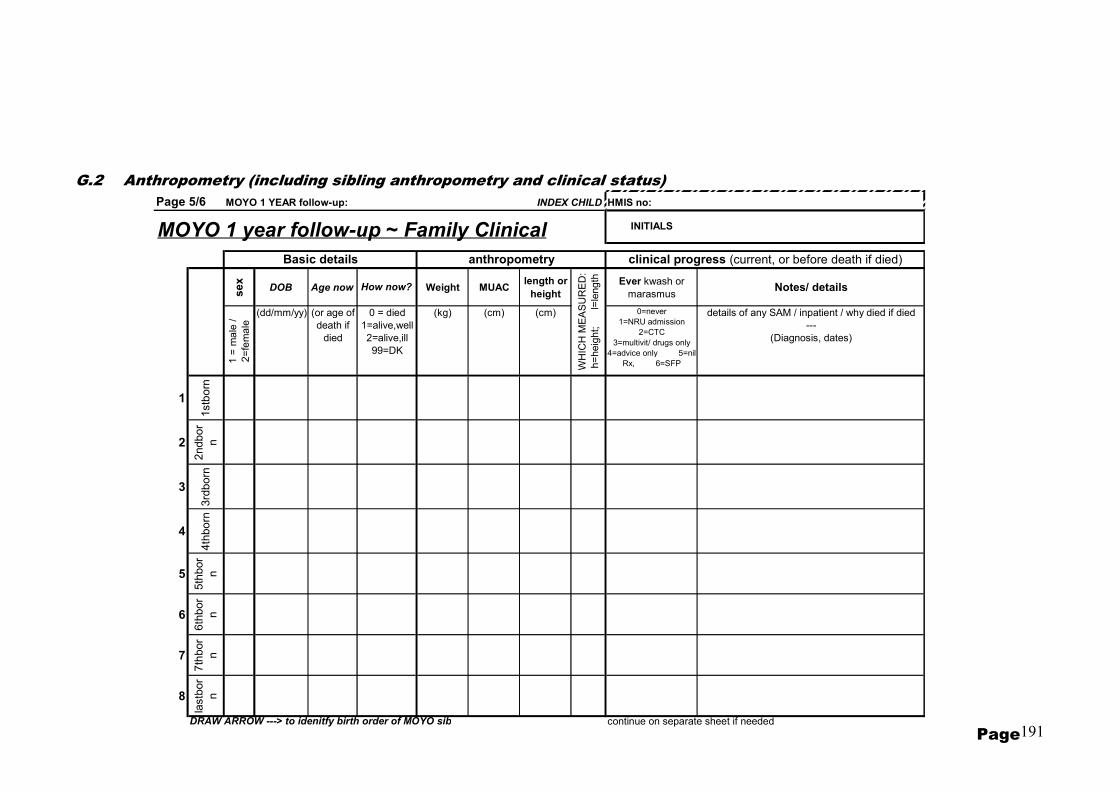
Page 191
Page 5/6 MOYO 1 YEAR follow-up: INDEX CHILD HMIS no:
MOYO 1 year follow-up ~ Family Clinicalse
x
DOB Age now Weight MUAClength or
heightEver kwash or
marasmus Notes/ details
1 =
ma
le /
2=
fem
ale
(dd/mm/yy) (or age of
death if
died
(kg) (cm) (cm) 0=never
1=NRU admission
2=CTC
3=multivit/ drugs only
4=advice only 5=nil
Rx, 6=SFP
details of any SAM / inpatient / why died if died
---
(Diagnosis, dates)
1
1stb
orn
2
2ndbor
n
3
3rd
born
4
4th
born
5
5th
bor
n
6
6th
bor
n
7
7th
bor
n
8
lastb
or
n
DRAW ARROW ---> to idenitfy birth order of MOYO sib continue on separate sheet if needed
Basic details
0 = died
1=alive,well
2=alive,ill
99=DK
INITIALS
How now?
anthropometry clinical progress (current, or before death if died)
WH
ICH
ME
AS
UR
ED
:
h=
heig
ht;
l=
length
G.2 Anthropometry (including sibling anthropometry and clinical status)

Page 192
Page 6/6 MOYO 1 YEAR follow-up: Y06___/___/___/___index child HMIS no:
MOYO 1 year follow-up ~ FAMILY HCT TESTSTested
(stamp)
If tested,
when
If not
testedPASSPORT: 0=NR stamp
----
1=R stamp
----
2=no stamp
seen
----
3=passport
n/a
1=pre-
MOYO
---
2=@MOYO
---
3=after
MOYO D/C
WHY NOT?
(see code sheet)
+ write in
"NOTES"
On COT? 0=never
1=occ
2=daily
3=was taking,
but now
stopped
On ARV ? 0=no
----- 1=yes
--------
2=waiting list
------
3=not eligible
------
4=started, but
now stopped
Notes e.g. details of PMTCT / reason for not testing - if
unable to code accurately
~~~~
also document any differences between test result
reported and that written in passport
~~~~~
when MOTHER started ARV if she is taking
4.1 Mother
4.2 Father
4.3
Carer (if not mum or
dad)
4.41stborn
4.52ndborn
4.63rdborn
4.74thborn
4.85thborn
4.96thborn
4.107thborn
4.11lastborn
DRAW ARROW ---> to idenitfy birth order of MOYO sib NB WHY NOT ~ write in text AND (if possible) code from sheet
if tested ( R ) IS (or WAS) the family member:
INITIALS
any PMTCT @ birth? 0=no
1=HIV test for
mum only
2=HIV test
mum+baby
3=HIV
test+single
dose ARV drug
4=other
99=dk.
Tested for
HIV?
REPORTED: 0=tested~NR
---
1=tested~R
---
2=never
tested
---
99=DK
G.3 HIV status and testing
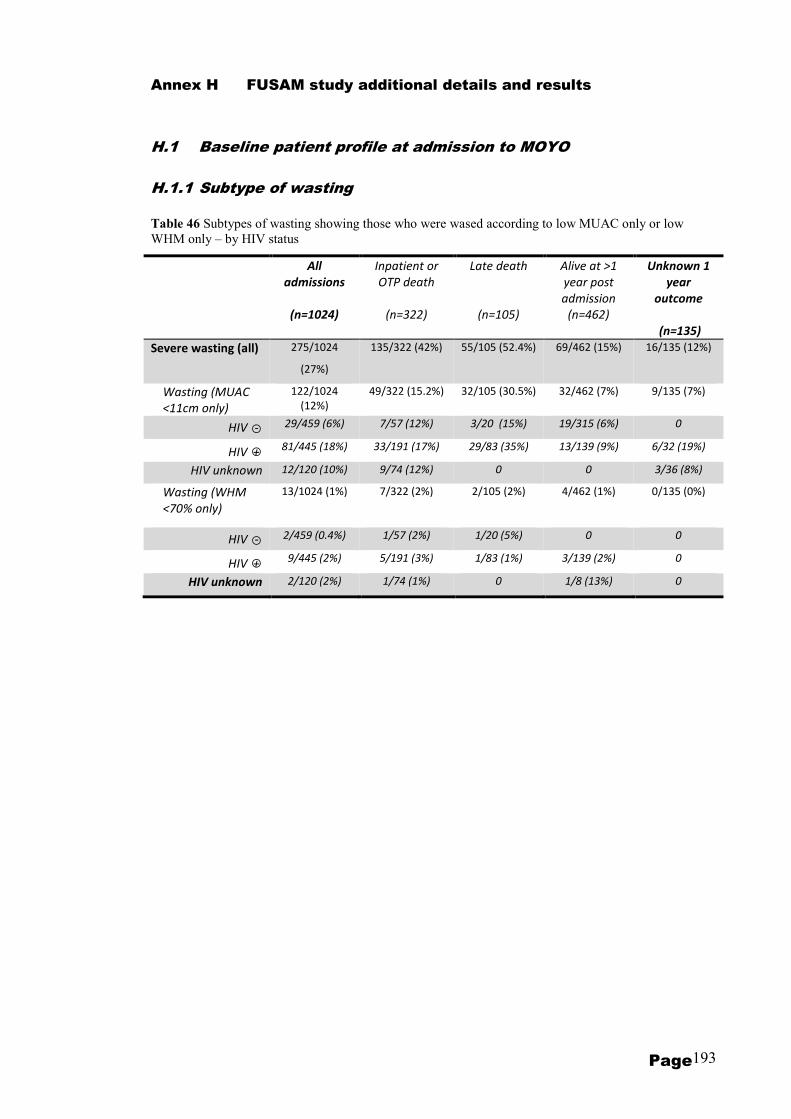
Page 193
Annex H FUSAM study additional details and results
H.1 Baseline patient profile at admission to MOYO
H.1.1 Subtype of wasting
Table 46 Subtypes of wasting showing those who were wased according to low MUAC only or low
WHM only – by HIV status
All
admissions
(n=1024)
Inpatient or
OTP death
(n=322)
Late death
(n=105)
Alive at >1
year post
admission
(n=462)
Unknown 1
year
outcome
(n=135)
Severe wasting (all) 275/1024
(27%)
135/322 (42%) 55/105 (52.4%) 69/462 (15%) 16/135 (12%)
Wasting (MUAC
<11cm only)
122/1024
(12%)
49/322 (15.2%) 32/105 (30.5%) 32/462 (7%) 9/135 (7%)
HIV ○- 29/459 (6%) 7/57 (12%) 3/20 (15%) 19/315 (6%) 0
HIV ○+ 81/445 (18%) 33/191 (17%) 29/83 (35%) 13/139 (9%) 6/32 (19%)
HIV unknown 12/120 (10%) 9/74 (12%) 0 0 3/36 (8%)
Wasting (WHM
<70% only)
13/1024 (1%) 7/322 (2%) 2/105 (2%)
4/462 (1%) 0/135 (0%)
HIV ○- 2/459 (0.4%) 1/57 (2%) 1/20 (5%) 0 0
HIV ○+ 9/445 (2%) 5/191 (3%) 1/83 (1%) 3/139 (2%) 0
HIV unknown 2/120 (2%) 1/74 (1%) 0 1/8 (13%) 0
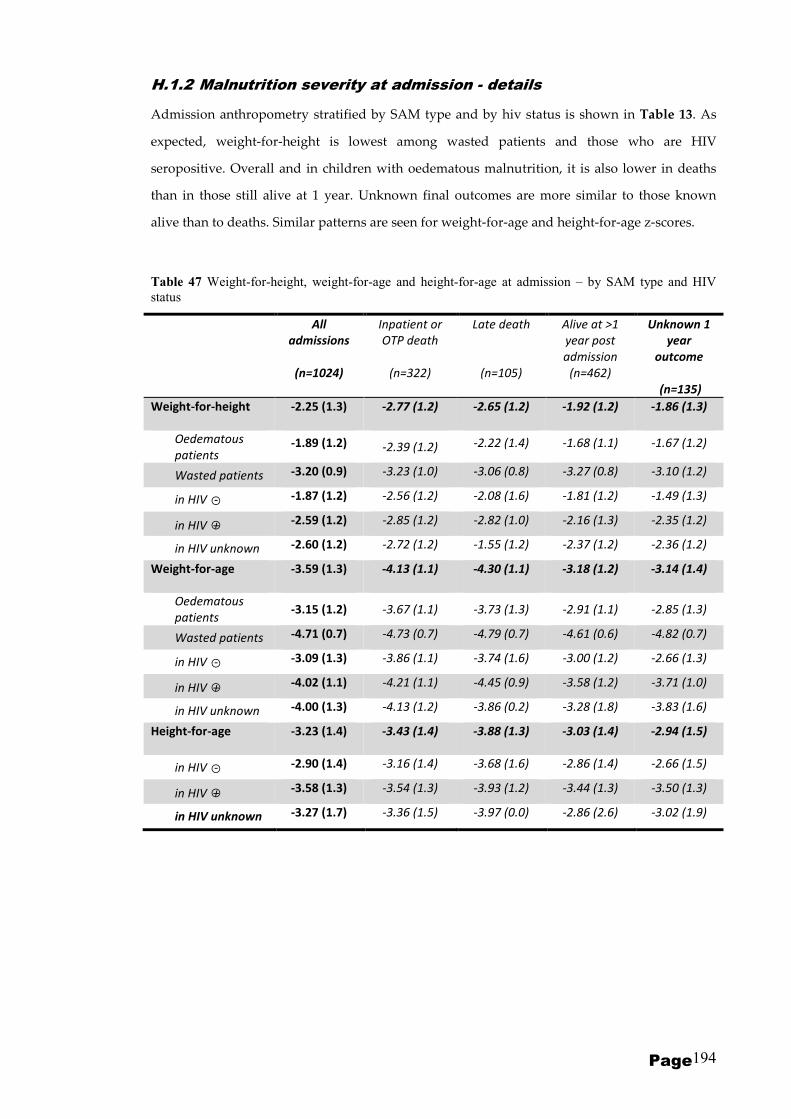
Page 194
H.1.2 Malnutrition severity at admission - details
Admission anthropometry stratified by SAM type and by hiv status is shown in Table 13. As
expected, weight-for-height is lowest among wasted patients and those who are HIV
seropositive. Overall and in children with oedematous malnutrition, it is also lower in deaths
than in those still alive at 1 year. Unknown final outcomes are more similar to those known
alive than to deaths. Similar patterns are seen for weight-for-age and height-for-age z-scores.
Table 47 Weight-for-height, weight-for-age and height-for-age at admission – by SAM type and HIV
status
All
admissions
(n=1024)
Inpatient or
OTP death
(n=322)
Late death
(n=105)
Alive at >1
year post
admission
(n=462)
Unknown 1
year
outcome
(n=135)
Weight-for-height -2.25 (1.3) -2.77 (1.2) -2.65 (1.2) -1.92 (1.2) -1.86 (1.3)
Oedematous
patients -1.89 (1.2) -2.39 (1.2) -2.22 (1.4) -1.68 (1.1) -1.67 (1.2)
Wasted patients -3.20 (0.9) -3.23 (1.0) -3.06 (0.8) -3.27 (0.8) -3.10 (1.2)
in HIV ○- -1.87 (1.2) -2.56 (1.2) -2.08 (1.6) -1.81 (1.2) -1.49 (1.3)
in HIV ○+ -2.59 (1.2) -2.85 (1.2) -2.82 (1.0) -2.16 (1.3) -2.35 (1.2)
in HIV unknown -2.60 (1.2) -2.72 (1.2) -1.55 (1.2) -2.37 (1.2) -2.36 (1.2)
Weight-for-age -3.59 (1.3) -4.13 (1.1) -4.30 (1.1) -3.18 (1.2) -3.14 (1.4)
Oedematous
patients -3.15 (1.2) -3.67 (1.1) -3.73 (1.3) -2.91 (1.1) -2.85 (1.3)
Wasted patients -4.71 (0.7) -4.73 (0.7) -4.79 (0.7) -4.61 (0.6) -4.82 (0.7)
in HIV ○- -3.09 (1.3) -3.86 (1.1) -3.74 (1.6) -3.00 (1.2) -2.66 (1.3)
in HIV ○+ -4.02 (1.1) -4.21 (1.1) -4.45 (0.9) -3.58 (1.2) -3.71 (1.0)
in HIV unknown -4.00 (1.3) -4.13 (1.2) -3.86 (0.2) -3.28 (1.8) -3.83 (1.6)
Height-for-age -3.23 (1.4) -3.43 (1.4) -3.88 (1.3) -3.03 (1.4) -2.94 (1.5)
in HIV ○- -2.90 (1.4) -3.16 (1.4) -3.68 (1.6) -2.86 (1.4) -2.66 (1.5)
in HIV ○+ -3.58 (1.3) -3.54 (1.3) -3.93 (1.2) -3.44 (1.3) -3.50 (1.3)
in HIV unknown -3.27 (1.7) -3.36 (1.5) -3.97 (0.0) -2.86 (2.6) -3.02 (1.9)
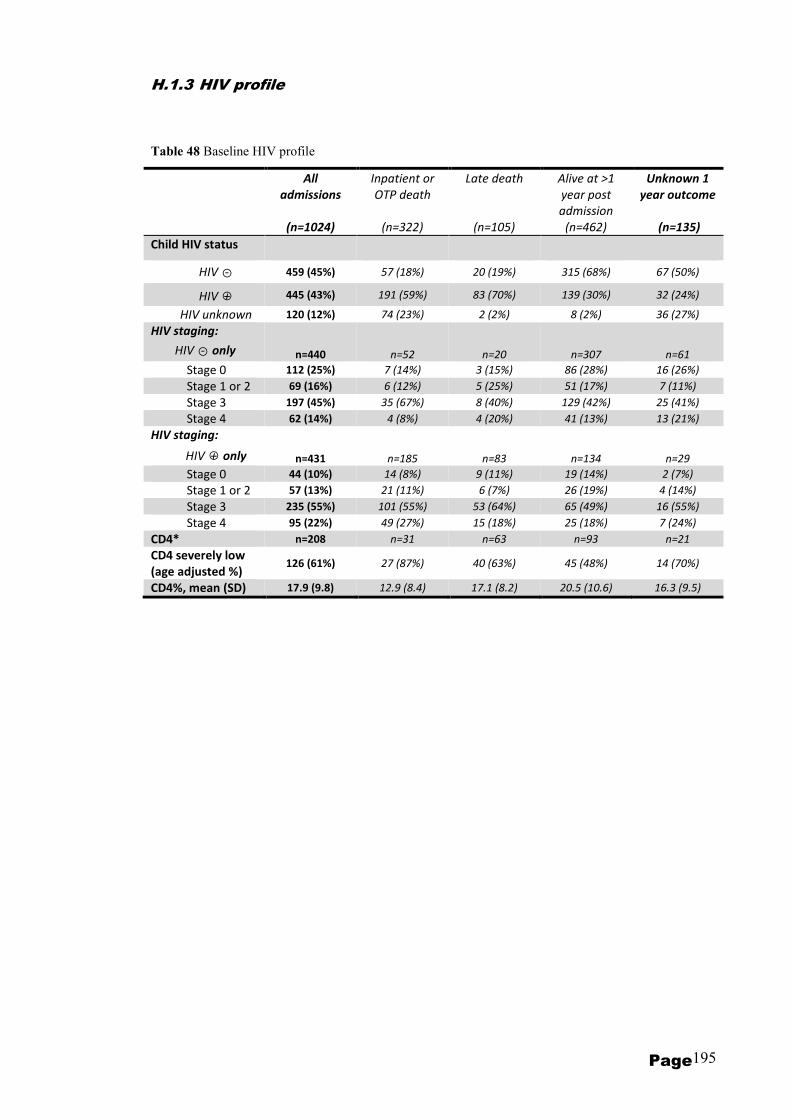
Page 195
H.1.3 HIV profile
Table 48 Baseline HIV profile
All
admissions
(n=1024)
Inpatient or
OTP death
(n=322)
Late death
(n=105)
Alive at >1
year post
admission
(n=462)
Unknown 1
year outcome
(n=135)
Child HIV status
HIV ○- 459 (45%) 57 (18%) 20 (19%) 315 (68%) 67 (50%)
HIV ○+ 445 (43%) 191 (59%) 83 (70%) 139 (30%) 32 (24%)
HIV unknown 120 (12%) 74 (23%) 2 (2%) 8 (2%) 36 (27%)
HIV staging:
HIV ○- only n=440 n=52 n=20 n=307 n=61
Stage 0 112 (25%) 7 (14%) 3 (15%) 86 (28%) 16 (26%)
Stage 1 or 2 69 (16%) 6 (12%) 5 (25%) 51 (17%) 7 (11%)
Stage 3 197 (45%) 35 (67%) 8 (40%) 129 (42%) 25 (41%)
Stage 4 62 (14%) 4 (8%) 4 (20%) 41 (13%) 13 (21%)
HIV staging:
HIV ○+ only n=431 n=185 n=83 n=134 n=29
Stage 0 44 (10%) 14 (8%) 9 (11%) 19 (14%) 2 (7%)
Stage 1 or 2 57 (13%) 21 (11%) 6 (7%) 26 (19%) 4 (14%)
Stage 3 235 (55%) 101 (55%) 53 (64%) 65 (49%) 16 (55%)
Stage 4 95 (22%) 49 (27%) 15 (18%) 25 (18%) 7 (24%)
CD4* n=208 n=31 n=63 n=93 n=21
CD4 severely low
(age adjusted %) 126 (61%) 27 (87%) 40 (63%) 45 (48%) 14 (70%)
CD4%, mean (SD) 17.9 (9.8) 12.9 (8.4) 17.1 (8.2) 20.5 (10.6) 16.3 (9.5)

Page 196
H.1.4 Clinical profile
Table 49 Baseline clinical profile in full
All
admissions
(n=1024)
Inpatient or
OTP death
(n=322)
Late death
(n=105)
Alive at >1
year post
admission
(n=462)
Unknown 1
year outcome
(n=135)
Symptoms in previous 2 weeks
Any 959/980 (98%) 309/311 (99%) 102/105 (97%) 447/460 (97%) 101/104 (97%)
Fever 637/979 (65%) 205/311 (66%) 73/104 (70%) 293/458 (64%) 66/106 (62%)
Diarrhoea 647/977 (66%) 231/310 (75%) 72/105 (69%) 280/456 (61%) 64/106 (60%)
Vomiting 450/982 (46%) 163/313 (52%) 42/105 (40%) 203/458 (44%) 42/106 (40%)
Abdominal
pain 377/923 (41%) 123/269 (46%) 37/104 (36%) 188/452 (42%) 29/98 (30%)
Fast or
difficult
breathing
143/970 (15%) 45/303 (15%) 20/104 (19%) 62/457 (14%) 16/106 (15%)
Cough 580/977 (59%) 193/308 (63%) 76/105 (72%) 254/459 (55%) 57/105 (54%)
Anorexia 503/953 (53%) 169/294 (57%) 51/104 (49%) 230/454 (51%) 53/101 (52%)
Flaky paint
dematosis 174/967 (18%) 49/306 (16%) 14/104 (13%) 89/452 (20%) 22/105 (21%)
Other 238/977 (24%) 84/314 (27%) 34/104 (33%) 101/454 (22%) 19/105 (18%)
Outpatient consultations in 2 weeks prior to admission (any)
Any 658/928 (71%) 204/271 (75%) 68/102 (67%) 318/456 (70%) 68/99 (69%)
Medication use in 2 weeks prior to admission
Any 843/951 (89%) 264/296 (89%) 95/103 (92%) 394/450 (88%) 90/102 (88%)
Anaemia
Any (PCV<30) 320/914 (35%) 103/294 (35%) 39/96 (41%) 141/424 (33%) 37/100 (37%)
Severe (PCV <15) 18/914 (2%) 11/294 (4%) 1/96 (1%) 5/424 (1%) 1/100 (1%)
Malaria
(+ve thick blood
film on admission)
37/898 (4%) 9/292 (3%) 3/94 (3%) 21/415 (5%) 4/97 (4%)
Has traditional
medicine amulet or
charm
245/905 (27%) 87/266 (32%) 25/100 (25%) 108/444 (24%) 25/95 (26%)
Breastfed
(<2 year olds only) 253/557 (45%) 102/192 (53%) 47/69 (68%) 79/243 (33%) 25/53 (53%)
Disability
(any) 60/938 (6%) 24/282 (9%) 9/102 (9%) 22/453 (5%) 5/101 (5%)
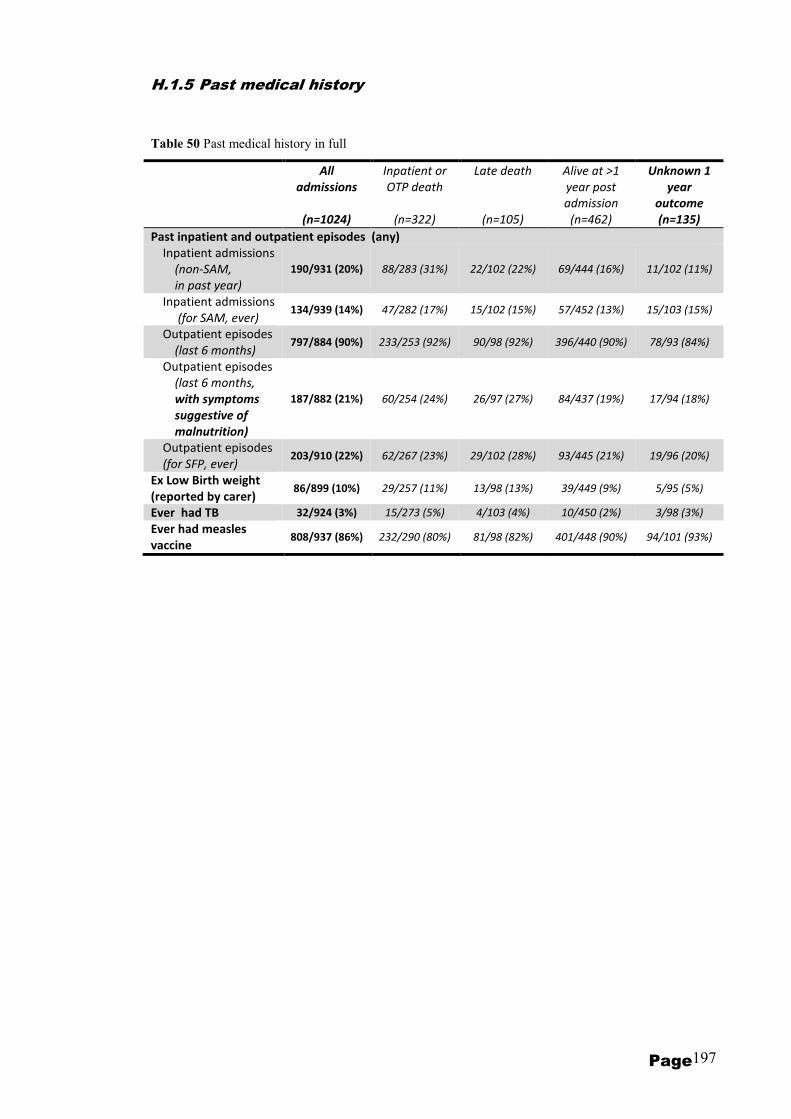
Page 197
H.1.5 Past medical history
Table 50 Past medical history in full
All
admissions
(n=1024)
Inpatient or
OTP death
(n=322)
Late death
(n=105)
Alive at >1
year post
admission
(n=462)
Unknown 1
year
outcome
(n=135)
Past inpatient and outpatient episodes (any)
Inpatient admissions
(non-SAM,
in past year)
190/931 (20%) 88/283 (31%) 22/102 (22%) 69/444 (16%) 11/102 (11%)
Inpatient admissions
(for SAM, ever) 134/939 (14%) 47/282 (17%) 15/102 (15%) 57/452 (13%) 15/103 (15%)
Outpatient episodes
(last 6 months) 797/884 (90%) 233/253 (92%) 90/98 (92%) 396/440 (90%) 78/93 (84%)
Outpatient episodes
(last 6 months,
with symptoms
suggestive of
malnutrition)
187/882 (21%) 60/254 (24%) 26/97 (27%) 84/437 (19%) 17/94 (18%)
Outpatient episodes
(for SFP, ever) 203/910 (22%) 62/267 (23%) 29/102 (28%) 93/445 (21%) 19/96 (20%)
Ex Low Birth weight
(reported by carer) 86/899 (10%) 29/257 (11%) 13/98 (13%) 39/449 (9%) 5/95 (5%)
Ever had TB 32/924 (3%) 15/273 (5%) 4/103 (4%) 10/450 (2%) 3/98 (3%)
Ever had measles
vaccine 808/937 (86%) 232/290 (80%) 81/98 (82%) 401/448 (90%) 94/101 (93%)

Page 198
H.1.6 Family profile
Table 51 Family profile in full table
All
admissions
(n=1024)
Inpatient or
OTP death
(n=322)
Late death
(n=105)
Alive at >1
year post
admission
(n=462)
Unknown 1
year
outcome
(n=135)
Orphan
Mother died 72/916 (8%) 18/264 (7%) 10/102 (10%) 36/457 (8%) 8/93 (9%)
Father died 64/908 (7%) 22/261 (8%) 9/102 (9%) 28/452 (6%) 5/93 (5%)
Both dead 24/823 (3%) 9/240 (4%) 4/91 (4%) 10/410 (2%) 1/82 (1%)
Previous child death
in family 233/970 (24%) 76/306 (25%) 24/103 (23%) 110/457 (24%) 23/104 (22%)
Birth order of MOYO child
First 257/925 (28%) 76/272 (28%) 26/103 (25%) 126/453 (28%) 29/97 (30%)
Second 242/925 (26%) 70/272 (26%) 26/103 (25%) 115/453 (25%) 31/97 (32%)
Third 188/925 (20%) 60/272 (22%) 20/103 (19%) 87/453 (19%) 21/97 (22%)
Fourth or later 238/925 (26%) 66/272 (24%) 31/103 (30%) 125/453 (28%) 16/97 (16%)
Maternal education
None 101/876 (12%) 30/254 (12%) 13/98 (13%) 51/433 (12%) 7/91 (8%)
Primary school 605/876 (69%) 164/254 (65%) 70/98 (71%) 303/433 (70%) 68/91 (74%)
Secondary school 170/876 (19%) 60/254 (24%) 15/98 (15%) 79/433 (18%) 16/91 (18%)
Paternal education
None 27/652 (4%) 10/176 (6%) 1/68 (1%) 14/337 (4%) 2/71 (3%)
Primary school 297/652 (46%) 77/176 (44%) 31/68 (46%) 156/337 (46%) 33/71 (47%)
Secondary school 328/652 (50%) 89/176 (51%) 36/68 (53%) 167/337 (50%) 36/71 (51%)
Mother illiterate 315/885 (36%) 88/256 (34%) 35/100 (35%) 160/437 (37%) 32/92 (35%)
Father illiterate 77/838 (9%) 25/233 (11%) 5/93 (5%) 36/423 (9%) 11/89 (12%)
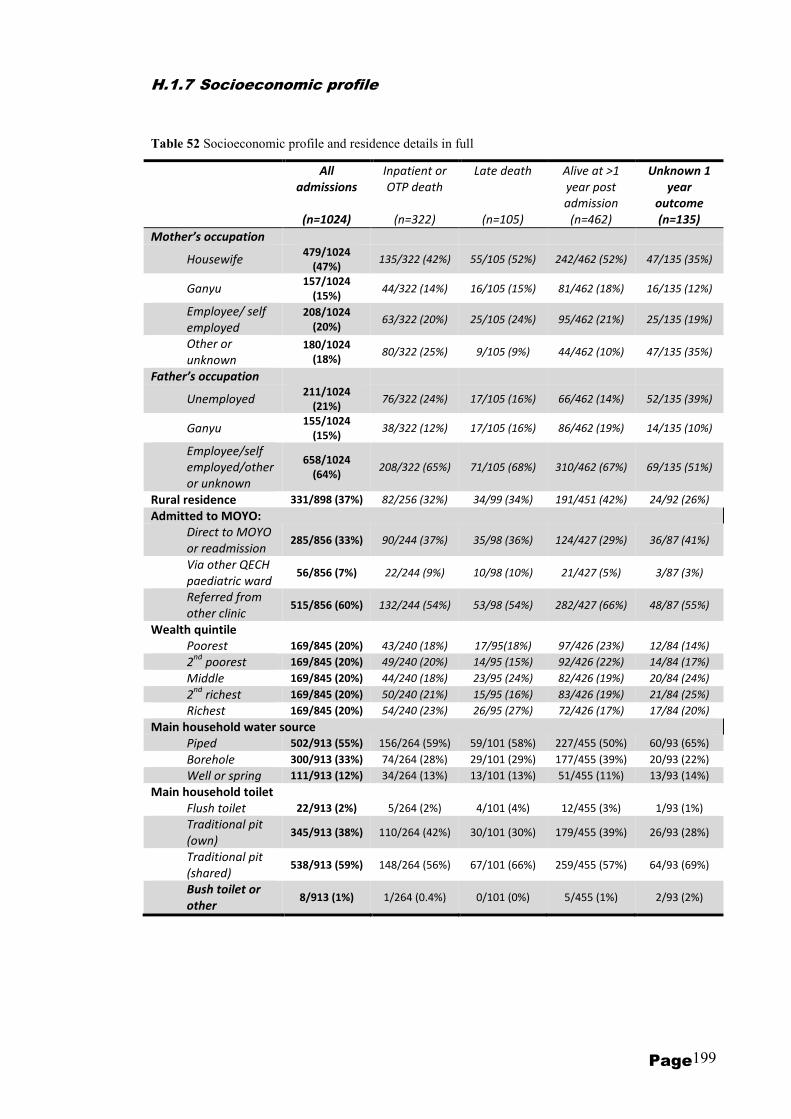
Page 199
H.1.7 Socioeconomic profile
Table 52 Socioeconomic profile and residence details in full
All
admissions
(n=1024)
Inpatient or
OTP death
(n=322)
Late death
(n=105)
Alive at >1
year post
admission
(n=462)
Unknown 1
year
outcome
(n=135)
Mother’s occupation
Housewife 479/1024
(47%) 135/322 (42%) 55/105 (52%) 242/462 (52%) 47/135 (35%)
Ganyu 157/1024
(15%) 44/322 (14%) 16/105 (15%) 81/462 (18%) 16/135 (12%)
Employee/ self
employed
208/1024
(20%) 63/322 (20%) 25/105 (24%) 95/462 (21%) 25/135 (19%)
Other or
unknown
180/1024
(18%) 80/322 (25%) 9/105 (9%) 44/462 (10%) 47/135 (35%)
Father’s occupation
Unemployed 211/1024
(21%) 76/322 (24%) 17/105 (16%) 66/462 (14%) 52/135 (39%)
Ganyu 155/1024
(15%) 38/322 (12%) 17/105 (16%) 86/462 (19%) 14/135 (10%)
Employee/self
employed/other
or unknown
658/1024
(64%) 208/322 (65%) 71/105 (68%) 310/462 (67%) 69/135 (51%)
Rural residence 331/898 (37%) 82/256 (32%) 34/99 (34%) 191/451 (42%) 24/92 (26%)
Admitted to MOYO:
Direct to MOYO
or readmission 285/856 (33%) 90/244 (37%) 35/98 (36%) 124/427 (29%) 36/87 (41%)
Via other QECH
paediatric ward 56/856 (7%) 22/244 (9%) 10/98 (10%) 21/427 (5%) 3/87 (3%)
Referred from
other clinic 515/856 (60%) 132/244 (54%) 53/98 (54%) 282/427 (66%) 48/87 (55%)
Wealth quintile
Poorest 169/845 (20%) 43/240 (18%) 17/95(18%) 97/426 (23%) 12/84 (14%)
2nd
poorest 169/845 (20%) 49/240 (20%) 14/95 (15%) 92/426 (22%) 14/84 (17%)
Middle 169/845 (20%) 44/240 (18%) 23/95 (24%) 82/426 (19%) 20/84 (24%)
2nd
richest 169/845 (20%) 50/240 (21%) 15/95 (16%) 83/426 (19%) 21/84 (25%)
Richest 169/845 (20%) 54/240 (23%) 26/95 (27%) 72/426 (17%) 17/84 (20%)
Main household water source
Piped 502/913 (55%) 156/264 (59%) 59/101 (58%) 227/455 (50%) 60/93 (65%)
Borehole 300/913 (33%) 74/264 (28%) 29/101 (29%) 177/455 (39%) 20/93 (22%)
Well or spring 111/913 (12%) 34/264 (13%) 13/101 (13%) 51/455 (11%) 13/93 (14%)
Main household toilet
Flush toilet 22/913 (2%) 5/264 (2%) 4/101 (4%) 12/455 (3%) 1/93 (1%)
Traditional pit
(own) 345/913 (38%) 110/264 (42%) 30/101 (30%) 179/455 (39%) 26/93 (28%)
Traditional pit
(shared) 538/913 (59%) 148/264 (56%) 67/101 (66%) 259/455 (57%) 64/93 (69%)
Bush toilet or
other 8/913 (1%) 1/264 (0.4%) 0/101 (0%) 5/455 (1%) 2/93 (2%)

ucylepr
TextBox
Pages 200 to 218 have been removed for copyright reasons
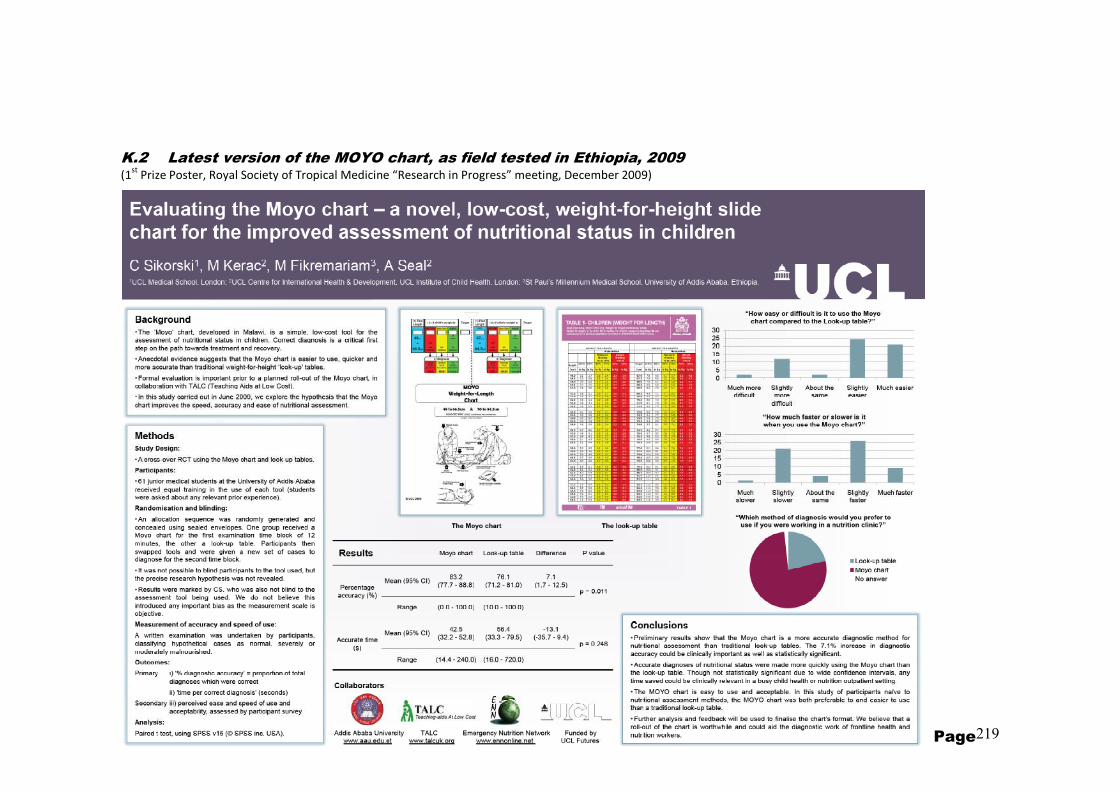
Page 219
K.2 Latest version of the MOYO chart, as field tested in Ethiopia, 2009 (1
st Prize Poster, Royal Society of Tropical Medicine “Research in Progress” meeting, December 2009)
“They shall neither hunger anymore, nor thirst anymore;”
Mural: M
ua M
ission, Malawi
“They shall neither hunger anymore, nor thirst anymore;”
Page 220
“They shall neither hunger anymore, nor thirst anymore;”
Revelation 7:16