Improving the Transition from High School to … the Transition from High School to Postsecondary...
76
Improving the Transition from High School to Postsecondary Education Policy Analysis for California Education University of California, Berkeley and Davis Stanford University WORKING PAPER SERIES 04-1 April 2004
-
Upload
vuongduong -
Category
Documents
-
view
215 -
download
0
Transcript of Improving the Transition from High School to … the Transition from High School to Postsecondary...

Improving the Transitionfrom High School toPostsecondary Education
Policy Analysis for California Education
University of California, Berkeley and Davis
Stanford University
WORKING PAPER SERIES 04-1
April 2004
Improving the Transitionfrom High School toPostsecondary Education
Policy Analysis forCalifornia Education
WORKING PAPER SERIES 04-1
PACE
Papers by:
Michael W. KirstAnthony Lising AntonioAndrea Conklin Bueschel
Stanford University
April 2004
Table of Contents
Preface ...................................................................................................................................................................... 1
SECTION 1 What do California Students and Parents Know about College?
by Anthony Lising Antonio .......................................................................................................................... 3
SECTION 2 Linkages and Disjunctures: California’s K–12 and Community College Sysetms
by Andrea Conklin Bueschel .................................................................................................................... 31
SECTION 3 Using a K–12 Assessment for College Placement
by Michael Kirst ................................................................................................................................................ 65
Summary of Findings ................................................................................................................................... 71
Policy Recommendations .......................................................................................................................... 73

1
Preface
PACE presents three working papers on the inadequacies and difficulties of successful transitionfrom high school to college. These papers are derived from The Bridge Project, a six-state studyof K–16 issues. Readers of these papers may want to read the final Bridge Report, Betraying theCollege Dream, and look at other six-state comparative studies on the Bridge website(http://www.stanford.edu/group/bridgeproject/). The website will help locate California in thenational K–16 context.
These three papers do not attempt to cover all aspects of K–16 and transition issues.Consequently, the policy implications at the end are based solely on these studies. While themedia has focused a disproportionate amount of its attention on the highly selective UC system,these studies provide fresh perspectives on the issues of college preparation, transition, andsuccess for the vast majority of California students who attend the broad-access institutions—theCalifornia State University system (CSU) and community colleges.
Anthony Lising Antonio provides an overview of what California students and parents knowabout college, and when they know it. His survey results are alarming and reveal widespreadignorance or misinformation about college requirements, readiness, and needed actions to besuccessful at college. For example, at CSU and community colleges, the placement exam givento entering first-year students is a crucial education standard, but students know little about theplacement process or the content of the exam. Students incorrectly think their high schoolgraduation standards are equivalent to college placement standards.
Andrea Bueschel summarizes case studies of the Los Rios Community College District (byK.C. Boatsman) and some of its feeder high schools. She analyzes how and why prospectivehigh school students receive vague and conflicting signals about academic college readiness.Moreover, she provides some significant contextual data on California students’ transition fromhigh school to community college.
Michael Kirst provides a concrete example of how to improve K–16 transition and placementand send clearer academic standards signals to high school students. He describes how CSU andthe California State Board of Education concluded negotiations in 2003 that merged CSUplacement standards into the existing statewide California standards tests (CST) given to allstudents in Grades 1-11. CSU set the minimum test scores that high school juniors would need toreach, and agreed to accept the CST in lieu of its own placement exam for those students. Low-scoring high school students will receive specific recommendations to avoid remediation incollege in summer 2004, and can use their senior year for intensive preparation to meet CSUplacement standards.
Policy implications from these three papers conclude this publication. Some of theserecommendations have low or no cost requirements.
3
Section 1
What do California Students and ParentsKnow About College?
by Anthony Lising Antoniowith the assistance of Samuel H.Bersola
In this report we explore the aspirations California students have for postsecondary educationand their knowledge about college costs, placement exam policies, and admission policies. Suchan examination is important because students whose aspirations align poorly with their collegeknowledge are likely to be unprepared for the challenges of college.
For instance, such students may not have taken sufficiently rigorous courses in high school. Theyalso may have acquired inaccurate or inadequate information which may lead them to make poorcollege choices: they may end up selecting an insufficiently challenging school, a school theycannot afford, or a school without a strong academic program in the student’s primary interest.
Generally we found that students have high postsecondary aspirations. Almost half desire toattend college at one of the University of California campuses, the state’s most selectiveuniversity. Despite these high aspirations, students also demonstrated rather poor knowledge ofcollege costs and policies, knowledge that may be important for making successful transitions tocollege. Tuition was consistently overestimated, admission criteria were misunderstood, andstudents’ knowledge of academic placement appeared to be based more on guesswork than fact.
Methodology and Sample
The Sacramento Metropolitan Area and surrounding cities was chosen as the target populationfor this study. Within this geographic area, we chose two high schools in each of three areaschool districts at which to collect data. Our aim was to choose schools that were located neartwo public, four-year institutions— the University of California at Davis and California StateUniversity, Sacramento. This was to ensure that our sample of students would view the twouniversities as their local UC and CSU options, and therefore would likely seek out informationon those institutions’ policies and practices.
Schools and districts were selected with regard to the following criteria: racial diversity, UCeligibility rates, UC- and CSU-going rates, SAT-I scores, and STAR scores. In addition, weconsidered the percentage of students on free or reduced lunch as an indicator of schoolsocioeconomic status. Within high schools and districts, we attempted to choose schools thatwould provide contrasts in socioeconomic status, racial composition, and academic performance,while also selecting schools that normally send a respectable number of students to the two localpublic universities. The characteristics of the six sampled high schools are summarized in Table 1.

4
TABLE 1. Selection Characteristics of Sampled High Schools.
District High % % Reduced/ % completed % enrolled % enrolled 11th gr Stanf. 9School* White free lunch UC a-f reqs @ UCD (#) @ CSUS (#) (% >49th pct)
1 Applewood 48 16 15 5 (na) 5 (na) 42V 46MHaverhill 44 17 22 7 (58) 6 (33) 33V 50M
2 Bridgeport 29 49 44 6 (50) 13 (79) 32V 45MThree Palms 51 14 36 7 (47) 12 (94) 50V 64M
3 Bellview 30 24 37 14(51) 4 (72) 44V 53MCenter City 35 56 37 3 (46) 8 (83) 28V 44M
na: Data not available.* School names are pseudonyms.
As Table 2 shows, we divided the six schools into three levels of performance (low, middle, andhigh) according to the combined verbal and math scores of eleventh graders on the 1997Stanford-9 test. Sampled schools in Districts 2 and 3 each represented a low- and high-performing pair within the district. District 1 had only two comprehensive high schools,however, and these schools were average-performing within the Northern California context.
TABLE 2. School Performance Designations.
District High School* Combined Math/VerbalPerformance SAT-9 Score School
1 Applewood 88 MiddleHaverhill 83 Middle
2 Bridgeport 77 LowThree Palms 114 High
3 Bellview 97 HighCenter City 72 Low
*School names are pseudonyms.
The two comprehensive high schools in District 1, Applewood and Haverhill, are goodrepresentatives of “middle-performing schools.” Academic performance indicators place the twohigh schools squarely in the middle of the State achievement levels and in the middle of theirrespective “similar school” cohorts.
About one-fifth or less of their graduates complete the A–F requirements for the University ofCalifornia, and approximately one-fifth matriculate directly to a four-year college or university.About one-third of the students at each school take the SAT-I, and average verbal and mathscores for each hovers around 500, the national average. Note that higher percentages of

5
graduates in the low-performing schools complete UC A-F requirements, which illustrates someof the limitations of these performance designations based upon test scores.
The two District 2 high schools included in the study only opened within the last decade, reflectingthe area’s rapid growth. Racial composition and socioeconomic status varied most in this district.According to the 1999 Stanford-9 results, Bridgeport was the lowest-performing among the fivecomprehensive high schools in this district while Three Palms was the highest-performing.
Teachers and administrators describe Three Palms as “college preparatory,” which was clearlyevident in the main office, which housed elaborate displays of impressive college matriculationstatistics. Despite the fact that both schools in this high-performing district offer a wide array ofAdvanced Placement courses (approximately a dozen AP courses each), Three Palms studentsearn AP credits at a rate twice that of students at Bridgeport and students statewide.
District 3, an urban district in Northern California, is one of the largest in the state and has itsshare of urban challenges. For example, according to a district study, at the end of the 1998–99school year nearly half of the 9th graders in the district did not acquire the units needed toadvance to the 10th grade. Furthermore, on average, 9th graders in District 3 earned three gradesof D or F during that academic year. Bellview High, which is located in an upper-middle-classresidential neighborhood, is known for its rigorous academic program and high academicachievement, and is the district’s highest-performing school.
In contrast, Center City High School is one of District 3’s lowest-performing high schools.According to 1999 Stanford-9 results, just over 10% of the students at Center City wereperforming above grade level, compared to nearly half of the students at Bellview. Furthermore,only a quarter of the seniors at Center City met the UC A-F eligibility requirements, whereasover half of Bellview’s seniors met these requirements.
“We targeted 9th and 11th graders who were likely to be interestedin college (those in honors and college prep courses).”
Within each school, we selected a stratified sample of students and their parents for participationin our study. Our selection matrix was a 2x2 design (grade level x honors track) in which wetargeted students in 9th grade, 11th grade, honors track, and non-honors (but “college-prep”)track. In other words, we targeted 9th and 11th graders who were likely to be interested in college(those in honors and college prep courses) as opposed to those who were least likely to beinterested (those in the basic-level courses).
At each high school this selection matrix resulted in a target sample of students in four Englishclassrooms: one 9th grade college prep class, one 9th grade honors class, one 11th grade collegeprep class, and one 11th grade honors class. English classrooms were chosen to delineate studentsby grade level and academic track because, unlike mathematics courses, the classrooms werehomogeneous with respect to grade level. Since each of the schools had no formal tracking ofstudents, we took into account students’ current English and math courses in our analyses, asdescribed below in the findings section.
6
We surveyed students and their parents in the spring quarter of the 1998–1999 academic yearusing a questionnaire specifically designed for the study. Parents were asked to complete a 15-minute survey and an attached consent form. The parent survey collected data on familysocioeconomic status, their knowledge of local college admission requirements, and theirspecific behaviors associated with obtaining information about college.
Returning students signed consent forms and were given approximately 30 minutes during classto complete a 27-question survey. The student survey was designed specifically for this studyand gathered data on student behaviors, aspirations, and beliefs related to going to college. Thefinal sample consisted of 451 students and 433 parents. There were 418 cases in which completestudent and parent survey data was obtained.
Slightly more young women (63%) participated in our survey than young men. As teachersexplained, honors courses are predominantly female; thus, our sample was skewed in thisdirection. In addition, more 11th graders (53%) than 9th graders (47%) participated. In terms ofsocioeconomic status (SES), students tended to fall in our mid-SES and high-SES categories,with only 21% falling into the bottom third of our SES scale.1
The sample was racially and ethnically diverse. Students of Asian descent comprised almost 40%of our sample, yet student demographic information for the two counties in which our six schoolsreside indicates that only 17% of the high school population is of Asian descent. Thisoversampling of Asian-American students is likely due to the fact that our sample includedcollege preparatory and honors students only, and Asian-American students tended to beoverrepresented in these tracks.
In contrast, African-American and Latino students were undersampled (11% African-Americansin our sample vs. roughly 15% overall within the two counties, and 10% Latinos in our samplevs. roughly 16% within the two counties). Whites made up 27% of the sample.
Focus group interviews were also conducted with 8–10 students from each sampled classroom.Although this report focuses on the analysis of survey data, qualitative data from interviews arealso provided for additional explanation of findings.
FINDINGS
In our analysis we look at student aspirations for postsecondary education as well as student“college knowledge”2 in terms of their understanding of tuition costs, curricular requirements,placement tests, and admission selection criteria. Student aspiration and college knowledge areanalyzed for differences by grade (9th vs. 11th), race, socioeconomic status (SES), school
1 Socioeconomic status (SES) was measured by a composite of two variables, maximum parental education and family income,both taken from the parent survey. Maximum parental education was scaled from 1 (less than high school) to 7(graduate/professional degree) and was taken as the higher level of attainment among the mother and father. Family income wasscored 1 (below $15,000 a year) to 12 (over $100,000 a year). SES was computed as the sum of the two measures. For cross-tabular analyses, we divided these SES values into three major categories: low-SES (2 to 7), middle-SES (8 to13), and high-SES(14 to 19). The sample tended toward the mid- and high-SES categories (38.5% and 40.1%, respectively). Only 71 students(21.4%) were categorized in the low-SES category.2 McDonough, P.M. (1994). Buying and selling higher education: The social construction of the college applicant. Journal ofHigher Education, 65, 427-446.
7
performance, academic track, and use of key agents. In a final section, we present a brief analysisof parents’ college knowledge based on the data collected from parent surveys.
Student Aspirations for Postsecondary Institutions
In our survey we asked students to state their interest in attending ten types of postsecondaryinstitutions. Students were allowed to check as many institutions as they wished.
“Juniors may have greater knowledge than freshmen of theirchances for admission across institutions, and include their local
community college as a ‘safety school.’”
Aspirations by Grade
As Table 3 shows, the juniors in our sample expressed greater interest than the freshmen inattending three institutions: a local community college, UC campuses other than UC Davis(UCD), and CSU campuses other than CSU Sacramento (CSUS). The largest difference by gradewas associated with interest in a community college. Eleventh graders are nearly twice as likelyto include the two-year institution on their list of postsecondary options. One explanation for thisdifference in postsecondary aspiration is that juniors may have greater knowledge in terms ofinstitutional variety (schools further from home) and of their objective chances for admissionacross institutions, thereby including their local community college as a “safety school.”
TABLE 3. Postsecondary Aspirations by Grade.
Percent Among 9th 11th Total t-test
Institution (n=214) (n=237) (n=451) p-valueLocal community college 19.6 39.2 29.9 .000UC Davis 51.4 45.1 48.1 .185Other UC campus 42.5 52.3 47.7 .038CSU Sacramento 27.6 36.2 26.8 .737Other CSU campus 19.2 27.4 23.5 .039
Note: Subgroup sample sizes may differ from total due to missing data.
Aspirations by Race
Small cell sizes in the cross tabulations make it difficult to render strong inferences with respectto racial differences. However, we feel it is instructive to note a few interesting trends in theanalyses by race. In Table 4, we find that white, Latino, and multiracial students were the mostlikely to include their local community college on their postsecondary options list.

8
The students in all three Asian-American subcategories, along with multiracial students, showeda greater interest in UCD than the other racial groups. Chinese-American students showed by farthe greatest interest in other UC campuses. Furthermore, Southeast Asians showed the mostinterest in CSUS. Finally, African-American students were least interested in other CSUcampuses while white students were the most interested. In fact, the interest in other CSUcampuses among African-Americans was less than one-third that of white students.
TABLE 4. Postsecondary Aspirations by Race.
Race
Institution Aspired (%)
African-Am.
(n=48)
White
(n=120)
LatinoLatina(n=44)
Chinese-Am.
(n=54)
SEAsian
(n=52)
OtherAsian(n=59)
Multi-racial(n=69)
Total
(n=450)Local community college 25.0 34.2 34.1 25.9 21.2 28.8 36.2 30.0UC Davis 33.3 40.8 45.5 57.4 53.8 57.6 53.6 48.0Other UC campus 29.2 54.2 38.6 70.4 30.8 49.2 49.3 47.6CSU Sacramento 27.1 22.5 27.3 22.2 36.5 32.2 23.2 26.4Other CSU campus 10.4 35.0 22.7 16.7 17.3 16.9 30.4 23.6
Note: Subgroup sample sizes may differ from total due to missing data.
Aspirations by SES
Aspiration trends with SES are shown in Table 5. One expected trend was confirmed: high-SESstudents showed greater interest in UCD (61%) than low-SES (45%) and middle-SES students(48%). Similarly, and perhaps more telling, is the fact that interest in other UC campusesincreased with SES, with high-SES students aspiring to these schools at twice the rate of theirlow-SES counterparts.
The opposite is true, however, for interest in the less selective CSUS. Among low-SES students,40% indicated interest compared to only 23% of high-SES students. Finally, mid-SES studentsindicated the greatest interest in their local community college (35%), which was significantlygreater than the aspirations among students from high-SES families.
TABLE 5. Postsecondary Aspirations by SES.
SES t-tests (p-values) Low-SES Mid-SES Hi-SES lo-mid mid-hi lo-hi
Institution Aspired (%) (n=62) (n=121) (n=130)Local community college 32.3 34.7 21.5 .728 .021 .124UC Davis 45.2 47.9 60.8 .721 .042 .043Other UC campus 32.3 49.6 66.2 .023 .007 .000CSU Sacramento 40.3 28.9 23.1 .106 .305 .014Other CSU campus 22.6 24.8 28.5 .740 .513 .379
Note: Subgroup sample sizes may differ from total due to missing data.
9
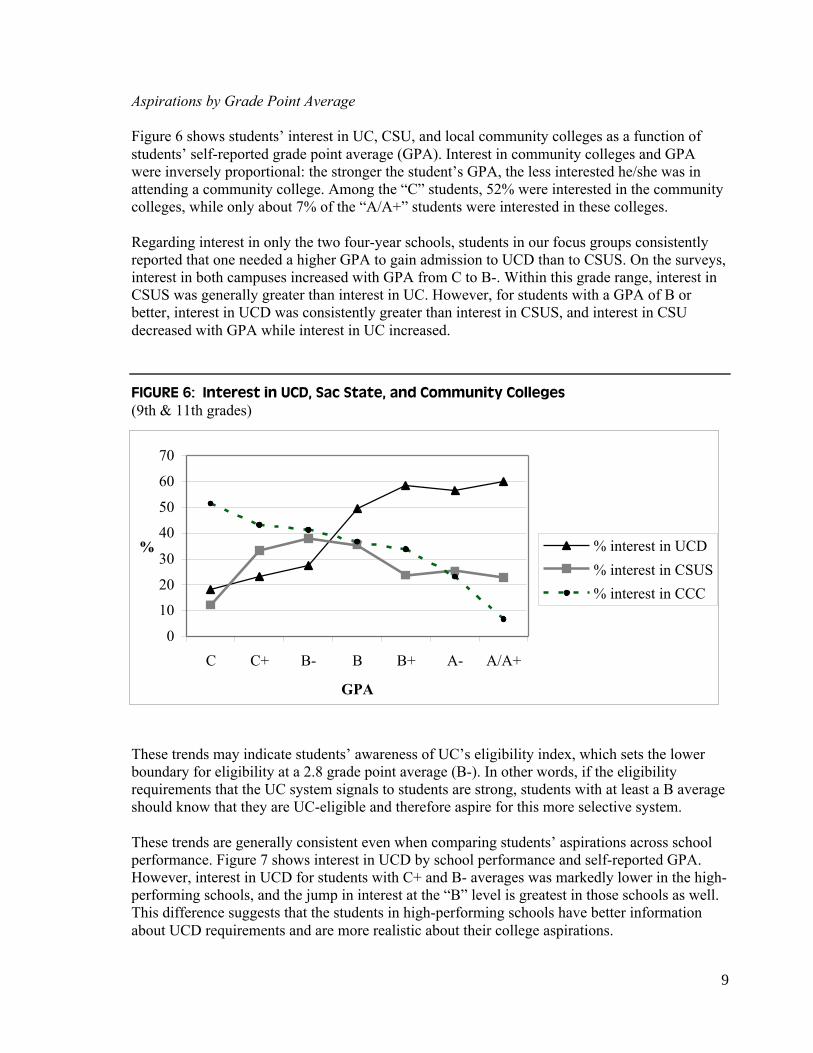
Aspirations by Grade Point Average
Figure 6 shows students’ interest in UC, CSU, and local community colleges as a function ofstudents’ self-reported grade point average (GPA). Interest in community colleges and GPAwere inversely proportional: the stronger the student’s GPA, the less interested he/she was inattending a community college. Among the “C” students, 52% were interested in the communitycolleges, while only about 7% of the “A/A+” students were interested in these colleges.
Regarding interest in only the two four-year schools, students in our focus groups consistentlyreported that one needed a higher GPA to gain admission to UCD than to CSUS. On the surveys,interest in both campuses increased with GPA from C to B-. Within this grade range, interest inCSUS was generally greater than interest in UC. However, for students with a GPA of B orbetter, interest in UCD was consistently greater than interest in CSUS, and interest in CSUdecreased with GPA while interest in UC increased.
FIGURE 6: Interest in UCD, Sac State, and Community Colleges(9th & 11th grades)
These trends may indicate students’ awareness of UC’s eligibility index, which sets the lowerboundary for eligibility at a 2.8 grade point average (B-). In other words, if the eligibilityrequirements that the UC system signals to students are strong, students with at least a B averageshould know that they are UC-eligible and therefore aspire for this more selective system.
These trends are generally consistent even when comparing students’ aspirations across schoolperformance. Figure 7 shows interest in UCD by school performance and self-reported GPA.However, interest in UCD for students with C+ and B- averages was markedly lower in the high-performing schools, and the jump in interest at the “B” level is greatest in those schools as well.This difference suggests that the students in high-performing schools have better informationabout UCD requirements and are more realistic about their college aspirations.
0
10
20
30
40
50
60
70
C C+ B- B B+ A- A/A+
GPA
% % interest in UCD
% interest in CSUS
% interest in CCC

10
FIGURE 7: Interest in UC Davis by School Performance
0
10
20
30
40
50
60
70
80
C C+ B- B B+ A- A/A+GPA
%
low-performingschools
mid-performingschools
high-performingschools
Aspirations by School Performance
Interest in the UC campuses (Davis and other UC campuses) was significantly greater for studentsin high- and middle-performing schools than in low-performing schools. Only about 37% ofstudents in low-performing schools aspired to UC campuses other than Davis, compared to about54% among students in higher-performing schools. In other words, students in the higher-performing schools appear to be more “mobile” in their aspirations for more selective institutions.
Interestingly, while there was no significant difference in interest in CSUS by school performance,there were significant differences in interest in the other CSU campuses. In this case, the more “mobile”students are those at the middle-performing schools, who were twice as likely than were students atthe low- or high-performing schools to indicate interest in other CSU campuses (37% vs. ~18%).
Aspirations by Academic Track
We divided students into three academic categories or tracks, depending on the level of theircurrent math and English courses: 1) non-honors (neither math nor English honors), 2) single-honors (either math or English honors), and 3) dual-honors (both math and English honors). Ouranalysis confirmed some expected trends. First, interest in a local community college decreasedamong students in higher-level academic tracks. Second, dual-honors students indicated a greaterinterest in the UC campuses than did non-honors students. Third, single- and dual-honorsstudents indicated a greater interest in other UC campuses than did non-honors students.
The contrasts are stark. Compared to non-honors students, dual-honors students are 59% lesslikely to aspire to a community college (18% vs. 44%), 51% more likely to aspire to UCD (59%vs. 39%), and nearly one-and-a-half times more likely to aspire to a UC campus other than UCD(64% vs. 26%). Like those in high-performing schools, higher-track students appear to be moremobile and selective in their postsecondary aspirations.
11
Aspirations by Use of Key Agent
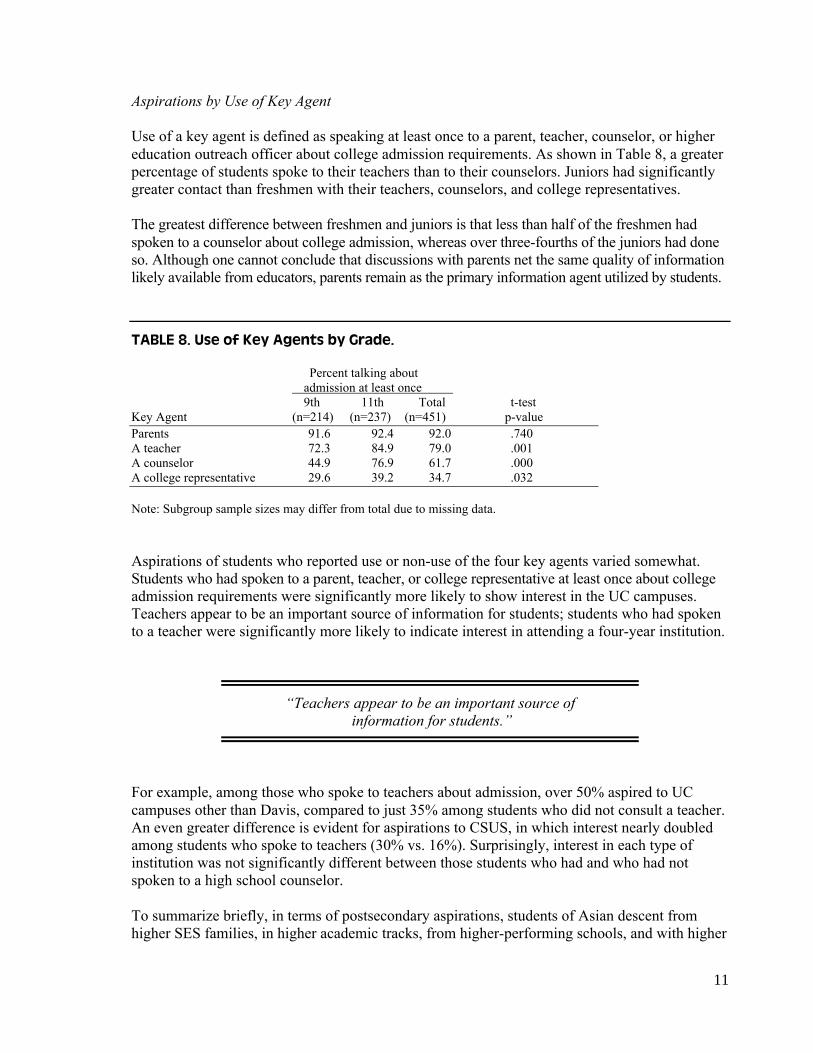
Use of a key agent is defined as speaking at least once to a parent, teacher, counselor, or highereducation outreach officer about college admission requirements. As shown in Table 8, a greaterpercentage of students spoke to their teachers than to their counselors. Juniors had significantlygreater contact than freshmen with their teachers, counselors, and college representatives.
The greatest difference between freshmen and juniors is that less than half of the freshmen hadspoken to a counselor about college admission, whereas over three-fourths of the juniors had doneso. Although one cannot conclude that discussions with parents net the same quality of informationlikely available from educators, parents remain as the primary information agent utilized by students.
TABLE 8. Use of Key Agents by Grade.
Percent talking about admission at least once
9th 11th Total t-testKey Agent (n=214) (n=237) (n=451) p-valueParents 91.6 92.4 92.0 .740A teacher 72.3 84.9 79.0 .001A counselor 44.9 76.9 61.7 .000A college representative 29.6 39.2 34.7 .032
Note: Subgroup sample sizes may differ from total due to missing data.
Aspirations of students who reported use or non-use of the four key agents varied somewhat.Students who had spoken to a parent, teacher, or college representative at least once about collegeadmission requirements were significantly more likely to show interest in the UC campuses.Teachers appear to be an important source of information for students; students who had spokento a teacher were significantly more likely to indicate interest in attending a four-year institution.
“Teachers appear to be an important source of information for students.”
For example, among those who spoke to teachers about admission, over 50% aspired to UCcampuses other than Davis, compared to just 35% among students who did not consult a teacher.An even greater difference is evident for aspirations to CSUS, in which interest nearly doubledamong students who spoke to teachers (30% vs. 16%). Surprisingly, interest in each type ofinstitution was not significantly different between those students who had and who had notspoken to a high school counselor.
To summarize briefly, in terms of postsecondary aspirations, students of Asian descent fromhigher SES families, in higher academic tracks, from higher-performing schools, and with higher
12
GPAs displayed a greater aspiration for the most selective tier, the UC, and displayed greatergeographic mobility in their aspirations as well.
Student Knowledge of College Tuition
Our survey asked students to provide a dollar amount for their “best guess of the cost of tuitionfor one year” at UC Davis, CSU Sacramento, and their local community college, excluding “thecost of books, housing, [and] other expenses.” For the 1998–99 academic year UCD charged anannual tuition of roughly $4,000, CSUS charged roughly $2,000, and the community collegescharged roughly $300. Across the board, students tended to greatly overestimate these costs. Thegross overestimation may be due to students’ interpreting the question as asking for total collegecosts, despite their explicit exclusion in the wording of the question. Overestimation of collegecosts, however, is not unusual.3
On average, our sample of students estimated annual tuition costs of nearly $30,000 for UCD,nearly $27,000 for CSUS, and just over $10,000 for a local community college. Standarddeviations for the estimates were also quite large, indicating a very poor sense of college tuitionamong students ($77,400 for UCD, $72,800 for CSUS, $37,400 for a community college). Whenwe informed students in the focus groups of the actual costs, students laughed in disbelief atwhat they perceived as great affordability. When asked why students overestimated these costs,one student in our focus groups remarked, “because people make such a big deal of it.” Thefollowing analysis looks more closely at students’ cost estimations.
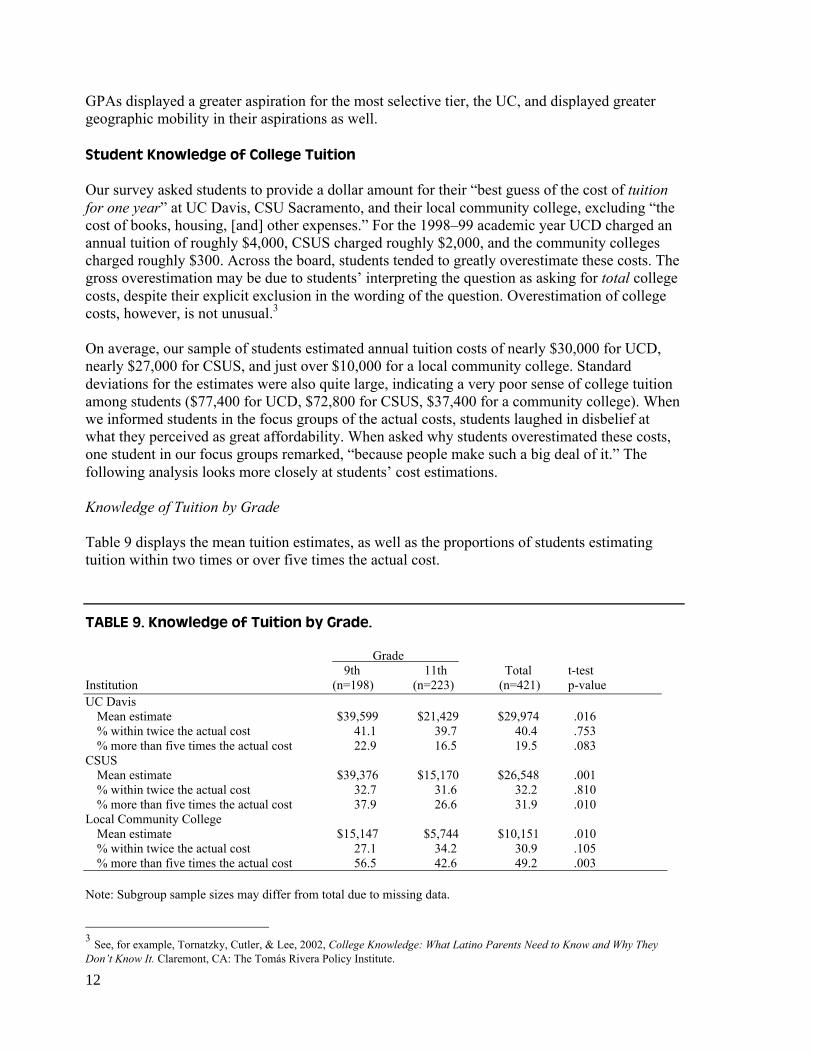
Knowledge of Tuition by Grade
Table 9 displays the mean tuition estimates, as well as the proportions of students estimatingtuition within two times or over five times the actual cost.
TABLE 9. Knowledge of Tuition by Grade.
Grade 9th 11th Total t-test
Institution (n=198) (n=223) (n=421) p-valueUC Davis
Mean estimate $39,599 $21,429 $29,974 .016% within twice the actual cost 41.1 39.7 40.4 .753% more than five times the actual cost 22.9 16.5 19.5 .083
CSUSMean estimate $39,376 $15,170 $26,548 .001% within twice the actual cost 32.7 31.6 32.2 .810% more than five times the actual cost 37.9 26.6 31.9 .010
Local Community CollegeMean estimate $15,147 $5,744 $10,151 .010% within twice the actual cost 27.1 34.2 30.9 .105% more than five times the actual cost 56.5 42.6 49.2 .003
Note: Subgroup sample sizes may differ from total due to missing data.
3 See, for example, Tornatzky, Cutler, & Lee, 2002, College Knowledge: What Latino Parents Need to Know and Why TheyDon’t Know It. Claremont, CA: The Tomás Rivera Policy Institute.

13
Defining “gross overestimation” as guessing beyond five times the actual cost of tuition and“within target” as guessing within twice the actual cost, a greater percentage of students grosslyoverestimated the cost for community college than for the CSU and UC. On the other hand, agreater percentage of students (40%) were within target for UCD than the other two sectors. Oneexplanation for the latter result is that the ranges for all three institutions were so high that thestudents were more likely to guess “within target” for the highest-priced institution (UC Davis)and more likely to “grossly overestimate” the lowest-priced institution (community college).
That 9th graders possess relatively less accurate information than their older peers concerningcollege access and entry is not surprising, and even somewhat expected, given the reality thatcollege entrance is several years off for them. Therefore, in the subgroup analyses that follow forknowledge of tuition, admission policy, and placement policy, we only examine 11th graders.
Knowledge of Tuition by Race
Among our seven racial/ethnic categories, Southeast Asian 11th graders were the most likely tooverestimate the three tuition costs (Table 10). While Latinos also overestimated the costs, theyoffered mean estimates that were closest to the actual values.
TABLE 10. Knowledge of Tuition by Race (11th Graders Only).
Race
Institution
African-Am
(n=48)White
(n=120)Latino/a(n=44)
Chinese-Am
(n=54)SE Asian
(n=52)
OtherAsian(n=59)
Multi-racial(n=69)
Total(n=450)
UC DavisMean estimate $19,883 $14,066 $11,622 $19,262 $51,193 $19,604 $22,243 $21,429% w/in twice actual cost 31.6 43.3 43.5 41.4 34.5 27.6 48.6 39.6%more than 5 times cost 15.8 11.9 13.0 24.1 27.6 17.2 10.8 16.6
CSUSMean estimate $16,678 $11,035 $8,533 $10,610 $33,978 $12,604 $17,903 $15,170% w/in twice actual cost 26.3 34.3 39.1 44.8 24.1 17.2 32.4 31.5% more than 5 times cost 36.8 36.9 17.4 17.2 44.8 24.1 21.6 26.8
Local Community CollegeMean estimate $8,467 $4,073 $1,397 $4,133 $15,817 $4,532 $3,862 $5,744
% w/in twice actual cost 42.1 34.3 34.8 41.4 27.6 20.7 37.8 33.6% more than 5 times cost 26.3 41.8 26.1 41.4 58.6 58.6 37.8 43.0
Note: Subgroup sample sizes may differ from total due to missing data.
Knowledge of Tuition by SES
Knowledge of tuition appears to increase with SES (Table 11). Low-SES students had meanestimates that were statistically greater than the mean estimates of high-SES students. As withthe analyses of aspiration, the differences were stark. For low-SES students, the estimates forUCD and CSUS were roughly four times greater than the estimates among high-SES students.High-SES students were statistically more likely to guess within twice the actual costs of UCD

14
and CSUS than their middle-SES 11th-grade counterparts. For the local community college, themean estimate for low-SES students was over six times greater than the mean estimates for high-SES students and four times greater than the mean estimates for middle-SES students.
TABLE 11. Knowledge of Tuition by SES (11th Graders Only).
SES t-tests (p-values) Low-SES Mid-SES Hi-SES lo-mid mid-hi lo-hi
Institution (n=36) (n=59) (n=62)UC Davis
Mean estimate $47,391 $16,521 $12,095 .068 .751 .034% within twice actual cost 38.9 25.9 50.8 .202 .005 .238% more than 5 times cost 19.4 12.1 13.1 .358 .865 .431
CSUSMean estimate $31,561 $12,942 $8,430 .054 .573 .016% within twice actual cost 27.8 20.7 41.0 .464 .016 .169% more than 5 times cost 36.1 27.6 19.7 .363 .329 .078
Local Community CollegeMean estimate $17,162 $4,297 $2,675 .031 .742 .014% within twice actual cost 25.0 32.8 37.7 .440 .202 .569% more than 5 times cost 61.1 39.7 36.1 .044 .690 .018
Note: Subgroup sample sizes may differ from total due to missing data.
Knowledge of Tuition by School Performance
In our analysis by school performance, an important and somewhat surprising finding is thatstudents in the middle-performing schools generally provided tuition estimates that were closerto the actual values than those provided by students in high- and low-performing schools. Theonly significant difference in the means, however, was for community college tuition. The meantuition estimate among students in low-performing schools ($9021 per year) was over four timesthe mean for students in middle-performing schools ($1939 per year). These students were alsothe most likely to overestimate grossly the cost of UCD and community college.
Similarly, students in the high-performing schools were generally most likely to fall in the“within target” range for tuition estimates. However, the only significant difference among our11th graders was found for tuition estimates to CSUS, where 44% of students in high-performingschools were “within target” compared to only 19% among those in middle-performing schools.
Knowledge of Tuition by Academic Track
By academic track, non-honors 11th graders were more likely than their single- and dual-honorscounterparts to overestimate tuition costs for the three institutions. For each postsecondaryoption, tuition estimates by non-honors students were at least twice those offered by single- anddual- honors students. Statistically significant differences were found only among CSUSestimates, however.

15
Knowledge of Tuition by Key Agent
Finally, our analysis suggests that key agents also influence students’ knowledge of collegetuition. Students who spoke to their parents about college admission were three times more likelyto guess within twice the cost of CSUS and community college, compared to students who didnot speak to their parents. Similarly, a majority (~70%) of students who had not spoken to theirparents about college admission requirements grossly overestimated the cost of communitycollege, compared to just 40% among students who had spoken to their parents.
Speaking with high school counselors also appears to improve students’ knowledge of tuition,particularly with respect to CSUS. Overall, students who spoke to counselors were more likely toprovide tuition estimates that were “within target” and not “grossly overestimated” for CSUS.This pattern does not hold for estimates of UCD’s costs, however. Interestingly, students whospoke to their counselors were significantly more likely to grossly overestimate the cost of UCDthan students who did not speak to their counselors. This finding may reflect poor counseling, orsimply that students are confused by the information they receive from counselors.
“Although students understood the relative tuition costs among the three types of institutions, they greatly
overestimated these costs.”
In sum, although the trend in responses may indicate that students understood the relative tuitioncosts among the three types of institutions, students greatly overestimated these costs. Knowledgeof tuition appears to increase with SES, and the community college cost estimate for students inlow-performing schools was over four times that of their counterparts in middle-performingschools. Non-honors students were the most likely to overestimate the three tuition costs.
Students who had spoken to their parents about college admission were less likely to grosslyoverestimate and more likely to estimate within target. In focus groups, students spoke of collegecosts as an important factor in their ability to attend college. They expressed the need to receivemore information on college costs. As one student put it, “That’s what we should talk aboutmore, too, in school—is how much it costs.”
Student Knowledge of Curricular Requirements for College Admission
In our survey, we asked students to write down the number of years of study required foradmission to UCD and CSUS in each of six subject areas (English, math, social science,laboratory science, foreign language, and visual/performing arts). For each university, wecalculated the percentage of students who guessed the number of years correctly for each subject.Generally, knowledge of curricular requirements was extremely poor. Only 2.5% of all studentsin the sample knew the correct number of years for all subject areas required by UCD, and only ahandful of students (<1%) knew the requirements for CSUS.
Because of these extremely low levels of knowledge, we also constructed a more liberalmeasure, the percentage of students who provided the correct number of years required for at

16
least half (three out of six) of the subject areas. In terms of the latter measure, students knewmore about CSUS’s subject requirements (about 50% got 3 or more correct) than UCD’srequirements (only 29% got 3 or more correct). In focus groups, students consistently expressedthat it was more difficult to gain admission to UCD (i.e., had more requirements) than to CSUS.
Students in focus groups expressed some confusion as to what was required for high schoolgraduation, and what was required for admission to the CSU and UC. For these college-boundstudents, their expectations for college may have replaced the requirements their high school setfor all students. Consequently, these students focused more on, and therefore displayed greaterknowledge of, what it took to gain admission to college than what it took to merely graduatefrom high school. Only a few students were familiar with the term “A through F” and itsmeaning, but most students mentioned having seen a list of university requirements that theirhigh school provided them.
Many students spoke of a booklet given to them by their school counselors during classscheduling that listed the UC and CSU course requirements. Most understood that theuniversities expected a few more years of study than their high school in certain subject areas,but only a few could pinpoint these differences. Students expressed some confusion, however, asto what the universities required and what the universities recommended.
Only a few students were able to articulate, for example, that their high school required only oneyear of foreign language whereas the universities required two, and that their high schoolrequired two years of math whereas the universities required three years of college-preparatorymath (beyond basic math and pre-algebra).
Knowledge of Curricular Requirements by Grade
Table 12 shows the percentage of 9th and 11th graders that gave the correct number of yearsamong six subjects required for admission to UCD and CSUS. Overall, the two subjectrequirements that students knew best were for English and a foreign language. The mathrequirement was the third most accurately reported requirement for UCD, but was less well-known among CSUS requirements than English, math, and visual/performing arts. Juniorsgenerally had better knowledge of the curricular requirements than freshmen.

17
TABLE 12. Knowledge of Curricular Requirements by Grade.
Grade 9th 11th Total t-test
Course Requirement (n=214) (n=237) (n=451) p-valueUC Davis
% Know English requirement (=4 yrs) 80.4 91.1 86.0 .001% Know foreign lang req (=2 yrs) 47.2 53.6 50.6 .176% Know math requirement (=3 yrs) 31.3 50.6 41.5 .000% Know soc science req (= 2 yrs) 32.2 29.5 30.8 .536% Know lab science req (=2 yrs) 22.0 34.6 28.6 .003% Know visual/perf arts req (= 0 yrs) 2.8 2.5 2.7 .858% Know 3 or more of 6 requirements 36.9 56.1 47.0 .000
CSU Sacramento% Know English requirement (=4 yrs) 69.6 80.2 75.2 .010% Know foreign lang req (=2 yrs) 57.0 73.4 65.6 .000% Know visual/perf arts req (= 1 yr) 46.1 51.9 49.2 .233% Know math requirement (=3 yrs) 35.5 51.5 43.9 .001% Know lab science req (=1 yr) 9.3 9.3 9.3 .982% Know soc science req (= 1 yr) 11.2 7.2 9.1 .137% Know 3 or more of 6 42.5 61.1 52.3 .000
Note: Subgroup sample sizes may differ from total due to missing data.
Table 12 also shows that knowledge of English requirements (over 75% correct) was muchstronger than knowledge of mathematics requirements (under 50% correct). To explore howinaccurate students’ estimates of the mathematics requirements were, we noted whetherresponses were underestimated or overestimated.
“Students tended to overestimate rather than underestimate thethree-year math requirement for CSU and UC.”
The following table shows that, generally speaking, students tended to overestimate rather thanunderestimate the three-year math requirement. Nearly half of the students overestimated thenumber of years for math for UCD, and one third of the students overestimated the number ofyears for math for CSUS. Moreover, freshmen were more likely than juniors to overestimate thenumber of years needed for both campuses. In other words, students tended to assume that theEnglish and math requirements were identical.

18
TABLE 13. Knowledge of Math Requirements by Grade.
Grade 9th 11th Total t-test
Knowledge of Math Requirement (n=208) (n=236) (n=444) p-valueUC Davis
% Underestimate (< 3 years) 12.1 7.3 9.5 .088% Correct (=3 years Math) 32.5 51.7 42.7 .000% Overestimate (> 3 years) 55.3 41.0 47.7 .003
CSU Sacramento% Underestimate (< 3 years) 19.2 24.2 21.8 .194% Correct (=3 years Math) 36.5 52.1 44.8 .001% Overestimate (> 3 years) 44.2 23.7 33.3 .000
Note: Subgroup sample sizes may differ from total due to missing data
Knowledge of Curricular Requirements by Race
Because juniors generally know the curricular requirements better than freshmen, all remaininganalyses include 11th graders only. Note that for analyses by race, cell sizes are small so tablesshould be interpreted with caution. As shown in Table 14, African-American students wereamong the least likely to report correctly the number of years of math and English required foreach campus, and for knowing at least three of the six subject requirements for CSUS. ChineseAmerican students displayed the most accurate knowledge overall of UCD curricularrequirements and were the most likely to know three of the six CSU requirements.
Latino and Southeast Asian students appeared to have some specific but incomplete knowledge.For example, while 87% of Latinos knew the CSUS English requirement (the highest among allgroups), only about 22% knew at least three of the subject requirements (the lowest among allgroups). Similarly, while Southeast Asian students were among the most likely to know the UCDrequirements (overall and particularly the math requirements), these students were the leastlikely to provide the correct number of English courses required for CSUS.
TABLE 14. Knowledge of Curricular Requirements by Race (11th Graders Only).
Race
Course Requirement
African-Am
(n=19)White(n=67)
Latino/a(n=23)
Chinese-Am
(n=29)SE Asian
(n=29)
OtherAsian(n=29)
Multi-racial(n=37)
Total(n=235)
UC Davis% Know English (=4 yrs) 84.2 92.5 95.7 96.4 89.3 96.6 94.4 93.1% Know math (=3 yrs) 42.1 53.7 47.8 60.7 57.1 48.3 50.0 51.7% Know 3 or more of 6 36.8 32.8 30.4 44.8 37.9 34.5 24.3 34.5
CSU Sacramento% Know English (=4 yrs) 78.9 86.6 87.0 79.3 72.4 80.0 75.0 80.9% Know math (=3 yrs) 44.4 59.7 56.5 44.8 44.8 56.7 50.0 52.1% Know 3 or more of 6 42.1 61.2 21.7 72.4 62.1 62.1 32.4 53.2
Note: Subgroup sample sizes may differ from total due to missing data.
19
Since only about half of the students knew the math requirements, whereas well over 80% of thestudents knew the English requirements, we ran further analysis on the responses for math alone.African-Americans were the most likely to overestimate the requirements. In addition, Latinosand Southeast Asians were the most likely to underestimate the math requirements for UCDwhile Chinese Americans and Southeast Asians were the most likely to underestimate the mathrequirements for CSUS.
Knowledge of Curricular Requirements by School Performance, Academic Track, and Use ofKey Agent
No significant difference was found in knowledge among the three school performance levelswith respect to the math and English requirements for UCD. For CSUS, students in high-performing schools were more likely than their counterparts in lower-performing schools toknow that four years of high school English are required for admission (90% vs. 79%).
Patterns are slightly different when looking at knowledge of all the requirements. Students in thehigh-performing schools were again more likely to know at least three of the six curricularrequirements for UCD (67%) than their counterparts in middle-performing (48%) and low-performing schools (54%), but for the CSUS requirements, the highest proportion of studentswho knew three or more of the course requirements were among those at low-performing schools(65%). Less than half of the students in high-performing schools could correctly name at leastthree of the six course requirements at CSUS.
Looking specifically at knowledge of the math requirements by school performance, students inlow-performing schools were more likely than students in middle-performing schools tounderestimate the required number of years of math for UCD and CSUS. Furthermore, studentsin middle-performing schools were the least likely to underestimate these requirements but thesestudents were also the most likely to overestimate these requirements as well. These data suggestthat students in middle-performing schools receive less information and therefore have lessknowledge about the courses needed for admission to the four-year colleges.
“Academic track and knowledge of curricular requirements weredirectly related: dual-honors students displayed the
most knowledge.”
Academic track and knowledge of curricular requirements were directly related: dual-honorsstudents displayed the most knowledge, while non-honors students displayed the least. Over 60%of dual-honors students knew at least three of the course requirements for UCD and over 70%knew them for CSUS. Less than half of the non-honors students possessed this same level ofknowledge. Interestingly, dual-honors students were more likely than non-honors students tounderestimate the math requirements for CSUS. This pattern may indicate that the higher-aspiringdual-honors students undervalue the entrance requirements to the less selective CSU campus.

20
Patterns of knowledge related to interaction with key agents produced mixed results. Studentswho spoke to teachers at least once about college admission requirements were more likely thanthose who did not talk to teachers to know the CSUS math requirement exactly and less likely tounderestimate this requirement. On the other hand, students who spoke to a high schoolcounselor were twice as likely to underestimate the number of years of CSUS math requirement,and those who had spoken to a college representative were three times more likely tounderestimate the number of years of math required for UCD.
In sum, students possessed more knowledge of the course requirements for CSUS than for UCD.Based on survey data as well as focus group responses, students in honors courses displayedmore specific knowledge than students who were in college-preparatory courses. Furthermore,students in the high-performing schools were the most knowledgeable of UCD’s requirements,while students in the low-performing schools were the most knowledgeable of CSUS’srequirements. Overall, students indicated the greatest understanding of the English requirementsand much less understanding of the mathematics requirements.
Student Knowledge of University Placement Exams
Our survey asked students to identify the subject areas in which CSUS and UCD test students forplacement. The question read in the following way: “In what subjects does CSU Sacramento andUC Davis test new students to place them in college-level courses?” Students were able to markany number of the following five subjects: English, mathematics, laboratory science, foreignlanguage, and visual and performing arts. The correct answer is that both universities conductplacement tests in math and in English only. UCD administers the Subject A exam for Englishplacement and the Mathematics Development Testing Program (MDTP). CSUS administers theEntry Level Mathematics (ELM) test and the English Placement Test (EPT).
Knowledge of Placement Exams by Grade
When counting the students who had indicated that each university required an English or mathplacement exam irrespective of their answers for the other three subjects, knowledge of theexams appears extremely high (Table 15). The greater than 90% figures, however, are a result ofstudents assuming that colleges require placement tests in all subjects. The number of studentswho knew the policies accurately—that exams are required only for math and English—isactually quite low. Less than one in five (17%) students knew the UCD placement policy at thatlevel, and less than a third knew the CSUS policy. Eleventh graders were more than twice aslikely as ninth graders to know that math and English were the only two subjects tested at eitherstate university.

21
TABLE 15. Knowledge of University Placement Exams by Grade.
Grade 9th 11th Total t-test
Placement Exam (n=214) (n=239) (n=453) p-valueUCD
% Know English Placement 92.5 95.4 94.0 .206% Know Math Placement 93.0 94.9 94.0 .389% Know English and Math (both and only) 10.3 23.6 17.3 .000
CSUS% Know English Placement 93.9 95.8 94.9 .376% Know Math Placement 93.0 93.7 93.3 .773% Know English and Math (both and only) 16.8 39.7 28.8 .000
Note: Subgroup sample sizes may differ from total due to missing data.
Knowledge of Placement Exams by Race
Table 16 shows 11th graders’ knowledge of placement exams by race. In contrast to African-Americans’ relative lack of knowledge of curricular requirements mentioned earlier, African-American students displayed the greatest knowledge of the two placement exam requirements forUCD and were equally knowledgeable to students of other races of the two exams required byCSUS. Chinese-Americans were the least knowledgeable about UCD and Southeast Asians werethe least knowledgeable about CSUS.
TABLE 16. Knowledge of Required University Placement Exams in English and Mathby Race (11th Graders Only).
Race
English and Math Placement Exam
African-Am
(n=19)White(n=67)
Latino/a(n=23)
Chinese-Am
(n=29)SE Asian
(n=29)
OtherAsian(n=29)
Multi-racial(n=37)
Total(n=235)
% Know for UCD 22.9 20.0 15.9 11.1 17.3 15.3 15.9 17.3% Know for CSUS 29.2 29.2 27.3 31.5 21.2 33.9 30.4 29.1
Note: Subgroup sample sizes may differ from total due to missing data.
Knowledge of Placement Exams by School Performance, Academic Track, and Use of Key Agent
In general, knowledge of the English and math placement exams at the two universities wasfairly low and not differentiated by type of school, track, or key agent. Similar to the analysesabove, knowledge of the two CSUS exams appears greater among students than of the two UCDexam requirements. Surprisingly, 11th graders who did not talk to a high school counselor aboutadmission were more likely to know the placement policy for UCD (35%) than were studentswho did talk to a high school counselor (20%). This trend was similar for knowledge of CSUSplacement policy, but not statistically significant.

22
Although students displayed a low level of specific knowledge of university placement exams,students expressed the desire to know more about these tests and to be better prepared to takethese tests. Teachers and administrators expressed their growing concern over issues ofuniversity placement and remediation. Students spoke about how their schools prepared them forthe subject requirements and SATs needed to gain admission to college, but most did notmention whether schools provided help on how to succeed once they were in college. As oneEnglish 11 Honors student at Applewood expressed:
I think they should prepare us better for the placements tests so that we don’t getstuck in basic classes. I think we should have the opportunity to know not necessarilywhat’s on the test, but have a good idea of it so that we know what to expect.
Knowledge of College Admission Selection Criteria
In our focus groups we asked students about the selection criteria for UC Davis and CSUSacramento. Students generally stated that UCD was more difficult to get into, that studentsneeded a high GPA, and that extracurricular activities mattered. In our survey we gathered morespecific data, asking students to rate the importance of 15 possible criteria for admission to UCDand CSUS.
Using a five-point scale, students rated each criterion as either: “single most important,” “veryimportant,” “moderately important,” “minor importance,” or “not considered/not important.” Inorder to evaluate the “accuracy” of these responses, we compared them to the rankings of samecriteria provided by the admission directors at the respective institutions.
We examined student knowledge of specific criteria rated by the UCD and CSUS admissionoffices at the two extremes—as important (“single most important” or “very important”) orunimportant (“not considered/not important”). Seven of the fifteen criteria were rated asimportant by the UCD official and four criteria were rated important by the CSUS official (seecriteria listed in Table 17). Three criteria were deemed important by both universities: highschool grades, SAT-I, and high school courses. Two criteria were deemed unimportant for bothuniversities: ability to pay and race.
Knowledge of Admission Criteria by Grade
Knowledge of the criteria that might be termed “traditional admission criteria” was quite high(Table 17). From 80% to over 90% of students correctly marked as important selection criteriagrades, test scores, high school courses, and in the case of UCD, the application essay. Almosthalf the students failed to recognize senior-year grades as an important criterion for CSUS,however. And, similar proportions did not view volunteer work and exceptional talent in aspecific area as important for UCD.
Knowledge of criteria deemed “unimportant” was extremely poor. Less than 10% of the totalsample correctly identified as unimportant to UCD three criteria (high school reputation, abilityto pay, and letters of recommendation), and as unimportant to CSUS three criteria (SAT-II, classrank, and ability to pay).

23
“Nine out of ten students placed importance on factors that are notconsidered in the admission process.”
In other words, approximately nine out of ten students overestimated the importance of theseadmission criteria; they placed importance on factors that are not considered in the admissionprocess. Given the public awareness of efforts to remove race from college admission policies inCalifornia, it is not surprising that a sizeable proportion of students (~40%) correctly marked itas unimportant. However, the conjugate result suggests that a majority of students still believerace to be a factor of some importance in admission policy at both public institutions.
Table 17 also shows that for both universities, juniors were more likely than freshmen to knowthat a student’s ability to pay for college was not an important admission criterion. On the otherhand, freshmen were more likely to know that race was unimportant. Two additional significantdifferences were found between freshmen and juniors. First, juniors were slightly more likelythan freshmen to know that the application essay was a very important criterion for admission toUCD (87% vs. 80%). Conversely, 90% of freshmen knew that the SAT-II was an importantcriterion for admission to UCD compared to just 78% of the juniors.
TABLE 17. Knowledge of Admission Criteria by Grade. Grade
9th 11th Total t-testAdmission Criteria (n=208) (n=237) (n=451) p-value% Correct for UC Davis
Important CriteriaHigh school grades 92.4 92.4 92.4 .994SAT-I or ACT 89.1 88.7 89.9 .882SAT-II 89.6 78.6 83.8 .001Student’s HS curriculum 85.8 82.6 84.1 .340Application essay 80.2 87.0 83.8 .051Exceptional talent 57.8 55.7 56.7 .651Volunteer work 51.7 47.7 49.6 .400
Unimportant CriteriaHigh school’s reputation 4.8 6.4 5.6 .463Ability to pay 4.7 10.6 7.8 .021Letters of recommendation 1.0 1.3 1.1 .753Race 44.8 34.9 39.6 .032
% Correct for CSU SacramentoImportant Criteria
High school grades 87.2 80.7 83.7 .061Senior year grades 73.5 42.8 57.0 .000SAT-I or ACT 90.0 81.5 85.5 .010Student’s HS curriculum 86.7 77.8 81.5 .007
Unimportant CriteriaGeographic background 27.8 24.7 26.1 .464SAT-II 1.0 2.9 2.0 .137Rank in class 2.4 2.9 2.7 .707Ability to pay 3.8 12.2 8.3 .001Race 44.5 35.2 39.6 .043
Note: Subgroup sample sizes may differ from total due to missing data.

24
Knowledge of Admission Criteria by Race
African-Americans were the only group that placed greater importance on standardized testscores (SAT-I, SAT-II, ACT) than on high school grades. Among the criteria deemed importantby the UC and CSU admission officers, the importance of volunteer work was underestimated,especially among white students. Although the ability to pay for college is not considered inUCD admission policy, all of the multiracial 11th graders in our sample gave some importance tothis factor, and even the group that displayed the most knowledge, Chinese-Americans,erroneously cited ability to pay as an important factor at a rate of over 75%.
A majority of students within each racial group continues to believe that race is considered inadmission. The previous beneficiaries of affirmative action, however, are among the most likelyto maintain that belief. For the UCD criteria, for example, about 75% of African-Americanstudents and almost 80% of Latinos marked race as a factor in admission. Similar patterns areevident in the data for CSUS.
Two additional patterns in the data are unique to CSUS, however. First, although about 80% ofall 11th graders understand the importance of high school grades for admission to CSUS, almostone-third of Chinese American and multiracial students downplay its importance. Regarding theimportance of senior-year grades, almost 60% of the 11th grade sample underestimated theirimportance, including almost 80% of African-Americans—the largest among all racial groups.
Knowledge of Admission Criteria by School Performance, Academic Track, and Use ofKey Agent
We found significant differences in 11th graders’ knowledge of admission criteria by schoolperformance. For UCD, students in the low-performing schools (82%) were less likely thanstudents in the mid-and high-performing schools (91% and 94%) to correctly ascertain theimportance of the SAT-I and one’s high school curriculum. These students were also more likelyto underestimate the importance of having an exceptional talent, compared to their peers in high-performing schools. Interestingly, students attending the middle-performing schools were theleast likely to overestimate the importance of a high school’s academic reputation.
Among the CSUS criteria, only two showed significant differences by school performance.Almost 90% of the students in middle-performing schools correctly estimated the importance ofhigh school curriculum for admission, a figure greater than that among students in high-performing schools (70%). Although the proportion is quite low (~6%), students attending low-performing schools were the most accurate regarding the lack of importance of the SAT-II foradmission to CSUS.
Analysis by academic track indicates striking differences in knowledge of CSUS criteria amongdual-honors and non-honors students. In every “very important” criterion, students in the highesttrack undervalued the criterion much more than their non-honors counterparts. The most strikingdifference is students’ assessment of the importance of senior-year grades. Only one quarter ofdual-honors students correctly believe senior grades to be important for admission, compared toabout 60% among non-honors students. Conversely, knowledge of UCD admission criteria isdistinguished very little by academic track.

25
It is apparent, then, that the significant undervaluing of CSUS admission criteria by dual-honorsstudents is likely due to their low estimation of the university’s academic competitiveness.Compared to non-honors students, dual-honors students also better understood that ability to paywas not important for UCD admission (17% vs. 4%) and the SAT-II was not important for CSUSadmission (6% vs. ~0%).
Finally, in our analysis of admission criteria knowledge by use of key agent, we found somesignificant differences. Surprisingly, students who had not spoken to a parent were much morelikely to understand that ability to pay did not matter for admission to both universities. Thosewho had not spoken to a parent about admission were more than three times as likely tounderstand this criterion for UCD (33% vs. 9%) and more than twice as likely for the CSUSpolicy (29% vs. 11%). A similar trend was apparent with regard to use of a counselor and the“ability to pay” criterion for UCD.
“Negative” parent effects were also evident for knowledge of the CSUS policy regarding SAT-Iand class rank, where students were again more likely to understand the importance of theadmission criterion if they did not speak to a parent about admission. There were two expectedtrends or positive relationships with use of a key agent. Students who had spoken to a teacher ora college representative were more likely to correctly understand the importance of theapplication essay for UCD, and counselors appeared to positively impact understanding of one’sclass rank in the admission process for CSUS.
“Parents’ estimates of tuition were more accurate than studentestimates, while their knowledge of curricular requirements
was less accurate.”
Parent Knowledge of Postsecondary Policies
In this final section, we include a brief analysis of parent data. We looked specifically at parentknowledge of tuition costs and curricular requirements at UCD and CSUS. In general, we foundno evidence of a relationship between student knowledge and parent knowledge. Parents’estimates of tuition were more accurate than student estimates, while their knowledge ofcurricular requirements was less accurate.
Parent Knowledge of Tuition
In terms of mean estimates, parents were much closer to actual tuition costs than were students.Still, compared to actual annual tuition of approximately $4,000 (UCD), $2000 (CSUS), and$300 (local community college), parents still greatly overestimated these costs at about $16,000,$11,000, and $5,000, respectively (Table 18). Unlike the analysis of the student data, there wereno significant differences in tuition estimates between parents of 9th and 11th graders.

26
TABLE 18. Parent Knowledge of Tuition.
Mean Estimate 9th 11th Total t-test
Institution (n=172) (n=156) (n=343) p-valueUC Davis $15,942 $17,021 $16,271 .860CSUS $10,145 $11,936 $11,006 .669Local Community College $4,566 $5,459 $4,907 .795
Note: Subgroup sample sizes may differ from total due to missing data.
Looking at all parents across SES and school performance categories, we observe the expectedpatterns clearly. As shown in Table 19, parents from higher SES backgrounds estimate tuitioncosts much more accurately than do mid- and low-SES parents. Because of large standarddeviations in tuition estimates as well as small cell sizes for the low-SES parents, however, onlythe mid-SES versus hi-SES differences were statistically significant. The bottom panel of thetable indicates that parents of children attending the low-performing schools are also most likelyto overestimate tuition costs at any of the three public institutions.
TABLE 19. Parent Knowledge of Tuition by SES and School Performance.
Mean Estimate by SES t-tests (p-values) Low-SES Mid-SES Hi-SES lo-mid mid-hi lo-hi
Institution (n=44) (n=106) (n=127)UC Davis $35,050 $12,504 $9,213 .222 .020 .162CSUS $27,880 $8,737 $5,528 .208 .015 .142Local Community College $17,298 $3,047 $1,569 .249 .090 .203
Mean Estimate by School Performance t-tests (p-values) Hi-Perf Mid-Perf Lo-Perf hi-mid mid-lo hi-lo
Institution (n=113) (n=111) (n=119)UC Davis $10,389 $9,830 $27,867 .600 .028 .033CSUS $6,040 $7,600 $19,298 .082 .048 .025Local Community College $1,821 $1,815 $11,113 .986 .057 .057
Note: Subgroup sample sizes may differ from total due to missing data.
Parent Knowledge of Curricular Requirements
Parent knowledge of the curricular requirements for admission to UCD and CSUS was no better,and perhaps a bit weaker, than that of students. The number of parents who knew the requirednumber of years for all six subjects was exceedingly low. Only 4 out of 433 parents knew all therequirements for UCD, and just 5 knew the requirements for CSUS. As was true for students, thetwo requirements that parents knew best—although at a lower percentage than students—were thosefor English and foreign language. For example, nearly 90% of the students in our sample correctlyreported the four-year English requirement for UCD, compared to just two-thirds of the parents.

27
Also, fewer parents appeared to know the math requirement (Table 20). While few parents knewall of the curricular requirements for either university, 40% knew at least three of the UCDrequirements and about 43% knew at least three of the CSUS requirements. These proportionswere slightly higher among the student responses. Unlike the student data, there were nosignificant differences in knowledge between parents of 9th and 11th graders.
TABLE 20. Parent Knowledge of Curricular Requirements by Grade.
Percent Among 9th 11th Total t-test
Course Requirement (n=215) (n=218) (n=433) p-valueUC Davis
Know English requirement (=4 years) 68.8 68.8 68.8 .995Know foreign lang req (=2 years) 50.7 43.1 46.9 .115Know soc science req (= 2 years) 34.9 31.7 33.3 .476Know lab science req (=2 years) 33.5 32.6 33.0 .839Know math requirement (=3 years) 31.2 25.2 28.2 .171Know visual/perf arts req (= 0 years) 7.4 7.8 7.6 .889Know 3 or more of 6 requirements 42.8 37.6 40.2 .273
CSU SacramentoKnow English requirement (=4 years) 60.0 61.5 60.7 .755Know foreign lang req (=2 years) 54.9 57.3 56.1 .608Know visual/perf arts req (= 1 year) 48.4 42.7 45.5 .234Know math requirement (=3 years) 31.2 35.8 33.5 .310Know lab science req (=1 year) 14.0 10.6 12.2 .282Know soc science req (= 1 year) 7.0 9.6 8.3 .317
Know 3 or more of 6 45.6 39.9 42.7 .234
Note: Subgroup sample sizes may differ from total due to missing data.
Table 21 illustrates the extent to which parents under- or over-estimated curricular requirements.Earlier in this section, we noted that students incorrectly reported math requirements becausethey tended to overestimate the number of years of math required for admission, particularly forUCD. Most parents also overestimated the math requirement for UCD but tended tounderestimate the requirement for CSUS.
Given that the math requirement for both universities is three years, parents may be erroneouslyassuming a higher requirement for the more selective UC campus, while many students assumethe maximum number of math courses (4) is required for either school. Levels of parent andstudent knowledge do not appear to be related. Correlations between the number of requirementsguessed correctly by parents and students are also somewhat weak (r = 0.15, p<.01 for CSUS andr = 0.24, p<.01 for UCD).

28
TABLE 21. Parent Knowledge of Math Requirements by Grade.
Percent Among 9th 11th Total t-test
Knowledge of Math Requirement (n=215) (n=218) (n=433) p-valueUC Davis
Underestimate (< 3 years) 29.3 32.6 30.9 .463Correct (=3 years Math) 31.2 25.2 28.2 .171Overestimate (> 3 years) 39.5 42.2 40.9 .574
CSU SacramentoUnderestimate (< 3 years) 41.9 36.7 39.3 .272Correct (=3 years Math) 31.2 35.8 33.5 .310Overestimate (> 3 years) 27.0 27.5 27.3 .899
Note: Subgroup sample sizes may differ from total due to missing data.
Surprisingly, we found no significant differences by school performance or SES for parentknowledge of three or more curricular requirements for either university. One additionaldistinguishing factor surfaced in our analysis, however. Parents who reported receiving courserequirement information from their child’s school were significantly more likely to know at leastthree of the CSUS requirements compared to those who said they had not received suchinformation (49% vs. 34%, respectively). A similar but smaller difference regarding UCDrequirements was also evident but not statistically significant.
SUMMARY OF FINDINGS
§ Using the selectivity of the institutions as a measure of the level of students’ aspirations,students of Asian descent, from higher SES families, in higher academic tracks, from higher-performing schools, and with higher GPAs displayed the highest aspirations.
§ Although students understood the relative costs of the three types of institutions, they greatlyoverestimated the costs. Students in low-performing schools were most likely to grosslyoverestimate the cost of UCD and a community college, and students in the high-performingschools were most likely to fall within the target range.
§ Students knew more about CSUS’s requirements than UCD’s. Students also demonstratedthe most accurate knowledge of English course requirements and much weaker knowledge ofmathematics requirements. On our surveys and in our focus groups, students in honorscourses displayed more specific knowledge than students in college-preparatory courses.Furthermore, students in the high-performing schools were the most knowledgeable aboutUCD’s requirements, while students in the low-performing schools were the mostknowledgeable of CSUS’s requirements.
“Students generally had a poor understanding of the English andmath placement exams at the two universities.”

29
§ Students generally had a poor understanding of the English and math placement exams at thetwo universities. Less than 30% of students knew CSUS’s placement exam policy and lessthan 20% of students knew UCD’s policy.
§ Students in the high- and mid-performing schools generally displayed a greaterunderstanding of admission selection criteria than students in the low-performing schools.
§ Overall, 60% of all students and two-thirds of 11th graders incorrectly rated race as animportant criterion for admission to UCD and CSUS.
§ Over 90% of juniors believed incorrectly that the ability to pay for college was a factor inUCD’s and CSUS’s admission selection processes.
§ Levels of parent and student college knowledge appear to be unrelated. Parents’ estimates oftuition were more accurate than student estimates, while their knowledge of curricularrequirements was less accurate.
About the Author
Anthony Lising Antonio is assistant professor of education at Stanford University, and assistantdirector of the Stanford Institute for Higher Education Research. Much of his research focuseson equity in access to higher education and college choice. Along with Andrea Venezia andMichael Kirst, he recently completed Betraying the College Dream, a research reportdocumenting the disparities in college knowledge among students in high- and low-performinghigh schools from high and low socioeconomic backgrounds.

31
Section 2
Linkages and Disjunctures:California’s K–12 andCommunity College Systems
by Andrea Conklin BueschelStanford University
with case study research by K.C. BoatsmanSanta Rosa Junior College
INTRODUCTION
This research seeks to better understand the transition from high school to community college byexamining the policies and practices that shape this juncture.1 It is hoped that the findings willplay a part in strengthening the linkage between higher education and the K–12 educationalsystem by 1) strengthening the preparation of high school students for college; 2) increasingcollege persistence and completion rates; and 3) providing better articulation between K–12curriculum frameworks, standards, and assessments, and those of higher education.
This report for Policy Analysis for California Education (PACE) provides descriptive analyses of thepolicies as well as the disjunctures that exist in both educational systems, and especially how theyaffect California community colleges. The original data comes from two California communitycolleges in the Sacramento metropolitan area, Cosumnes River College and Sacramento City College.2
This research focuses on:
§ The admissions and placement policies and practices for recent high school graduates whoare attending community college.
§ The transition environment for these students, and whether there are observed disjuncturesbetween high school and community college curricula, skills assessments, and courseplacement.
§ The types of transition services and programs available to students from high school tocommunity college, and from community college to a four-year institution.
1 This research was conducted as part of The Bridge Project: Strengthening K–16 Transition Policies, a five-yearstudy conducted in several states. This project, sponsored by the Stanford Institute for Higher Education Research(SIHER), was supported by The Pew Charitable Trust and the National Center for Postsecondary Improvement(NCPI) and its sponsor, the U.S. Department of Education, Office of Educational Research and Improvement.2 Additional community college research for the Bridge Project was conducted in Baltimore County, Maryland, andMetropolitan Portland, Oregon.

32
Rationale
Community colleges are understudied in higher education research, though they are the point ofentry for many higher education students. Over 1,100 community colleges in the U.S. serve overhalf of the U.S. undergraduate enrollment. In California they play a particularly important role.The California community college system has 108 colleges and serves 2.9 million students,making it the largest system of higher education in the world (http://www.cccco.edu).
Additional reasons for more research on community colleges include:
§ Completion rates of first-time, degree-seeking students at community colleges are quite lowfor both associates’ and bachelors’ degrees (Choy 2002).
“California community colleges provide most of the costlypostsecondary academic remediation needed by students to
complete a two- or four-year degree.”
§ California community colleges provide most of the costly postsecondary academicremediation needed by students to complete a two- or four-year degree.
§ Some California community colleges have an extensive history of collaboration with highschools. Other postsecondary educational institutions may benefit from these types ofpartnerships.
§ In times of economic downturn and increasing tuition, more people look to the communitycollege for postsecondary education and training. An understanding of the role of theseinstitutions in the preparation of young people for the job market can benefit policydevelopment.
Given the large and significant role community colleges play in U.S. higher education, theBridge Project and PACE researchers undertook this study.3
RESEARCH METHODS
The qualitative study, focusing on two California community colleges, consisted of interviewswith key administrators, faculty, and staff; focus groups with students; and document review,including websites. Data were collected in 2001.4 Andrea Venezia and Michael Kirst, directors
3 The research for the California case studies was conducted by K.C. Boatsman. Additional analyses andcrosscutting work were done by Andrea Conklin Bueschel. This report contains additional resources and someupdates not included in either the technical report by Boatsman or the crosscutting analysis by Bueschel.4 Technical aspects of data collection and protocols used are available at http:/bridgeproject.stanford.edu or bycontacting the authors.

33
of the Bridge Project for the Stanford Institute on Higher Education Research, designed thenational study and provided the interview protocols used in this community college study.
Administrators, faculty, and staff interviewed by the researchers held key positions, and thuswere able to offer input on a range of topics, including counseling, assessment, admissions,partnerships, orientation, instruction, curriculum, and outreach. The student focus groupsincluded mostly students who matriculated soon after completing high school, as well as someolder students, and were representative of community college students in terms of gender andethnic diversity. In some cases the focus groups were drawn from existing groups, such as anactivity board or a college remedial class. Although the student sample may be biasedtowards more actively engaged students (since all participants were volunteers), studentswere still quite candid and critical in their comments, while also highlighting positive aspectsof their experiences.
The documents we reviewed included institutional publications such as catalogs and schedules ofclasses; handouts and informational fliers given to students; documents required of students suchas the application for admission; research reports where available; campus websites; and otherdocuments as appropriate.
In the report, we first provide a survey of the current literature on community colleges in the U.S.and their connections to other educational systems, both K–12 and four-year institutions relevantto California. Next we present an overview of findings from the research in California. Thereport concludes with policy recommendations and suggestions for additional research.
CONTEXT FOR CALIFORNIA AND U.S. COMMUNITY COLLEGE EDUCATION
Background
History
The first two-year institution5 in the United States was Joliet Junior College, which opened inIllinois in 1901 (AACC website). The growth in community colleges, especially since the 1960s,has been dramatic, and has surpassed that of four-year institutions. Between 1960 and 1990,four-year college enrollment doubled, while enrollment for two-year institutions increased five-fold (Rosenbaum 1999, citing NCES data). The dramatic growth in the 1960s was due in part toa newly-created national network of two-year institutions.
By the late 1990s there were 1,166 public and private community colleges, or about 1,600 whenseparate, multiple-campus colleges are included (AACC website). Over 100 million studentshave attended community college since the first one opened in 1901, pursuing everything fromautomotive technology to high school degree completion to English language acquisition to
5 Although this report uses the term “community college” for all two-year institutions, some references may still use“junior college.” For the purposes of this report, the terms are interchangeable.

34
advanced mathematics. Currently, over half of the undergraduates enrolled in the U.S. attendcommunity colleges (Bailey 2002).6
Enrollment Profile
Community college students represent a wide diversity of backgrounds. Students in two-yearinstitutions are likely to be older, more ethnically and racially diverse, and less affluent than theirfour-year counterparts. The following profile of community college students is based on datafrom the American Association of Community Colleges (AACC), in conjunction with othersurveys:
§ 58% are women.§ 30–60% are members of a racial minority group.§ 32% are 30 years or older, while 36% are 18–22 years.§ 64% attend part-time.§ 65% depend on their parents financially (compared to 95% of four-year students).§ half are the first in their families to attend college.§ 12–28% already have a postsecondary degree.
Of California community college students in the fall of 2000:
§ 56% were women.§ 48% were 24 years old or younger.§ 41% were white (http://www.cccco.edu/divisions/tris/mis/reports.htm).
Community colleges are the least expensive higher education option, which explains in part whysuch a wide range of students takes advantage of them. The average tuition for communitycolleges nationally is around $1,500, considerably less than for four-year institutions (AACCwebsite). California’s community colleges don’t charge tuition, and their fees are among thelowest in the country. At the time data was collected for this report, there was no tuition, andstudent fees were only $11/unit.7
Community colleges also have a different faculty profile than their four-year counterparts.Doctorates are not required for faculty at California community colleges, and there is a higherpercentage of part-time and adjunct faculty. Approximately two-thirds of public communitycollege faculty are on part-time appointments, and all faculty members are paid less than theirfour-year counterparts (AACC website). Two-year colleges also have a distinct mission of accessin higher education, which helps to account for their diverse student population.
One of the most significant trends in community college attendance is that they serve as thepoint-of-entry for some students who wouldn’t otherwise participate in postsecondary education.Low-income students, students of color, recent immigrants, and students who are the first in theirfamilies to attend college are often over-represented in two-year institutions. Because many of
6 A recent survey, Community College Survey of Student Engagement (2002), notes that only one in six of all two-and four-year undergraduates meets the stereotype of college student, that is, 18 to 24 years old, living on campus,and attending school full-time. A majority of the rest of the undergraduates attends community colleges.7 California’s recent budget crisis has affected community college funding, so these fees have been raised, althoughthey are still below national two-year and four-year average college tuitions.

35
these students do not believe that they have access to four-year institutions, the communitycolleges are the only way for them to expand their educational opportunities and prepare fora career.
According to the Census Bureau, about 85% of the growth in the national population of 18–24year olds will come from minority and immigrant families over the next decade. Over 40% willcome from low-income families (Kirst and Bracco 2002). In 2010, the California K–12 systemwill be 60% Latino, 20% white, 12% Asian/Asian American, and 8% African American(California State Department of Education 2002). Given these trends, community colleges arelikely to play a growing role in the higher education system.8
Mission
California community colleges are defined by their commitment to being open-accessinstitutions. Generally, if a student can benefit from education, that student is welcome.This philosophy has ensured that community colleges continue to serve students from allbackgrounds.
The mission of community colleges has broadened. “Starting primarily as junior colleges withan emphasis on academics, the [community] colleges are now complex institutions taking on abroad array of educational, social, and economic functions” (Bailey and Averianova 1999).Because these institutions were created to serve the public so directly, most feel obliged torespond to the changing needs of the community. Some critics contend that community collegesneed to narrow their focus in order to provide better service in fewer areas. Others argue that themission dictates the need to continue to offer a wide, and often growing, set of services andprograms.
Later in this report, research findings document this dilemma between the community college’scharge to maintain its commitment to open access, and the need to uphold standards for bothcollege-level work and industry-level expectations. Faculty and staff on community collegecampuses are often explicitly committed to the open-access mission. Indeed, they believe thatthey are best positioned to respond to the needs of the community, but struggle as open-accessinstitutions to find ways to meet those needs given limited resources. Grubb notes the particularstruggle of those trying to balance the various standards in their departments and institutions withmaintaining open and flexible policies (Grubb 1999).
The mission of community colleges will likely ensure that they will continue to be necessaryresources for all people in their communities. “Responding to educational needs often ignored byother institutions, community colleges have been profoundly transformed…These functions ofcommunity colleges define its unprecedented social and economic significance. No otherinstitution has demonstrated so much flexibility in adapting to the community’s needs” (Baileyand Averianova 1999, p. 5).
8 This growth is contingent, in part, on available financial support for low-income students.

36
Remediation and Preparation
In its reporting on higher education, the mainstream media has often fixated on the issue ofremediation. News stories frequently contain quotes from politicians expressing alarm thatcollege students, particularly those at four-year institutions, can’t read or write well enough tohandle college material. For some policymakers, the “solution” is to move all or most remedialwork to the community colleges. “A number of state and large urban public college systems areconsidering or have begun to implement policies that would locate all remediation within thecommunity college sector (see, for example, Florida, Massachusetts, Georgia, Texas, Virginia,and the CUNY system in New York City)” (Shaw 1997).
The need to remediate students who enter their institutions with limited basic skills has maderemedial education9 an increasingly important function for community colleges. Remedialcourses address basic levels of reading, writing, and mathematics, skills that should have beentaught before and during high school.10 Though remedial courses are offered on collegecampuses, they are not considered college-level work, and therefore usually cannot receivecollege-level credit.
“Various surveys report remediation rates of between 33% to 95%of entering community college students.”
It is quite difficult to track exactly how many students require remediation, because some areassessed to need it yet never enroll in the required courses. At community colleges, not allstudents are degree-seeking, so they are not required to enroll in these courses, despiteassessment results. Various surveys report remediation rates of between 33% to 95% of enteringstudents, depending on how it is measured and which group of students is included (for example,only degree-seeking students) (Shults 2002; The Abell Foundation 2002). Clifford Adelman,senior research analyst at the U.S. Department of Education, estimates that over 60% ofcommunity college students receive some sort of remediation.11
Our focus in this study is on high school students who enter community college. Unfortunatelystatistics on community college students are generally combined with those on students attendingfour-year colleges, which further complicates making useful estimates. While currently there isno composite remediation figure for California, the remediation rates in the case study collegesin this study were around 40% (see section on “Remedial Education/Overall Preparation” later inthis report).
9 The terms “developmental” and “basic skills” are also used. “Remedial” is used most often by researchers. All willbe used here.10 Bridge research did not evaluate the effectiveness of instruction for native speakers and English LanguageLearners, although other research has focused on it. In addition, most of the literature does not address how thoseskills are assessed. For an example, see Grubb (1999). Bridge Project research focuses on placement tests and theirrole in the high school to college transition. They will be discussed further in the section on Findings.11 Personal communication between C. Adelman and M.W. Kirst (April 2002).

37
Remediation in higher education highlights an important disjuncture between the K–12 andhigher education systems. The spiraling growth in remediation reported in the 1990s suggeststhat it is not just returning students who are “rusty” in algebra who need basic skills help. Ratherthere seem to be more students leaving high school without having mastered these skills in thefirst place.
While community colleges are perceived as welcoming of all students who want an education, asRosenbaum points out, they have failed to adequately communicate their standards for college-level work. After completing a nationwide study, Rosenbaum concluded, “Students’ failuresarise not from barriers inside colleges, but from a failure of colleges (and especially communitycolleges) to convey clear information about the preparation that high school students need inorder to have a strong chance of finishing a degree” (Rosenbaum 1999). By linking preparationto students’ persistence in completing their higher education, Bridge researchers focused on asignificant issue: translating access into success (Venezia, Kirst, and Antonio 2003).
Rosenbaum argues that if students are aware in advance of what it takes to succeed, they willadjust their behavior in high school and work to achieve at a higher level before matriculating.12
He notes that a sizable minority of students he surveyed (46%) agreed with the statement, “Evenif I do not work hard in high school, I can still make my future plans come true” (Rosenbaum1999). This “second chance” message from community colleges seems to be coming throughclearly for these students.
The message they are not hearing is that if they do not complete high school courseworksuccessfully, they may not be able to take the college courses they want or get college-levelcredit until completing non-credit remedial work. As noted in later sections, many students aresurprised by their lack of preparation, unaware that with remedial coursework it will take longerto complete their requirements and is likely to cost more because of the additional courses.
Despite the problems that can arise with unclear signals and lack of preparation, manycommunity college staff contend that the idea of second chances is integral to their schoolmission. In his work, Bailey found support for this view. “Weak high school preparation willalso continue to create a role for community colleges, essentially giving students a secondchance to prepare for college-level work” (Bailey 2002). At the same time, staff acknowledgethat more needs to be done to better prepare first-time students for college-level work.
Rosenbaum argues that the way to preempt remediation and subsequent failure in college is tocommunicate the importance of students’ “first chance” to be successful in high school. Hebelieves that the “college-for-all” norm may harm more students than it helps (Rosenbaum2001). “Second chances are a fundamental American tenet. However, open-admissions policiesand remedial programs inadvertently convey to students that high school is irrelevant and thatthere are no penalties for poor effort” (Rosenbaum 1999).
12 Although not conclusive, Bridge researchers have found that there are many possible influences and structuresthat could help address this signal (see also Rosenbaum 2001).

38
K–16 Links
K–16 reform efforts range from elementary curriculum alignment to transfer between selectiveuniversities. This report focuses on the transition between high school and college. The failure toadequately prepare high school graduates and their subsequent need for remediation in collegecalls attention to the lack of alignment of standards between the two systems. While not allstudents who complete high school have to or do go to college, a vast majority state an aspirationto go, and upwards of 70% will actually enroll in a postsecondary institution within a few yearsafter high school (The Education Trust 1999).
“The failure to adequately prepare high school graduates andtheir need for remediation in college calls attention to the lack of
alignment of standards between the two systems.”
Rosenbaum argues that not all of the blame lies with the colleges, or in their failure tocommunicate standards. “…[High school] guidance counselors do not tell students what level ofhigh school achievement is needed for them to succeed in community college, so students arelulled into a complacency that leaves them unprepared for getting a college degree” (Rosenbaum2001, p. 80).
Bridge Project research by Kirst and others has described the importance of signals for students.“The current fractured systems send students, their parents, and K-12 educators conflicting andvague messages about what students need to know and be able to do to enter and succeed in college.For example, [Bridge] research found that high school assessments often stress different knowledgeand skills than do college entrance and placement requirements” (Venezia et al 2003, p. 2).
The roots of this problem first began when the U.S. created two separate mass education systems(K–12 and higher education) that rarely collaborated to establish consistent standards.Historically, economically disadvantaged students are overrepresented in non-honors courses anddo not receive college admissions-related information from either school or non-school sources(Kirst and Venezia, forthcoming). According to Kirst et al, improving the policy signalingprocess and the alignment of K–16 policies will require mutual and collaborative actions by bothK–12 and community colleges.
Perhaps most importantly, implicit in Rosenbaum’s research is the notion that people andinstitutions from different educational sectors should work together to communicate appropriatesignals to students. Otherwise this lack of coordination can have additional detrimental effects onstudents: “Poor information allows many students to have high hopes but to use their high schoolexperiences poorly, and thus they seem to be personally responsible for their failures”(Rosenbaum 2001).
Less well-prepared students are more likely to attend two-year colleges, often because they donot meet entrance requirements for four-year institutions. What students may not realize is that,

39
despite their preparation, where they attend college is likely to affect their chances of completingtheir degree. As Melguizo (2003) explains, “The results of this study suggest that aftercontrolling for academic preparation, the type of institution attended had a large and significantimpact in the odds of completion” (pp. 23–24). Next we look at issues of persistence andPPtransfer, as well as completion.
Transfer/Persistence/Completion
Another key juncture for K–16 work is between institutions of higher education. One researcherfound that “70 % of recent high school graduates who begin their college careers at two-yearinstitutions expect to earn a bachelor’s degree” (Schneider 2003, p. 57). In other reports, fromone-quarter to over one-half of community college students report their intent to transfer (anotoriously tricky measure to track) (Cooley 2000; CCSSE 2002). Almost as hard to track is theactual rate of transfer for community college students.
Part of what makes this data difficult to collect, according to Choy, is that so many communitycollege students attend more than one institution. They often go back and forth betweeninstitutions. Because most institutions consider students successful if they persist from term toterm at the same institution, some students continuing their education elsewhere may get missed.As Choy notes, “Looking only at institutional data, it is difficult to track students’ successbecause they do not always follow a straight path to a degree” (Choy 2002).
Reported rates of transfer from two-year to four-year institutions range from 14% or 15% toabout 40% (Rosenbaum 2001; Wellman 2002; Young 2002). Regardless of the actualpercentage, consistently fewer students actually transfer than say they want to.13
Persistence and completion data is related to the issue of preparation. Additional analysessuggest that high school students who are less well-prepared for college and take remedialcourses are less likely to persist, transfer, and complete their education. Rosenbaum reports that“only 13.9% of seniors with low grades attained their college plans” (Rosenbaum 2001). Baileyalso sees a connection between poor preparation and lower rates of transfer and persistence.“Developmental education is a central component of the colleges’ mission to provide access;however, large numbers of poorly prepared students complicate college efforts to improvetransfer and graduation rates” (Bailey 2002). 13 Again noting the difficulty in tracking transfer data, Wellman (2002) says that one-third of all first-time, degree-seeking students transfer within four years of enrollment—one-fourth of four-year students and 43% of two-yearstudents. Rosenbaum’s research finds that about 60% of seniors who plan to get a postsecondary degree fail to getany degree in the next ten years, and the rates are worse for low-performers (Rosenbaum 2001). Young (2002)reports that 37% of students finish their bachelor’s degree in four years, and one-quarter finish their associate’sdegree in two years. A recent ACE report cites that “among those [community college students] who intended toearn a bachelor’s degree, only 39% actually transferred” (Choy 2002, p. 20). Bailey finds that “less than one tenth ofstudents who begin in two-year colleges ever complete a bachelor’s degree” (Bailey, 2002, p. 61). Schneider foundthat students who started at two-year institutions “are 28% less likely to receive a bachelor’s degree than comparablestudents who began their postsecondary career at a four-year institution” (Schneider 2003, p. 57). Although four-year completion rates are not as good as they should be, starting at a community college is considered a risk factorfor completion: “Starting at a two-year institution rather than a four-year institution with the intention of earning abachelor’s degree also was associated with a greater likelihood of leaving postsecondary education without havingearned a degree (46% versus 23%)” (Choy 2002, p. 20, citing U.S. Department of Education data). Again, it is clearthat there must be better coordination of signals and expectations in order to begin to improve the level of work forentering students and, therefore, their chances of persistence and completion.

40
There are many other examples of K–16 links in the existing literature. These include dual-enrollment programs for high school students at community colleges, honors programs incommunity colleges for high-achieving students intending to transfer to selective universities(Winter 2002), and forums for faculty from high schools and colleges to discuss curriculumalignment and expectations. Examples of these emerge in the research conducted for this study.
In the next section of this report, we look at the findings from research in California, includingstate-specific context issues for California community colleges.
EVOLUTION OF THE CALIFORNIA COMMUNITY COLLEGE SYSTEM
Context for the State
California has made great strides in aligning standards with assessments in K–12, as evidencedby the development and implementation of the Standardized Testing and Reporting (STAR)program. Unfortunately, efforts to improve compatibility and coherence between K–12 andhigher education have lagged behind such efforts. A recurring theme in the interviews conductedfor earlier Bridge Project research was the almost complete absence of communication betweenpolicymakers involved with postsecondary education (especially community colleges) and theirpolicymaking counterparts in secondary education.
Clearly the lack of communication, mission, and shared history between the K–12 and highereducation sectors of public education has resulted in the current state of misalignment amongpolicies that affect postsecondary transitions to higher education. Ironically, the separation ofthese two systems, while intended to increase efficiency, may actually have had the oppositeeffect with respect to serving the K–16 educational needs of the state.
California Master Plan for Higher Education.
The Master Plan for Higher Education in California helped to clarify the role and function ofcommunity colleges in the state. The first version of the plan, which was written in 1960, createda three-tiered system of higher education:
§ the University of California, a system of selective research universities for the top one-eighthof California’s matriculating students;
§ the California State University, a larger system of moderately selective institutions for the topone-third of California’s matriculating students; and
§ the Community Colleges, the most extensive system of institutions open to any student ableto benefit from continued education.
According to the Master Plan (as summarized by the University of California Office of the president):
The California Community Colleges have as their primary mission providingacademic and vocational instruction for older and younger students through the

41
first two years of undergraduate education (lower division). In addition to thisprimary mission, the Community Colleges are authorized to provide remedialinstruction, English as a Second Language courses, adult noncredit instruction,community service courses, and workforce training services(http://www.ucop.edu/acadinit/masplan).
The Master Plan established the principle of universal access to postsecondary education inCalifornia at the community college level, where all students “capable of benefiting frominstruction” were to be admitted. What resulted was two systems continuing down a path ofuncoordinated policy development surrounding secondary school student preparation andsuccess at California community colleges.
Today there are 108 community colleges in the California System. A 16-member Board ofGovernors, appointed by the state’s governor, oversees the 72 district, 108-campus system. Butlocal community colleges maintain considerable discretion, and the state does not have the finalsay in many crucial areas. For example, there is no statewide uniform placement exam, as thereis in some other states. Additionally, faculty and staff are employed by the district, not the state,which is different from the four-year institutions in California.
The Board of Governors is granted authority by the state legislature to develop and implementpolicy for the colleges in the system. The Board of Governors´ Regulations for CaliforniaCommunity Colleges are published in the California Code of Regulations, Title 5, Division 6. In2001, the California Community College system served between 2.5 and 3 million students,making it the largest system of higher education in the world.
Despite its size, it is expected to grow even larger based on projections for significant growthamong California’s 18- to 24-year olds over the next several years. According to Hayward et al.(2003), “The demand for higher education is expected to grow by 714,000 students between nowand the year 2010.” Because a majority of these new students are likely to begin highereducation in community colleges, including large populations of Latino students, “it is expectedthat almost three-fourths of this growth will occur in California’s community colleges” (ibid.).There are many other issues associated with this kind of growth including budget, space, andtime resource limitations, so it is likely that the community colleges will need to be at the centerof policy discussions.
It is helpful to put this information in a larger context. Although for years California’s system ofhigher education has been a national model, it currently does not have a good record of reachingor graduating students. “California ranks 35th out of the 50 states in the ratio of baccalaureatedegree awards to high school graduates six years earlier and 46th in the number of baccalaureatedegrees awarded per 100 graduates” (Hayward et al. 2003). California community colleges mustplay a more vital role in increasing four-year college graduation rates by preparing the largegroup anticipated to start at community colleges and then transfer to four-year institutions, aswell as providing coherent vocational education.
In the context of K–16 education, California’s community colleges have not played a significantrole in any of the efforts to align policies or practices across sectors. Although there are manyformal articulation agreements between the two- and four-year institutions, in their findings,Hayward et al. highlight the weak high school-community college connection and the many missing
42
or misaligned K–14 signals or policies. They argue that better high school-community collegecoordination will improve successful transfer. “Common understanding regarding course expectations,course sequencing, and student academic performance at the community college and high schoollevels are part of the academic connection that facilitates transfer” (Hayward et al. 2003).
Limited capacity exacerbates the problem of lack of coordination between high schools andcommunity colleges. Those authors argue that “strengthening the academic connection betweencommunity colleges and high schools would have multiple benefits, including makingexpectations clear to students, sharing expertise and resources, and streamlining courseprogression” (ibid. p. 49).
Additionally, opportunities for faculty collaboration within and across sectors, cross-cuttingwork on curriculum (for example, on the California Standards Tests), improved dual enrollment,and strengthened and consistent outreach can create better educational experiences and improvedcompletion and transfer rates (Hayward et al. 2003). It is worth focusing on and investing inthese efforts because those community college students who are able to transfer to four-yearschools tend to perform as well as students who enter as freshmen. Clearly the role ofcommunity colleges in California’s higher education system is significant and growing,especially for students of color.14
OVERVIEW OF CALIFORNIA CASE FINDINGS
Background/Mission
While community college campuses serve different communities and populations, as withcommunity colleges nationally, these schools share a strong commitment to providingeducational opportunity to any student who can benefit from it. From 12% to 28% of studentsattending community colleges already have bachelors’ or other advanced degrees; anywherefrom 25% to 80% require some remediation. The commitment to meet students where they are isthe most defining characteristic of community colleges and also often the greatest challenge.Below are descriptions of the campuses studied.
Sacramento City College.
Sacramento City College (SCC) was founded in 1916. As a result of a March 1964 election, itjoined American River College to form the newly-organized Los Rios Junior College District. In1970 the district name was changed to the Los Rios Community College District when thedistrict opened a third campus, Cosumnes River College. In the fall 2000 semester, SacramentoCity College enrolled 21,186 students. The student body is 58% female, ethnically diverse (42%white, 21% Asian, 15% Hispanic, 12% black) and relatively young (55% of the students were 24years of age or less compared to 48% of community college students statewide). Internationalstudents at the college come from approximately 55 different nations. As one administrator putit, “our campus is blessed with wonderful diversity.”
14 Projections for growth are greatest in Southern California and the Central Valley, areas with large Latinopopulations.

43
Cosumnes River College
Cosumnes River College (CRC) was founded in 1970 as the third college in the Los Rios CommunityCollege District. Although it enrolls over 16,000 students, it has the feel of a small campus. Thestudent population is just over half of that of its sister colleges, American River and SacramentoCity. There is a physical center to the campus, and a busy student center, which probably allowsfor more casual interaction than at the other two campuses in the district. On average, there isless ethnic and racial diversity at CRC, and, like other campuses, there are more women than men.
According to the district research office, 35% of 1999 graduates from the top 25 feeder highschools attended a Los Rios college in the fall of 1999 (LRCCD Research Brief, January 2001;LRCCD High School Graduation Data).
Student View of Institutional Mission
The reasons for attending community colleges are as diverse as the student body. In the focusgroups, researchers heard students cite location, cost, specific programs, lack of other options,and convenience. Several of these responses (and others) mirrored the mission of communitycolleges cited above to provide convenient, low-cost education. Consistently researchers alsoheard students refer to community college as an opportunity for a “second chance” at a collegeeducation. Below are some typical student explanations for their choices.
I chose CRC because I live five minutes away, and I also went to high schoolacross the street.
I came here because I really didn’t know what I wanted to do yet. And it’s like theonly school that’s somewhat near me…and it’s cheap.
I didn’t have a high school diploma, and I really needed to do something, and Ihadn’t had a job, didn’t have any job skills…so I came here.
Based on focus group data, it appears that the message of access, convenience, and secondchance seems to be reaching students before they apply to community college. However, theyseem to know considerably less about enrollment and matriculation requirements.
Below we describe in greater detail some of the logistical aspects of admissions, financial aid,tuition, placement, and preparation issues, as well as student understanding of these policies.
Admission/Enrollment
Because the institutions in this study, like most community colleges, maintain an openadmissions policy, admissions staff do not perform a traditional gatekeeping role. While they dosome recruiting at area high schools, the admissions office serves primarily as the point of entryfor enrollment and registration, and is often the first unit at a college to communicate placementrequirements. Students can show up the day before classes start and enroll for that term,

44
providing they have met certain basic requirements.15 This ease of enrollment embraces both themission of the institution—providing opportunity for all—and the challenge of working withstudents who may have little sense of what they want.
In compliance with state mandates, both Sacramento City College and Cosumnes River Collegehave an open admissions policy. Students may apply in person or through the mail. Theapplication can be downloaded at the colleges’ websites, is distributed to all feeder high schools,is available at various locations on campus, and is mailed to individuals upon request. At thetime data was collected for this study, both schools had plans underway to provide onlineregistration within two years time.
Once an application is received, applicants are sent a letter informing them of the next steps totake in order to matriculate to the college. Since admission is open, students may apply at anytime of the year. The college recommends (but does not require) that new students under the ageof 21 submit high school transcripts.
At the community colleges studied, recent high school graduates made up a significant subset ofenrolled students. There are reports of some community colleges trying to attract recent highschool graduates who might otherwise start at four-year institutions (see the New York Timesarticle by Winter on higher achieving students attending community colleges). The growth inenrollment of recent graduates has also raised concern because it highlights their lack ofpreparation, a trend that will be discussed in greater detail later on.
Given the high percentage of recent high school graduates attending community colleges, theinstitutions in this study tend to have relationships with area or district high schools. Admissionsstaff members provide general orientations to high school students about community college. Inmany cases, existing programs and partnerships (see “Outreach/Special Programs/K-16 Links” laterin this report) are the point of contact between high school students and the community colleges.
Unlike community colleges in other states, which recruit as many students as possible for theirprograms, most California colleges and community college districts generally do not haveaggressive secondary school outreach practices. There is even a funding disincentive in place forrecruiting too many new students. Even when colleges go “over cap” by enrolling more studentsthan projected by the Chancellor’s Office (using past enrollment figures), the overallapportionment is not increased. Therefore, the average amount the college gets paid per FullTime Equivalent Student (FTES) is lowered, meaning that less is spent on each student.
Thus, unless a community college is experiencing declining enrollment, there is no economicincentive to increase enrollment by recruiting more students. This policy is particularly significantgiven that the number of students seeking admission to California community colleges isexpected to grow by over half a million students over the next ten years (Hayward et al 2003).16
The combination of open admissions and increasing enrollments poses a dilemma for communitycolleges. They must still find a way to maintain academic standards for college-level work. As
15 The most common requirements for admission are a high school diploma or GED, or being 18 years or older. Forhigh school students (and in some cases international students) there are often different procedures.16 Community colleges with large numbers of Latino students could be harmed the most, as Latinos are the fastestgrowing population of college students.

45
one Bridge Project researcher noted, the open admissions policy may convey the impression thatany student may register for any course. Also in effect, however, are mandatory placement testsand course placement policies that require remedial education prior to college-level enrollment.
.”California community colleges must still find a way to maintainacademic standards for college-level work despite open
admissions and increasing enrollments.”
Although there are courses that don’t require passing the placement exams, some disciplines outsideof English and mathematics require certain performance levels on those exams (for example, acertain level of reading comprehension for a history course). In many community colleges, openadmissions is preserved by ensuring that the first course in a prerequisite sequence is open tostudents of all abilities. In general, staff members are committed to the open admissions policy andphilosophy, as there are always examples of students whose lives are changed by the experience.As one instructor noted, “As a community college, we are prepared for anyone. We really are.”
Tuition
While California community colleges do not charge tuition, until recently there was an $11 perunit enrollment fee (well below the national average). Given the current budget crisis inCalifornia, however, this fee was raised to $18 per unit for fall 2003, still lower than the nationalaverage. In addition, there are often other fees that community college students must pay forthings such as parking, technology, student activities, etc. All the institutions in this study alsocharge higher fees for out-of-state and international residents. In most cases, some of the appliedprograms such as dental hygiene have higher fees associated with them.
Financial Aid
Both of the institutions in the study have financial aid offices that coordinate federal, state, local,and institutional support for all students who qualify. All of the campuses have seen an increasein demand for aid in recent years. The downturn in the economy and the “echo boom” (childrenof baby boomer-aged parents) are offered as explanations. One of the most difficult aspects ofthe job for community college financial aid officers is the timing of aid requests. Unlike mostfour-year college students, many community college students don’t know several months inadvance that they need to apply for federal and state financial aid. Aside from a general lack ofawareness about filing deadlines, many students don’t decide to attend community college untilright before the academic term begins. It can come as a surprise when students realize they willnot be able to get financial aid immediately upon enrolling.
Another point of concern is financial aid for developmental or remedial education. A studentwho requires several terms of financial aid for non-credit work must be careful not to use upeligibility for government support. Currently, there is a 150% rule for federal funding that
46
allows for additional pre-credit coursework and provides additional eligibility, provided itcompensates for secondary-level coursework.17
Placement
Placement policies highlight several of the important disjuncture issues raised by the six-stateBridge Project. Our findings showed that a majority of students were unaware of the need to takeplacement tests before registering at any college or university, let alone what the content of thosetests might be. In our broader research, community college students were particularly surprisedto learn this, given the general understanding that anyone can attend a community college.Placement tests communicate, indirectly and belatedly, that there are standards for college-levelwork, and many students are surprised when their skills are assessed below that level. Onestudent explains what she discovered in the testing process:
I took an assessment test and as everybody knows, I do really horrible at testsbecause I have test anxiety. So I’m placed in classes that are like really way tooeasy for me. Like when it comes to just assignments and stuff like that. And then Iwas out of math for three years. And so I know that the math, I was placedcorrectly, but the English I was not placed correctly because of the time constraintand all of that kind of stuff.
Assessments vary from state to state and from campus to campus (and in some places fromdepartment to department). In most places, reading, writing, and math skills are assessed.California’s definition of assessment is broadly inclusive and is a product of Title 5. While itaffords individual colleges a fair amount of latitude in their choice of assessments, the freedomto choose also results in some confusion for both students and staff. Individual campuses anddistricts may choose assessment instruments from the Chancellor’s list, or they may use otherforms of assessment (including instruments they have developed themselves such as writingsamples). However, these must have gone through content review, criterion or consequentialvalidation, and other tests for reliability and non-bias as appropriate (see California CommunityColleges Matriculation Standards/Regulations, and California Community Colleges Chancellor’sOffice Assessment Standards).
There are no standard placement tests in the California Community Colleges, and colleges in thesame district often use different placement assessments. There is a list of approved assessmentsfrom the Chancellor’s Office. The placement process is proscribed by Title 5, which disallowsany single instrument from being used to place students into the curriculum. Instead, multiplemeasures must be used. In practice, campuses often use an assessment test score in conjunctionwith other predictors of student success, such as high school GPA, recent related coursework,etc. These policies create challenges and confusion at all levels, as one administrator explains:
You know, every time we go to explain either to the high school or to the four-years the kind of legislation that now we live under in terms of our assessmentprocess [for placement], they just shake their heads. They cannot believe therigorous guidelines that we have to fall under with this stuff. And how much time
17 The 150% rule covers support for the number of credits for a degree (100%), plus additional support (up to 50%)for students who need remedial courses above the elementary level.

47
and money and energy that it consumes just to keep ourselves floating in theassessment process.
Although Sacramento City College (SCC) and Consumnes River College (CRC) are in the samedistrict, they do not use the same assessments for placement. For English and math, SCC usesEducation Testing Service’s ACCUPLACER (Reading Comprehension and Sentence Skillssubtests for English, and Arithmetic, Elementary Algebra, and College Level Math subtests formath). For English as a Second Language, the college uses Levels of English Proficiency(LOEP) along with a campus-administered writing sample. Since the ACCUPLACER and LOEPtests are available on-line, students may drop in and take the assessments on a space-availablebasis from Monday through Thursday or on Saturday.
Approximately 10,000 students per academic year take placement tests at SCC’s AssessmentCenter, and each student takes an average of 3.2 tests, for a total of about 32,000 tests administeredannually. Students are required to pick up their placement test results in person to protectconfidentiality, and results are not released to anyone other than the student, not even parents.
Cosumnes River College uses placement tests approved by the Chancellor’s Office (along withother multiple measures, as required by Title 5) to place students in English and math courses.For English, the college uses the CTEP or College Test for English Placement. For math, it usesthe MDTP or Mathematics Diagnostic Testing Project, an assessment also used at CSU and UC.
Approximately 6,000 placement tests are administered per academic year through the CRCassessment center. Since it does not have a dedicated testing facility, the center schedulesclassrooms on an as-available basis for placement tests. The tests are free-of-charge and areadministered on a regular, well-publicized schedule. Students may retake the placement testtwice within a six-month period. In line with Title 5 regulations, all placement instruments havebeen articulated with the college curriculum, and minimum passing scores have been establishedthrough a research-based process.
As Kirst (2000) points out, one of the shortcomings of the present placement testing system usedby community colleges is its lack of standardization and signaling, which can be overwhelmingfor students who are often required to take multiple assessments. “In the southeast United States,for example, in 1995 there were 125 combinations of 75 different placement tests devised byuniversities with scant regard to secondary school standards.” Given that most recent high schoolgraduates have already faced several standardized tests in high school—one of the consequencesof extensive K–12 reforms in California—it is not clear how students are made aware of andkeep track of the many assessments they are expected to take.
At the time of data collection for this study, the three sister colleges in the Los Rios district eachused different placement tests for math, English, and ESL, and did not have a cooperative agreementto honor each other’s placements. Inevitably this creates a confusing situation for students.
Many of the staff were asked by researchers about the possibility of using one of the existingK–12 statewide assessments for placement. California already has high school assessments thatmeasure students’ skills and abilities. However, none of the respondents had considered thisoption, even those who had been part of committees responsible for exploring possibleassessment tools for placement at their schools. While a few acknowledged this possibility, they

48
indicated that the K–12 statewide assessments would likely be used in conjunction with, but notin place of, their existing placement exams. Consequently, any policy change would not reducethe number of assessments students face in the transition from high school to college. 18
One administrator suggests what is needed to remedy the situation:
It is clear to me that if anything is going to be done it needs to be at our initiativeand with our perseverance. It is not going to come the other way [from K–12] or ithasn’t. Perhaps that will change. I think the key is getting faculty departmentstogether. It needs to have administrative support even though it cannot come fromthe administration.
However, even if faculty could agree to use the California K–12 assessments for placement intothe community college curriculum, the state examination would still have to go through communitycollege question-by-question content validation, and the cut-off scores would have to be normedand validated on a campus-by-campus basis, as required by Chancellor’s Office standards.
Students were also asked about placement and the assessment process. Interestingly, studentreaction to the placement process in the focus groups was varied. While some students talkedabout being surprised by the placement, few reported being upset about the requirement.19
Particularly for recent high school graduates, testing and assessment are a very common part oftheir educational experience. As one student explains,
When I took [the] assessment tests, they gave the math portion…last...So I justkinda like filled in answers so I didn’t want to take it anymore. So then when I gotmy test results back it said that it was inconclusive and I had to take another one.So I took another one. And I did pretty good on that one. So they put me in a mathclass. And I was in two classes, I had to take two math classes before I could takethe statistics class. And those two classes were pretty much a waste of time.
Given the responses in the student focus groups, the fact that the placement test could often beretaken seems to have lowered the stakes for most students.
Bridge Project researchers also found varied reactions among students in several states to theoutcomes of the assessment. Some staff report students being stunned by their poor performanceon the placement tests. For some students, this is the first time they realize that most of thecourses they can enroll in are college preparatory, and therefore cannot be taken for college-levelcredit. It is at this point that students become aware of their lack of preparation for college, andin some cases, the consequences of not working hard in high school.
In California, however, most students said they were not concerned about their placement testresults. They understood the need for them and were generally fine with where they were placed.In the words of one student:
18 The California State University is using K–12 assessments (for example, Grade 11 English and math tests) forfreshman placement. Perhaps community colleges will consider that option.19Students who had access to their local community college assessments while they were still in high school wereless likely to be surprised. Some institutions have partnered to expose students to expectations from the communitycolleges. Some of these partnerships will be described later.
49
I had to] start back with English at the remedial college level, which is still highschool level. But now because of the steps I had to take, I mean in my musicclasses, extra credit, I write essays. In my English 1A class I’m writing essays andgetting A’s and B’s….And I can see that if you take those steps it gives you thestrength and it makes the class a lot easier.
Regardless of when students become aware of the community colleges’ placement requirement,it is clear that all of the colleges are communicating it to students soon after admission, since it isoften required before students are allowed to register for courses. The responses below aretypical of students’ recollections as to when they first learned about the placement requirement:
All I know is I was supposed to take the assessment test or I couldn’t take Englishor math.
My best friend told me, and through high school in my junior and senior year Ialways heard grades above me talk about goin’ to CRC and takin’ theirassessment tests or going to a UC and taking their tests.
The teachers in high school told me.
In our schools they had announcements, like in the career center they had postersand bulletins that you need to take the assessment tests and the dates that youcould take them.
“Placement tests play an important role in community colleges,particularly given the absence of admissions
entrance examinations.”
Placement tests play an important role in community colleges, particularly given the absence ofadmissions entrance examinations. While California’s public educational system placestremendous emphasis on the K–12 state assessments, they are not used to guide placementdecisions at either community colleges or postsecondary technical schools. They are usedprimarily to reward or punish elementary and secondary schools depending on how well theymeet achievement goals. In fact, state law specifies that these K–12 tests cannot be part of highschool students’ transcripts. Consequently, community colleges could not find out the resultseven if they wanted to.
50
Advising/Counseling
Community college advisors spend a majority of their time on scheduling and academicplanning.20 Inevitably, there are too few advisors and counselors for the several thousandstudents found at most state community colleges. At some colleges, there is a more formaldistinction drawn between advisors and counselors: counselors usually possess differentprofessional training and deal with personal student issues.
Advisors are prepared to work with anyone who comes through their door, but often have limitedoptions to offer students who are not yet ready to handle college-level material. The issue ofacademic preparedness is central to how well staff members can serve their students. Every daycommunity college staff struggle with the best way to preserve the mission of the institutionwhile confronting the practical issues of underprepared students.
Although some students complained about not knowing what classes to take or whatrequirements to meet, others reported that help was available provided they sought it out. Evenso, most of the respondents indicated their campuses could use more staff for advising. Beloware a couple of student responses about how they first learned what was expected of them at acommunity college:
Totally the counselors, I mean they pretty much guided me the whole way…myinterest was business, and my counselor was telling me that along with thebusiness courses, I would have to take some general education courses for me toget my Associates, and entrance requirements to get into a four-year, so theypretty much helped me set it up.
It was initially a counselor that was like, “Here, you’ve been out of school for abit. This might help you.” Even encouraged me to go back. I was one point awayfrom being eligible to take English 1A. She was like go back and take the testagain. I’m sure you could get one more point. And sure enough I did. So it wasmostly the counselor.
Remedial Education/Overall Preparation
As is clear from our literature review and the early findings from the Bridge Project, the level ofacademic preparation of community college students is of central importance. Not only is it aconstant reminder of the lack of alignment between the K–12 and postsecondary educationalsystems, but it presents a tremendous challenge to those charged with addressing the gap.
All community colleges offer remedial or developmental courses.21 This function has been partof their mission from their inception.22 In the past, the assumption was that returning students
20 Students can be exempt from counseling if they meet the following criteria: 1) they possess an associate degree orhigher, or 2) they satisfy at least two of the following and do not wish to participate in counseling: they want toupgrade their job skills; they are enrolled in fewer than six units; they are concurrently enrolled in another post-secondary institution; or they do not possess a degree or have an occupational objective.21 For further information and discussion of remedial/developmental education, see Grubb (1999) and Koski andLevin (1997).
51
who were rusty in their skills would need opportunities to review basic concepts. However, inrecent years it has become clear that many recent high school graduates, as well as manyreturning students, have never learned the basic skills in the first place.
On all of the campuses in this study, staff were asked to describe the characteristics of enteringstudents who lacked basic skills. Math faculty at Cosumnes River College reported that studentsentering from high school often placed two levels below the highest math class they took in highschool. CRC math instructors are now meeting regularly with high school math instructors to tryto develop a uniform teaching approach.
Researchers found numerous other local, informal partnerships had formed as a result of theincreasing numbers of underprepared high school students entering community colleges. Thistrend is primarily responsible for the changes in and strengthening of placement policies. Althoughthe reported remediation rates range from small minorities of students in some communitycollege programs to sizable majorities in others, all of the colleges consider remediation animportant issue. 23 Below is some data on remediation at the campuses in our study.
The course numbering sequence at Sacramento City College shows all remedial education in the200–299 range, which includes non-degree applicable credit courses. Generally, remedialcoursework is offered in math, English, and ESL, although there are other non-degree applicable200-level courses (e.g., some human career development courses, tutoring, etc.). At SCC, one-quarter of the math sections offered are considered remedial, while approximately two-fifths ofthe English and ESL sections are considered remedial.
One administrator explained that these numbers would actually be higher if not for the large andwell-regarded adult education program in Sacramento, which remediates many students beforethey enter Sacramento City College. At CRC, one-third of the math sections are consideredremedial, while nearly two-thirds of the English and English-as-a-Second Language sectionsoffered are considered remedial (39% of English, 77% of ESL).
The students also talked about their lack of preparation. Some expressed frustration with theirhigh schools, upset that they had been passed along or told that their performance wasacceptable. Several students focused on their behavior and skills, rather than content knowledge.Some responses:
In my high school they didn’t prepare you for college at all. Well I had collegeprep classes, but my school, they’re so quick to pass you …when I got here I wasso used to bein’ in a fly-by [easy] class, I was like, OK, these teachers, they don’tcare if I come or not. I’m not gonna come. But when I got my transcript it was atotally different story. I was like, they’re not playin’ here.
I felt that my study skills were a problem. When I was in high school, I neverlearned how to study. And now, I have to.
22 California State University requires students who do not complete remediation within a set timeline to enroll in acommunity college and leave CSU.23 One of the challenges of this research is getting accurate counts of remedial courses and enrollments. Given thegrowing numbers of students taking remedial courses in college, most community colleges now conduct regularinstitutional research not only on enrollment, but also on student persistence and completion.

52
I wasn’t prepared…the first couple of semesters here I was spending like hoursand hours and hours of studying. And I talked to an EOPS counselor and she said,well, you don’t have any study skills. So she had me take…study skills. And nowI’m doing much better. You know, I don’t have to study ten hours a day just to geta B. But I wasn’t prepared. I thought I was, but I wasn’t.
There were also students who felt prepared for college and who attributed their success to it.
I felt like I was really prepared from high school. But it was hard for me my firstsemester. I didn’t want to be here. I really wanted to be at Berkeley. And mygrades weren’t as high as they were in high school. But I got the hang of it hereand I said you know, I still want to go to Berkeley, and so in order to do that Ineed to get out of here first. So, it was really rough. Just because a communitycollege, like, my friends claimed it had the reputation of being an extension tohigh school, and it really isn’t. And … I was really grateful that I came herebecause … the atmosphere… really brings you down to earth. So, I thought mytransition was like, it took a while to get there, but it’s good.
I think I was well prepared for college. Because in high school I was really good.I wasn’t skipping any classes like my friends did. They would go like, let’s go tothe movies, let’s skip this class. But I thought that it’s wrong, if you’re in highschool and you want to graduate and get a good grade you have to work hard.And I think I was really prepared. It’s helped me to be good in college.
Remediation, and the related issue of preparation, will continue to be a central focus forcommunity colleges. It will also provide the best opportunities for partnerships with K–12 andthe four-year institutions. Examples of K–16 links are described below.
Transfer/Persistence
Although intent data is difficult to track in community college, more and more students in two-year colleges aspire to complete their degrees at four-year institutions. Nationally, 70% of recentgraduates who enter community colleges aspire to get a bachelor’s degree, but many feweractually complete them. (Schneider 2003). Many of the students in the focus groups describedplans, often very specific, for getting their bachelors’ degrees. One challenge to tracking intent isthat students don’t need to complete the associate’s degree to transfer to a bachelor’s program.There are various agreements between two-year and four-year institutions regarding the transferof students. In some cases, the articulation agreements are quite formal, offering statewidestandards for all public institutions. In others the partnerships are local, between two institutions,including some private colleges.
In California, the Master Plan for Higher Education charges the UC and CSU systems withgiving preferential admissions to qualified California community college students. Generally astudent is considered qualified if they have completed 56 transferable units with a grade of C orbetter. There are no specific intersegmental transfer policies—each community college or districtmust work out articulation agreements with individual UC and CSU campuses. Some individualcommunity college campuses and districts have developed Transfer Articulation Agreements and

53
specific guaranteed admissions plans with public and private four-year colleges and universities.Both SCC and CRC have multiple articulation agreements with institutions throughout the state.For both colleges, CSU-Sacramento is the most popular place to transfer.
In addition to individual Transfer Centers in California, there is an official statewide repositoryof transfer information in the form of a web-interfaced database, called ASSIST (ArticulationSystem Stimulating Interinstitutional Student Transfer). Designed for student as well asprofessional use, this database lists by institution accepted transferable courses, and specificarticulation agreements between two campuses. All public postsecondary institutions inCalifornia are included in the database, but private/independent colleges are not.
Persistence and completion data can also be difficult to track, in part because student intent datais difficult to track (e.g., Did that student intend to take only one class?). Most communitycollege researchers try to track term-to-term persistence. As noted in the literature above, generallypersistence rates are lower at two-year than four-year colleges. The explanations offered includethe different populations (age and background), different financial and family commitments,different levels of preparation, and different intentions (some students leave after completing acoherent set of vocational education courses). It is clear, however, that students who are requiredto take remedial or developmental coursework are less likely to persist or complete.
Community college students do not often follow a linear path through their postsecondaryeducation. In an effort to understand better how students in the Portland Metropolitan Area wereprogressing, several postsecondary institutional researchers studied student paths. They foundnot only that two-thirds of students’ followed a “swirl” academic path (moving in and out ofseveral institutions), but that the nature of that swirl affected the students’ progress andattainment (Bach et al. 2000). Perhaps not surprisingly, within the current system, those whofollowed the traditional, linear path were most successful in attainment.
Outreach/Special Programs/K–16 Links
All of the community colleges in this study have relationships with secondary schools, fromformal articulation agreements to informal relationships between individuals on the campuses.All of the institutions provide opportunities for high school students to get to know thecommunity college. In most cases, high school students can enroll in community college classeson campus (with appropriate permission and a skills assessment), can take community collegecourses and receive college credit for them at their high school, and can take one of thecommunity college assessments in high school (to give them a sense of community collegestandards), among many other options. Unfortunately, there are limitations to these partnerships.As one administrator notes,
I think people [in the high schools] are overworked…they’re just terriblyoverworked….Teachers are having incredible demands [placed] on them with theextra pressures from the accountability and the testing, and popular opinion ofeducation systems being a sorry sort.
Despite multiple points of connection between systems, there was a very clear message from allof the community college respondents that the K–12 reforms— including new academicstandards and assessments in the high schools—have had very little or no bearing on what

54
happens at the community colleges. The colleges are still going to conduct their own assessmentsof students’ skills and abilities; they want no part of the myriad reforms going on in K–12. Partof the reason for this is that many community college administrators know very little about theK–12 reforms, and often their limited information comes from having children in the system orfrom the local media.
“The K–12 reforms— including new academic standards andassessments in the high schools—have had very little bearing on
what happens at the community colleges.“
One thing that became clear in the course of this research is that although there are few, if any,formal K–16 efforts state- or system-wide, there are many local partnerships between K–12 andthe community colleges. Below are some examples.
§ At SCC, the Assessment Center offers placement tests during the spring at local high schoolsthrough a program called Senior Assessment for College (SAC). High school seniors areinvited to complete basic skills assessment in math and English on their high school campus,and then are invited to attend an orientation at Sacramento City College. Once they completethe process, which includes some counseling at orientation, they are granted priority registration.Approximately 1,200 students were assessed at 16 local high schools in spring 2001.
§ English 1A and 1C are taught regularly by Sacramento City College faculty at neighboringMcClatchy High School. The college is limited to offering only coursework that is abovehigh school level at the high school site, and at times it is difficult to get enough qualified,interested students to enroll in these classes. Still, the English department plans to offerclasses at other local high schools in the future.
§ Sacramento City College has many innovative programs with four-year colleges anduniversities. CSU Sacramento offers students at Sacramento City College the chance to takeone free class through the Crossover Enrollment Program. This program allows students whoare enrolled in nine units at SCC to enroll in one class at CSUS for no fee other than the costof books and materials. UC Davis allows students who have fall semester TransferAdmissions Agreements (for guaranteed transfer) on file to take one free class the springprior to their full-time enrollment at UC Davis.
• At CRC, various faculty members interact regularly with high school teachers, especially inthe areas of math, English, and ESL. The math instructors discuss high school graduationrequirements and better ways to articulate high school math with college math. Mathinstructors at both levels have also discussed approaches to teaching math with the goal ofcoordinating services.
The college English faculty has a long-standing relationship with local high school Englishteachers. In the past, high school English teachers would suggest course placement forformer students now enrolling in English courses at Cosumnes River College. When the

55
college realized this practice was contrary to Title 5 regulations, it was discontinued, but thetwo groups of English instructors continued to meet. Currently, the high school instructors inthe Elk Grove Unified School District are hired as readers to evaluate and norm the finalessay examination for CRC students enrolled in English 57. In addition, many of the CRCcourses offered at the high schools are taught by high school instructors who meet theminimum qualifications to be community college instructors.
These various partnerships, both formal and informal, are good examples of practical ways tostrengthen K–16 articulation. It is clear that there are many people who are committed to findingways to make students’ educational experiences a series of successful transitions. While at presentthese efforts remain primarily local in scope, they provide models for possible wider-rangingplans. One of the respondents sums up the sentiment expressed by many others in this study:
Probably just like everybody else [I believe it should be] a seamless flow for thestudents. The content, the knowledge they had in high school, should be afoundation for them to be successful in college. That transition should be assmooth as possible. They should be able to walk into those [college] classes andfeel confident.
SUMMARY
Below is a summary of findings from the study. These were based on data from the BridgeProject, and augmented by findings in other research literature.
§ There is a growing population of younger students on community college campuses. Someare recent high school graduates, while many others have not completed high school. Thecommunity colleges have increased opportunities for students to take college-level courseswhile still in high school. There are also examples of other arrangements, such as makingthese courses available to home-schooled children.
§ The mission of the community college was evident in the two schools studied. They offeredstudents low-cost, convenient alternatives in an educational environment of open access andhigh standards. Staff and faculty were clearly committed to working with students of all abilities.
§ The growth in the percentage of younger students attending community colleges hashighlighted the lack of preparedness of many high school graduates. Unlike older returningstudents who tend to be a bit “rusty” in basic skills due to the time that has elapsed since theygraduated from high school, some recent high school students have never mastered thematerial. As one California staff member says, “We’re seeing students coming out of highschool [who are] not ready for community college work, and community college students notready at the CSUs.” Additional remediation is necessary, but the disjuncture in academicpreparedness highlights the need for better alignment of standards and expectations.
§ Many students entering community college do not seem to appreciate that they will not beable to handle college-level work if they didn’t achieve at a certain level in high school. Asone instructor explains,

56
The transition between high school and the community college is an odd one formany people. For some students, the first year of community college is grade 13.It seems that they are just continuing on—all of their friends are coming here,they are just moving along with the pack. There’s not even necessarily (for someof the first-year students) an acknowledgement…that this is even college.
§ Despite a lack of information about the multitude of required placement tests, studentsgenerally weren’t upset about having to take them. Although some mentioned being unhappywith the results, fairly liberal policies to retake exams allow for some negotiation.
§ The connection between two-year and four-year colleges is becoming more formal in someplaces. While articulation agreements are common, only co-admit or dual enrollmentarrangements produce specific curricular discussions about standards and expectationsamong members of the campuses.
§ Many faculty talk about the tension of being “in-between.” Community colleges can beperceived as an extension of high school and the start of a bachelor’s degree; they acceptanyone who enters, but have advanced and restricted entry programs. Most believe stronglyin the community college mission, but acknowledge the difficulty of balancing it. Oneadministrator compared community colleges to Janus, the two-headed Roman god of gatesand doors, who must look in both directions—behind and ahead. The administrator said thecommunity college must, “look in two directions. Any change we make in this level has towork with the sequence of getting people ready for transfer as well.”
§ There is a general lack of awareness on the part of administrative staff and faculty of K–12reform efforts—especially standards and assessments faced by high school students, and insome cases also K–16 efforts. What community colleges know tends to be a result of generalperception (e.g., media coverage) or of personal connection (e.g., child in the K–12 system).There is little sense of any statewide formal efforts to work between the systems, as forexample, by using one of the high school statewide assessments as a placement tool.However, individual partnerships between specific community colleges and high schoolsseem to be flourishing.
§ Students speak positively about their choice to attend community college, usuallyhighlighting convenience, cost, and smaller class size. They note that there is no“handholding,” but that resources are available to those who seek them.
POLICY IMPLICATIONS
The study’s findings point to the need for a number of changes in policies and practices thataffect California students’ transition from high school to college.
57
§ Track signals to students regarding expectations and requirements for enteringcommunity college.
High school students are getting the message that two-year institutions are open to everyone,but many do not understand what is expected of them in college, nor the level of academicpreparation required of them to handle college-level work.
§ Track more carefully the signals around placement.
The issues surrounding community college placement were significant in this report, but areoften only addressed in other research as it relates to remediation. Unlike in other states,California students in this study were not surprised by placement requirements or test results.It may be that some of the early signals students are receiving from high schools, friends, andcounselors have helped communicate some of these expectations, although not for specificcontent and skills. It is worth looking more closely at how that information is communicatedto students and whether this makes a difference.
“It is important to communicate clearly what is expected of entering students.”
The large number of secondary school students now entering the community college systemin California warrants that K–12 and community college educators place greater emphasis onthe role of placement tests before students graduate from high school. It is clear thatremediation lowers a student’s chances of completing college, increases costs, and is not thebest way for a student to start college, as remedial students are less likely to persist. Giventhese factors, it is important to communicate clearly what is expected of entering students.
§ The legislature should repeal the ban to include California standards tests in highschool transcripts.
Community colleges can use these tests for placement information, which would not onlyreduce costs, but would prevent surprises for students unaware of postsecondary placement.In addition, if students are aware that colleges and universities will have this information,they might be more likely to try harder on the standards tests, providing more reliable data toboth high schools and colleges.
§ Study more deeply the issue of the lack of academic preparation.
The lack of adequate preparation for college is a growing and persistent issue, particularly forrecent high school graduates. This report highlights some of its consequences. However,there is need for more research on the most effective ways to use existing points ofconnection and develop new ones between the K–12 and community college systems in orderto address this problem.

58
§ Create a larger role in K–16 work for community colleges.
Few community colleges have had any role in state and national K–16 reform efforts. Itwould appear that the informal and local partnerships with K–12 would make communitycolleges prime candidates for intersegmental coordination. However, any proposed solutionswill have to address the fact that community colleges are already strapped for resources, andwill need additional funds to take on new leadership roles.
§ Community colleges should review the K–12 state standards and assessments.
Each subject matter exam for the California Standards Test has five levels (advanced,proficient, basic, below basic, well below basic). Perhaps one of these performance levelscould be equated to community college placement standards for credit-level, non-remedialcourses. After taking the test in tenth or eleventh grade, high school students could beadvised about where they are likely to place in the community college curriculum, based ontheir current academic achievement. The senior year could then be used for intensiveacademic preparation to avoid community college remediation.
§ Send clearer signals about realistic transfer possibilities.
Despite a decrease in the skills and abilities of many entering community college students,many students who enter a two-year institution expect to transfer to a four-year program.Rosenbaum (2001) talks about how to temper those aspirations and to provide alternatives.Students need to understand not only what it takes to succeed in transfer, but that basicliteracy skills are necessary for occupational and vocational programs too. While higheraspirations can influence attainment, a lack of good information about what it takes totransfer, particularly before entering community college, means that many students are notpersisting or completing, despite their aspirations. Good data is needed on persistence andcompletion, and data on student aspirations will help to complete the picture.
§ Conduct more research on the community college role as the point of entry forspecific populations.
Community colleges are the place where a majority of first-generation students and studentsof color begin their college education. Since students from these groups are expected to beginattending California community colleges in increasing numbers, it is especially important tounderstand the progress of students of color, immigrant students, and low-income students,and how they navigate the system and enter college.
§ Collect more and better data on students moving in and through community colleges.
Data are notoriously difficult to collect on community college campuses. More and morecolleges have formal institutional research operations, and more states are developing orrefining statewide data-sharing systems. Even so, the transitory and “swirling” nature ofstudent enrollment means that some of the data collection problems will continue to be

59
difficult to address. The California K–12 system plans to use student identifiers to trackcohorts of students as part of the federal No Child Left Behind compliance.
§ Focus a greater percentage of higher education research on the community colleges.
Not enough research is being conducted on California’s community colleges. As a result,there are many gaps in current knowledge. Some areas for future study include: the linksbetween community colleges and other educational segments; student progress within andbetween multiple institutions; the historical tension of access and standards; the faculty andstaff experience at two-year vs. four-year institutions; and other policies and practices thataffect successful delivery of education (e.g., financial aid policies, programs for at-riskstudents, etc.).
California community colleges play a central role in the United States system of postsecondaryeducation, yet the amount of research on community colleges is not commensurate with that role.Given the growing number of students participating in a community collegeeducation—particularly students of color, low-income students and first generation students—itseems clear that this population and these institutions warrant greater attention.
REFERENCES
The Abell Foundation. (2002). Baltimore City Community College at the crossroads. A report tothe foundation.
American Association of Community Colleges. (2002). AACC Website. http://aacc.nche.edu
Bach, S.K., et al. (2000). Student Attendance Patterns and Performance in an Urban Post-Secondary Environment. Research in Higher Education 41(3): 315–330.
Bailey, T. (2002). Community colleges in the 21st century: Challenges and opportunities. In Theknowledge economy and postsecondary education: Report of a workshop. Washington,DC: National Academies Press.
Bailey, T. and I. Averianova. (1999). Multiple missions of community colleges: Conflicting orcomplementary? Community College Research Center (CCRC) Brief. New York, NY:CCRC.
Bartindale, B. (2001). Dual-track UC entry guarantee is proposed. San Jose Mercury News, July17.
California Community Colleges. Chancellor’s Office documents.California master plan for higher education.California Postsecondary Education Commission performance indicators of California higher
education, 2000.California Postsecondary Education Commission data on transfer.California Postsecondary Education Commission transfer study.Project Assist.

60
Impac (intersegmental major preparation articulated curriculum).California Postsecondary Education Commission reports.California community colleges good practice for the implementation of prerequisites.Partnership for excellence.University of California transfers.Transfer capacity and readiness in California community colleges.California community colleges matriculation standards/regulations, and ed code.Chancellor’s office list of approved assessment instruments.California community colleges chancellor’s office assessment standards.AB 1918, access to transfer information for Community College Students Act, 2000.
California State Department of Education. (2002). Personal communication from William Padia.
Choy, S.P. (2002). Access and persistence: Findings from 10 years of longitudinal research onstudents. American Council on Education, Center for Policy Analysis: Washington, DC.
Community College Survey of Student Engagement, (2002). Engaging community colleges : Afirst look. Austin, TX : Community College Survey of Student Engagement.
Cooley, R.J. (2000). The American community college turns 100: A look at its students,programs, and prospects. Princeton, NJ: Educational Testing Service.
Cosumnes River College documents: matriculation plan, 1999–2000; consent forms; interview schedule;student consents; student newspaper; student guide; 2001-2002 college catalog; summer/fall2001 class schedule; orientation schedule; general information; org chart; curriculum; assessmentschedule; orientation packet; counseling/transfer handouts; newspaper.
Day, P.R., Jr. and R.H. McCabe (1997). Remedial education : A social and economic imperative.Executive Issue Paper published by American Association of Community Colleges.Washington, DC : American Association of Community Colleges.
The Education Trust. (1999). Ticket to Nowhere. Washington, DC: The Education Trust.
Gehring, J. (2001). High school, with a college twist. Education Week, March 14.
Grubb, W.N. (2002). Using community colleges to reconnect disconnected youth. Menlo Park,CA: The Hewlett Foundation.
——. (2001). From black box to pandora’s box: Evaluating remedial/developmental education.New York, NY : CCRC.
——. (1999). Honored but invisible. New York and London: Routledge.
Hayward, J. et al. (2003). Ensuring access with quality to California’s community colleges.(NCPPHE). San Jose, CA: National Center for Public Policy and Higher Education.
Hebel, S. (2000). States without affirmative action focus on community-college transfers. TheChronicle of Higher Education, May 26.
61
Ignash, J.M. (1997). Implementing effective policies for remedial and developmental education.In New directions for community colleges. San Francisco, CA: Jossey-Bass.
Jenkins, C. (2002). Many high school grads unprepared for college. The Washington Post,December 25.
Kirst, M. W. (2000). The senior slump. In National cross talk. San Jose, CA: National Center forPublic Policy and Higher Education.
——. (1998). Improving and aligning K–16 standards, admissions, andfreshman placement policies. Technical Report 2-06. Stanford, CA: National Center forPostsecondary Improvement.
——. (1997). Strengthening the bridge between higher and secondaryeducation: Admissions and placement policies. Proposal for the Pew Charitable Trusts.Stanford: Stanford University.
Kirst, M. W. and K. Bracco. (2002). Bridging the great divide. Stanford, CA: Bridge Project.
Kirst, M. W. and A. Venezia, eds. (Forthcoming.) From High School to College. San Francisco,CA: Jossey-Bass.
Koski, W.S. and H.M. Levin (1997). Accelerating the education of remedial students inpostsecondary education. Stanford, CA: National Center for PostsecondaryImprovement.
Los Rios Community College District documents; executive summary of the 2000 externalenvironment scan and the internal environment scan report card; key issues for planning:an executive summary of the 2000 external environment scan and the internalenvironment scan report card; California Community Colleges Board of Governor’s grant(fee waiver); advanced education (high school concurrent enrollment); application foradmission and supplemental data form; access to student records; financial aid;University of California Office of the President dual admissions program; fall 2000student profile; research briefs; student demographics; Sacramento City College –institutional effectiveness report 1998–99; high school graduates data; student right toknow data; Sacramento City College transfers; Cosumnes River College transfers.
Melguizo, T. (2003). What types of colleges did a better job graduating minorities in the 1980sand 1990s? Unpublished paper. Burlingame, CA.
The National Center for Higher Education and Public Policy. (2002). Measuring Up 2002: Thestate-by-state report card for higher education. Retrieved fromhttp://measuringup.highereducation.org/2002/stateprofilenet.cfm.
Nora, A. (2002). Reexamining the Community College Mission. Retrieved fromhttp://www.aacc.nche.edu.
62
Phillippe, K.A. and M.J. Valiga. (2000). Faces of the future : A portrait of America’s communitycollege students. Washington, DC : American Association of Community Colleges.
Rosenbaum, J. (2001). Beyond college for all. New York: Russell Sage.
——. (1999). Unrealistic plans and misdirected efforts: Are community colleges getting the rightmessage to students? New York: Community College Research Center.
Sacramento City College Documents: matriculation plan; interview schedule; consent forms;general information; summer 2001 schedule of classes; 2000-2001 catalog; 2001-2002catalog; fall 2001 schedule of classes; 2001-2002 student guide; honors; natriculation;student information; “Matric Matters”; senior assessment for college; assessment;orientation packet; curriculum committee; transfer handouts; counseling handouts;financial aid information; newspaper.
Schevitz, T. (2001). Plan to expand UC admissions postponed – program financing falls through.Retrieved September 20, 2001 from SFGate.com. http://sfgate.com/cgi-bin/article.cgi?file=/chronicle/archive/2001/09/20/MN80633.DTL
Schneider, B. (2003). Strategies for Success: High School and Beyond. In Brookings Papers onEducation Policy, D. Ravitch (ed.). Washington, DC: Brookings Institution Press.
Shults, C. (2002). Remedial education : Practices and policies in community colleges.Washington, DC : American Association of Community Colleges.
Shaw, K.M. (1997). Remedial education as ideological battleground: Emerging remedialeducation policies in the community college. Educational Evaluation and Policy Analysis19(3):284–296.
Venezia, A. et al. (2003). Betraying the college dream: How disconnected K–12 andpostsecondary education systems undermine student aspirations. Stanford, CA: StanfordInstitute for Higher Education Research.
Walhaus, R. (1998). Statewide K–16 systems: Helping underprepared students succeed inpostsecondary education program. Denver, CO: State Higher Education ExecutiveOfficers.
Walleri, R.D. et al. (1998). Building a community of learning: A comprehensive approach toassisting at-risk students. Journal of Applied Research in the Community College6(1)(fall): 15–26).
Wellman, J.V. (2002) State policy and community college-baccalaureate transfer. San Jose, CA:The National Center for Public Policy and Higher Education ; Washington, DC: TheInstitute for Higher Education Policy.
Winter, G. (2002). Junior colleges try niche as path to top universities. The New York Times,December 15.
63
Young, J.R. (2002). Third of students transfer before gaining degrees, Education Departmentstudy finds. The Chronicle for Higher Education, December 19.
About the Author
Andrea Conklin Bueschel is a doctoral candidate in the School of Education at StanfordUniversity and a researcher at the Carnegie Foundation for the Advancement of Teaching. Shehas also served as an admission officer, college administrator, and managing director of aneducational consulting firm. Her research spans educational experiences from high school todoctoral programs, with a particular focus on students who aspire to be the first in their familiesto attend college.

65
Section 3
Using a K-12 Assessment forCollege Placement
by Michael W. Kirst
(Editor’s Note: This paper benefitted greatly from a speech given by Dr. David S. Spence,executive vice chancellor of California State University, at a conference sponsored by theNational Center for Higher Education and Public Policy, Los Gatos, California, June 2003.)
Across the nation, high percentages of high school graduates are entering college, butincreasingly they need remediation to succeed there. As a result, colleges are expending a greatdeal of resources on remediation instead of college-level education. At the same time, largenumbers of students never get past the first year of college because of inadequate high schoolpreparation, particularly in mathematics and language arts.
In the California State University (CSU) system, with 408,000 students on 23 campuses,remediation rates have risen over the past decades, along with concerns among the public andstate policymakers about the high number of poorly-prepared students entering CSU fromCalifornia public high schools. High remediation rates raise questions concerning the quality ofpublic schools, and about the K–12 content standards and accompanying state tests developed bythe California State Board of Education.
Furthermore, the high level of CSU remediation is expensive. About 25,000 out of 40,000 first-time CSU students need some form of remediation. The university must absorb the cost ofproviding classes not offered for college credit. Parents and students bear additional expensesbecause remedial courses do not count toward graduation; consequently, students take longer tofinish degrees.
“CSU is the first statewide system to adopt a K–12 stateassessment as its own placement test for first-year students.”
In the mid-1990s, this problem prompted the CSU Board of Trustees to establish the Trustees’Subcommittee on Remedial Education to explore solutions. As a result, the state has modifiedthe exam administered to all eleventh graders to better align it with the academic preparationrequired of students to enter CSU and to succeed in college. CSU is the first statewide system toadopt a K–12 state assessment as its own placement test for first-year students. This is animportant breakthrough in K–16 assessment policy, and it promises to provide clearer signals tohigh school students who have been uninformed about the discrepancy in standards betweentheir high school grades, tests, and CSU placement.
66
This policy can also help reorient the high school senior year so it becomes an intensiveacademic experience that supports students’ placement in college-level classes rather than inremedial ones. In short, this is a rare collaboration between secondary and postsecondaryeducation in California to solve a mutual problem that neither sector can solve on its own.
Evolution of the Problem
By state policy, CSU accepts the top third of California high school graduates, most of whomhave a 3.0 average in the same number of academic courses that are required for entering thesystem.1 Except for students with high SAT scores, however, all incoming CSU students musttake placement tests in English and entry-level mathematics before they can enroll in any classestheir first semester or quarter. Students who don’t meet the cut-off scores on either test must takeand pass remedial courses before enrolling in the typical course sequence that leads toward thegeneral education degree. If test scores are particularly low, a student may first need to pass alower-level remedial course, then advance to a higher-level one.
The CSU central office determines the cut-off scores, but each institution determines the specificprocess of remediation and development, including the specific courses and number of levels thatmust be completed. At Sacramento State, for example, placement tests serve as gatekeepers toMath 1 and English 1A, which begin the typical course sequence in those subjects. Students takethe math test only once: it is not re-administered after completing remedial coursework as acheck for mathematics understanding.
Currently, more than half of entering freshmen taking the CSU placement test requireremediation in English or math before beginning college-level coursework (47% fail English,37% math). It was numbers like these that led the CSU Board of Trustees to establish theTrustees’ Subcommittee on Remedial Education. In January 1995, a study committee presentedthe trustees with background information on remediation in the CSU, along with severalpreliminary recommendations.
Initially the trustees proposed that by fall 2001 all regularly admitted freshmen should attainproficiency in English and math. However, after a series of public hearings, the CSU trusteesestablished benchmarks for a 12-year period for reducing remediation. The first of these targetswas that, by 2001, the need for remediation for regularly admitted freshmen would decline by10% from 1996 levels, and by 2004 it would decline by 50% from 1996 levels. By the trustees’final target date of 2007, only 10% of the regularly admitted freshmen would need remediation.
Two other proposals surfaced in 1995 to mitigate remediation. The first was to delay admissionto students needing remediation until they could demonstrate they were prepared for college-level work. The other was that CSU bill high schools for the cost of remedial coursework tobring students’ performance levels up to college-level expectations. Neither proposal wassupported by the public, but CSU did accept their underlying premise: that CSU could best reachits remediation targets for 2007 with a solution that spanned the state’s K–12 and postsecondaryeducation systems.

67
As CSU acknowledges, meeting the 10% remediation goal by 2007 will require three key steps:
� High school teachers and students must understand CSU placement standards.
� K–12 schools and students must know as early as possible about their progress in meetingCSU standards.
� K–2 students who are not ready for college-level math and English classes must be helpedbefore they reach CSU.
Actions to Solve the Problem
In the late 1990s, CSU began to discuss the remediation problem with a K–16 voluntary bodycalled the Intersegmental Coordinating Committee (ICC) of the California EducationRoundtable. The Roundtable brings together representatives from all levels of education in thestate. It consists of the heads of the three California public higher education systems (theUniversity of California, California State University, and California Community Colleges), plusa representative from the private colleges and the state’s K–12 chief state school officer, who iselected. The ICC is comprised of high-level administrators under each of the Roundtable leaders.
After consulting with ICC, CSU decided to try several new strategies to lessen remediation.Reflecting the key steps needed to reach the 2007 goal, these initially focused on: increasingcommunication with K–12 schools on placement standards and assessments; encouraging highschool juniors to take the CSU placement test; and providing high school preparation for studentswith low scores.
This approach proved insufficient, however. The state already required so many K–12assessments that schools and students resisted taking CSU’s placement test. California has aHigh School Exit Exam, based mostly on seventh- to ninth-grade standards, as well as theCalifornia Standards Tests, which reflect the state’s eleventh-grade standards. Moreover, the costand staff needed for CSU to assist the huge California K–12 education system was daunting.Furthermore, several studies demonstrated significant discrepancies between required K–12 statetests and CSU’s placement exams (Le 2002; Venezia, Kirst, and Antonio 2003).
Rather than administer another exam to high school students, in the late 1990s CSU decided tonegotiate directly with K–12 policymakers to merge CSU placement standards into the existingCalifornia Standards Tests, which are given to all students in eleventh grade. A new policy andtest design group was formed, representing CSU and the California State Education Department(an advisory group to the California State Board of Education and the CSU Trustees). This groupexamined test items from several K–12 tests for their relationship to CSU standards, as well asfor similarities between K–12 and CSU standards.
The State Board of Education negotiated with CSU to enhance the existing K–12 standards-based tests to meet CSU placement standards. For example, as CSU requested, a writing samplewas added to the existing K–12 multiple-choice language arts test, as was an increased focus onAlgebra 2 in the math test.
To develop this more comprehensive program of assessing eleventh graders’ readiness forcollege, CSU gained support from the legislature, the California State Board of Education, the

68
CSU Department of Education, the University of California, California Community Colleges,CSU faculty, and organizations of K–12 teachers and administrators. The development of anaugmented eleventh-grade state assessment proceeded with these multiple stakeholders in mind.
In 2003 CSU set the achievement scores that high school juniors would need to reach to beexempt from its placement exams, and the state then sent test results to incoming seniors byAugust 1. Low-scoring students can now use the senior year for intensive preparation to meetCSU placement standards.
Common K–16 Standards
The merged CSU and K–12 assessments strategy has many advantages, making this new K–16collaboration deserving of close scrutiny by other states with high remediation rates. First, itgives a timely, targeted signal to students and schools of the need for added K–12 preparation.Moreover, by coordinating K–16 standards, it reduces the total testing time for students in highschool and at CSU. It also raises the stakes for statewide high school tests. Previously studentssaw no purpose for the eleventh-grade test because the SAT was used for admission and CSUhad a separate placement test. This new strategy increases the academic focus during the senioryear of high school for students who are not meeting CSU’s placement standards.
“The merged CSU and K–12 assessments strategygives a timely, targeted signal to students and schools of the
need for added K–12 preparation.”
Just as important, the strategy reforms and consolidates multiple K–16 school assessments, whileproviding better data for K–16 accountability concerning K–12 student preparation for CSU.Instead of the previous lack of alignment between the standards for exiting high school and thosefor entering CSU, there are now common standards and performance levels across secondary andpostsecondary education.
The CSU placement initiative is likely to be more successful than prior policies for a number ofreasons. First, both secondary and postsecondary education will be working together. Previously,secondary educators had been unaware of CSU’s placement standards, and high school studentshad not received clear signals about what they needed to know in order to avoid takingremediation courses in college. Moreover, CSU has discovered that a top-down strategy from theuniversity is insufficient, and that collaboration with the K–12 system holds greater promise.And finally, given the present state of tight and even shrinking state budgets, combinedassessments are likely to save the state money and testing time.

69
References
Le, Vi-N. (2002). Alignment among secondary and postsecondary assessments in five case studystates. Santa Monica, CA: Rand.
Venezia, A, Kirst, M.W., and Antonio, A.L. (2003). Betraying the college dream: Howdisconnected K–12 and postsecondary education systems undermine student aspirations. Finalpolicy report from Stanford University’s Bridge Project. Stanford, CA: Stanford Institute forHigher Education Research.
About the Author
Michael Kirst, professor of education at Stanford University, brings years of personalexperience in government education policymaking at both the federal and state levels to hisclassrooms and research. He is codirector of Policy Analysis for California Education, a researchconsortium that includes Stanford and UC Berkeley. A former president of the California StateBoard of Education, he presently serves on the management committee of the Consortium forPolicy Research in Education. His current research focuses upon the disjuncture between K–12and postsecondary education policy, as outlined in a recent report, Betraying the College Dream.
1 The University of California accepts the top 12% of state high school graduates, but the two systems require the same numberand type of high school courses.

71
Summary of Findings
As these three PACE research papers demonstrate, California secondary school students havehigher educational aspirations than ever before, yet these aspirations are being undermined bydisconnected educational systems and other barriers.
Over the past few decades, parents, educators, policymakers, business leaders, communitymembers, and researchers have told California students that, in order to succeed in our society,they need to go to college. Most high school students have heard that message, and they areplanning on attending college. But California has created unnecessary and detrimental barriersbetween high school and college, barriers that are undermining these student aspirations.1
“The current educational systems send conflicting messages aboutwhat is expected of students in college.”
§ Articulation is poor between the K–12 and higher education systems.
The current fractured educational systems send students, their parents, and K–12 educatorsconflicting and vague messages about what is expected of students to enter and succeed incollege. This is part of the reason why the percentage of California’s students (35%)proceeding from high school to college is below the national average (39%) (North Dakota isthe highest state at 59%)2.
PACE researchers found that California high school assessments often stress differentknowledge and skills than do college entrance and community college placementrequirements.3 Similarly, the coursework between high school and college is not connected.Students graduate from high school under one set of standards, and three months later arerequired to meet a whole new set of standards in college. In addition, current data systems arenot equipped to address students’ needs across K–12 and postsecondary systems. This meansthat no one is held accountable for issues related to student transitions from high school tocollege, including the need for remediation and postsecondary dropout rates.
PREPARING FOR AND ATTENDING COLLEGE§ Inequalities among high schools impact students’ college preparation.
Since a majority of students plan to attend college, it makes sense to help all students learnabout their postsecondary options and prepare for college. There are, however, some deepinequalities among high schools and between different high school populations in areas suchas college counseling, college-preparatory courses, and connections with local postsecondary
1 See Joint Committee to Develop a Master Plan for Education, Governance Working Group Report (Sacramento,CA, 2001).2 National Center for Higher Education and Public Policy, Measuring Up: 2002 (San Jose: NCHEPP, 2002).3 These conclusions are derived from three PACE papers and other data collected for the Bridge project at StanfordUniversity. See Michael Kirst and Andrea Venezia, From High School to College (San Francisco, CA: Jossey Bass,2004).

72
institutions. High schools also vary greatly in the opportunities they provide students to learnabout college, such as arranging for students to visit nearby institutions and for collegerecruiters to visit their high school.
High school students who are in accelerated curricular tracks and aspire to UC receive clearersignals about college preparation than do their peers who plan to attend community colleges.Many students in middle- and lower-level high school courses are overlooked bypostsecondary education outreach efforts, or by college counseling staff in their high schools.This situation is exacerbated by the number of counseling positions in the state’s schools(California ranks 50th in the number of counselors per students in grades K–12 (one for every1,011). economically disadvantaged parents often lack experience and informationconcerning college preparation. In short, these inequalities are most pronounced for studentsentering the less selective postsecondary institutions.
§ Student knowledge of curricular requirements and college costs is sporadic and vague.
Only 2.5% of 9th graders in California knew all the A–G course requirements. About one-third of the 9th graders knew the A–G math requirements for UC and CSU. The communitycolleges do not transmit explicit signals about any course requirements. In our sample, onaverage the estimated tuition costs per student were $30,000 for UC Davis, $27,000 forSacramento State, and $10,000 for a community college. However, the actual tuition costsper student were only $4,000 at UC, $2,000 at CSU, and $300 at community colleges.
§ Because counselors are so scarce, California teachers play a major role in helpingstudents prepare for college, yet they do not have the resources they need to givestudents accurate information.
Teachers often took a greater role in helping students prepare for college than did counselors,but teachers lack connections with postsecondary institutions and up-to-date admission andplacement information. Also, the teachers who were most active in helping students prepare forcollege were usually teachers of honors and college preparatory courses. Prospective communitycollege students received the least counseling due to community colleges’ open enrollmentpolicy that requires admitting all high school graduates regardless of academic preparation.
§ The distribution of college preparation information to parents is inequitable.
Parents with no college education know less about academic preparation and collegestandards than college-educated parents. Consequently, students are less aware ofpostsecondary options, tuition costs, and required preparatory courses.
§ Students are generally unaware of the content of UC, CSU, and community collegepostsecondary course placement exams.
Knowledge about specific placement tests and academic standards was general in nature andincomplete. But failure of placement tests almost always results in students starting inremedial and non-credit courses, delays in program completion, and higher costs for both thestudent and the college.
73
Policy Recommendations
The following policy recommendations are not intended to be comprehensive, but rather arederived from the three PACE working papers contained in this report.
Strategies for Immediate Implementation
Given the above problems, what should we strive to change? Our research found that thefollowing four strategies are most promising for immediate reform:
§ Provide all students, their parents, and educators with accurate, high-quality,information about, and access to, courses that will help prepare students for college-level standards.
Students need clear and repeated signals about how to succeed in postsecondary education.For example, mathematics courses that exceed Algebra 2 and are taken in the senior year, arestrong predictors of bachelor degree completion.
§ Focus on the institutions that serve the majority of students.
Shift media, policy, and research attention to CSU and community colleges, since these arethe schools attended by the vast majority of recent high school graduates (approximately85%). While completion rates are very high for UC students, they are very low, incomparison, for community college students, who are the least well-prepared of all studentsentering college. Since two-thirds of CSU graduates come through the community colleges, itmakes sense to spend a majority of outreach and secondary school counseling resources onthese two groups. Increasing the rates of student success at these colleges is a sound publicinvestment both in terms of California’s civic and economic well-being.
“Expand the focus programs from access to college tosuccess in college.”
§ Create an awareness that getting into college is not the hardest part for moststudents—learning to handle college-level work while still in high school is.
Expand the focus of local and state programs from access to college to include access tosuccess in college. This includes access to the resources and information necessary to preparewell for college and to make informed decisions. High school course content, academiccounseling, college outreach, and other programming needs to reflect this so that students areclear about what it takes to succeed in college, including community college.

74
§ Bring together representatives from K–12 and higher education to implement change.
Reforms across the two education systems will be difficult if not impossible to implementwithout meaningful communication and policy-making institutions that span K–16. For astart, California college stakeholders must be brought to the table when K–12 standards andassessments are developed or revised. Higher education institutions were not representedwhen California completed its K–12 academic content standards in 1997. Likewise,California K–12 educators must be engaged as postsecondary education admission andplacement policies are under review. For example, outreach funds need to be included as partof a larger K–16 policy focus, and not merely connected to budgets of higher educationinstitutions. Since outreach for college preparation is not viewed as a K–12 budget concernand therefore is not part of its funding stream, it can be cut more easily.
Future Implementation Strategies
The following are several other important, long-range steps that California’s K–12 andpostsecondary systems can take to improve the transition from high school to college.
§ Ensure that community colleges publicize their academic standards so that students,their parents, and educators have accurate college preparation information.
Low-income families and prospective community college students are most in need of thisinformation. Specifically, we suggest that local community colleges establish a test scorerange on the California Standards Test (given to all students in grades 10–11) that is likely toplace students in or out of remediation. This credit-level standard for community collegeEnglish and math courses needs to be disseminated to prospective students and their familiesat the same time they receive test results from the California standards test. Since localcommunity colleges use several different placement tests, this CST range would send a clearersignal to prospective community college students concerning their college readiness. Californiacommunity colleges should study the 11th grade CST to see if it should be added to theapproved list of community college placement tests. At the same time, UC should continueits exploratory research for possible use of the CST as part of comprehensive admissions.
“Sequence undergraduate requirements so that appropriate senior-year courses are linked to postsecondary general
education courses.”
§ Sequence undergraduate general education requirements so that appropriate senior-year courses are linked to postsecondary general education courses.

75
The “senior slump” is a widespread issue in California high schools.1 Some Californiastudents regress academically during their senior year—particularly if they take few collegepreparatory courses. The senior year needs to be an intense academic experience for allstudents planning to attend postsecondary education, and can be, providing students knowthey are underprepared for college success.
§ Expand successful dual (concurrent) enrollment programs between high schools andcolleges so that they include all students, and not just those who plan to attend highlyselective colleges.
Historically most high school students participating in dual enrollment programs have beenenrolled in honors and advanced placement courses. However, students who plan onattending CSU or community college can also benefit from such programs. Dual enrollmentat the community college level is being revamped to de-emphasize physical educationcourses, but much more needs to be done. California still lacks a clear policy on the collegereadiness purposes or effective design of dual enrollment. Dual enrollment can providerealistic information to students about the skills they will need to succeed in college, andimprove motivations through interesting courses. It can also promote institutionalrelationships between colleges and high schools.
§ Collect and connect data from all education sectors.
California K–16 institutions should create common identifier numbers for students as theyproceed from high school through college. These student numbers would be used by all partsof the K–16 system. This would make it possible to analyze the relationship betweensecondary school student course-taking patterns, the need for college remedial work, andlongitudinal trends on what happens to students after they complete college remedialcoursework. Current law prohibits school districts from reporting California Standards Test(CST) scores on high school transcripts. This law should be repealed so that postsecondaryeducation can receive CST scores. This would encourage students to take the CST seriously,reduce redundant placement testing, and help reduce remediation.
§ Implement a California Education Commission to oversee K–16 articulation.
All of these recommendations will be easier to accomplish and implemented more effectivelyif there is an overall organizational base for K–16 policymaking and oversight. California’sproposed Master Plan for K–16 recommended just such a structure. Called the CaliforniaEducation Commission (CEC), as conceived the organization should provide a good start onK–16 policymaking.2 The CEC would:
o Provide long-range analysis and planning for meeting the educational needs ofpreschool through postsecondary education.
1 See Michael W. Kirst, Overcoming the Senior Slump (San Jose, CA: National Center for Public Policy and HigherEducation, 2001).2 Joint Committee to Develop a Master Plan for Education, The California Master Plan for Education (Sacramento,CA, 2001).

76
o Provide policy and fiscal advice, based on data analysis, that represents the publicinterest in California’ education system.
o Serve as California’s statewide education data repository.
o Evaluate the extent to which all public education institutions are operatingconsistent with state policy priorities.
o Advise the Legislature and the Governor on the potential and actual impacts ofmajor education policy proposals or initiatives.
o Coordinate statewide articulation of curriculum and assessment between the pre-K–12 and postsecondary education sectors.
o Sponsor and direct intersegmental programs that benefit students making thetransition from secondary school to college and university.
o Coordinate outreach activities among the secondary, postsecondary, and school-to-work sectors.
PACE concurs with the Master Plan’s governance working group recommendation that theGovernor assume a major role in K–16 coordination and devise a plan to greatly enhance K–16data.3 Only the Governor can bring together the four different systems that comprise K–16 (UC,CSU, CC, and K–12) in California. But concerted efforts by policymakers, educators, parents,and students is also needed to improve student access to success in postsecondary education.While implementing these recommendations will not magically eliminate the dozens of otherreasons why California students are not prepared adequately for college, it will go a long waytoward improving transitions from high school to postsecondary education.
3 Ibid, pages 17–20.

Policy Analysis for California Education PACEUniversity of California, Berkeley and Davis
Stanford University3653 Tolman Hall
Berkeley, CA 94720-1670
Telephone: (510) 642-7223http: //pace.berkeley.edu