Improving the Army's Management of Reparable Spare Parts
111
This PDF document was made available from www.rand.org as a public service of the RAND Corporation. 6 Jump down to document Purchase this document Browse Books & Publications Make a charitable contribution Visit RAND at www.rand.org Explore RAND Arroyo Center View document details This document and trademark(s) contained herein are protected by law as indicated in a notice appearing later in this work. This electronic representation of RAND intellectual property is provided for non-commercial use only. Permission is required from RAND to reproduce, or reuse in another form, any of our research documents. Limited Electronic Distribution Rights For More Information Support RAND The RAND Corporation is a nonprofit research organization providing objective analysis and effective solutions that address the challenges facing the public and private sectors around the world. CHILD POLICY CIVIL JUSTICE EDUCATION ENERGY AND ENVIRONMENT HEALTH AND HEALTH CARE INTERNATIONAL AFFAIRS NATIONAL SECURITY POPULATION AND AGING PUBLIC SAFETY SCIENCE AND TECHNOLOGY SUBSTANCE ABUSE TERRORISM AND HOMELAND SECURITY TRANSPORTATION AND INFRASTRUCTURE
Transcript of Improving the Army's Management of Reparable Spare Parts

This PDF document was made available from www.rand.org as
a public service of the RAND Corporation.
6Jump down to document
Purchase this document
Browse Books & Publications
Make a charitable contribution
Visit RAND at www.rand.org
Explore RAND Arroyo Center
View document details
This document and trademark(s) contained herein are protected by law as indicated in a notice appearing later in this work. This electronic representation of RAND intellectual property is provided for non-commercial use only. Permission is required from RAND to reproduce, or reuse in another form, any of our research documents.
Limited Electronic Distribution Rights
For More Information
Support RAND
The RAND Corporation is a nonprofit research organization providing objective analysis and effective solutions that address the challenges facing the public and private sectors around the world.
CHILD POLICY
CIVIL JUSTICE
EDUCATION
ENERGY AND ENVIRONMENT
HEALTH AND HEALTH CARE
INTERNATIONAL AFFAIRS
NATIONAL SECURITY
POPULATION AND AGING
PUBLIC SAFETY
SCIENCE AND TECHNOLOGY
SUBSTANCE ABUSE
TERRORISM AND HOMELAND SECURITY
TRANSPORTATION ANDINFRASTRUCTURE

This product is part of the RAND Corporation monograph series. RAND
monographs present major research findings that address the challenges facing
the public and private sectors. All RAND monographs undergo rigorous peer
review to ensure high standards for research quality and objectivity.

John R. Folkeson, Marygail K. Brauner
Prepared for the United States ArmyApproved for public release; distribution unlimited
Improving the Army’s Management of Reparable Spare Parts

The RAND Corporation is a nonprofit research organization providing objective analysis and effective solutions that address the challenges facing the public and private sectors around the world. RAND’s publications do not necessarily reflect the opinions of its research clients and sponsors.
R® is a registered trademark.
© Copyright 2005 RAND Corporation
All rights reserved. No part of this book may be reproduced in any form by any electronic or mechanical means (including photocopying, recording, or information storage and retrieval) without permission in writing from RAND.
Published 2005 by the RAND Corporation1776 Main Street, P.O. Box 2138, Santa Monica, CA 90407-2138
1200 South Hayes Street, Arlington, VA 22202-5050201 North Craig Street, Suite 202, Pittsburgh, PA 15213-1516
RAND URL: http://www.rand.org/To order RAND documents or to obtain additional information, contact
Distribution Services: Telephone: (310) 451-7002; Fax: (310) 451-6915; Email: [email protected]
ISBN: 0-8330-3743-9
The research described in this report was sponsored by the United StatesArmy under Contract No. DASW01-01-C-0003.

iii
Preface
The Army’s Velocity Management (VM) initiative was implemented in 1995 to im-prove the responsiveness, reliability, and efficiency of the Army’s logistics system.1 Byapplying a simple, yet powerful, process-improvement methodology, the Army dra-matically streamlined its field-level supply process and its overall distribution process,cutting median order-fulfillment times for repair parts by nearly two-thirds world-wide and by over 75 percent at several major installations.
This report addresses initial efforts to expand the VM initiative by applying anintegrative approach to improving the Army’s national-level inventory managementand depot-level component-repair processes. The objective of the Army’s reparable-management process is to repair sufficient assets to replenish serviceable inventoriesto meet the needs of requirements determined to support equipment readiness. Thisreport addresses both reparable-inventory planning and the national component-repair activities as an integrated process.
This study should be of interest to those involved with maintenance, supply, re-source management, and information systems. The reparable-management processactivities discussed have significant interactions across traditional functional man-agement areas (i.e., wholesale-item management, depot maintenance, and financialmanagement). The research was conducted over an extended period and relies uponsnapshots of system performance data to describe the process.
This project was jointly sponsored by the Deputy Chief of Staff for Logistics(G4), Headquarters Department of the Army, and the Commanding General (CG)of Army Materiel Command (AMC). The research was conducted in the MilitaryLogistics Program of the RAND Arroyo Center, a federally funded research anddevelopment center sponsored by the United States Army.____________1 The Army changed the name of this initiative to Army Distribution Management (ADM) in January 2003.However, this report retains the VM terminology for contextual consistency.


v
Contents
Preface........................................................................................ iiiFigures........................................................................................viiTables......................................................................................... ixSummary ..................................................................................... xiAcknowledgments........................................................................... xixAcronyms.................................................................................... xxi
CHAPTER ONE
Introduction...................................................................................1Identifying the Causes of Army National-Level Backorders...................................2Defining, Measuring, and Improving the Army’s Reparable-Management Process...........3Organization of This Report...................................................................5
CHAPTER TWO
Understanding the Scope of the Backorder Problem.......................................7Defining the Order-Fulfillment Process .......................................................7Metrics to Define the Scope of the BO Problem ..............................................8
Extent of the BO-Rate Problem .............................................................8Effect of High BO Rates on Customer Wait Times....................................... 13
Summary..................................................................................... 16
CHAPTER THREE
Understanding the Reparable-Management Process ..................................... 17The Current Reparable-Management Process ............................................... 18Depot-Level Reparable Workload ........................................................... 21
Planning for Both Near-Term and Long-Term Needs.................................... 21Execution of Repair Programs............................................................. 24
Summary..................................................................................... 26

vi Improving the Army’s Management of Reparable Spare Parts
CHAPTER FOUR
Improving Planning Activities ............................................................. 29Key Issues in the Current Process for Planning and Execution of PRONs to Repair
Reparable Items ....................................................................... 29Uncertainty in Customer Demands on Long-Term Planning Forecasts .................. 29Need for Improved Supply-Management Planning and Execution ....................... 34
Approaches for Improving Supply-Management Planning and Execution.................. 36Approaches for Dealing with Uncertain Demand ........................................... 37
Frequent Updating of PRON Forecasts to Respond to Changing Demands ............. 38Improving Service Level by Increasing Safety Stock....................................... 39Improving Replenishment Lead Times.................................................... 40Improving Communication About Customer Needs and Requirements ................. 41
Moving from Planning to Execution ........................................................ 42Linking Long-Term Planning to Near-Term Execution .................................. 42
Conclusion................................................................................... 44
CHAPTER FIVE
Improving Repair Activities................................................................ 45Improving Repair-Activity Responsiveness to Deal with Uncertain Demand............... 45Approaches for Improving Repair-Activity Responsiveness ................................. 46
Reducing Lead Time for Next-Repair Completion and Overall Repair Flow Time ...... 47Frequent Replanning to Keep Repairs Synchronized with Demand ...................... 49Improving the Availability of Unserviceable Assets........................................ 51Improving the Process for Managing Repair Parts ........................................ 53Financial Policies That Support More-Responsive Depot Repairs........................ 63
Conclusion................................................................................... 68
CHAPTER SIX
Recommendations for Pilot Implementation ............................................. 71The Need for a More-Responsive Reparable-Management Process ......................... 71Recommendations for a Pilot Effort ......................................................... 72
Addressing Uncertainty.................................................................... 73Properly Linking Long-Term Planning and Replanning for Responsive Execution ...... 74Improving Repair Responsiveness ......................................................... 76
Conclusion................................................................................... 78
Bibliography ................................................................................ 81
vii
Figures
1.1. Key Components of the Define-Measure-Improve Methodology....................42.1. The Order-Fulfillment Process .......................................................82.2. BOs Reported for Army Tactical-Level Requisitions to the National System........92.3. BO Rates for AMC-Managed Items, by Type of Repair or Consumable .......... 112.4. BO Rates at the MSCs Within AMC............................................... 122.5. Process Flow Diagram for Army Field-Level Customer Requisitions .............. 142.6. CWT Statistics for a Mechanized Infantry Division Installation................... 153.1. Key Activities of the Current Reparable-Management Process..................... 183.2. Reparable-Management Process Activities to Replenish Serviceable
Inventories .......................................................................... 203.3. Supply-Management and Repair Activities of the Reparable-Management
Process .............................................................................. 213.4. Tools Used by Item Managers to Understand Demand Patterns (Planning
Sequence for Repair-Process Program Development by TACOM IM) ............ 223.5. Depot-Level Maintenance and Repair Activities ................................... 274.1. Variability in Demand for the FY2000 Reparable M88A1......................... 304.2. The Repair-Planning Processes for Different PRONs.............................. 324.3. FY2000 M88A1 PRON vs. Actual Demands ...................................... 334.4. The FY2000 M88A1 Engine PRON Revised to Meet Customer Demands....... 364.5. Current Reparable-Management Activities ......................................... 434.6. A More-Responsive Reparable-Management Process............................... 445.1. Repair Production at ANAD Under the FY2000 PRON and the Revised
PRON .............................................................................. 465.2. Generalized Reverse Logistics Process .............................................. 52


ix
Tables
2.1. Requisitioning Data for FY2002.................................................... 105.1. An Example of Current Cost Allocation vs. Marginal Cost Allocation ............ 67


xi
Summary
High Backorder Rates for Reparable Items
Since its inception in 1995, the Army’s Velocity Management (VM) initiative, nowknown as Army Distribution Management (ADM), has been used to improve theresponsiveness, reliability, and efficiency of the Army’s logistics system. However, asVM efforts expanded from order fulfillment at the tactical-unit level to national-inventory management, a troubling pattern emerged: a multiyear pattern of high andvariable backorder (BO) rates for reparable items managed by the Army MaterielCommand (AMC) and all the major subordinate commands (MSCs) within AMC.
A reparable is an item that can be cost-effectively repaired. When a reparablesuch as a diesel engine or turbine fuel control malfunctions, it can be replaced by arepaired or rebuilt component; it usually does not need to be replaced by a new item.
From the perspective of the ultimate customer—an Army mechanic trying tobring a malfunctioning piece of equipment back to mission-capable status—a BOcan mean a lengthy delay and potentially a shortfall in mission support. The patternof high BO rates suggests that improvements are needed in the process for managingand repairing reparable items. Improved effectiveness and efficiency of AMC’s com-ponent-repair capabilities and capacity can also contribute directly to other depotprograms (e.g., components are also used to repair higher reparable assemblies andeven for end-item overhauls), in addition to returning serviceable assets to the shelf,where they will be available for issue to those Army customers directly responsible forrepairing mission equipment.
To illustrate the process-improvement approach described in this report, we usea case study of the M88A1 armored recovery vehicle engine. This diesel engine,which has had persistent BO problems, is typical of a large group of unsophisticated,older components needed to keep aging weapon systems in mission-ready condition.

xii Improving the Army’s Management of Reparable Spare Parts
Planning and Execution of the Reparable-Management Process
When an end-item fault or malfunction is discovered, during either equipment op-eration or routine maintenance, if a serviceable reparable is needed to complete theend-item repair, a mechanic requests the part or component from the supply system.The reparable-management process begins with the identification of the malfunc-tioning component and ends when a serviceable asset is made available througheither repair or vendor replenishment to replace the item issued to the mechanic.
Whether or not there are serviceable reparables in stock at the national level de-pends on the effectiveness and responsiveness of the AMC process for planning andexecuting reparable workload, both repair programs and new buys. The planning ac-tivity analyzes inventory levels and produces a formal decision package for a reparablerepair program or a vendor procurement, both known as a PRON (procurement-request order number) that is submitted for approval. Over the long term, the plan-ning process also provides input to the Army working-capital fund (AWCF) budgetprocess and the program-objective memorandum (POM) budget planning process,which has a rolling six-year planning horizon and ultimately feeds into the congres-sional appropriations process.
Once a repair PRON receives management approval, it is typically scheduled tobegin execution at the start of a new fiscal year 18 months after the start of the plan-ning cycle. Once a repair is completed, the item manager (IM) may immediately shipthe item to a customer to satisfy a due out, move it to a centralized distribution depotfor future issue, or leave it in storage at the distribution center collocated with therepair facility.
The PRON is usually described as a yearly repair requirement. Unserviceableitems are often inducted in monthly batches, and output is also usually processed inbatches. However, the formal PRON process also drives the overall planning processfor long-term capacity adjustments (e.g., workforce, equipment, facilities). Quarterlyreplanning meetings provide a venue for adjusting production schedules.
Three Critical Issues in the Reparable-Management Process
Our examination of the reparable-management process identified three key issuesthat need to be addressed:
• The impact of uncertainty and variability in customer demands on long-termplanning forecasts.
• The need for increased emphasis on near-term replanning for execution.• The inability of repair responsiveness to meet changing requirements.

Summary xiii
The Impact of Uncertainty and Variability in Customer Demands on Long-TermPlanning Forecasts
The current process for planning reparable workload requires and uses forecasts madeover long horizons. It is nearly impossible to accurately make such forecasts 18 to 30months into the future because of changes in mission scenarios and other sources ofdemand uncertainty and demand variability. In other words, forecast error is to beexpected.
We use the M88A1 diesel engine to illustrate a case in which increasing demandover the extended planning horizon led to underproduction. In this example, forecasterror was caused by demand uncertainty, rather than variability. The current plan-ning process can also create the opposite situation by overproducing items with de-clining demand. In either case, the reparable-management process must be capable ofadapting to changing demand. Fundamentally, successful planning requires frequentreplanning to incorporate emerging information so that the execution will meet validneeds.
Increased Emphasis on Near-Term Replanning for Execution
The reparable-management process tends to focus primarily on long-term budgetplanning, and thus it is less responsive to changing customer needs that emerge dur-ing near-term execution. Although the MSCs and their repair depots hold quarterlymeetings to revise schedules and address problem areas, these meetings typically focuson only the most critical issues.
Improved Repair Responsiveness to Meet Changing Requirements
To the extent that an IM can change a production plan or program to meet changingdemands, the question arises as to whether the depot can adjust its repair program tomeet those changing demands. We found, for example, that the procedures used forinventory management and control at Anniston Army Depot (ANAD) did not pro-vide sufficient visibility to identify repair-part problems before they became critical inthe production process.2
Alternatives for Improving the Reparable-Planning Process
Strategies for Dealing with Uncertain Demand
A review of the literature on commercial business practices identified the followingfour promising approaches for meeting customer needs under conditions of uncer-tain demand:____________2 The case study provided an in-depth view of ANAD, but similar systems and policies would have similar resultsat other Army depots with similar workloads.
xiv Improving the Army’s Management of Reparable Spare Parts
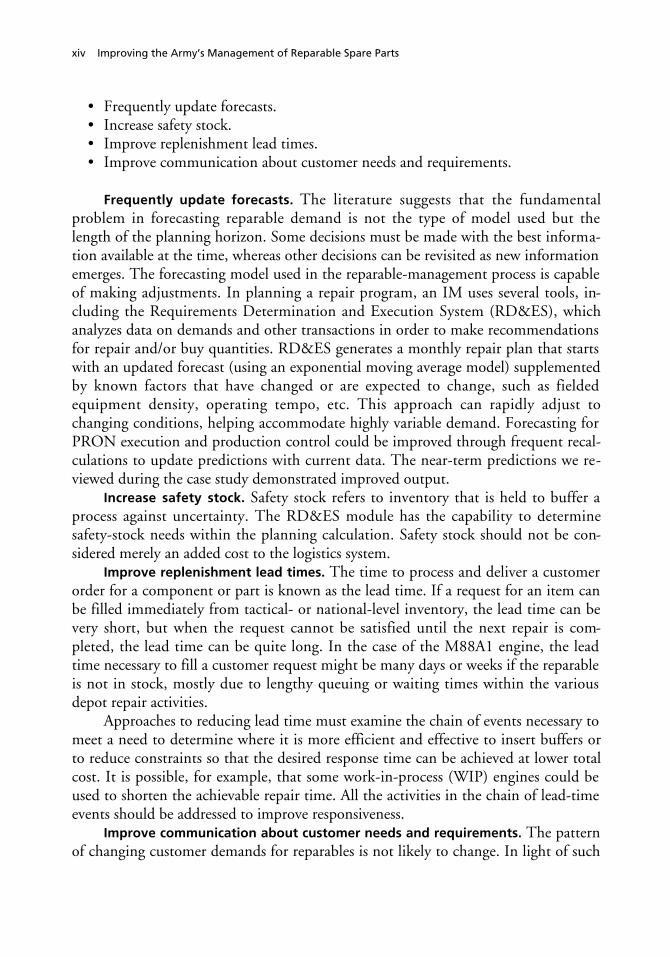
• Frequently update forecasts.• Increase safety stock.• Improve replenishment lead times.• Improve communication about customer needs and requirements.
Frequently update forecasts. The literature suggests that the fundamentalproblem in forecasting reparable demand is not the type of model used but thelength of the planning horizon. Some decisions must be made with the best informa-tion available at the time, whereas other decisions can be revisited as new informationemerges. The forecasting model used in the reparable-management process is capableof making adjustments. In planning a repair program, an IM uses several tools, in-cluding the Requirements Determination and Execution System (RD&ES), whichanalyzes data on demands and other transactions in order to make recommendationsfor repair and/or buy quantities. RD&ES generates a monthly repair plan that startswith an updated forecast (using an exponential moving average model) supplementedby known factors that have changed or are expected to change, such as fieldedequipment density, operating tempo, etc. This approach can rapidly adjust tochanging conditions, helping accommodate highly variable demand. Forecasting forPRON execution and production control could be improved through frequent recal-culations to update predictions with current data. The near-term predictions we re-viewed during the case study demonstrated improved output.
Increase safety stock. Safety stock refers to inventory that is held to buffer aprocess against uncertainty. The RD&ES module has the capability to determinesafety-stock needs within the planning calculation. Safety stock should not be con-sidered merely an added cost to the logistics system.
Improve replenishment lead times. The time to process and deliver a customerorder for a component or part is known as the lead time. If a request for an item canbe filled immediately from tactical- or national-level inventory, the lead time can bevery short, but when the request cannot be satisfied until the next repair is com-pleted, the lead time can be quite long. In the case of the M88A1 engine, the leadtime necessary to fill a customer request might be many days or weeks if the reparableis not in stock, mostly due to lengthy queuing or waiting times within the variousdepot repair activities.
Approaches to reducing lead time must examine the chain of events necessary tomeet a need to determine where it is more efficient and effective to insert buffers orto reduce constraints so that the desired response time can be achieved at lower totalcost. It is possible, for example, that some work-in-process (WIP) engines could beused to shorten the achievable repair time. All the activities in the chain of lead-timeevents should be addressed to improve responsiveness.
Improve communication about customer needs and requirements. The patternof changing customer demands for reparables is not likely to change. In light of such

Summary xv
realities, it is important to adjust expectations and to increase communication abouthow the process must change to better meet customer needs and requirements. Cus-tomers and providers across the system supported by the Army’s reparable-management process must understand both the nature of the issues involved and ac-tions that could contribute to an improved outcome. Unless the process changes, theoutcome is not likely to change.
Frequent Replanning and Near-Term Repair Execution
When the results of the planning process are shown to be inadequate to meetemerging customer demand, the plans should be adjusted promptly under appropri-ate management controls. An initial goal might be to transition as quickly as possibleto monthly repair-schedule changes (i.e., replanning) using the available monthlyRD&ES outputs. In the future, the management decision process might be informedweekly or even daily about customer demand, and production-schedule changescould be implemented when warranted.
Improving Repair Responsiveness
Several alternatives for improving repair responsiveness emerged from interactionswith managers and technicians within the system and from lessons learned fromcommercial practice.
Reduce lead time for the next repair and overall repair flow time. Reducingflow time in the repair activities of the reparable-management process will involvelooking very closely at all the process activities required to return a broken asset toserviceable status and to deliver it to the Defense Logistics Agency (DLA) distribu-tion center packaged and ready for issue. The intent of such analysis would be to es-tablish a mechanism that could respond to customer needs by increasing productionwhen demand increases, thus reducing the potential for BOs, and decreasing produc-tion when demand is low, thus reducing unnecessary inventory investment.
Replan frequently to synchronize repairs with demand. Updated informationcould be used monthly by the current RD&ES module to revise production sched-ules that cover the currently approved PRONs. In addition, the proposed lead-timereduction efforts could provide the kinds of operating practices necessary to enabledepot production to respond to forecast changes. A mechanism or signal should beestablished that communicates to depot managers and workers the need to perform agiven task and the quantity of items to be produced. This replanning works twoways: It increases production when demand increases, thus reducing the potential forBOs, and it decreases production when demands are not as great as forecasted, thusreducing unnecessary inventory investment.
Assure the availability of unserviceable assets. Repair actions cannot begin un-til unserviceable assets that have been removed from end-items are available for in-duction. Currently, unserviceables (unless they are specially identified) are treated as

xvi Improving the Army’s Management of Reparable Spare Parts
the lowest-priority items within both the supply and the transportation activities.The supply and transportation communities need to review the priorities assigned todealing with unserviceable assets to allow them to be used more effectively in meetingthe needs of individual customers and the Army as a whole.
Improve the process for managing depot repair parts. Under the current pro-cess, technicians must leave their work locations and go to the shop supply room toget parts that are needed, wasting time and manpower. A more effective approachwould be to provide repair parts, both new and reclaimed (i.e., recycled), at theworkstations. For example, routing reclaimed parts to the Automated Storage andRetrieval System (ASRS) facility would improve visibility of assets and would allowparts to be brought forward to mechanics in an orderly manner.
The inventory policy for repair parts at AMC maintenance depots would alsobenefit from greater flexibility in setting inventory levels for different items. Currentpolicy sets inventory levels at 60 days of supply (DOS) for all items other than benchstock and special-project assets. A more flexible policy would allow for addressing thedifferent characteristics of individual repair parts, thus reducing the risk of stock-outs. Such a policy might distinguish among at least three kinds of items:
• Items used for nearly all repairs. As long as there is recurring monthly produc-tion or availability of these items, replenishment with the current 60-DOS pol-icy should ensure that assets are on hand and that there is a continuing vendorrelationship to meet future needs. Over time, the 60-DOS level might actuallybe reduced. For these types of items, replenishment time and variability, as wellas cost, should determine the final inventory depth.
• Less frequently used items. The programmed logic for inventory decisions inDLA’s automated inventory-replenishment system is based on the frequencywith which items are ordered. Low-demand items replenished by large ordersare typically replenished only infrequently and thus may not be stocked at DLAif the repair depot orders them too infrequently to qualify them for stockage.Infrequent orders also complicate vendor relationships. Smaller, more-frequentreplacement orders have the benefit of both limiting inventory investment andcommunicating to IMs and vendors the continuing need for such items to sup-port repair programs. The relevant IMs must understand that these less fre-quently used items are still necessary.
• Infrequently used items with long lead times for replenishment. These itemsrequire and justify intensive management. They typically represent a small per-centage of the total number of items but a majority of the total inventory in-vestment.
Adopt policies that make repair programs responsive to customer demands.The Army maintenance depots’ component-repair programs are financed via the

Summary xvii
AWCF, which does not require that revolving-fund activities spend all their funds bythe end of the fiscal year to avoid losing the money. Thus, a depot can carry overworkload beyond its intended fiscal year to provide approved cash flow for labor andmateriel while awaiting the approval of a new PRON. Workload carryover and thepattern of delayed production, along with changes in demand, contribute to the due-out volume, or the BO rate. The Army needs a policy that is more responsive to cus-tomer demands.
Adopt financial policies that encourage appropriate use of repair capacity.Prices of Army-managed items include a supply-management surcharge to recoverthe costs of operating the national supply system. This surcharge, which includesboth fixed costs (costs that do not vary by supply-management activity) and variablecosts (costs generated by specific items), can result in comparatively high prices andcan lead to lost sales—even for items with low acquisition costs. For example, thesurcharge acts as a “tax” on purchases from the supply system, whereas locally pur-chased or repaired equivalents avoid such a charge. One approach for addressing thisproblem would be to fund fixed costs (e.g., costs for Department of Defense (DoD)agencies, depreciation, and adjustments for prior-year losses or gains) through directfunding and to allocate variable costs more specifically to the items generating them.
A Pilot Effort to Implement Improvements
The implementation of improvement initiatives can be made more tractable bystarting with a pilot effort that allows the development and testing of alternative ap-proaches. The results obtained in a pilot implementation could be measured, rulescould be adjusted, and confidence would be developed in the selected improvementapproaches.
We recommend that senior management at an MSC appoint a small pilot im-plementation team. The team’s effort should focus initially upon a few reparableNIINs (national item identification numbers) related to a single weapon system orend-item that is repaired at the same facility. This approach could create a verticalslice of the overall reparable-management process and thus would facilitate actionsacross activities to achieve recognized results.
It is possible to dramatically improve the availability of reparables to customers.This report discusses approaches that can efficiently improve each activity in theprocess. Many of these approaches are drawn from successful commercial practice,and others derive from successes within military practice that deserve expansion.


xix
Acknowledgments
The authors wish to thank the many people who have helped to make this researchpossible. We first thank General John Coburn (USA, Ret) for his support, initially asDeputy Chief of Staff for Logistics (G4), HQDA, and then as Commanding General(CG) of Army Materiel Command (AMC). We are also indebted to LTG CharlesMahan (USA, Ret) for his support in his roles as Deputy CG of AMC and then asthe Army G4. Thanks also go to Eric Orsini, the Special Assistant to the Army G4(and then Deputy Assistant Secretary of the Army for Logistics), and his associates,COL Glenn Harrold and COL Albert Love. At AMC Headquarters, we thankGeneral Paul Kern, Commanding General; MG Mitchell Stevenson, DeputyChief of Staff, G3; COL Hugh Hudson; and Thomas Hedstrom. At AMC’sTank-Automotive and Armaments Command (TACOM) we thank MG N. RossThompson, Commanding General, and Thomas Boyle, David Carter, ChrisThomasson, and John Jacobs. At the Anniston Army Depot (ANAD), we thankBorden Norten, David Sok, and Shelby Cupp. Thanks also to the many other dedi-cated Army, AMC, and Combined Arms Support Command (CASCOM) staff whoprovided assistance.
The research reported here follows directly from earlier RAND Velocity Man-agement (VM) research for the Army Deputy Chief of Staff, G4. We are indebted toLTG Claude Christianson, Army G4, and Thomas Edwards, Deputy to the Com-mander, CASCOM, and Executive Agent for Army Distribution Management, fortheir continued interest in research aimed at improving support to Army warfightersand at implementing change to improve Army logistics processes.
RAND research explicitly addressing the impacts of the uncertainty of logisticsrequirements and the implicit requirement for process changes to create more re-sponsive capabilities, including responsive repair, improved distribution, and the ap-plication of “lean” management concepts, can be traced at least to the late 1970s.RAND colleagues including Irv K. Cohen, Gordon B. Crawford, and James S.Hodges created a body of work that bibliographic references only begin to document.
We are grateful for the efforts of two formal reviewers who contributed directlyto the clarity and quality of this report. Vincent Mabert of Indiana University and

xx Improving the Army’s Management of Reparable Spare Parts
Lionel Galway of RAND made substantive, direct contributions that improved thequality of our research.
At RAND, we wish to thank Eric Peltz, John Dumond, Rick Eden, MarcRobbins, Ken Girardini, Chris Hanks, and Patricia Boren for their contributionsto this document and for providing feedback as the project progressed. KristinLeuschner provided fundamental guidance and excellent prose that vastly improvedthe report. Finally, thanks go to Sarita M. Anderson for formatting the draft of thisdocument and managing its preparation.

xxi
Acronyms
ADM Army Distribution Management
AMC Army Materiel Command
AMCOM Aviation and Missile Command
AMDF Army Master Data File
ANAD Anniston Army Depot
APICS American Production and Inventory Control Society
AR Army regulation
ASL authorized stockage list
ASRS Automated Storage and Retrieval System
AWCF Army working-capital fund
BO backorder
CASCOM United States Army Combined Arms Support Command
CCP containerization and consolidation point
CCSS Commodity Command Standard System
CECOM Communications and Electronics Command
CFS container freight station
CG Commanding General
Class IX repair parts, class of supplies
CLM Council of Logistics Management
CONUS Continental United States
CTASC Corps Theater Automatic Data Processing Service Center
CWT customer wait time
DAAS Defense Automated Addressing System
DAASC Defense Automated Addressing System Center
DDJC Defense Distribution Depot, San Joaquin, California

xxii Improving the Army’s Management of Reparable Spare Parts
DDSP Defense Distribution Depot, Susquehanna, Pennsylvania
DLA Defense Logistics Agency
DLR depot-level reparable
DM Distribution Management
DMI define, measure, improve
DMWR depot-maintenance work requirement
DoD Department of Defense
DOS days of supply
DRMS Defense Reutilization and Marketing Service
DVD direct vendor delivery
DWCF Defense working-capital fund
FDP forward distribution point
FLR field-level reparable
FMR Financial Management Regulation
FMS foreign military sales
G4 Deputy Chief of Staff for Logistics
GAO General Accounting Office
GSA General Services Administration
HQ headquarters
ICP inventory control point
ILAP Integrated Logistics Analysis Program
IM item manager
ISA installation supply account
IT information technology
LAC latest acquisition cost
LIDB Logistics Information Data Base
LIF Logistics Information File
LMP Logistics Modernization Program
LORA level-of-repair analysis
M88A1 armored recovery vehicle; type, model designation
MRO materiel release order
MSC major subordinate command (of AMC)
MTBF mean time between failure

Acronyms xxiii
NICP national inventory-control point
NIIN national item identification number
NMWR national maintenance work requirement
NRTS not repairable this station
NSN national stock number
OCONUS overseas, outside the Continental United States
OMA Operations and Maintenance, Army
OMB Office of Management and Budget
OSD Office of the Secretary of Defense
PEP parts-explosion process
POD point of debarcation
POE point of embarcation
POM program-objective memorandum
PPBS Planning, Programming, and Budgeting System
PRON procurement-request order number
RD&ES Requirements Determination and Execution System
RPAS Repair and Procurement Acquisition System
SAMS Standard Army Maintenance System
SARSS Standard Army Retail Supply System
SDP strategic distribution platform
SLE service-life extension
SOR source of repair
SSA supply support activity
SSF Single Stock Fund
TACOM Tank–Automotive and Armaments Command
ULLS Unit-Level Logistics System
USA United States Army
USC United States Code
VM Velocity Management
WIP work in process


1
CHAPTER ONE
Introduction
Since its inception in 1995, the Army’s Velocity Management (VM) initiative1 hassought to improve the responsiveness, reliability, and efficiency of the Army’s logis-tics system. By implementing a simple, yet powerful, process-improvement method-ology, the Army has dramatically streamlined its order-fulfillment process, i.e., thesupply and the distribution activities that meet its customers’ needs. VM has enabledthe Army to cut median order-fulfillment times for spare parts and materiel by nearlytwo-thirds across installations in the continental United states (CONUS) and by over75 percent at several major installations.2
Initially, VM was applied only to the distribution of available inventory assets.However, efforts soon turned to the problem of improving the availability of thoseassets. As the VM stream of research and analysis expanded from order fulfillment atthe tactical-unit level into efforts to improve national-inventory management, theanalysis exposed a troubling pattern: Wholesale backorders (BOs) were higher thanexpected.3
Wholesale BOs had been masked by the slowness of the previous overallorder-fulfillment process. Every segment of that process, BO and non-BO alike, tooka long time. The improvements in responsiveness of the process exposed the glaringimpact of BOs on total sustainment performance. VM’s overall responsiveness metric(i.e., customer wait time (CWT)) established an improved foundation for measuringbasic logistics processes. As a process improves, the expected evolution is sequentialexposure of the next area in need of improvement. Indeed, as the order-fulfillmentprocess improved, the contribution or impact of the BO issues became more clearly____________1 In 2003, VM was renamed Army Distribution Management (ADM). In this report, we have retained the VMterminology for contextual consistency2 To learn more about the VM program, see Dumond, Brauner, Eden, et al., 2001; Dumond, Eden, andFolkeson, 1995; and Wang, 2000.3 A wholesale BO occurs when a requisition is passed to the national level for “wholesale” fulfillment and cannotbe immediately satisfied from on-hand inventory. Direct vendor deliveries (DVDs) can also experience BOswhen materiel is not provided in accordance with contract parameters.
2 Improving the Army’s Management of Reparable Spare Parts
defined and exposed. The process-improvement approach described in this reportattempts to understand the causes of the exposed issues.4
Identifying the Causes of Army National-Level Backorders
Inventory planning recognizes the presence of demand variability, and current Armysupply policy calls for providing an 85 percent service level (i.e., on average, custom-ers should encounter no more than a 15 percent BO rate). Given variability in bothdemand and replenishment lead time, inventory levels—specifically safety levels andorder-quantity combinations—are set to have parts in stock 85 percent of the time.5
When the BO trend exceeds 15 percent, either inventory investment did not occur asplanned, planning is not being executed promptly, demand is being underforecast, orprocess performance (i.e., procurement lead time or repair lead time) is not in linewith planning parameters.6
An item of supply is generally categorized as either consumable or reparable. Aconsumable is normally expended or used up beyond economic recovery during itsintended period of use. A reparable is an item that can be cost-effectively repaired,such as a diesel engine or turbine fuel control. When a reparable malfunctions, it canusually be replaced by a repaired or rebuilt component rather than requiring re-placement by a new item.7 In fact, repaired or rebuilt parts are sometimes the onlysource of stock for expensive weapon-system components. Usually, reparables are re-paired to serviceable condition for subsequent reissue to customers. (Throughout thisreport, the term reparable is used to refer to a class of items; individual reparablesmay be deemed either repairable or unrepairable.8) However, some unserviceablereparables, after inspection, are deemed to be unrepairable at a particular repair loca-tion or may even be condemned as economically unrepairable or infeasible to repair.
When we examined Army field-level customer-satisfaction statistics, we discov-ered that the high BO rate was being driven by a BO rate for reparables higher than____________4 The issue of BOs was also raised by Congress, resulting in requests for the General Accounting Office (GAO)to look into the matter. GAO has addressed this and other issues related to the Army and other Department ofDefense (DoD) entities in an extensive list of publications. For example, see GAO, 1990a, 1993, 2001a.5 This is an aggregate target. Different parts have different targets, based upon the most cost-effective allocationof assets to achieve the overall goal.6 Delays associated with vendor replenishments or wholesale inventories can involve a complex set of issues andprocesses.7 The term reparable correctly refers to both new items procured from a vendor and repaired items. Inventory ofa specific reparable may include both new and repaired items. However, some items become so worn or damagedthat they can no longer be economically repaired and are thus condemned and disposed of.8 Reparable items include depot-level reparables (DLR) and field-level reparables (FLR), categorized by theauthorized level of repair, which depends upon the skills, tools, and equipment required.
Introduction 3
that for consumables. We found a multiyear trend of high BO rates for reparableitems managed by Army Materiel Command (AMC),9 a pattern that also applied toall the major subordinate commands (MSCs) within AMC. The problem was notsimply one of insufficient repairs or procurements—according to the GAO, someitems were repaired in insufficient numbers, while others were repaired in excess ofcomputed stock levels.10
Defining, Measuring, and Improving the Army’sReparable-Management Process
Distribution Management (DM), the Army’s initiative for improving the speed andaccuracy of Army logistics processes, employs a systematic methodology for processimprovement. As the original name Velocity Management implies, the initiative seeksto satisfy the support needs of customers by improving the agility and responsivenessof logistics processes. Under VM/DM, both information and materiel flow faster andmore accurately, and at a lower total cost.
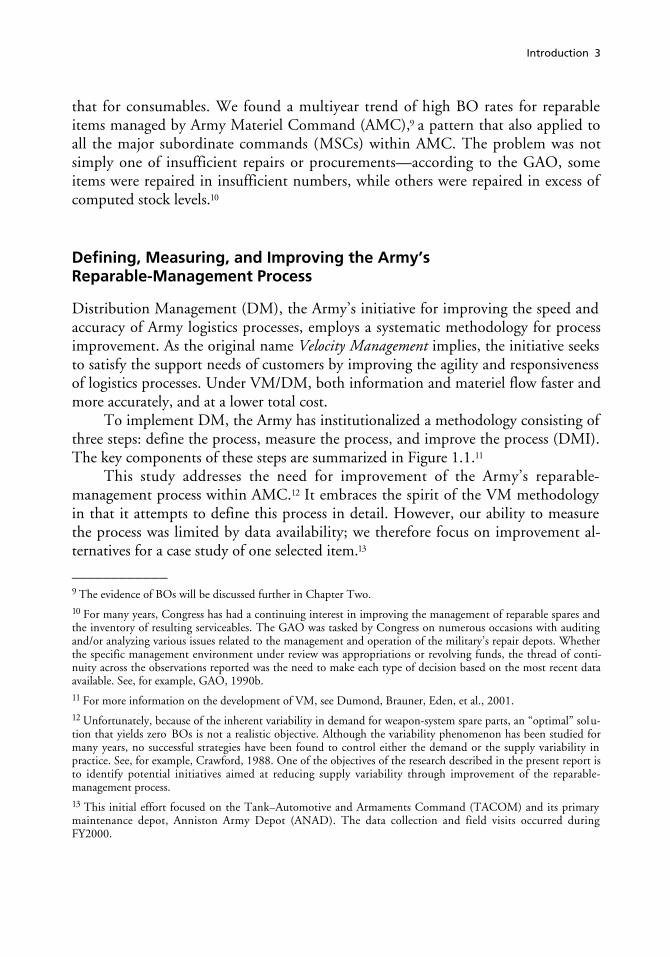
To implement DM, the Army has institutionalized a methodology consisting ofthree steps: define the process, measure the process, and improve the process (DMI).The key components of these steps are summarized in Figure 1.1.11
This study addresses the need for improvement of the Army’s reparable-management process within AMC.12 It embraces the spirit of the VM methodologyin that it attempts to define this process in detail. However, our ability to measurethe process was limited by data availability; we therefore focus on improvement al-ternatives for a case study of one selected item.13
____________9 The evidence of BOs will be discussed further in Chapter Two.10 For many years, Congress has had a continuing interest in improving the management of reparable spares andthe inventory of resulting serviceables. The GAO was tasked by Congress on numerous occasions with auditingand/or analyzing various issues related to the management and operation of the military’s repair depots. Whetherthe specific management environment under review was appropriations or revolving funds, the thread of conti-nuity across the observations reported was the need to make each type of decision based on the most recent dataavailable. See, for example, GAO, 1990b.11 For more information on the development of VM, see Dumond, Brauner, Eden, et al., 2001.12 Unfortunately, because of the inherent variability in demand for weapon-system spare parts, an “optimal” solu-tion that yields zero BOs is not a realistic objective. Although the variability phenomenon has been studied formany years, no successful strategies have been found to control either the demand or the supply variability inpractice. See, for example, Crawford, 1988. One of the objectives of the research described in the present report isto identify potential initiatives aimed at reducing supply variability through improvement of the reparable-management process.13 This initial effort focused on the Tank–Automotive and Armaments Command (TACOM) and its primarymaintenance depot, Anniston Army Depot (ANAD). The data collection and field visits occurred duringFY2000.

4 Improving the Army’s Management of Reparable Spare Parts
Figure 1.1Key Components of the Define-Measure-Improve Methodology
RAND MG205-1.1
Iterate forcontinuous
improvement
• Determine customers, inputs, outputs, value added• Use walk-through to achieve common understanding
Define the process
• Define metrics and identify data• Determine baseline performance• Diagnose performance drivers• Provide reports and feedback
Measure process performance
• Establish goals• Develop improved process designs• Implement change
Improve the process
We have not attempted to address the overall improvement of depot mainte-nance per se. The depot component-repair workload is not the largest part of the de-pot maintenance workload, in terms of either man-hours or budget. However, com-ponent-repair capabilities and capacity are essential for executing the larger overhauland recapitalization workloads and for direct support to warfighters. Thus, not onlywill improved effectiveness and efficiency in component repairs return serviceableassets to the shelf, where they will be available to issue to Army customers, it will alsocontribute directly to other depot programs. In addition, these improvements shouldimprove overall supply system efficiency by reducing overproduction of serviceablesand other unnecessary resource investments.
Our goal is to suggest an improvement path for the reparable-managementprocess, based on the evidence uncovered during the case study and driven by rele-vant critical metrics. Our case study focuses on the M88A1 armored recovery vehicleengine.14 This engine, which has experienced persistent BO problems, is typical of alarge group of unsophisticated, older components that are needed to keep the long-lived current weapon systems in mission-ready condition. The alternatives examinedin this study call for added resource investment (e.g., increased safety stock) to bufferthe customer from the processes that are not responding rapidly enough. The as-sumptions behind a continuous-process-improvement strategy recognize that change____________14 This 10-cylinder, turbo-charged diesel engine (national stock number (NSN) 2815-00-124-5387) has 1,790cu in. displacement and comes with all accessories installed.

Introduction 5
will occur over time and that intermediate states throughout the transition to the de-sired state may require some “targeted” investment or infusions of capital. However,these investments will likely provide better service at the same or lower total cost tothe Army.
This analysis was undertaken with the knowledge that a logistics-systems mod-ernization effort is under way to improve decision support in both the supply andmaintenance management areas. Furthermore, AMC has undertaken an effort to im-prove depot maintenance through the application of “lean” manufacturing conceptsat each of its depots.15 Our analysis specifically addresses improvement opportunitiesthat need not await technological modernization, nor do they conflict with it. Fur-thermore, the recommendations presented here are totally congruent with a “lean”view of both the planning and execution of the reparable-management process.
Organization of This Report
The remainder of the report is organized into five chapters. Chapter Two takes acloser look at the nature of the problems associated with a high BO rate. ChapterThree examines the current reparable-management process and identifies some keyissues that need to be addressed within that process. Chapters Four and Five offersolution alternatives relevant to inventory planning and repair management, respec-tively. Chapter Six summarizes the recommendations for improving the reparable-management process.
____________15 See Chapter Five for a more detailed discussion of lean manufacturing.

7
CHAPTER TWO
Understanding the Scope of the Backorder Problem
In this chapter, we employ a suite of metrics to examine the issues involved in repa-rable-inventory planning and repair activities. We first define the order-fulfillmentprocess, which is delayed by BOs, and we then introduce metrics to measure the ef-fects of those BOs. The metrics measure not only the BO rate (the proportion ofrequisitions that became BOs), but also the impact of high BO rates on overall per-formance, i.e., responsiveness to customer requisitions.
Defining the Order-Fulfillment Process
Define, the first step of the VM process-improvement methodology, produces a clearpicture of the process (common to all participants and stakeholders) through processmapping. Figure 2.1 illustrates the Army’s order-fulfillment process for spare partsand related materiel needed by equipment mechanics, the ultimate customer in thisexample. Within the figure, solid lines represent materiel flows, and dashed lines rep-resent information flows.
The customer (shown on the left) diagnoses an equipment fault and initiates arequest for a part, which can be filled either by one of the installation’s tactical (re-tail) supply activities or by the national-level (wholesale) supply system. When therequest for a part cannot be met locally, the national-level supply manager passes therequisition on to the appropriate source for fulfillment. In the case of a reparable, therequisition would go to a national distribution center, which would supply the part.If no reparable items are currently available to fill the request, a BO or due-out isgenerated, and BO status information is passed to the supply activity supporting thecustomer. Eventually, the customer’s request is satisfied by either a repaired service-able or a new asset.

8 Improving the Army’s Management of Reparable Spare Parts
Figure 2.1The Order-Fulfillment Process
RAND MG205-2.1
National-level supply systemInstallation or tactical-level supply
NationalRegional
Ultimatecustomer
Nationalbackorder
Equipmentreadiness
XProcure
orrepair
Unitpartsclerk
Tacticalsupply
DLAdistribution
center
Tacticalsupply
Supplymanagement
Supplymanagement
Shoppartsclerk
Nationalissue
Referral
Shopfill
Shopfill
ASLissue
Componentrepair
Maintenanceto maintenanceFault
corrected
Faultrecorded
X
Metrics to Define the Scope of the BO Problem
Following the VM philosophy, we chose metrics that reflect the perspective of theultimate customers and their supply activity or forward distribution point (FDP),formerly known as the supply support activity (SSA). These metrics—BO rate, cus-tomer wait time (CWT), and workaround rate—all relate to the responsiveness andeffectiveness of the supply chain.1
Extent of the BO-Rate Problem
We began our research by measuring confirmed BO status recorded in the customers’Standard Army Retail Supply System (SARSS) and archived in the Corps Theater____________1 The metrics used in such process-improvement efforts are not necessarily the same metrics reported elsewherewithin the Army logistics system. These “new” metrics tend to evolve as the improvement efforts that use themevolve and need measurement better aligned with customer needs and process diagnosis.
The BOs reported here represent a total composite statistic that includes those for requests by the ultimateArmy customer and those for field-level supply-activity replenishment. The reported statistics do not include BOsfor other requesters (e.g., depot-level maintenance requests).

Understanding the Scope of the Backorder Problem 9
Automatic Data Processing Service Center (CTASC) document history files.2 Theextent of the BO problem can be seen in Figure 2.2, which displays five years of BOrates for spare parts (supply Class IX items), sorted by national agencies that managedifferent sets of these items.3 During this period, the BO rate for AMC-manageditems was higher than that for items managed by the Defense Logistics Agency(DLA) and the General Services Administration (GSA).4
The BO rate, or percentage, was calculated by dividing the number of BO req-uisitions (i.e., requisitions with “BB” status according to the item manager) by thetotal number of requisitions for the same period. Only requisitions for spare parts are
Figure 2.2BOs Reported for Army Tactical-Level Requisitions to the National System
RAND MG205-2.2
Bac
kord
er r
ates
FY1998 FY2000 FY2002FY2001FY1999
.20
.15
.10
.5
.25
0
SOURCE: Army LIDB data, Class IX BO rates for closed requisitions, CONUS and OCONUS active units, no DVDs.
AMC
DLA
GSA
____________2 Backorders are indicated by a supply-status code of “BB.”3 The BO rate is calculated based on all spare-part requisitions by active Army retail customers (i.e., BO requisi-tions/total requisitions). Rates are calculated based on requisitions, not NIINs (national item identification num-bers). The Army sorts all NIINs into ten separate categories. The spare parts used in our calculations are in theClass IX category.4 The items ordered by Army customers have inventory-management processes performed by AMC, the DefenseLogistics Agency (DLA), or the General Services Administration (GSA). DLA tends to manage more-commonitems used by more than one service or agency, while AMC tends to manage specialized and weapon-system-unique items for the Army. Reparables tend to be managed by AMC. The DLA-managed items also tend to costless than the AMC-managed items. Those GSA-managed items are generally paper and housekeeping-type items,but they also include a small number of consumable items in support of repairs.

10 Improving the Army’s Management of Reparable Spare Parts
included. This metric does not consider the duration of the due-out status or thetime required to fill the customer’s request. It merely reflects the proportion of BOoccurrences.
The BO rates in Figure 2.2 do not correspond to those computed internally bythe individual agencies. Each agency has slightly different definitions of BO rates,based on the factors under its control.
Table 2.1 provides some added perspective on the data summarized in Figure2.2. The table shows the population of requisitions by tactical-level Army active-dutycustomers. These are requisitions for spare parts that were delivered to customersduring FY2002. The data are sorted by the wholesale agency that manages a NIIN(national item identification number), and by whether that NIIN is a reparable or aconsumable.5 The italicized percentage values are to be read horizontally (e.g., 84.3percent of the total requisitions are for DLA-managed items), and the values in boldtype are to be read vertically (e.g., 95.2 percent of the requisitions for DLA-manageditems are for consumables).
A 15 percent BO rate is the expected result of current Army inventory policy,and it is the goal in the annual Army working -capital fund (AWCF) budget process;the supply managers (in AMC) and their models thus compute inventory levels usingan 85 percent supply-availability goal (1.0 – 0.85 = 0.15). However, although the 85percent availability factor is incorporated into numerous policies and algorithms, wehave not found the source of this specific goal in law, written policy, or regulation
Table 2.1Requisitioning Data for FY2002
FY2002 AMC DLA GSA Total
NIINs requisitioned 22,365 (11.1%) 178,312 (88.8%) 160 (0.08%) 200,837Reparable 15,154 (40.3%) (68%) 22,378 (59.6%) (13%) 14 (0.01%) (9%) 37,546 (18.7%)Consumable 7,211 (4.4%) (32%) 155,934 (95.5%)
(87%)146 (0.1%) (91%) 163,291
(81.3%)
Total requisitions 824,824 (15.4%) 4,503,093 (84.3% ) 15,543 (0.3%) 5,343,460Reparable 481,514 (69.1%)
(58.4%)215,179 (30.8%)
(4.8%)112 (0.02%) (0.7%) 696,805 (13%)
Consumable 343,310 (7.4%)(41.6%)
4,287,914 (92.3% )(95.2%)
15,431 (0.3%)(99.3%)
4,646,655(87%)
BO requisitions 177,528 405,371 911 583,810Reparable 115,632 35,816 3 151,451Consumable 61,896 369,555 908 432,359
BO rate 21.5% 9.0% 5.9% 10.9%Reparable 24.0% 16.6% 2.7% 21.7%Consumable 18.0% 8.6% 5.9% 9.3%
SOURCE: LIDB, Class IX, CONUS and OCONUS (overseas, outside the CONUS) active units, no DVDs.
____________5 In this case, a reparable could be either a field-level or depot-level item, depending on the applicablemaintenance-recovery code.

Understanding the Scope of the Backorder Problem 11
within the Army or the Office of the Secretary of Defense (OSD). DLA is not usingthe same policy and has exceeded the 85 percent supply-availability goal significantly,both overall and for consumable items, to the benefit of Army customers in FY2002.Regardless, inventory-policy levels should be set on the basis of desired customer mis-sion-support capabilities, considering the conditions of logistics responsiveness, de-mand predictability, acceptable risk, and acceptable cost.6
As shown in Figure 2.3, BO rates have been problematic for all categories ofAMC-managed items, including depot-level and field-level reparables, as well as con-sumables.7 A depot-level reparable (DLR) is designated for repair or disposal at thedepot level of maintenance (or is designated for repair below the depot level, but ifrepair cannot be accomplished at that level, shall have its unserviceable carcass for-
Figure 2.3BO Rates for AMC-Managed Items, by Type of Repair or Consumable
RAND MG205-2.3
Bac
kord
er r
ates
DLR ConsumableFLR
.30
.25
.20
.15
.10
.5
.35
0
SOURCE: Army CTASC and LIF/LIDB, all AMC Class IX wholesale sales, CONUS and OCONUS active units, no DVDs.
FY1998
FY1999
FY2000
FY2001
FY2002
____________6 In recent years, the 85 percent supply-availability goal has been discussed in terms of the financial constraintsassociated with reduced budget levels. However, this goal has been a consistent constraint value in the Pentagonfor at least the last 40 years. At any rate, the BO rates for AMC-managed materiel (as measured from the tacticalArmy customer’s perspective over this five-year period) exceeded 15 percent each year.7 Since this research began, the Army archive for such data has migrated from the Logistics Information File(LIF) to the Logistics Information Data Base (LIDB).

12 Improving the Army’s Management of Reparable Spare Parts
warded to the depot for repair or condemnation, or reported to the IM for disposi-tion).8 The technical complexity and equipment necessary to complete the repair de-termines the level of repair designated. A field-level reparable (FLR) is designated forrepair or disposal below the depot level of maintenance. A consumable item is onethat is replaced by a new item at the end of its service life, when it is used up beyondthe level of economically viable repair. As shown in Figure 2.3, BO rates for all threecategories of AMC-managed items exceed the 15 percent BO standard, with theDLR BO rate reaching 30 percent.
Moreover, BO rates are high across all three major subordinate commands(MSCs) within AMC, as shown in Figure 2.4.9 The figure shows overall AMC BO
Figure 2.4BO Rates at the MSCs Within AMC
RAND MG205-2.4
Bac
kord
er r
ates
TACOM
Warren Aviation MissileRock Island
AMCOMCECOM
.30
.25
.20
.15
.10
.5
.35
0
SOURCE: Army CTASC and LIF/LIDB, all AMC Class IX wholesale sales, CONUS and OCONUS active units.
FY1998
FY1999
FY2000
FY2001
FY2002
____________8 See Department of Defense, 1995, for definitions.9 The BO rates are considered high here because they exceed the Army’s target goals. Also, the customers re-ported BOs as a problem during the VM initiative. More-recent RAND Arroyo Center research (unpublished) byEric Peltz and Thomas Held benchmarked commercial fleet metrics for the retail and tactical levels and foundboth the target goals and the performance achieved to be typically well above the 85 percent target. At the sametime, the Army’s performance does not appear to be significantly worse than that of the other military services.

Understanding the Scope of the Backorder Problem 13
data across the MSCs, with Tank–Automotive and Armaments Command(TACOM) items further split among management activities at Warren, Michigan,and Rock Island, Illinois; and Aviation and Missile Command (AMCOM) items seg-regated into aviation and missile, both managed at Huntsville, Alabama. Communi-cations and Electronics Command (CECOM) is at Ft. Monmouth, New Jersey.As shown, AMCOM has the highest rates. CECOM’s BO rate was just above the15 percent level at the beginning of the period but has increased. BOs at TACOMWarren exceeded 20 percent throughout the period, peaking at over 26 percent.Rock Island had the best performance, yet its BO rate exceeded 15 percent in two ofthe five years. The data indicate that each of the MSCs has had problems consistentlymeeting the 15 percent BO rate goal.10
Effect of High BO Rates on Customer Wait Times
BOs affect customers, who must either delay needed repairs or resort to workaroundswhen a part is not available. The CWT metric helps illustrate these problems. CWTis the period from the time the mechanic’s supply clerk enters the requisition into theUnit-Level Logistics System (ULLS) or Standard Army Maintenance System (SAMS)computers until the materiel is processed and available to that clerk at his or her sup-ply-support activity or FDA (a local supply warehouse). CWT includes BO delaysand encompasses all supply sources.11 Figure 2.5 places the CWT metric within thegeneralized process flow diagram shown in Figure 2.1.
The process begins at the left side of Figure 2.5 with an equipment-maintenance activity that identifies the need for a part. The supply clerk then entersa request, which flows to the FDP and SARSS for processing. If the part is available,it will be issued from the FDP’s inventory, the authorized stockage list (ASL); in thiscase, the CWT “clock” stops at the point at which SARSS releases the materiel re-lease order (MRO). If the part is not available at the direct supporting FDP, auto-mated supply-management actions search for sources at other local FDPs beforerouting the requisition to the IM for that specific national stock number (NSN). TheIM at the national inventory-control point (NICP) searches storage depots, repairprograms, and vendors to eventually satisfy the customer’s requisition. The length ofthe CWT depends, in part, on how long it takes for this process to be completed.12
____________10 These charts compare only BO rates. The number of requisitions processed by each of these organizationsvaries dramatically.11 CWT was developed to track the total time from the time a mechanic asks for a part until he or she has it inhand to perform a maintenance task. However, the current Army data system does not record the time betweenthe part’s arrival at the SSA and the mechanic’s receipt of the part. These limitations are not preventing the Armyfrom making continuous improvements to its process activities.12 For more explanation of CWT, see CWT and RWT Metrics Measure the Performance of the Army’s LogisticsChain for Spare Parts, 2003.

14 Improving the Army’s Management of Reparable Spare Parts
Figure 2.5Process Flow Diagram for Army Field-Level Customer Requisitions
RAND MG205-2.5
National-level supply systemInstallation or tactical-level supply
NationalRegional
Ultimatecustomer
Components of CWT
Nationalbackorder
Equipmentreadiness
XProcure
orrepair
Unitpartsclerk
Tacticalsupply
DLAdistribution
center
Tacticalsupply
Supplymanagement
Supplymanagement
Shoppartsclerk
Nationalissue
Referral
Shopfill
Shopfill
ASLissue
Componentrepair
Maintenanceto maintenanceFault
corrected
Faultrecorded
X
Documentdate
(of request)
Issue date(by SSA)
Figure 2.6 illustrates the lengthy CWT that can be associated with a BO. Thefigure presents Class IX CWT performance between January and June 2002 in sup-port of all customers at an installation with a mechanized infantry division.
The leftmost two bars show total overall CWT, sorted by AMC- and DLA-managed items. Each double set of bars following Total CWT displays CWT for eachsource of fill. The three-part bars show the variability in CWT. The top of each darkgray segment marks the point (in days) at which 50 percent of the requisitions werecomplete, while the top of each medium-gray segment marks the 75th percentile,and the top of each light-gray segment, the 95th percentile. The squares within thebars indicate mean performance, while the open ends above the bars indicate that themeasurement extends beyond the 100-day scale presented. This chart also displays (astriangles) the percentage of requisitions filled from each source of fill. The percent-ages (right axis) for all of the sources sum to the 100 percent depicted in the TotalCWT bars.
The 50th percentile for BOs extends past the 40-day mark, and the columns ex-tend well beyond the 100-day scale of the figure for both DLA- and AMC-manageditems requested by this division. The rightmost categories, DVD and Other, also

Understanding the Scope of the Backorder Problem 15
Figure 2.6CWT Statistics for a Mechanized Infantry Division Installation
RAND MG205-2.6
CW
T (d
ays)
Perc
enta
ge
of
cust
om
er is
sues
AMC DLA AMC DLAAMC DLAAMC DLAAMC DLAAMC DLAAMC DLA AMC DLA
DVDBOImmediateissue
Localrepair
ReferralASLissues
Total CWT Wholesale
Other
90
40
30
20
10
100
0
SOURCE: CTASC data, Ft. Stewart (January–June 2002).
80
70
60
50
90
40
30
20
10
100
0
80
70
60
50
6.84.0
0.2
6.1
13.2
40.838.9
009.012.3
35.8
27.6
3.0
0–50%
50–75%
75–95%
% of fills
Mean
have some long CWTs. However, taken together, these categories comprise less than10 percent of either the DLA- or Army-managed requisitions.13
For the period examined (January to June 2002), these customers received over50 percent of their requisitions for AMC-managed items from wholesale sources, andapproximately 25 percent of those wholesale-filled requisitions were BOs.14 DLA per-formed better than AMC with respect to this CWT metric at this installation, with aBO rate of about 13 percent of national-level fills. This installation’s CWT is basi-cally consistent with the aggregate Army data shown in Figures 2.2 through 2.4, al-though the rates do vary from unit to unit because of equipment and other differ-ences.15
____________13 We do not know whether any of these were BOs. We only know the times involved, and because the numbersare small, they are not discussed further in this report.14 Wholesale immediate issues plus BOs, or 38.9 + 13.2 = 52.1, while 13.2/52.1 = 0.253 or ~25 percent.15 It is important to remember at this point that the BO rate shown in Figures 2.2 and 2.4 is calculated only withrespect to the requisitions passed to wholesale; it does not include requisitions satisfied from local sources (i.e.,ASL, referrals, and local repair).

16 Improving the Army’s Management of Reparable Spare Parts
Summary
The evidence presented in this chapter supports the anecdotal reports that retailArmy customers have been facing higher-than-expected BO rates, particularly forreparable items. For at least some of these items, the number of repairs occurring atthe depots is insufficient to meet demands. In other cases, the current reparable pro-cess has resulted in repairs in anticipation of customer needs that did not occur asprojected, increasing (and wasting) inventory and repair investment. In the nextchapter, we will examine the process used to set inventory levels and manage thedepot-level reparable workload. This discussion will help to assess whether IMs arenot planning sufficient quantity or whether other problems account for the insuffi-cient supply of serviceable reparable items.

17
CHAPTER THREE
Understanding the Reparable-Management Process
To understand what is driving the Army’s high BO rates, we need to examine thereparable-management process, which sets inventory levels and returns serviceablereparable assets to the shelf. This process brings the supply management and repairactivities into a single integrated process. The intended output is the availability ofadequate serviceable inventory to meet expected demands. This chapter defines thereparable-management process and identifies issues that impact its effective and effi-cient functioning.
In this analysis, we are attempting to respond explicitly to an evolving Armymaintenance concept that calls for troubleshooting and parts replacement forward (inthe field) and component repair to the rear (i.e., in support echelons that are re-moved physically from the engaged forward mission forces).1 This concept is in-tended both to improve effectiveness by reducing the support footprint forward andto improve efficiency by consolidating repair capacity and capabilities. The shift tothis new concept could ultimately produce changes in the reparable workload at theAMC depot level. Thus, the Army has specified the need for a highly responsivereparable process and repair activities that can quickly return items to a serviceableand ready-to-issue condition.2
____________1 A maintenance concept and policies typically define some of the parameters that supporting repair processesshould meet. Army Regulation 750-1, “Army Material Maintenance Policy” (dated August 18, 2003), was revisedto incorporate this new view even as the concept continues to evolve. The previous policy in the July 1, 1996,version, Para 3-1h, was “Repair on site, whenever possible, using the lowest level maintenance activity that has thecapability and authority to perform the work. Repair forward will minimize repair times by minimizing evacua-tion of materiel.” The language contained in the new version, Para 3-1b, says the “emerging maintenance policy”will help reduce “the forward deployed logistics footprint. This emerging ‘replace forward, repair rear’ policy willreplace the Army’s current ‘fix forward’ policy for future Army units.” The same paragraph goes on to state “theArmy is examining the elimination of our current four-level maintenance system in favor of a more-simplifiedtwo-level maintenance system” (emphasis added).2 This research does not explicitly address the issues of privatization or other alternatives to organic repair capac-ity or capability. It also does not address the projection of workload by location that might result from changingpolicy alternatives. In this study, we assumed that the current AMC installation alignment exists, and we at-tempted to determine what could be done within those conditions in the near term to bring about significantimprovements in support performance. Further, we have attempted to find avenues for improvement within thecontext of existing information technology (IT) capabilities.

18 Improving the Army’s Management of Reparable Spare Parts
The Current Reparable-Management Process
The reparable-management process is ultimately driven by the need for reparables attactical weapon-system or end-item repair activities, as illustrated in Figure 3.1.3
As shown in the left portion of the figure, evidence of an end-item fault or mal-function is discovered during equipment operation or within the larger context ofmaintenance-process activities (e.g., periodic inspections). The weapon system orend-item may be rendered completely inoperative or may be merely degraded in
Figure 3.1Key Activities of the Current Reparable-Management Process
RAND MG205-3.1
• Periodic inspections• Servicing consumables• Modification• Etc.
Unserviceablereturn
Inspectionand
operationalchecks
Troubleshoot/diagnose
Repair-process activities
Maintenance-process activities
Evidence ofmalfunction
or fault
Partsrequest
Partsissue
Nationalsupply
interface
Todefense
distributionsystem
Readyfor use
Repair
Removeand
replacecomponents
Weaponsystem
orend-item
Tacticalsupply
supportactivity
Material not available from tactical sources and replenishments generates requisitions to national level via DAAS
____________3 There are other sources of demand for reparable assets (e.g., end-item overhaul and modification programs andforeign military sales (FMSs)). However, Figure 3.1 shows the classic rationale for the reparable-managementprocess as an approach for sustaining military operations.

Understanding the Reparable-Management Process 19
capability. In either case, a repair action, shown in the middle portion of the figure, isrequired to return the item to its intended level of capability.4
In initiating a repair action, an individual with the necessary technical skills andequipment typically performs a three-step series of activities to (1) determine pre-cisely what is wrong and what must be done to restore capabilities (including order-ing necessary parts); (2) perform the actual repair tasks (which often involve the re-moval and replacement of parts or components); and (3) inspect and operationallycheck to ensure that the required capability has been restored.
Step 2 is of primary interest in this discussion. If a mechanic determines that aserviceable reparable is needed to complete the repair of an end-item, he or she willorder the part. Ideally, the replacement part or component will be available in eithertactical-level or national-level inventories of serviceable spares. This activity is illus-trated on the right-hand side of Figure 3.1. Tactical-level inventories are replenishedfrom the national level, and the national level is replenished by a separate set of repairactivities.
Figure 3.2 provides a detailed view of the order-fulfillment process, includingthat for reparable assets, at the tactical level.5 The purpose of the reparable-management process is to respond appropriately to customer demands by repairingunserviceable returns to keep serviceable national inventory at required levels.6 As theorder-fulfillment process activities occur, the inventory records for the requisitioneditems are adjusted to reflect the use of inventory with respect to both total systeminventory and the level at the location tasked to fill the order.
____________4 We use the term maintenance to refer to all the actions performed on equipment to ensure operability and torestore degraded conditions. Maintenance includes formal and informal inspections for condition, includingscheduled services. It also includes the servicing of any consumable commodities such as fuel, oil, and water, aswell as troubleshooting of malfunctions and the removal and replacement of items necessary to restore degradedconditions. Finally, it includes modifications, remanufacturing, and overhauls intended to upgrade capabilities,extend service life, or otherwise improve the condition of components or end-items. Repair is one component ofthe larger maintenance process; it refers to actions that restore a malfunctioning item to serviceable condition. A re-pair cycle begins when a malfunction is identified and includes all actions necessary to return the item to service-able condition. In the case of component repair, it also includes positioning of components for potential issueagainst a future requirement. In other words, the repair cycle involves all actions required throughout the fullbroken-to-fixed cycle for both end-items and components.5 Detailed discussion of the order-fulfillment process can be found in in Wang, 2000, and Dumond, Brauner,Eden, et al., 2001. This report focuses on the use of critical information generated within the order-fulfillmentprocess to signal the reparable-management process that inventory replenishment action is required. This is anexample of the interdependence among the various Army logistics-system processes.6 Inventories for resources other than reparable assets must also be restored via appropriate process activities.However, these activities are not illustrated or discussed here.

20 Improving the Army’s Management of Reparable Spare Parts
Figure 3.2Reparable-Management Process Activities to Replenish Serviceable Inventories
RAND MG205-3.2
Unserviceable returns
Demand andinventory data
Reparable-process activities
11
10
1
12
6
5
789
Requisition process segments definea distribution supply chain
Unloadand hold
Doc to est(establishing the requisition)
MRO cut(source of the requisition)
Transit Holdand loan
Moveto POE
CCPactivities
Replenishment of national assets from other than repair is not addressed here
Tacticalreceipt
Distributioncenter
Itemmanager
POE
Tacticalsupplysystem
Sourceof
repairMaterialneeded
Receipt
processing Delivery
POD
DAAS
Serviceable
Move
to C
CP
2
4
Supply-management
activities
CCP/CFS
DAAS
3
Pick,pack,ship
Figure 3.3 provides a high-level view of the reparable-management process thatfocuses attention on its two critical components, supply-management activities andrepair activities. The supply-management activities include both adjusting inventoryrequirements and initiating actions for item repairs and vendor procurements thatmeet those requirements. This view also emphasizes the other primary process inputin the reparable-management process: the unserviceable return or malfunctioningcomponent that is repaired and returned to inventory to meet future customer de-mands.
A mechanic’s ability to complete an end-item repair can hinge on whether ornot a reparable component is available and how long the mechanic will have to waitto receive it. Thus, the end-item repair process depends critically on having sufficientnumbers of serviceable reparables, which depends, in turn, on the effectiveness andresponsiveness of the process for planning and executing depot-level reparable work-load. This process is discussed below.

Understanding the Reparable-Management Process 21
Figure 3.3Supply-Management and Repair Activities of the Reparable-Management Process
RAND MG205-3.3
Reparable-management-process activities
Unserviceablereturns
Demand andinventory data
Distributioncenter
(inventory)
Supply-managementactivities
Serviceable output
Sourceof
repair
Depot-Level Reparable Workload
The process for managing the depot-level reparable workload has two main compo-nents: planning and execution. The planning activities address a long time horizon,with a primary focus on long-term needs, such as budget and capacity issues, andsome short-term issues, such as monthly replanning. Execution activities address thenear-term issues that allow the process to be responsive to the uncertainty of actualcustomer demands and nonforecast mission needs. The execution activities also in-clude the repair activities at the source of repair.
Planning for Both Near-Term and Long-Term Needs
The current planning process for a reparable is intended to address both near-termand long-term needs. It produces recommendations for inventory levels and repairand/or vendor buy quantities, and it also provides input to the Army working-capitalfund (AWCF) budget process and to program-objective memorandum (POM)budget planning, which has a rolling six-year planning horizon. The POM feeds thePlanning, Programming, and Budgeting System (PPBS) and eventually the congres-sional appropriations process. The reparable planning activity results in a formal de-cision package for approval of a repair program known as a procurement-request

22 Improving the Army’s Management of Reparable Spare Parts
order number (PRON).7 In addition, the reparable planning activity ultimately con-siders vendor replenishment needs for the reparable, adjustments to repair capacity,and other long-lead-time planning considerations. When a repair PRON has man-agement approval, it is typically scheduled to begin execution 18 months later, at thebeginning of the new fiscal year that was the focus of the planning scenario.
The responsible item manager (IM) initiates reparable workload planning forArmy-managed items.8 The planning sequence used by IMs at TACOM is shown inFigure 3.4.
IMs rely on several information tools during the planning process for a repara-ble. In initiating planning activities, IMs use the Commodity Command Standard
Figure 3.4Tools Used by Item Managers to Understand Demand Patterns (Planning Sequencefor Repair-Process Program Development by TACOM IM)
RAND MG205-3.4
RD&ES
CCSS Supply-control studiesand coordination
RPAS PRON
Reparable-management
outputs:
0. Allocate scarce assets
1. PRONs for future
2. Budget inputs
3. Long-range plan inputs
4. Parts-explosion coordination
5. Monthly/quarterly analysis inputs
6. PRON update/change inputs
7. Database maintenance
8. Etc.
RequirementsDetermination and Execution System
Repair andProcurementAcquisition
System
ProcurementRequest Order
Number
____________7 A reparable PRON usually deals with a single reparable NIIN. However, some complex NIINs can includeother reparable NIINs as components.8 The IM exercises broad responsibility for the management of relatively large numbers of individual Army-managed assets as part of a larger IM team. The IM maintains the data files for each item and monitors the day-to-day condition of inventories. As necessary, the IM performs supply-control studies that initiate and documentrelevant actions concerning inventory items (e.g., changes to inventory requirements, initiation of vendor replen-ishment, repair program changes). Experienced supervision is applied throughout the process, with supervisorsreviewing the IM’s efforts.

Understanding the Reparable-Management Process 23
System (CCSS),9 a mainframe-based software system that collects data on supplytransactions and executes multiple batches of transactions throughout each workday.Periodically, IMs also use auxiliary programs, including the Requirements Determi-nation and Execution System (RD&ES). RD&ES usually assesses all NSNs on amonthly basis, as scheduled by the IM.10 Database maintenance performed prior toan RD&ES analysis is a critical and potentially very large task. Although data ele-ments such as demands are updated automatically, many parts of the database main-tenance must be completed manually. After each RD&ES analysis, the IM reviewsthe output to identify problems and necessary action.
The output from RD&ES includes recommendations for changes in inventoryrequirements and repair and/or vendor buy quantities.11 The RD&ES output be-comes the primary input to the manual supply-control study that is the basis of thedecision package prepared by the IM for coordination and the eventual approval ofan official repair program, or PRON. For repair recommendations, the output in-cludes a monthly-recommended repair schedule for the remainder of the current fis-cal year and the next full fiscal year.
At TACOM, a spreadsheet-type model called the Repair and Procurement Ac-quisition System (RPAS) (shown in the middle of Figure 3.4) is used to integrateRD&ES data into a rolling six-year budget plan appropriate for its inputs to thePOM and the formal budget process. Running the RD&ES output through RPAScreates the workload levels necessary to project yearly amounts for a budget planbased on the most recent forecast of future demand.
The IM uses all available relevant data to build a formal decision package forthe approval of a PRON, shown at the right of Figure 3.4. An approved PRONauthorizes the execution of a repair-program quantity (i.e., approval is granted to asource of repair to expend resources for this purpose and for the IM to pay or reim-burse for those expenditures upon delivery of serviceables). Final approval of thePRON occurs above the IM in the decision hierarchy of TACOM or the relevantMSC. The MSC and repair-depot representatives review the PRON recommenda-____________9 An initiative is under way to replace the CCSS with a more modern system. While the initial fielding of newcapabilities began at CECOM during May 2003, neither the technical specification for the replacement systemnor a firm implementation schedule is currently available. Therefore, this discussion addresses the current IT andprocedures.10 In the past, consumable items were analyzed monthly, while reparables were analyzed quarterly; now AMCcalls for monthly analysis of all AMC-managed items. In the context of the IM’s total workload, there has been aperceived constraint on the time available for more-frequent item analysis. In addition, the analytic complexity ofreparable items is now greater, and the quarterly cycle reduced CCSS costs. It is recognized (e.g., from the repara-ble BO rates) that more-frequent review is necessary to address customer needs.11 It is logically consistent for RD&ES to recommend repairs for a given NIIN and also to recognize that a ven-dor buy of additional assets is required to maintain the total stockage basis of serviceable assets. If the CCSS data-base is accurately maintained, RD&ES can provide information on the rate of condemnations during repair, re-turn and repair pipeline times, changing demand rates, and other relevant information.

24 Improving the Army’s Management of Reparable Spare Parts
tions; approved PRONs are scheduled for implementation at the beginning of thenew fiscal year 18 months later, consistent with the budget process.
A PRON can be viewed as an evolving decision document that can become a“license” to expend the resources necessary to repair assets and thereby return service-ables to the shelf for issue to customers repairing end-items at the Army tactical leveland to others, such as other services and FMSs. The process of reviewing and ap-proving PRONs requires a number of questions to be answered concerning funds,depot repair capacity, repair-parts availability, and the status of previous PRONs.The final approved program reflects changes resulting from constrained resources inthe context of thousands of potential repair programs and replenishments throughvendor procurements.
The annual long-range planning process for reparable items typically beginswith the April run of RD&ES, at which point the demands and other historic dataelements are current as of the end of March. Since the repair program planned be-ginning in April of a given year will not be released as an approved PRON until thestart of the following fiscal year, the IM often has three PRONs going for a givenNIIN at once: the current-fiscal-year program that is executing, the last completedplanning effort that is expected to begin execution at the start of the next fiscal year,and the current planning effort that will become the PRON for the following fiscalyear. The data should necessarily integrate across these PRON efforts. Likewise, thecontinuing coordination efforts must be simultaneously reconciled across the threetime horizons. A particular IM is likely to be working this PRON process for dozensof NIINs at the same time.
The planning process for reparables also addresses some short-term issues. Inaddition to participating in the formal PRON development activities, the IM has theopportunity to develop and submit decision packages on a monthly basis to changethe current or planned PRON for a reparable item. At TACOM, these packages arereviewed within the IM’s organization and are prioritized for action. Critical needscould result in immediate staffing and coordination to replan aspects of the PRONto address customer needs. In general, the decision packages are prioritized, and themost important packages are addressed at monthly and quarterly reviews. Decisionsto change quantity or repair schedule are made after coordination and approval bythe supply, repair, and financial managers involved.
Execution of Repair Programs
Repairs cannot begin until the budget is approved by Congress, the authority AMCrequires to execute its repair programs. Even though these AMC activities are fundedvia the AWCF, the congressional appropriation funds the necessary repair-parts pro-curement. Furthermore, the individual yearly PRONs are not typically released tothe depots all at once. Although practice varies, the MSC will often initially releaseonly the first six months of spending authority for a PRON. While appropriation-

Understanding the Reparable-Management Process 25
funded customers typically have congressional authority (from a continuing resolu-tion) to continue mission activities and to requisition materiel to support those ac-tivities, the depot-level repair activity is not typically permitted to begin executionuntil the budget is passed, because of a restriction on the procurement of repair partsand a mix of DoD, Army, and local policies. Therefore, at the end of a fiscal year,repair-depot managers have an incentive to carry over some previously approved andfunded workload to occupy the available workforce.12
Once the repair depot receives authorization to proceed, it usually begins theexecution process by placing parts on order to support the new work and acceleratingthe completion of the previous, or “carryover,” PRON work that managers have beenstretching beyond the previous October to keep the workforce busy. The PRONs aretypically scheduled to level the rate of production across the period. A centralizedplanning and scheduling staff at the repair depot handles overall depot capacity andissues across work centers. Within the various work centers, certain individuals aredesignated to handle the daily interface between the shop, the centralized planningand scheduling staff, and the supporting supply activities. The shop scheduler is theIM counterpart at the repair depot. This is the person who initiates contacts withDLA to have unserviceables delivered to the shop, ensures that repair parts are avail-able, maintains records on condemnations or washouts, and works with DLA to de-liver serviceables.
When the depot is ready to begin new work, the shop scheduler calls for a batchof unserviceables or reparable carcasses to be shipped from the DLA storage facility.There are generally two reasons for inducting in batches. The first relates directly tothe need for repair parts. When the carcasses arrive from storage, each is disassem-bled, cleaned, and inspected to determine its specific repair needs. Each newly in-ducted carcass then becomes not only an item to be repaired, but also a potential do-nor of parts needed to repair other carcasses (a workaround activity known as a “robback”). Second, DLA charges per batch or delivery for withdrawing carcasses from____________12 The financial authority for depot repairs is ultimately a complex issue. Fundamentally, “no one may obligatefunds in excess of or in advance of an appropriation or in excess of an apportionment or a formal submission offunds,” in accordance with the Antideficiency Act codified in Title 31 United States Code (USC) and imple-mented by Office of Management and Budget (OMB) Circular A-34, DoD Directive 7200.1, and Volume 14 ofthe DoD Financial Management Regulation (FMR) (DoD 7000.14-R).
The depot repair of Army reparables to support tactical customers is an AWCF activity, not an appropriated-fund activity. However, the depot workload is a complex mix of appropriated and WCF tasks. The demarcationof funding among tasks in the depot workload is not always clear and segregated. For example, an engine repairedand used in an M88A1 rebuild program is ultimately funded by appropriated funds, while the same type of en-gine (i.e., same NIIN) repaired to replenish serviceable inventory in support of future tactical customer demandsis AWCF workload. Furthermore, the DoD FMR Volume 11B, Chapter 13 (par. 130102D) states, “DWCFdepot maintenance or repair does not fund the procurement of parts.”
If a continuing or other resolution permits customers to buy from AWCF inventories, it would seem thatthese revolving-fund activities should have mechanisms to replenish those same items in anticipation of continu-ing needs, whether the items are reparable or consumable. Military readiness is not well served by deferringrepairs of parts that have due-outs to tactical customers.

26 Improving the Army’s Management of Reparable Spare Parts
storage and taking them to the repair shop. The pricing policy allows depot managersto save a little on repair expenses by minimizing the number of DLA transactioncharges.
As unserviceables enter the repair process, they “explode” into an inventory ofcomponent parts and assemblies that constitute work-in-process (WIP) inventorywhose location and condition must be managed if serviceable assets are to efficientlyemerge from the process as intended. Many of the parts that constitute a reparableitem are intended for reclamation or reuse in the course of the repair. An initial disas-sembly and inspection is required to determine exactly which reclaimable parts willbe recovered and which will be condemned. Unserviceables may need to be inductedbefore all requisitioned consumable repair parts arrive, because the lead time to re-claim some parts is long and variable, and some parts will need to be replaced due tocondemnation.
When the depot shop completes a repair, the repaired item is packaged to de-fined standards and returned to DLA for processing to serviceable-asset status. TheIM is notified by DLA that serviceable assets are being added to the record. The IMthen notifies DLA as to the disposition of the completed items. The IM might directthe immediate shipment of an item to satisfy a customer due-out (i.e., a BO), or theitem might be moved to a distribution center at another location for future issue, orit might merely be left in storage at the DLA distribution center supporting the re-pair depot.
Figure 3.5 illustrates the flow of activities typical for depot-level repairs. Thedepot-level maintenance activity is very similar to that shown in Figure 3.1 for thetactical level. At both levels, the workload can involve weapon systems, end-items, orreparables. Unserviceable reparable components inducted for a PRON designed toproduce serviceable inventory are returned to serviceable inventory after repair.During the course of end-item overhauls, these same components (i.e., NIINs) mayneed to be repaired and returned to an end-item. The funding for this type of repairsis included under the PRON for the end-item overhaul.
Summary
This chapter has presented a high-level view of the current processes for planning andexecution of reparable management. The next two chapters address the supply-management processes used to support responsive depot repair and the repair activi-ties. A case study is used to provide a consistent example across both chapters thatillustrates how the current process has been functioning. Finally, some improvementalternatives suggested by commercial practice and the literature are identified.
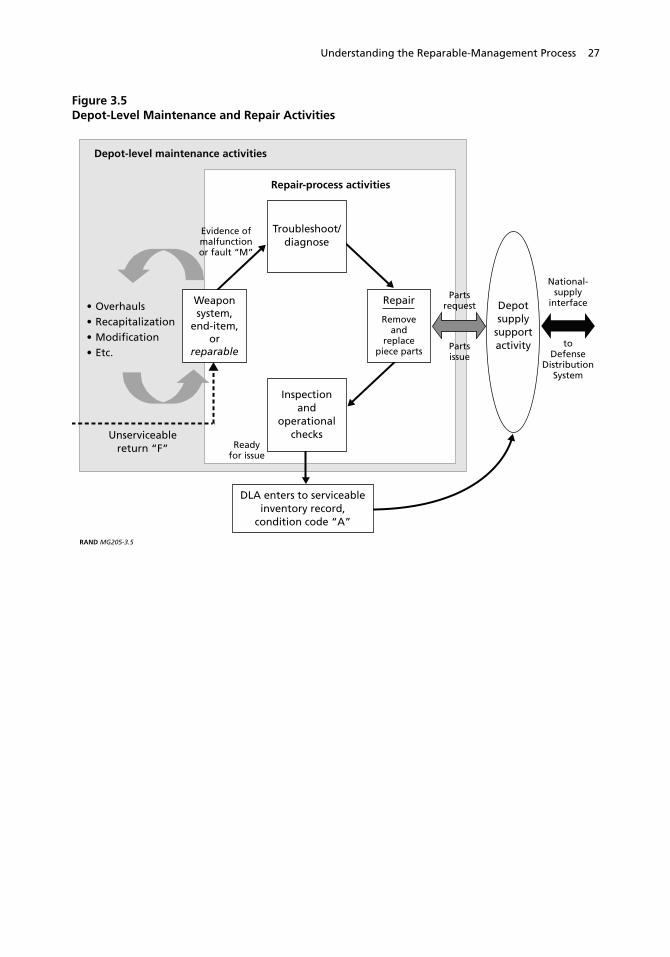
Understanding the Reparable-Management Process 27
Figure 3.5Depot-Level Maintenance and Repair Activities
RAND MG205-3.5
Unserviceablereturn “F”
DLA enters to serviceableinventory record,
condition code “A”
Troubleshoot/diagnose
Repair-process activities
Depot-level maintenance activities
Evidence ofmalfunctionor fault “M”
Partsrequest
Partsissue
National-supply
interface
toDefense
DistributionSystem
Readyfor issue
Repair
Removeand
replacepiece parts
Weaponsystem,
end-item,or
reparable
Depotsupply
supportactivity
• Overhauls• Recapitalization• Modification• Etc.
Inspectionand
operationalchecks

29
CHAPTER FOUR
Improving Planning Activities
This chapter and Chapter Five show how the reparable-management process as awhole can become more responsive to requirements. Some of the alternatives for im-provement we present emerged from interaction with managers and technicianswithin the system and some were identified from accounts of better-performingcommercial entities.
To provide a deeper understanding of the reparable-management process, weuse a case study of the M88A1 diesel engine. Our analysis of this case identified threecritical issues in the reparable-management process:
• Inaccurate long-term planning forecasts due to the length of the planning hori-zon and uncertainty in customer demands.
• A lack of separation between planning and execution in supply-managementactivities.
• Insufficient repair responsiveness to meet customer needs.
We address the first two issues in this chapter and the third issue in Chapter Five.
Key Issues in the Current Process for Planning and Executionof PRONs to Repair Reparable Items
Uncertainty in Customer Demands on Long-Term Planning Forecasts
As shown in Figure 4.1, customer demand for the M88A1 diesel engine is highly un-certain. The vertical bars show the actual monthly requisitions seen by the IM. Theaverage demand forecasts are derived from the RD&ES calculation and are based onexponential smoothing or an exponentially weighted moving average of recent de-mand history.1 The planning process lead time for the FY2000 PRON is also indi-____________1 TACOM technicians identified the type of model used by CCSS for this purpose. The database also confirmedthat the previous period’s forecast, the current-period actual demand, and a smoothing factor were present. Actualcode was not available for review.

30 Improving the Army’s Management of Reparable Spare Parts
Figure 4.1Variability in Demand for the FY2000 Reparable M88A1
RAND MG205-4.1
Mo
nth
ly d
eman
d/s
ales
of
M88
A1
eng
ines
Oct1997
Apr1999
Oct1999
Apr1998
Oct1998
PRON FY2000planning lead time
Updatedaveragedemand
Averagedemandprior to
Apr 1998
25
20
15
10
5
30
0
SOURCE: LIF, completed wholesale sales.
cated. That process began in April 1998, with the target of implementation in Octo-ber 1999 (i.e., the start of FY2000).
Uncertainty and variability in demand means that the forecast demand rate onlyoccasionally matches the actual demand in any particular month. The average de-mand rate for M88A1 engines calculated in April 1998 was about eight per month,and the planning process assumed that this rate would continue into the foreseeablefuture. However, by the time the FY2000 PRON was being implemented, the cus-tomer demand rate had increased to about 12 engines per month (about a 50 percentincrease).
In this case, the average demand increased, but reductions in demand can just asreadily be found in the overall population of reparable NIINs. Demand for reparable__________________________________________________________________
Most standard undergraduate or graduate-level texts on operations research or operations management pro-vide comparative discussions of standard forecasting techniques. See, for example, Stevenson, 2002. An exponen-tial-smoothing approach is quite reasonable for this application. However, the inherent variability in the data canstill result in significant forecasting errors, especially for forecasts far into the future (e.g., beyond three to sixmonths). Furthermore, this use of a single forecasting model is a compromise. If one is dealing with NIINs thatexhibit seasonality or trends or other obvious known demand patterns, better-performing algorithms could beused for those NIINs with better results. However, CCSS uses a single forecasting model in its current form.Even with multiple models as options, both the variability and the other environmental factors associated withthe military operating scenario result in uncertainty in demands over time.

Improving Planning Activities 31
items usually derives from malfunctions associated with events such as periodic in-spections, training events, exercises, deployments, and various mission scenarios.
Although this case study addresses a single low-tech NIIN, the high variabilityand uncertainty (i.e., nonstationary mean) seen should not be considered atypical.2
The quantity of most military equipment types is relatively small at the dispersed tac-tical-level units, and therefore demand statistics at that level can be misleading.Across the whole U.S. military establishment, the numbers of demands are usuallylarge enough to build some confidence in expected or average demand, but varianceis additive, and the observed variability then tends to be significant. Furthermore,changes in average demand, as seen in this case study, are not always logically ex-plainable or known in advance, and this leads to significant uncertainty.
The point of this discussion is not about recognizing emerging trends but aboutrecognizing the inevitable difficulty of precisely forecasting demand.3 Army equip-ment usage is not relatively constant in rate or duration over time. In peacetime,equipment is used in training activities that tend to be infrequent and episodic.When equipment is deployed in combat operations, the pace of use can easily in-crease by a factor of ten or more. Furthermore, not all training or combat operationsuse all equipment components at the same rate. Therefore, merely knowing generaloperating statistics will not necessarily translate into uniformly better forecasts ofmalfunctions and reparable-part demands.
A smoothed production plan, such as that used in the current reparables pro-cess, tends not to cohere well with the uncertainty of demand. An example of theplanning process is shown in Figure 4.2. As noted earlier, at certain times of the year,an IM has two repair planning packages in progress at the same time, one that wasjust initiated in April of the current year and one initiated in April of the previousyear and now approaching the final formal decision stage and the start of implemen-tation. In addition, as a result of an earlier planning cycle, the IM is also dealing withan active PRON that is being executed.
The solid horizontal bars labeled Average demand in Figure 4.2 indicate the av-erage customer demands available to the RD&ES model calculation at the start ofeach planning cycle, and the dotted lines that begin where the average-demand linesend each April represent the forecasts the model predicted based upon those de-mands. In this case, from April 1998 to April 1999, the average demand for theseengines increased by more than 25 percent. By mid-FY2000, the average demandhad grown from eight engines per month to more than 18 per month.____________2 Crawford, 1988.3 We are not suggesting that more-relevant data and more-sophisticated modeling could not provide significantlybetter statistics and predictive capability.

32 Improving the Army’s Management of Reparable Spare Parts
Figure 4.2The Repair-Planning Processes for Different PRONs
RAND MG205-4.2
Mo
nth
ly d
eman
d/s
ales
of
M88
A1
eng
ines
FY1998
Oct1997
Oct1999
Oct2000
Oct1998
FY2000
PRONFY1999
planninglead time
PRON FY2000planning lead time
PRON FY2001planning lead time
PRON FY2002planning lead time
Averagedemand
Averagedemand
Averagedemand
FY1999
25
20
15
10
5
30
0
SOURCE: Notional data based on LIF, completed sales.
The net result of this situation is seen in Figure 4.3. The approved monthly-level PRON production program for FY2000 is shown, along with the actual due-outs (i.e., customer BOs) plus the cumulative monthly demands minus achievedproduction as recorded in CCSS. The program coordination and negotiation resultedin a FY2000 PRON to produce equal monthly quantities, a smoothed productionplan that was characteristic of the majority of data reviewed. But the smoothed plandid not match well with actual demands.
The mismatch between the forecasts and actual demands grew worse over time.Note that the y-intercept of the actual demand plus BO is at 50 engines, which rep-resents the fact that by October 1999, the IM had accumulated 38 due-outs or BOsto customers. In addition, the increasing customer demands during the year increas-ingly diverge from the PRON. The projected-demand line represents the projectedsales from the April 2000 RD&ES output. The continued expected linear divergenceindicated is based on the higher average sales and the fact that the number of enginesrepaired had not increased; changes to the FY2000 PRON had not occurred.
The RD&ES detailed forecasting capability (like that of any forecasting algo-rithm) is unreliable beyond a few months, and forecasts beyond 18 months are of

Improving Planning Activities 33
Figure 4.3FY2000 M88A1 PRON vs. Actual Demands
Cu
mu
lati
ve e
ng
ine
rep
airs
OctFY2000
SepAugJulJunMayAprMarFebJanDec OctFY2001
Nov Nov
250
200
150
100
50
300
0
RAND MG205-4.3
SOURCE: CCSS, TACOM.
Actual demand + BOProjected demandFY2000 PRON
little practical use for detailed management decisions. This is not necessarily an indi-cation that the wrong forecasting model is being used, however. We do not attemptin this study to recommend an optimal forecasting model or algorithm. Based uponthe limited data we have seen, the current algorithm is reasonable, given the data andsystems available.
The point is that no algorithm can yield a value that can be predicted as far inadvance as Army procedures are trying to project without procedures for updatingforecasts. Both variability in demand and the dynamic military operating environ-ment argue against long-term forecast accuracy at the NIIN-level. While improve-ments may be possible and should be pursued at a moderate level of effort, the onlyavailable fix is to do more-frequent replanning. In forecasting and planning for thefuture, the Army should explicitly incorporate periodic replanning that allows theevolving plan to be informed by changes that would otherwise result in unfulfilledcustomer needs or overinvestment.
Although the forecasting component of the RD&ES module could probably beimproved, the module is reasonable, and it provides useful monthly repair-quantityprojections for the near term insofar as historical demands are useful in predicting

34 Improving the Army’s Management of Reparable Spare Parts
future demands. Again, the change we recommend is to replan more frequently, ineffect reducing the forecast horizon used for execution. RD&ES has the capability totake into account program changes in equipment density and intensity of operations,as well as other “planned” factors that would not otherwise be reflected in historicaldata when forecasting demand. The model also has explicit visibility of returned un-serviceable assets available for induction into repair and historical recovery factors forprojections.4 The repair plans it provides are reasonably constrained by the availabil-ity of items to be repaired.
RD&ES does more than merely forecast demand; it also builds a repair plan tomeet computed inventory requirements necessary to satisfy that demand. It looks atproduction capacity and repair times to determine whether simultaneous repair andvendor procurement is warranted to meet calculated expected demands.5 RD&ES isalso a reasonably effective tool for budget planning and aggregate planning tasks suchas capacity planning—as long as all known factors are updated in the CCSS database.
At the present time, however, the model’s forecasting abilities are limited be-cause of insufficient data. Its basic sales forecast uses exponential smoothing to re-spond relatively quickly to changing demand patterns. Until recently, when the Sin-gle Stock Fund (SSF) initiative was fully implemented, the only sales figures availableto the model (including due-outs) were at the national level.6 Thus the model didnot consider the true tactical customer demand rates, nor did it consider any assetsrepaired at an echelon below depot level. As a result, demands unknown to the IMcould become a future production concern. For example, certain repairs made at thelocal level could be discontinued because of perceived quality deficiencies, and thiswould result in an increased demand rate at the depot level.
Need for Improved Supply-Management Planning and Execution
While the inadequacy of the long-term forecasts for production execution poses aproblem in itself, there is also a need to place increased emphasis on near-termreplanning, so that limited resources can be applied to respond to changing require-ments as they emerge during the execution of the current PRON. Near-term replan-____________4 Unserviceable-asset returns currently occur only when the repairable assets come under the control of the IM,usually at a DLA distribution center, or when the IM directs a shipment from a forward location.5 This is a common condition for items with relatively high condemnation or washout rates during repairs (e.g.,automotive generators/alternators, starters, etc.).6 SSF is an Army initiative that shifted the point of sale for the AWCF from national distribution centers closerto the customer. AMC now “owns” the inventory down to and including the ASL. Before SSF, AMC owned onlythe stocks in the DLA distribution centers, and consequently it saw only the sales from those locations in itstransactional systems. These national wholesale sales do not equate to the total tactical sales, the total tacticaldemand, or the failure rate for a particular NSN. Therefore, IMs had a very limited view of the world upon whichto base long-range plans.
The benefits of stock funding are discussed in Brauner, Pint, et al., 2000. Financial policy changes that couldfurther improve the reparable-management process are discussed in Chapter Five.

Improving Planning Activities 35
ning can allow more-current information to be used in the replanning or executiondecisions to adjust earlier plans to accord with the emerging reality at the NIIN level.
The current process tends to focus on budget planning; it is less responsive tochanging customer needs that emerge during plan execution. During execution of aPRON, representatives from the MSC and the depot meet quarterly to revise sched-ules and address problem areas. These meetings include representatives of all thefunctional organizations needed to coordinate changes to the approved programs;thus, they would typically have been the venue, for example, at which to approve therescheduled production necessary to get the M88A1 engine out of the persistent BOsituation that developed. However, because IMs do not usually attend these meet-ings, issues about increasing production are discussed only if decision packages havebeen developed and coordinated. Unfortunately, only the most critical issues typi-cally make the agenda, leaving many issues ignored until they have become criticalproblems and have garnered the attention of senior Army personnel. In the case ofthe M88A1 engine, the need to increase production did not surface soon enough.
Even though this NIIN had been averaging 30 or more due-outs per month formore than a year, the FY2000 PRON had been approved as planned, with no in-crease programmed to overcome the deficit associated with the increased demand.Thus it started in the hole. When we began our case study and walked through thedetails of the reparable-item repair process, this issue quickly emerged.
Alternatives to the current process do exist. On the basis of the IM’s standardanalysis, but with the added perspective provided by the process walk-through, theIM team initiated a change to the PRON quantity sufficient to cover all existing due-outs for the M88A1 engine. They walked this reprogramming action through thenecessary coordination in less than a week in January 2000, and funds were availablefor immediate implementation.
The revised FY2000 PRON authorized increased monthly production sufficientto catch up with known customer due-outs and the current average demand rate bythe end of the fiscal year. Figure 4.4 shows the revised PRON quantities. AnnistonArmy Depot (ANAD) was to increase production to accomplish the PRON by theend of September 2000 and get the repair program for the engine able to meetknown customer demands.
However, once changes to the monthly production schedule were authorized,the concern became whether ANAD could produce sufficient additional engines tomeet that schedule. A detailed discussion of the repair activities is addressed in Chap-ter Five. Here, we remain focused on the planning activities.

36 Improving the Army’s Management of Reparable Spare Parts
Figure 4.4The FY2000 M88A1 Engine PRON Revised to Meet Customer Demands
Cu
mu
lati
ve e
ng
ine
rep
airs
OctFY2000
SepAugJulJunMayAprMarFebJanDec OctFY2001
Nov Nov
250
200
150
100
50
300
0
RAND MG205-4.4
SOURCE: CCSS, TACOM.
Actual demand + BORevised PRONProjected demandFY2000 PRON
Approaches for Improving Supply-Management Planningand Execution
The problems associated with supporting customers with adequate serviceable repa-rable assets involve uncertainty and variability in both demand and supply ofrequired items, as illustrated in Figure 4.1. In the future, engineers and logisticiansmight be able to reduce such levels of demand uncertainty, but no clear strategycurrently exists to address this issue for any meaningful segment of the reparable in-ventory. Therefore, managers need to think about ways to improve forecasts or toimprove responsiveness.
There is also uncertainty and variability in the supply of Army-managed items,particularly reparables. The BO rates demonstrated a pervasive pattern overall, andthe M88A1 diesel-engine example illustrates the inability of the current managementprocess to respond successfully to changes in demand with sufficient repair authoriza-tions.
Furthermore, it is important to note that while this case study involved a NIINthat was experiencing a pattern of increasing demand, the reverse situation (wheredemand is significantly less than predicted) could be just as likely to occur. If repairs

Improving Planning Activities 37
were executed against those overpredictions, production would exceed requirements.Neither excess nor insufficient production of serviceables is a desired condition. Thedesired outcome is that of efficiently meeting all requirements.
Although practical financial constraints always exist, funding has not emerged asone of the key issues in the process activities. However, that does not assure that theimplementation of improvements will not require specific investments or realloca-tions of funds. It also does not mean that financial constraints could not be a key is-sue in the future and have not been at other times.
Successful commercial practice usually begins with performance-improvementefforts for similar problems that first address the uncertainty and responsiveness ofsupply (because the ability to assure supply to meet demands will usually improve acompany’s market share and profitability). As we look for ways to improve supportto Army customers needing reparables, we follow a similar logic that seeks strategiesto improve the AMC approach to uncertainty in supply, efficient strategies that willnot result in net cost increases for the Army. We also identify some improvementalternatives suggested by commercial practice and the literature.
This study emphasizes actions that can be done immediately with minimal orno information technology (IT) changes. Our intent is to not permit the current lackof potential future “enablers” to prevent feasible improvement actions today.7
Approaches for Dealing with Uncertain Demand
Uncertainty and variability in customer demand affect most industries, and a numberof alternatives have been developed and successfully used to address the problem. Wediscuss four basic approaches:
• Making forecasting models responsive to change.• Adjusting safety stock.• Reducing lead time and variability.• Adjusting expectations.8
____________7 The GAO has been encouraging process changes rather than merely IT change for many years. See, for exam-ple, GAO, 1993. RAND has provided the same message through the VM program. Published commercial exam-ples over the past 15 years have become too numerous to list. Recommended sources include Womack et al.,1991; Womack and Jones, 1996; Kearns and Nadler, 1992; Keen, 1997; Byrne and Markham, 1991; andPyzdek, 1999.8 Lists of strategies for coping with variability in operations are widely available. For an example of a consultant’sview, see Dougherty, 2001, pp. 6–7. Academic texts in operations management offer similar taxonomies. Militarytradition and writings provide similar coping strategies to handle the “fog of war” and other manifestations ofvariability that might impede mission accomplishment.

38 Improving the Army’s Management of Reparable Spare Parts
Frequent Updating of PRON Forecasts to Respond to Changing Demands
In the course of this research, we were told several times that the root cause of theproblems of inadequate serviceable-reparable inventory is a bad forecasting model.This implies that the forecasting errors present in April 1998 are the underlying causeof the problems with FY2000 PRON execution. However, we know of no singleforecasting algorithm that would provide sufficient accuracy to be useful over such anextended horizon for item-level predictions. Only knowing a causal factor ahead oftime could improve the forecast.
In this application, AMC has traditionally used an exponential-smoothingmodel with historical demand data as the basis for projections about the future. Ingeneral, exponential smoothing is characterized by rapid response to changes in his-toric demand patterns (dependent on the choice of exponential coefficient and theweight given to more-recent demands). However, other models can provide betterresults, depending on the characteristics and assumptions about demand patterns.9
For example, some models are designed to provide better predictive results for itemswith underlying seasonal or cyclic patterns (e.g., anti-freeze, sunscreen). Commercialsoftware is available that uses multiple modeling options for each item, tracks thepredictive accuracy over time, and dynamically chooses the currently best-performingoption for making the next recommended forecast. In addition, experts are availableto tailor new and unique models that will improve prediction accuracy.10
The literature suggests that the fundamental problem in this case is not the typeof model used but the length of the planning horizon. As discussed in ChapterThree, using the current forecasting model to project inflexible repair schedules manymonths (and even years) into the future is not a reasonable approach. The long-rangeplanning task needs a basis upon which to plan, not the basis necessary for perfectprojections of the future. In the commercial world, budgets are often replanned torespond to emerging “truth” about the future; budgets can thereby be adjusted to thesame reality that is facing sales and production in the near term. In the commercialworld, even the long-lead-time investment decisions are revisited for modification asreality proves that forecast errors exist.
While the current forecasting model was seen to prove inadequate in the case ofthe M88A1 engine, it does not seem to be a wholly unreasonable tool for long-rangeaggregate budget planning that builds the POM and budget input. One would ex-pect that at the aggregate level, some of the item forecasting errors would actually____________9 For example see Delurgio, 1998; Georgoff and Murdick, 1986, pp. 110–120; and Makridakis and Wheel-wright, 1978.10 The discussion here has focused primarily on the choice of forecasting algorithm. The literature and commer-cial practice reflect increased interest in collaborative forecasting. The recommendations discussed below incorpo-rate the basic concepts of collaborative forecasting and thereby imply changes to current forecasting policy. Forfurther discussion see Mentzer and Bienstock, 1998.

Improving Planning Activities 39
cancel each other out, and the resulting aggregate or “bundle” of item PRONs couldbe a reasonable budget estimate.11 However, the individual PRONs would still beexpected to have high levels of forecasting error. Thus, the basic problem with theforecasting model appears to be not its capabilities for long-range planning and gov-ernmental budget development, but its usefulness in the execution of individualPRONs without near-term replanning.12 The preferred approach seems to be tochange procedures to use the best available prediction for the purpose at hand, ratherthan seeking a replacement model.
As noted above, the RD&ES model currently in use has the capability to in-clude frequent updates, and the near-term predictions reviewed during our case studydemonstrated responsive output. The RD&ES algorithm implementation can re-spond to changing demands and has built-in mechanisms to supplement the histori-cal demand prediction with known changes in requirements (e.g., planned changes inoperating tempo or scenarios that are expected to change future demand patterns, orchanges to the level of fielded-unit equipment sets). What is needed is a more dy-namic reparable-management process that attempts to meet emerging demands withdecision rules and policies that constrain responsiveness only insofar as appropria-tions and the governing public law require.
Improving Service Level by Increasing Safety Stock
Variability in demand can also be addressed through safety stock, i.e., inventory thatis held to buffer a process activity from uncertainty. As shown in Figure 3.2, theprocess activity of concern to us is the availability of serviceable spares at the na-tional-level distribution centers where customer requisitions or tactical-level replen-ishments can be sourced. If no inventory is carried at this level, each requisition de-pends on a very accurate prediction of the next demand occurrence or a veryresponsive repair system. The RD&ES module has the capability to call for inclusionof safety-stock needs within the planning calculation. However, we found that thereparable items reviewed in our case study had no safety-stock level (i.e., the safety-stock requirement for those items was zero).13 In addition, it should be noted thatcurrent repair batch size for replenishment of serviceable inventory does in itself pro-____________11 We did not pursue this hypothesis, because our emphasis was on finding opportunities for improvementwithin the context of the existing system structure. Hence the focus of this report is on near-term managementissues.12 From an aggregate perspective, though, the forecasting model will still have significant problems when under-lying causal factors (e.g., a change in operating tempo) change, and thus the long-term trend changes.13 That does not mean that there was no serviceable inventory available for all NIINs for which the safety-stockvariable was zero. Due to the variability issues discussed above, the majority of items did not have zero on-handinventory when the next requisition was received. Raising the safety stock above zero for a larger percentage ofNIINs reduces the probability of a BO in the future, all other factors being equal. This is achieved by increasingthe depth of inventory and inventory investment.

40 Improving the Army’s Management of Reparable Spare Parts
vide a level of safety stock inherent in its calculation. The multiechelon inventorystructure, with reparable assets positioned forward at the tactical level, also providesan inventory buffer.14
Improving Replenishment Lead Times
The Army’s reparable-management process could also be a very good candidate for aprocess-improvement effort focused on lead-time reduction. Lead-time-reductionapproaches look at the chain of events necessary to meet a need and try to determinewhere it is most efficient and effective to insert buffers or reduce constraints so thatthe desired response time is met at lower total cost.15 Lead-time reduction helps tominimize the early commitment of assets and facilitates the adjustment of productionschedules until actual customer demands are received.
Such approaches typically involve frequent replanning inside the budget plan-ning process and seek to gain closer feedback, where possible, on realized customerdemands. Many commercial-sector organizations have applied these techniques to awide range of activities, from retail sales (e.g., Wal-Mart and most major grocerychains use of point-of-sale data at their own distribution centers and provide this in-formation directly to their vendor partners) to manufacturing (e.g., Toyota, DellComputers), from entertainment (e.g., Blockbuster video rentals, cable TV on-demand programming) to remanufacturing of reparables (e.g., Cummins Diesel,Gateway computers, General Electric X-ray equipment), and many more.
It can be difficult to define and develop new decision strategies and to identifyappropriate means of implementing the desired changes. Many of the most effectivechanges seem to occur across functional and/or organizational boundaries. In thiscase, the identification of ways to improve supply responsiveness for reparable itemsinvolve both supply and repair management issues. Thus, one challenge lies in themanagement team’s ability to conceive of radically different solutions instead of in-cremental improvements or cost-reduction efforts within their limited organizationalcontext. Unfortunately, many such cost-reduction schemes result in local-activity ef-ficiencies rather than system savings, or the cost accounting system confuses the deci-sion process with inappropriate data concerning alternatives.16
____________14 For a further discussion of multiechelon inventory analysis see, for example, Sherbrooke, 1992; and Hillier andLieberman, 2001.15 Lead time is specifically defined as the time between ordering a good or service and receiving it. Increasing fin-ished-goods inventory (e.g., by holding safety stock) is a common example of using a buffer in the manufacturingand distribution processes to reduce lead time. However, such inventory has a cost, and operations managers arealways in search of alternative ways to provide the required outputs at reduced costs. The discussion in thissection is only illustrative of such alternatives. A number of operations-management texts are available, e.g.,Stevenson, 2002.16 The literature includes sources of ideas for alternative strategies, as do professional organizations (e.g., theCouncil of Logistics Management (CLM), the American Production and Inventory Control Society (APICS))and consultants. Nonetheless, it can be difficult to find an acceptable strategy, especially one that can be imple-

Improving Planning Activities 41
Applying a new approach to the reparable-management process would requiretaking a very close look at all the process activities needed to return an asset that hasbeen determined to be unserviceable and complete all actions necessary to return it toa DLA distribution center in serviceable condition and ready for future issue. In ourcase study, the M88A1 engine had unserviceable assets available in storage at theDLA warehouse at the Army repair depot. The first action to indicate lead-time re-duction in this instance was recognition among the management team that a persis-tent condition existed (i.e., multiple customer BOs awaiting repairs and the failure toauthorize sufficient repairs to meet known demands).
Information about the size and nature of the BO problem was available throughCCSS reports and IM-generated supply-control studies. However, the problem wasnot addressed because of the total volume of such information (which involved manydifferent NIINs), financial constraints, and a focus on improving the long-termplanning process (i.e., improving the forecasting model). Lead time could be reducedby developing ways to use the available information in more proactive ways to pro-vide just the required serviceable-inventory levels, neither too high nor too low. Rou-tine mechanisms are necessary that encourage replanning and repair coordinationbetween the management-team members at the inventory-planning and repair-scheduling activities rather than extensive coordination and management approvalmechanisms.17
Improving Communication About Customer Needs and Requirements
Although in some industries it is possible to influence customer demand patternsthrough advertising, pricing, or other means, such strategies are in most respects notavailable to Army materiel managers. The Army operations being supported are char-acterized by highly variable and uncertain customer demand patterns for repa-rables—and for military materiel in general. Although some items tend to experiencemore variability and uncertainty in demand than others, and while some items withhighly uncertain demand may lend themselves to different forecasting techniques orcombinations of coping strategies to mitigate the impact, generally speaking, themanagement team must expect variations associated with forecast error.
In light of such realities, one important mitigation strategy is to adjust expecta-tions about what the forecasting model should be able to do and to gain better infor-__________________________________________________________________mented across organizational boundaries. One possible strategy, lean manufacturing, is discussed in greater detailin Chapter Five.17 The example discussed here (in the context of supply-management planning) relates to reduction of the plan-ning and replanning lead time. However, all activities in the process that increase the total lead time required toreplenish serviceable assets are fair game for improvement initiatives. Without reduction in lead time, supplymanagers will need to embrace other options to achieve comparable improvements in customer service. This illus-trates the interaction of supply and repair management efforts necessary for reparable-management-process im-provement.

42 Improving the Army’s Management of Reparable Spare Parts
mation about current and expected requirements. Acknowledgment of the limita-tions on accurately predicting the future can be the motivation necessary for a man-agement team to collaborate in process-improvement efforts. Success in such effortsoften hinges on finding ways to better use the information that becomes available toreplan and adjust to be more responsive to the customers.
Both long- and near-term planning activities can benefit from improved infor-mation. Therefore, these activities must have the most-recent requirements and fore-cast information, even though it may impact them in different ways. Even after along-range budget-planning milestone has past, significant changes to the forecastmay provide critical information about the need to develop alternatives for repro-gramming funds or other strategies. Updated information is of critical importance inthe near-term replanning necessary to meet requirements as efficiently as possible.
Moving from Planning to Execution
The dominant issue facing the current reparable-management process is the contrastbetween the detailed, long-range planning activities that result in the approvedPRON and the very different reality of the sales that generate the actual (and vari-able) demand for repairs. The efficient execution of the reparable-management planrequires repeated planning cycles with the most current information available. Thesystem of planning tools should provide updated recommendations based on thenear-term reality rather than on earlier long-range forecasts.
Figure 4.5 shows the reparable-management activities explained above and illus-trated in Figures 3.3 and 3.4. A list of some key outputs is provided to illustrate themix of near- and long-term issues that are being addressed. Outputs 1 through 4 arelonger-range items. The other outputs are more directly related to the near-term is-sues involved in ensuring responsiveness to customers’ changing needs. The ability tosort such outputs suggests a possible basis upon which to restructure the activities.
Linking Long-Term Planning to Near-Term Execution
One approach that holds promise for improving responsiveness is to recognize thelinks between long-term planning activities and near-term execution-process activi-ties within the management structure. A disciplined planning process and a respon-sive execution process need not be mutually exclusive or physically separated. Theexecution process could continue within the constraints defined by the planningprocess (i.e., there is usually enough initial flexibility in the timing of productionquantities within the approved PRON). However, when the planning-process resultsare shown to be incorrect in light of emerging information about customer demand,it should be possible to responsively adjust those plans.

Improving Planning Activities 43
Figure 4.5Current Reparable-Management Activities
RAND MG205-4.5
RD&ES
CCSS Supply-control studiesand coordination
RPAS PRON
Reparable-management
outputs:
0. Allocate scarce assets
1. PRONs for future
2. Budget inputs
3. Long-range plan inputs
4. Parts-explosion coordination
5. Monthly/quarterly analysis inputs
6. PRON update/change inputs
7. Database maintenance
8. Etc.
RequirementsDetermination and Execution System
Repair andProcurementAcquisition
System
ProcurementRequest Order
Number
Figure 4.6 depicts an alternative future environment in which production exe-cution and scheduling have been separated from the long-range planning activities.The long-range planning process is shown at the top of the figure and is essentiallythe same as that currently in use. The execution process, on the bottom, takes a dif-ferent form, one that accounts for the fact that execution activities are continuousand ongoing throughout the year. These activities are driven by daily demand datathat flow continuously into CCSS (and the simultaneous obligation of customerfunds that occurs when a requisition is submitted). Whereas the current process pri-marily uses quarterly meetings to approve production-schedule changes, the newview calls for deliberate movement toward more-frequent opportunities to resched-ule. The use of the available feedback from RD&ES and CCSS will improve the re-sponsiveness of the production process.
As Figure 4.6 implies, the Army should transition as quickly as possible tomonthly schedule changes, using the available monthly RD&ES outputs that arenow available. The availability of monthly RD&ES outputs does not automaticallymean that procedures are in place to promptly process and implement those outputs.But one could envision a future management decision process that was informedweekly or even daily about customer demand and in which changes could be imple-mented when warranted. A daily process would reflect a true demand pull system.The quarterly meetings could then focus more on review and emerging constraints,enabling the IM team and the repair manager to be much more responsive to de-mand.

44 Improving the Army’s Management of Reparable Spare Parts
Figure 4.6A More-Responsive Reparable-Management Process
RAND MG205-4.6
RD&ES RPAS PRON
LONG-TERM PLANNING Feeds: Budgets, long-range planning
NEAR-TERM EXECUTION
Yearly
Monthly
Weekly oreven daily
RD&ESDepot/
SOR
Actualdemand
Feeds: Production of enough reparables to meet customers‘ requirements
Conclusion
This chapter has discussed the inventory-management activities dealing with bothnear-term and long-term planning. The critical message related to overall processimprovement is that frequent replanning is needed to allow the most accurate infor-mation to inform the decisionmaking necessary to provide sufficient serviceable assetsto meet customer demands. Also, a strategy is needed to promptly approve and exe-cute the decisions that the frequent replanning enables. The alternatives explored inthis chapter begin to point toward a reparable-management process that is more re-sponsive to customer needs. Those needs may be either increasing or decreasing overthe planning and execution time horizons. However, it should be clear from the dis-cussion that improvement will require changes not only in the planning process butalso in the repair process. We address the repair-process issue explicitly in the nextchapter.

45
CHAPTER FIVE
Improving Repair Activities
In Chapter Four, we looked at the reparable-planning process in both the near andthe long term. In this chapter, we focus on the issue of repair responsiveness. Weagain suggest some alternatives for improvement that emerged from interaction withthe managers and technicians within the system and from the lessons of better-performing commercial entities.
Improving Repair-Activity Responsiveness to Deal withUncertain Demand
Upon recognizing the increase in demand for the M88A1 diesel engine, the IM teamresponded by coordinating and implementing a change to the PRON that was beingexecuted at the time. The intent was to authorize an increased repair quantity suffi-cient to meet the revised forecast demand by the end of the fiscal year (i.e., by theend of September 2000). After the PRON adjustment was implemented, the respon-siveness of the reparable process became dependent upon the responsiveness of therepair activities.
During our process walk-through at ANAD, the local management teamclaimed to have sufficient facilities and manpower to meet the revised schedule. Theyhad recently resolved a parts crisis that put them behind the original FY2000 PRONschedule and felt they were on track with all the assets they would need. However, wediscovered that their procedures for inventory management and control were not suf-ficient to provide the visibility necessary to identify supply problems before they be-came critical to the production process. These procedures will be discussed in moredetail below. For now, Figure 5.1 shows the repairs achieved for our M88A1 engine-repair case study under the original PRON and the revised PRON (from Figure 4.4)and adds a curve for achieved production through July 2000. Note that achievedproduction lagged behind the levels of both the FY2000 PRON and the revisedPRON. In the following, we consider five interrelated approaches to making repairactivities more responsive to customers’ needs.

46 Improving the Army’s Management of Reparable Spare Parts
Figure 5.1Repair Production at ANAD Under the FY2000 PRON and the Revised PRON
Cu
mu
lati
ve e
ng
ine
rep
airs
OctFY2000
SepAugJulJunMayAprMarFebJanDec OctFY2001
Nov Nov
250
200
150
100
50
300
0
RAND MG205-5.1
SOURCE: CCSS, TACOM.
Actual demand + BORevised PRONProjected demandFY2000 PRONProduction
Approaches for Improving Repair-Activity Responsiveness
Several established alternatives have been successfully used to make repair activitiesmore responsive to changing customer needs. Five of these are obvious candidates forapplication to the problem at hand:
• Reduce lead time for the next repair and reduce overall repair flow time.• Use frequent replanning to keep production schedules and repairs synchronized
with demand.• Ensure the availability of unserviceable assets to support reparable activities.• Improve the process for managing depot-level repair parts to support more-
responsive repairs.• Improve financial policies to support more-responsive depot repairs.
In addition to these possibilities, the discussion includes AMC’s recentlylaunched initiative to apply the principles of lean production and lean thinking toArmy maintenance-depot operations. The AMC Commanding General (CG) di-rected the start of the Lean Line program on March 25, 2002. Fundamentally, leanapplies to the value being created for the ultimate customer of a good or service. The

Improving Repair Activities 47
lean approach considers all the actions taken to create that good or service in order toidentify the activities that actually add value as defined by the customer. Any activitythat absorbs resources but adds no value to the good or service is defined as waste ormuda.1 The objective of the lean approach is to reduce waste in order to increaseproduction efficiency and shorten lead times. Batches of material are not pushed intothe process, which would result in resources waiting to be processed; under the leanapproach, induction is pulled, WIP is reduced, and all activities that do not add valueare identified for future elimination.2
The AMC lean efforts provide an added dimension to the discussion of alterna-tives for improving the repair process. The tactical-level units—the ultimate custom-ers for reparable assets—want and need to order reparable parts and have them issuedpromptly for use in restoring the operational capability of their mission equipment.The value to the customer is in timely availability, reliable condition and functional-ity, and an acceptable cost (not necessarily the lowest cost).
Reducing Lead Time for Next-Repair Completion and Overall Repair Flow TimeApplying flow-time reduction to the repair activities of the reparable-managementprocess would involve first taking a very close look at all the process activities re-quired to return a broken asset to serviceable status and turn it over to the DLA dis-tribution center packaged and ready for issue. The goal should be to establish amechanism that responds to customer needs by increasing production when demandincreases, thus reducing the potential for BOs, and decreasing production when de-mand is not as great, thus minimizing excessive inventory investment.
The overall repair flow time includes the time from the induction of an unser-viceable item into repair until it is ready to be placed back on the shelf at a distribu-tion center as a serviceable item. If this total flow time is used for scheduling produc-tion to meet the next demand, availability of the next item is the full repair timeaway. In the case of the M88A1 diesel engine, this time would have been measuredin weeks, mostly due to lengthy queuing or waiting times. However, the total timerequired to complete the sequence of actions needed to repair the next unserviceableM88A1 diesel engine is actually less than a day and is often between eight and 18hours of work time. Thus, if the lengthy queuing or waiting times could be elimi-nated, the total repair lead time would be greatly reduced.
To reduce the time between repair activities, it is necessary to consider thesequence in which the repair activities take place. For example, the final testing ac-tivity for the M88A1 engine is running the completely assembled engine to check forbasic operation, leaks, and power production. At this time, minor defects are fixed,adjustments are made, and the finished engine is containerized along with the appro-____________1 The lean literature frequently uses Japanese terms, because many of these practical concepts originated in Japan.2 “Lean thinking is lean because it provides a way to do more and more with less and less . . . while coming closerand closer to providing customers with exactly what they want” (Womack and Jones, 1996, p. 15).

48 Improving the Army’s Management of Reparable Spare Parts
priate documentation. DLA is then notified that the containerized engine is ready tobe picked up and processed onto the inventory records as serviceable. If the activityimmediately preceding the testing (i.e., the assembly activity) were to keep an enginefinished and ready to move to the final testing, the lead time for the next asset wouldbe on average one shift away instead of weeks away. Therefore, the lead time for thenext asset repair would be much less than the total repair flow time for that asset.
For approved PRONs to repair multiple assets, then, the issue is how the repairtime for the next asset might be reduced. Once the backlog of due-outs for a givenNIIN is eliminated, the important factor becomes the responsiveness to the next de-mand. Therefore, we are concerned with both lead-time reduction for the next repairand reduction in overall repair flow time.
In the M88A1 case, it is possible that some of the WIP, which remained at ap-proximately 70 engines during our analysis, could be used to shorten the achievablerepair lead time for the next engine from weeks to days or even hours. To achievesuch reductions, an analysis and strategy must be developed for each NIIN consid-ered. Decisions must be made concerning the desired level of WIP necessary tobuffer each repair activity or step. The logic works backward from the final action ofthe repair cycle, based on the desired marginal repair-time goal (i.e., the typical leadtime until the next asset will be available for issue). The times and variability experi-enced for each step in the repair of an item, along with the marginal repair-time goal,help define the size of the buffer at each step and the total WIP for that NIIN. Thattotal defines the expected minimum WIP to support current repair activities whileachieving the desired repair lead time.3
For the M88A1 engine, we developed an alternative that would enable the nextrepair to be completed, on average, in one work shift. Some would consider this im-provement to be quite responsive, while others might say that the process needs to beeven faster or that the capacity needs to be more than just the next engine. Otheroptions could improve responsiveness still more. For example, an engine could bealready completed, awaiting the signal to call DLA for pickup, or two or more fullyassembled WIP engines could be held in a condition ready to send to testing. Repa-rable management concerns thousands of different items of differing repair complex-ity and technology. The applicability of any given improvement alternative should beevaluated on a NIIN-by-NIIN basis.
By “working backward” through the repair activities, one could determine howmuch partially repaired WIP should be positioned before each activity to enable thesubsequent activity to respond to the completion of the next engine. This would then____________3 For this discussion, we have assumed an ultimate goal of small-batch or even single-item production activity ateach step of the repair process. Technology and other production factors may argue for larger batch sizes, but thisdoes not change the basic logic of the argument. The object is to reduce lead time to improve response to cus-tomer needs.

Improving Repair Activities 49
ripple through the completion of all the replacement components in the total repairflow. In other words, as an engine is shipped, just enough WIP would be pulled for-ward to replace the assembled engine, then all the components and parts necessaryfor the assembly, and so on. The level of buffering inventory required in front of eachactivity would depend on the processing time of that activity with respect to theprocessing times and capacities of the activities before and after it and the maximumrepair-production rate desired.
The system already typically contains considerable WIP, so any WIP above thelevels determined for each of the buffers across the flow would be a target for reduc-tion. However, by starting at the end of the process to draw down excess WIP, a de-pot might also prevent the expenditure of time and materials on assets that are notrequired. For example, a depot generally does not want to induct an unserviceableasset into repair and consume resources ahead of the lead time necessary to meet pro-duction schedules and requests for serviceables.
Therefore, in addition to lead-time reduction, it is also important to consideroverall repair flow times, preventing wasted repair actions in WIP, and achieving effi-ciency by reducing overall WIP consistent with defined responsiveness goals.
Frequent Replanning to Keep Repairs Synchronized with Demand
A similar pull production technique can be used to adjust repair levels in response tochanging customer demands.
Capacity and priorities help planners arrange production schedules and solveproblems that can arise in matching the workload with the available workforce. Atthe work-center level, tasks are often variable or changing, as the workload is usuallycharacterized by multiple PRONs for multiple different items of similar technology.Thus, the shop that repairs the M88A1 engine also repairs several other diesel en-gines of various sizes and complexity, the major accessory components for those en-gines, and transmissions and other heavy mechanical parts. The equipment, tools,and technical skills needed for these jobs are similar, and the aggregate workload pro-vides a sufficient total workload volume to support this capacity, as well as enoughvariety to keep the workforce engaged when one item hits a bottleneck.
However, frequent replanning is needed to keep the number and type of repairssynchronized with changing demands—and thus to ensure that the depot repairprocess is responsive to customer needs. The current RD&ES module receivesmonthly information that can be used to revise production schedules for the cur-rently approved PRON.
A new set of operating practices is also needed that will enable the depot pro-duction to respond to this improved forecast, preferably one that would not requireany additional software or modifications to existing programs and would be easy tocommunicate among all those involved. Depot technicians who had been aroundwhen the workload for the M88A1 engine was much higher described such a method

50 Improving the Army’s Management of Reparable Spare Parts
during our walk-through of the current process. The method was very similar toToyota’s kanban system and the lean manufacturing approach.4
This alternative involves a pull production technique similar to that described inthe discussion of lead-time reduction, in which a mechanism or signal communicatesto workers the need to perform a given task and the quantity to be produced. Theinitial signal might be triggered by the final step in a process, such as a DLA pickupof finished containers or the movement of assembled engines to the test facility. Thisstep would signal the pull on the production flow. The final action controlled by thescheduler at the work center thus becomes the signal that flows backward throughthe facility as each activity responds in turn to the movement of an asset from thecompleted WIP pile. In other words, the empty space on the floor is the authoriza-tion for a worker to induct material into the activity and produce the replacement tofill the space.5
As simple as it sounds, such a system can be very effective for production con-trol. The process proposed here would extend a system of linked signals back up theproduction flow to ensure the availability of parts necessary to sustain the responsive-ness of the marginal repair-time goal. Because this is not a continuous productionline, nor are all the required activities performed in the same facility, a system of sig-nals would need to be developed for each NIIN.
After linking the IM to the repair-shop scheduler and the scheduler to the pullsignal, the other supporting activities could work off the signals on the critical repairflow path. For example, containers of unserviceable engines awaiting induction couldbe staged in small batches at the facility. An engine would not be inducted until thetechnician received the signal to induct one, but larger and more-economical deliverylots from bulk storage would still be possible. Similar adjustments would be possible____________4 A kanban, or signal, is the mechanism used in many manufacturing plants to communicate to workers the needto perform a given task and the quantity or batch size to be produced. The kanban is a key feature of pull produc-tion systems: As material moves forward, the worker typically, in turn, automatically trips a kanban upstream(i.e., uses positioned material, exposes an empty position, or reserved material location) that causes a task to oc-cur. That task then positions material in anticipation of the next downstream pull signal. Each signal sets off aripple of upstream actions that pull just enough material forward through the production process. These signalsystems are usually very low-tech and have very small batch sizes. Thus they are inexpensive to implement, andthey minimize inventory investment.5 The kanban system is very much like the system used by ANAD technicians in the past. The mechanic in theassembly area required a set of matched items (with matched dimensions) to proceed with assembly. The assem-bly technician pulled the components from their prepositioned locations on a large shadow board (where everycomponent had a unique location) as he proceeded with the initial assembly. When the partial assembly wasmoved to the next workstation, the empty shadow board was moved away and the technician checked to see if hewas to start another assembly or shift to a different task. If he was to do another assembly, another shadow boardwas preloaded and waiting to be moved into position. An indirect labor technician took the empty shadow boardto the upstream activities to reload it for a future assembly.
The shadow board was the kanban, or signal, that linked these activities. The immediate upstream activitytook measurements and collected just enough sets of matched components to restock the shadow board. Once theboard was restocked, the technician switched to other necessary tasks in the work center.

Improving Repair Activities 51
for reclaimed components, large quantities of which (both serviceable and unservice-able) were in the facility on our visits. The signal system could be expanded to usethe Automated Storage and Retrieval System (ASRS) facility as a remote buffer loca-tion. This would free up storage space in the production facility, and the ASRSautomation could be used to track levels of inventory and dispatch material for pro-cessing as necessary. The ASRS can aid the shop schedulers in seeing the WIP anddetermining where it is located.
As the shop controls for each NSN transition to a pull-signal approach, somesimple rules will be needed to enable a technician to make a decision when morethan one signal is present. In practice, this is not a serious problem, because the deci-sion is ultimately linked to the specific lead time required to support the tasks thatare pulling the material.
Improving the Availability of Unserviceable Assets
Because a repair action cannot begin until an unserviceable is available for induction,and because unserviceables are often the source of critical repair parts, it is importantto ensure that unserviceable assets are available when needed. Currently, unservice-ables (unless specially identified) are treated as the lowest-priority items in both sup-ply and transportation activities. The priority given to dealing with unserviceable as-sets should be reevaluated so that they can better be used to address the needs ofcustomers requesting reparables and the Army as a whole.
To help in understanding how this process might be improved, Figure 5.2shows a generalized view of the reverse logistics process, that is, the way an unservice-able gets to the required location to support reparable activities.6
As shown at the left side of the figure, an unserviceable is typically removedfrom an end-item being repaired. Traceable metrics are available today only from thepoint at which the item is first turned in to tactical-level supply. Because unservice-ables are usually given the lowest priority, the retrograde flow for unserviceable itemsis much slower than that for serviceables.
In part to motivate prompt turn-in of unserviceables, payment for assets wasimposed in 1992. The unit receives a credit (reducing the total effective cost) when itreturns an unserviceable to supply. However, shifting credit rates have left customersuncertain of refund amounts or about whether they will receive a refund at all. Thus,the Army VM analysis showed slow times and episodic patterns for turn-ins andcredit payments.7
____________6 A more detailed discussion of reverse logistics within the Army can be found in Diener et al., 2004.7 In April 1992, the Army changed its financial system for DLRs. Prior to that time, AMC received appropriatedfunds to procure and repair DLRs, which were issued as direct issue to logistics customers, based on their statedneeds. Other types of spare parts (i.e., FLRs and consumables) had previously been stock-funded; thus, stock-funding DLRs brought all types of spare parts under the same type of financial system.

52 Improving the Army’s Management of Reparable Spare Parts
Figure 5.2Generalized Reverse Logistics Process
RAND MG205-5.2
Component condition codes change as partsmove through the pipeline and are acted upon
Disposal
HH
H
A
A
F
Serviceable
Condemned
End-itemrepair On-post
repair
Depot/centralizedrepair facility
[remanufacturing]
Centralizedstock of cores/
carcasses/reparables
Depotreplenishment
stock
Reclaimablecomponentsrefurbished/
remanufactured
Localstock
F F
AA
A
FUnserviceable
A Serviceable (ready to issue)
F Unserviceable (reparable)
H Unserviceable (condemned)
Componentcondition codes
This pattern has not been readily apparent for some older equipment that hadsufficient reparable assets in national stock after the post–Cold War force-structuredrawdown. However, the problem has recently been emerging more frequently. Forsome new systems and some older systems with modernized components, the totaldepth of stock is inadequate to cushion the impact of slow retrograde. Furthermore,slow retrograde has delayed implementation of more-aggressive condemnation poli-cies for some older components. Therefore, concerns about improving retrogradeflows have arisen in the Army for the same basic reasons they appeared earlier in theAir Force and the Navy.
As Army maintenance is transformed toward rearward consolidation of compo-nent repair, more importance will be placed on time-sensitive repair of reparable as-sets to place serviceable items on the shelf for the next customer demand. The AirForce has demonstrated the capability to achieve consistent total broken-to-fixedreparable cycle times of less than 30 days for some items.8 The commercial sector has____________8 The depot repair enhancement process (DREP) is governed by Air Force Materiel Command Instruction(AFMCI) 21-129. The Air Force view of reparable repair includes reduced flow days, a focus on constraint man-agement, improvements to management systems that provide daily prioritization of repairs, improved supplysupport to the repair shops, alignment of responsibility and authority of key players, and customer-driven per-formance measures at the depot (e.g., item BO rates, CWT, retrograde time). DREP concepts apply to both or-
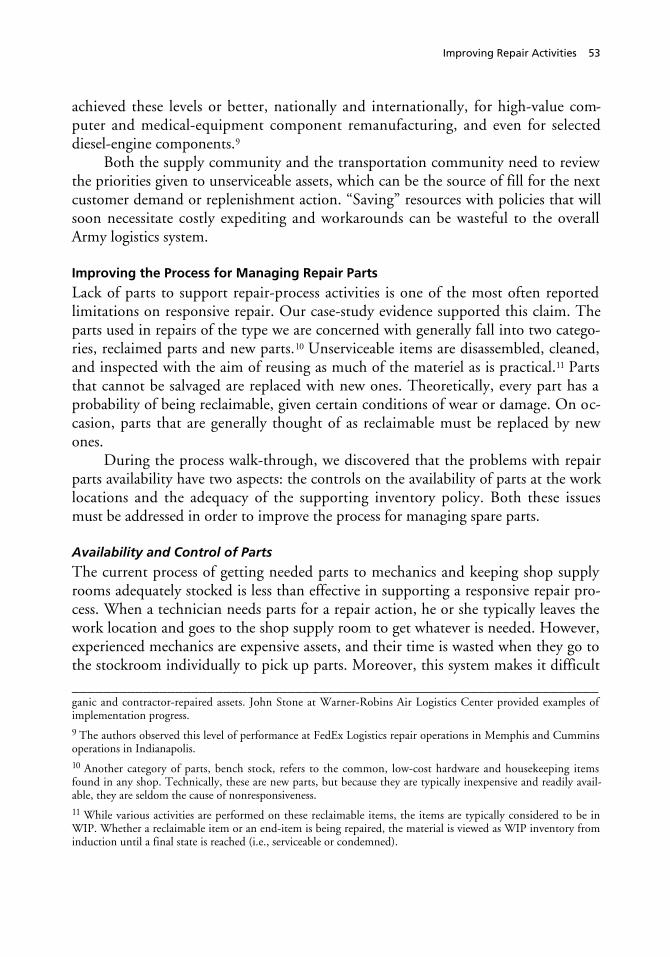
Improving Repair Activities 53
achieved these levels or better, nationally and internationally, for high-value com-puter and medical-equipment component remanufacturing, and even for selecteddiesel-engine components.9
Both the supply community and the transportation community need to reviewthe priorities given to unserviceable assets, which can be the source of fill for the nextcustomer demand or replenishment action. “Saving” resources with policies that willsoon necessitate costly expediting and workarounds can be wasteful to the overallArmy logistics system.
Improving the Process for Managing Repair Parts
Lack of parts to support repair-process activities is one of the most often reportedlimitations on responsive repair. Our case-study evidence supported this claim. Theparts used in repairs of the type we are concerned with generally fall into two catego-ries, reclaimed parts and new parts.10 Unserviceable items are disassembled, cleaned,and inspected with the aim of reusing as much of the materiel as is practical.11 Partsthat cannot be salvaged are replaced with new ones. Theoretically, every part has aprobability of being reclaimable, given certain conditions of wear or damage. On oc-casion, parts that are generally thought of as reclaimable must be replaced by newones.
During the process walk-through, we discovered that the problems with repairparts availability have two aspects: the controls on the availability of parts at the worklocations and the adequacy of the supporting inventory policy. Both these issuesmust be addressed in order to improve the process for managing spare parts.
Availability and Control of Parts
The current process of getting needed parts to mechanics and keeping shop supplyrooms adequately stocked is less than effective in supporting a responsive repair pro-cess. When a technician needs parts for a repair action, he or she typically leaves thework location and goes to the shop supply room to get whatever is needed. However,experienced mechanics are expensive assets, and their time is wasted when they go tothe stockroom individually to pick up parts. Moreover, this system makes it difficult__________________________________________________________________ganic and contractor-repaired assets. John Stone at Warner-Robins Air Logistics Center provided examples ofimplementation progress.9 The authors observed this level of performance at FedEx Logistics repair operations in Memphis and Cumminsoperations in Indianapolis.10 Another category of parts, bench stock, refers to the common, low-cost hardware and housekeeping itemsfound in any shop. Technically, these are new parts, but because they are typically inexpensive and readily avail-able, they are seldom the cause of nonresponsiveness.11 While various activities are performed on these reclaimable items, the items are typically considered to be inWIP. Whether a reclaimable item or an end-item is being repaired, the material is viewed as WIP inventory frominduction until a final state is reached (i.e., serviceable or condemned).

54 Improving the Army’s Management of Reparable Spare Parts
for stockroom clerks to keep track of inventory. For example, at ANAD, no recordwas made of materiel that mechanics obtained on a self-service basis from the supplyrooms. A stockroom clerk checked inventory weekly and sent weekly (as well asemergency) requests to the scheduling clerk for the applicable PRON. The schedul-ing clerk worked from the production schedule, using a manual analysis to verify thatsufficient parts were on hand in the stockroom and the ASRS to cover the next 60days of scheduled production. The scheduling clerk submitted replenishment re-quests for the stockroom online and had a separate interface to the installation supplyaccount (ISA) to requisition additional stock for the ASRS. The ISA inventory wasrecently eliminated from the repair depots; however, the ISA computer is still used togenerate requisitions for replenishment from the source of supply. The computerprocesses the scheduling clerk’s requisition to the Defense Automated AddressingSystem (DAAS) and the appropriate inventory control point (ICP) for sourcing in-structions in a manner like that used to process a tactical-level customer’s requisitionthrough the SARSS.
Almost all reclaimed items flow through their necessary repair actions and re-turn directly to the shop stockroom. Depending upon the total materiel in WIP, thequantity of reclaimed items may vary and can amount to more than 60 days’ stock.Extensive man-hours are invested in tracking down reclaimable WIP that has notreached the stockroom when needed.12 A similar pattern exists for backordered newpiece parts (for both Army- and DLA-managed items).
In an effort to make the repair parts system more responsive, we offer the fol-lowing suggestions, which we discussed with personnel at ANAD.
Control access to the shop supply room and issue parts at the mechanic work-stations. Materiel should be available to mechanics at their work locations. Underthis approach, the clerk issues parts from the room and therefore is in a position topick parts and note the need for restocking on a single pass at a location, meaningthat the weekly inventory and order submission would no longer be required. Thischange would improve decisionmaking by increasing the frequency of reviews andeliminating the opportunity for an item to go to zero balance before a reorder isplaced. As this process is implemented, the mechanic and the supply room clerk candetermine together the total quantity of each NSN that will be needed at a givenworkstation for planned increments of work. A parts list might also be built for eachworkstation that would enable the mechanic to easily request restock quantities peri-odically.
Look for opportunities to assemble kits of new and reclaimed parts. Theautomation in the ASRS can be used to help prepare kits for some or all of the parts____________12 On several different visits to the case-study work center, we noted both mechanics and indirect labor engagedin these efforts. Managers told us that this was a common, recurring problem.

Improving Repair Activities 55
required at workstations where repetitive assembly actions take place.13 ASRS cur-rently responds to the shop stock room within about 24 hours of an online requestfor material by the scheduling clerk. The items in the ASRS are owned by mainte-nance (i.e., this is “issued” materiel or shop stock that is not reflected on supply in-ventory records anywhere); they include WIP assemblies, reclaimed materiel, newpiece parts, and other material staged to support modification and overhaul programsat the depot. The ASRS capability also supports “kitting” of materiel in support ofdepot tasks. At ANAD, the ASRS is housed within a separate building, but at mostother depots, the ASRS is within the main maintenance facility.
This approach would cut out the stockroom inventory layer for many items andcould link inventories more closely to actual production. For example, if a mechanicis scheduled to assemble two “widgets” per day, the scheduler could pull two kits perday forward from the ASRS (which has an inherent kit-building capability) andbuffer the process with an additional prepositioned kit. Any unused parts could bereturned to the ASRS inventory for future kits.
Modify the routing of reclaimed parts. The repair process would also benefitfrom changes in the procedures for routing reclaimed parts.14 During one case-studyvisit, we noticed that there were frequent delays in the process used to batch re-claimed items so that they could be routed appropriately. At the time, reclaimedparts were sorted into metal tote baskets with similar materiel; after each basket wasfilled, it was routed through a sequence of work centers where each item was cleaned,repaired, plated, machined, or painted, as necessary, depending upon its specifica-tions. The size of the batch was typically determined by how much of the material fitinto the standard tote. To minimize set-up time (e.g., for painting), work centersalong the individual item routings often batch processed totes of several differentitems that required common applications in that work center. If an item was large,the tote filled quickly after a few unserviceables were disassembled, allowing it to berouted fairly quickly. The tote for small items, however, could sit for an extendedperiod until enough carcasses were disassembled to generate sufficient materiel to fillthe tote. The focus on the efficiency of large batches was driving total WIP.
By routing reclaimable material frequently in small batches and on a daily basis,personnel could capitalize on common routings of items by placing them into thesame tote. During a subsequent visit, we learned that another depot activity that was____________13 The elimination of the ISA inventory and warehouse removed a whole level of inventory between the ASRSand the DLA distribution center located at each Army maintenance depot. It also eliminated the civilian supplymanpower. DLA stocks items at collocated distribution centers on the basis of local demand history and usuallydelivers locally issued material to ASRS within 24 hours of the MRO. The distribution center also stocks service-able and unserviceable Army-managed items as directed by an IM. At ANAD, significant DLA space is dedicatedto unserviceable-asset storage. DLA also currently provides the few supply specialists necessary to operate thewarehousing tasks at the ASRS facility on a reimbursable basis.14 This procedure has since begun to change, in part, as will be explained later.

56 Improving the Army’s Management of Reparable Spare Parts
working with a contractor to improve the reclaimed-materiel routing and trackingprocess had begun to implement such a procedure.15 The contractor linked thechange in the routing process to the automation of the bill of materials associatedwith the depot maintenance work requirement (DMWR) and bar coding, whichhelped generate automated routing documents and track progress by reading the barcode during the actual materiel flow. During subsequent visits to the facility, we ob-served the pilot implementation, and the impact of these new procedures was evi-dent. The schedulers and shop floor managers reported immediate improvements inthe visibility of WIP materials, and, more important, they quickly saw that thesmaller batch sizes provided a steady flow of reclaimed materiel to the assembly areas,reducing the need for expedited actions.
Route reclaimed parts to the ASRS. The final destination for all the reclaimed-parts routing orders should be the ASRS, since input to the ASRS changes therecorded inventory quantity for the part and records the storage location, both ofwhich are visible to schedulers and other depot managers. All parts, whether re-claimed or new, can then be brought forward in an orderly manner as required tosupport production.
For example, routing reclaimable materiel from a disassembled carcass can leadto a net growth in inventory of some reclaimed items if it is not tracked well. In thecase-study PRON, a total of 70 engines were inducted and in various states of WIP.These engines had each been removed from the shipping container and disassembledinto piece parts for cleaning and inspection. The parts are interchangeable and notreadily associated with the originally inducted, serial-numbered asset. If a separatePRON for the same NIIN were released, calling for the disassembly of the engines toreclaim certain parts that were in short supply, the rest of the unserviceable partswould be scrapped, because there would be a net excess of unserviceable carcasses.Without tight shop-floor controls, unintended reclaiming of parts would be possible.When the parts remain on the work floor without WIP accountability and visibility,____________15 The contractor, Robbins-Gioia, Inc., had a multitask contract, which focused on consolidating data generatedthrough the various legacy data systems at the depot into an integrated database. The contractor then developedand exploited tools for mining that data for direct applications that address the needs of working-level managers.These contractor engineers and IT specialists had expertise that was not available at ANAD (partly because train-ing programs were not available). For the reclaimed-parts routing task, the contractor developed a bill-of-materials routing flow based on the depot-maintenance work requirement (DMWR) for each reparable NIIN.The DMWR was found to be significantly outdated with respect to current task activities for many parts. Theseerrors are not important in the accuracy of documentation, but the delays, misroutings, and lost materiel causeincreased costs and delayed production.
The implementation of improvements in reclaimed-parts routing and tracking was a pilot effort limited to themateriel flowing from a single NSN repair program. It will require significant time and work to expand this toother items and other work centers. The contractor has shared its expertise, but the depot has not yet trained itsworkers to continue the expansion of this effort on their own. An IT investment was also required to permit bar-code scanning for tracking materiel flow during repair. We do not know whether these capabilities are incorpo-rated in the Logistics Modernization Program (LMP) IT upgrade that is now under way.

Improving Repair Activities 57
it is very difficult to be sure how many of each piece part are actually on hand. TheASRS provides both efficient storage and inventory visibility.
Use pull production techniques to reduce batch sizes and WIP inventory. Aspull production scheduling and small-batch routing of reclaimable materiel is im-plemented across the facility for each NSN type, opportunities to reduce WIP willemerge. The number of WIP engines in the case study (70) should be reduced overtime. The optimal number is not known at this time, but the desired state would bethe point at which waste has been reduced so that a demand signal causes an induc-tion that leads to a complete repair the same day. Such a radically different end-statecan hardly be imagined today for this engine, even though for most reparable work-load, the total time required for all the value-adding actions amounts to only minutesor hours. The elimination of waste eliminates the need for buffer inventory and dra-matically improves responsiveness.
National Inventory Policy
The management of repair parts can also be improved by the policy used to deter-mine inventory levels of reclaimed parts and new piece parts. Reclaimed parts typi-cally have a “washout” or condemnation rate, since not all used materiel can be suc-cessfully returned to satisfactory condition. Therefore, it is important to know whena washout occurs so that new replacement materiel will be available to complete thesubsequent assembly or repair action.
New piece parts are the greatest policy challenge. They can vary in cost from afew cents to tens of thousands of dollars, and a single reparable item might poten-tially consume several hundred of them for a single repair. The issue of new pieceparts in particular raises the question of how the Army depots can support the repairsrequired to meet customer demands while keeping inventory investment to a mini-mum.
The diversity in the number, cost, and complexity of parts needed for differentrepairs means that a single rule or policy for determining how many of each item tostock in inventory to support the expected repair programs is not likely to achieveeither effectiveness or efficiency. Unfortunately, the current policies and practices formanaging repair-parts inventory frequently result in stock outages and consequentwork stoppages. It is therefore necessary to examine how much should be invested,by item, and where the items should be positioned to support the repair operation.
The basic inventory policy for new piece parts at AMC maintenance depots,60 days of supply (DOS), applies to all items other than bench stock and special-project assets. But an investment of 60 DOS is too high for many items and notnearly sufficient to prevent work stoppages and workarounds for others. The intentof the current policy is to have the last of the repair parts used as the depot finishesthe approved PRON, thus minimizing parts investment and the risk that a PRONmight not be approved for the next period for the same NSN. However, many repair

58 Improving the Army’s Management of Reparable Spare Parts
programs will be renewed yearly for the foreseeable future, so this policy increases therisk of nonresponsive repair at the beginning of a recurring PRON in the comingyear.16
Clearly, it will be difficult to address inventory investment policies until someaspects of inventory control are improved, but it is not premature to make some ob-servations and propose some alternatives.
Use demand as the primary indicator for repair-part inventory planning. Thetraditional AMC policy, which codes the requisitions for parts supporting reparablePRONs as nonrecurring demands, is contrary to the needs of both the repair depotand the IMs. Reparable assets are intended to be repaired on a recurring basis overthe lifetime of the end-item they support. These are not nonrecurring modificationsor other special depot-level projects, which also occur in the overall maintenance-depot workload.
Both AMC policy and the repair depot’s ISA should be changed to code all re-pair-part requests supporting recurring reparable programs as recurring demands.That coding would provide immediate feedback to the managing national inventory-control point (NICP) about the true nature of usage for each piece part. Informationon nonrecurring coded transactions does not flow automatically in the same manner.However, in an attempt to provide better support, DLA has ensured that NSNs or-dered at least four times are treated as recurring, even when the requisitions are coded“nonrecurring.” It is important to ensure that the NICP gets correct informationabout asset usage so that inventory and vendor relationships can be maintained. Thecurrent procedures introduce a lag of six to 18 months (and sometimes more) in thefeedback about demand.
The current procedure, called the parts-explosion process (PEP), was intendedto express the future demand expectations for depot repair parts to both Army andDLA IMs. Some believe that the current PEP is too slow to provide responsive feed-back and too error-prone to be trusted by the IMs. They refer to the lack of willing-ness by AMC to fund inventory-investment projections based on the PEP as partialevidence to support this conclusion. We traced the PEP procedures for the M88A1engine repair at ANAD and found that the information on quantities or repair partsused and the probabilities of use per repair are aggregated at the completion of aPRON. The data are collected for each PRON. If a PRON is judged by theTACOM depot-maintenance managers to be nonrepresentative workload, those dataare ignored. The resulting “valid” data are used to update the PEP model that rec-ommends the parts necessary to support the future PRON then under development.____________16 This discussion follows the basic logic that it is important to bring the existing inventories and supply practicesunder control before undertaking additional investment. However, during the course of the case study, we notedthat some individual items were clearly stocked in insufficient quantity. Therefore, inventory-policy alternativeswill also be discussed below.

Improving Repair Activities 59
The intent is to provide advance notification to the NICPs of repair-part require-ments for that forthcoming PRON. However, the parts usage is not aggregated untila PRON is completed, and the information is not provided to the NICP until thePRON workload forecast is to be approved, 12 to 18 months in the future. Further-more, both TACOM and DLA personnel involved with the case study reported thatthe PEP recommendations were not good predictions of actual future demands.Therefore, DLA will not use the PEP as the basis for inventory investment unless theArmy obligates its funds in advance. TACOM has not done that. We were shown themost recent PEP output that was sent to DLA. Using an audit program that reviewsthe information for glaring errors (e.g., a forecast of 100,000 for a low-use item),DLA had identified more than 40 percent of the item recommendations as probableerrors. The PEP is complex, delays the availability of useful feedback, and does notprovide the desired results. In the meantime, parts use continues daily and valid usedata could be provided automatically to the NICPs to help guide their inventoryplanning.17
Depot-Level Inventory Policy
The preceding discussion concerns national-level inventory decisions. An improvedinventory-decision policy is also needed to buffer the demands at the repair locations,the repair depots.
Adopt a variable repair-parts-inventory policy to allow for greater diversity.The current policies and practices determining the size of the inventory investmentand the optimum location for positioning inventory evolved in response to pressuresto reduce investment. To achieve that goal, whole levels of inventory were eliminatedand maximum DOS was specified for individual items (i.e., elimination of the ISA).
However, the critical issue is not the DOS on hand; it is the assurance that re-plenishment of shop stocks is readily available. An inventory policy should not justlimit investment in repair inventory, it should also provide a clear signal to IMsabout the usage or consumption of inventory items. Thus, the reorder point for shopstock generally needs to be close enough to the inventory objective level that reordersof relatively small amounts occur frequently. For example, future IT improvementsshould include point-of-sale data collection that feeds parts-consumption data di-rectly to supply managers so that the automated decision-support tools will replenishand adjust inventory levels throughout the supply chain to achieve the desired results.
The policy should also allow for more diversity to address the different charac-teristics of individual repair parts. We suggest that it should at least distinguish____________17 The PEP has a logical basis. Detailed data on part failures and consumption encountered during asset repaircan be very valuable for reliability analyses of both reparable assets and problem piece parts. However, improve-ment of reparable-assets reliability is beyond the scope of this research. It is possible that elements of the PEPcould provide critical information.

60 Improving the Army’s Management of Reparable Spare Parts
among items used for nearly all repairs, items used less frequently, items that are usedinfrequently and have long lead times for replenishment, and items that are used in-frequently and have short lead times for replenishment.
Frequently used items. The largest group of new repair parts comprises theitems that are used for nearly all the repairs performed for a given NSN—both newitems from vendors and subordinate reparables, which can be repaired either by thegovernment or by a contractor. As long as these items are produced and available ona monthly basis, replenishment under the current 60-DOS policy should provide ademand history that can be used by the PRON IM and the repair-parts IM to ensurethat assets are on hand and that there is a continuing vendor relationship to meet fu-ture needs. Both DLA and the Army should position such items at the local DLAdistribution center and/or the appropriate regional strategic distribution platform(SDP) (i.e., Susquehanna (DDSP) or San Joaquin (DDJC)) to provide replenish-ment at a defined CWT from the scheduling clerk’s request.
Eventually, the scheduling clerk should be able to improve the 60-day level to45 days and then to 30 days, with no degradation in support but with the appropri-ate one-time savings in inventory investment (i.e., up to half the average inventoryvalue of the 60-DOS policy). However, given the low dollar amount tied up in thisinventory, it is probably not prudent to begin with such an emphasis on efficiency.Instead, retention of the current 60-DOS policy during initial implementation canensure that the depot is comfortable with the level of risk. The achieved CWT andits variability should determine the final inventory depth for frequently used items.
The actual cost of these items should also factor into this decision, because someof them are inexpensive and basic economic order quantity (EOQ) logic may be ap-propriate. Because the cost for the clerk to order via the ISA should be very low, theeconomic leverage should favor smaller order quantities.
Less frequently used items. A different policy could apply to those items usedless frequently. It is important to ensure that multiple replenishments of these itemsoccur during a year and that the IM has stock on hand and a current vendor relation-ship. The risk of stock-out is greatest in cases when there have been infrequent re-plenishments, the IM is nearly out of stock, and a new procurement will need to beundertaken. When this risk is relatively high, 60 DOS will not likely be enough,given the lead time of the replenishment and procurement activities. Frequent shop-replenishment orders signal the DLA system (for example) that there is an active de-mand for the item, thus indicating that DLA should maintain stock and a vendorrelationship for prompt replenishment. The PRON IM should work with the depot’sscheduling clerk and the repair-parts IMs supporting the PRON for such items toensure that assets and vendor sources are available.
Infrequently used long-lead-time items. A different policy is required for partsthat are used infrequently and that have long lead times for replenishment, i.e., itemsthat are no longer manufactured for the commercial market and for which the depot
Improving Repair Activities 61
is virtually the sole remaining customer. The government is often forced to buy moreof such items than it would normally want in the near term to justify the setup costsfor a one-time manufacture by a vendor. These items typically are a small percentageof the total items, but they can account for a majority of the total inventory invest-ment. Thus, they require and justify intensive management. We found several exam-ples of such items during our case study. The diesel-engine block, crankshaft, andcylinder heads were seldom condemned during their first 20 years or so. However,the engine used in the M88A1 vehicle has now been out of production for more than20 years, and wear and fatigue appear to be taking a toll. Years ago, engineers andsupply specialists anticipated the need to buy spares for these critical components andmade the necessary investment. Now the time has come to replenish those stocks,but unfortunately, the original manufacturer is no longer producing them and is notinterested in working a one-time order into its production schedule. As a result, thelead time to replace these items in inventory is now years instead of months.
The circumstances are not always so extreme. Long lead times are driven bysetup and manufacturing in addition to the more complex acquisition process itself.The PRON IM and the depot need to identify long-lead-time items and take actionto assure availability long before the repair technician asks for the last part on theshelf. For such cases, no mere DOS policy is relevant. The good news is that there arerelatively few long-lead-time items for each PRON, and in some cases, extraordinaryworkarounds exist for completing repairs without difficult-to-acquire parts. Suchworkarounds and the investment required to keep needed parts available are simplytwo of the costs of doing business.18
Infrequently used short-lead-time items. The policy for infrequently usedshort-lead-time items is simple. As long as the lead time remains short, there is noreason to invest in more than the minimal inventory. However, care must be taken toassure that these NSNs remain available.
Use workarounds as an inventory policy of last resort. When the existing poli-cies of any maintenance system fail to provide adequate materiel, all levels of the sys-tem (in the Army, a sister service, or a commercial operation) develop alternativemethods or workarounds to meet the requirements. Several well-recognized work-arounds are in use at the repair depots. The criticality of the customer’s need is rele-vant when determining whether or not a particular alternative should be applied, andsome “necessary” workarounds could be made less difficult and less expensive for thedepot—and ultimately, the Army.____________18 The fact that a given item was designated as reparable rather than disposable was the result of an earlier deci-sion analysis to either repair or buy upon failure. The analysis is usually called LORA (level-of-repair analysis) andcould be repeated throughout the life cycle of the system if desired. However, given the decision to repair an item,the repair parts must be available in time to support the repair turnaround concept that is chosen. The number ofreparable items assumes a given turnaround concept, including repair-process timing.

62 Improving the Army’s Management of Reparable Spare Parts
Exchanging Parts Among Unserviceables
One common form of workaround, the “rob back,” can provide parts necessary tocomplete a repair but can also lead to an accumulation of WIP. A rob back is a formof controlled substitution or cannibalization of parts from one assembly to repair an-other. The need to cannibalize parts appears to be one of the main motivations forthe induction of large batches of unserviceables. The resulting WIP material becomesan inventory of potential parts that can be swapped and robbed to continue produc-tion of serviceable assets. However, the practice has its limitations. For example, eventhough the WIP for the M88A1 stood at approximately 70 engines, there were noitems left to rob for some critical parts. In other words, the repair process was short70 each of at least one repair part. This condition may be temporary and may be as-sociated with replenishment due-in from a vendor or with a bottleneck in processingreclaimable materiel. The inventory-control improvements discussed earlier wouldhelp to prevent unnecessary rob backs due to misplaced WIP.
Scavenging Parts from Condemned Assets
Another type of workaround involves disassembly for parts of long-lead-time or con-demned end-items. Assets for this purpose have become increasingly available in re-cent years due to the general drawdown in force structure within the Army. For ex-ample, the number of M88A1s in the inventory has been reduced, so the number ofspare engines has been comparatively reduced, and the number of unserviceable as-sets is determined to exceed expected future needs. Given the long lead times neededto acquire certain critical repair parts, the decision has been made at the IM staff levelto disassemble some number of unserviceable assets to recover or reclaim certaincritical assets.19 The value of these excess engines is a sunk cost and is therefore irrele-vant to the decision. The reclaimed parts cost the man-hours and processing to re-turn them to serviceable condition. This can easily be less than the cost of the newrepair parts from a vendor. What must be guarded against is the potential for growthin WIP for items that are not needed but are the by-product of the disassembly pro-cess. The inventory-control improvements discussed earlier relate directly to thisissue.
Local Purchase
Another type of workaround is the local purchase of assets not available in timethrough the normal supply-management procedures. In the case study, the proce-dures required to complete normal supply-management actions were much morecomplicated and drawn out than those seen at most Army installations and motor____________19 In this case, the IM developed a separate PRON to tear down some of the unserviceables in storage for parts.This PRON became an alternative to the long-lead-time parts-procurement alternative discussed above for theseitems.

Improving Repair Activities 63
pools. The documentation and processing of one transaction at the depot took morethan 30 days, while the tactical motor pool could have taken a credit card to a localmerchant to obtain the same part the same day. But while the prompt local purchaseof material can be an important alternative course of action, drastically simplifiedprocedures are needed for situations where material is available locally from commer-cial sources. For example, in the case in question, the item costs were less than $10each and the total purchase was less than $100, so the cost to the depot for lost pro-duction and processing far exceeded the purchase price.
Heroic Efforts
Sometimes, because of a critical need, heroic efforts are made to reclaim materialfrom a carcass that would, under normal conditions, be condemned and disposed of.This is a valuable service for certain critical materials. In such cases, a mechanic mustensure that quality standards are maintained and must often make several attemptsbefore obtaining a serviceable item. Thus, the cost of these workarounds can be highand quite variable. However, the practice is profitable enough that it has attractedentrepreneurs to DLA disposal sites to buy such “junk” and salvage parts that arethen sold back to the government.
The expense of workaround procedures can range from trivial for the rob backof a single item that was disassembled anyway to extensive man-hours of rework; thebenefit can be the prevention of idle manpower and facilities due to a work stoppage.These costs and benefits, along with other relevant data, need to be factored into theinventory investment-decision equation.
Financial Policies That Support More-Responsive Depot Repairs
Adopt financial policies that encourage more-efficient depot repair. There aretwo areas in which financial policy appears to be a negative issue limiting the respon-siveness of repair activities: (1) the carryover of workload of approved PRONs intomonths of the next fiscal year, and (2) the need to align cost allocations to more ac-curately reflect the cost of repair activities and to price reparable assets as an incentiveto field managers to make the best purchase-versus-repair decisions for the Army.Decisions based on local optimization are often at odds with the most economicallyfavorable decision for the Army.
Adopt policies that make repair programs responsive to customer demands.The current yearly PRON approval process encourages carryover of workload fromone year to the next. The Army maintenance depots’ component-repair programs arefinanced via the AWCF, a revolving fund, rather than direct congressional appropria-tions. Unlike congressionally approved budgets, revolving-fund activities are not re-quired to spend all their funds by the end of the fiscal year to avoid losing the money.Thus, depots carry over workload beyond its intended fiscal year to provide cash flowfor labor and materiel to support approved PRONs.

64 Improving the Army’s Management of Reparable Spare Parts
Since the congressional budget is almost never approved before October 1, newPRONs are not approved for release at the start of the fiscal year, and the depot can-not begin them on time. In fact, the depot cannot even order parts to prepositionthem against a new PRON. Therefore, workload carryover can complicate the timelymeeting of customer demands when the approved PRON quantity was consistentwith actual demands through the end of the completed fiscal year.20
Repair depots have learned this lesson, so they plan to carry over work from theprevious PRON to keep the workforce busy. This stretching of the productionschedule happens yearly, and the normal expectation is that the depot will not have areleased PRON for the current fiscal year until December or January.
A 2001 GAO report21 addressed the funding issues associated with stretchingdepot workload from one year to the next. The GAO found that DoD had notdocumented an analytical basis for its three-month carryover practice and that, with-out such analysis, there can be no assurance of a smooth transition from one fiscalyear to the next and no measure of whether the carryover is sufficient or excessive.The report further identifies specific problems in Army depot maintenance:
The actual reported year-end carryover for Army’s depot maintenance and ord-nance activity groups exceeded the 3-month carryover standard consistently fromfiscal year 1996 through fiscal year 2000.
For fiscal year 2000, Army officials stated that there were four reasons that the actualreported year-end carryover balance exceeded the standard and budget projections:
• Some depots could not obtain the parts needed in a timely manner, so that lesswork was performed than planned.
• Some depots did not accurately estimate the time and resources needed to com-plete jobs.
• Emergency situations, such as unplanned orders to perform safety-of-flightwork, delayed work on orders already accepted by the depots.
• The composition and size of the workload changed from the budget projectionsdue to changes in customer funding and priorities (GAO, 2001b, pp. 14–15).
Workload carryover and the pattern of delayed production, along with changes indemand, contribute to the due-out volume and the BO rate. The Army needs to re-vise policies to reconcile its current contradictory financial incentives and to ensure____________20 DoD and Army financial policy (as currently interpreted) prevents repair managers from starting the newPRON. However, the number of repairs authorized under the previous PRON could potentially be adjusted toreflect the actual sales (and the necessary repairs). That is not the current practice. (See also footnote 11 in Chap-ter Three.)21 GAO, 2001b.

Improving Repair Activities 65
that customer demands are met promptly. The new policy must enable the workforceto be paid while customers continue placing demands funded by a continuing resolu-tion covering mission activities that the continuing resolution supports.
Align cost and pricing to reflect the cost of repairs to the Army. Changes in theArmy’s budgeting, price, and credit policies have a particularly strong influence onthe behavior of logistics customers because those customers make purchasing, inven-tory, repair, and turn-in decisions based on the budgets they receive and the pricesand credits they face. Depot repair is affected by several current Army financial poli-cies, including the implementation of transfer pricing (AWCF), the lack of directfunding for fixed costs, and the lack of exchange pricing, under which requests andreturns can be combined into one financial transaction.22
The Army’s current financing system was intended to provide incentives toboth logistics suppliers and customers to maintain the Army’s weapon systems cost-effectively—for suppliers to reduce costs, and for customers to use resources wisely.In 1992, DoD implemented stock funding of DLRs in an effort to gain the effects offree markets. This resulted in logistics customers being given budgets to buy suppliesand repairs from Army or DoD logistics suppliers. Under this market-like mecha-nism, customers pay for items they order and receive credits for items they return.Tactical- and national-level inventories are financed by stock funds, and suppliersmust replenish these inventories with income from sales net of credits to make thestock funds ultimately break even.23
Customer behavior has a strong influence on the cash and materiel inflows andoutflows of the Army’s stock funds and thus on their solvency. Customers may seekthe best price for costly items and may therefore purchase these items from a sourceother than the supply system. The supply system then loses a “sale,” and revenue orcash flow needed by the stock fund is not realized.
The prices of Army-managed items are set at the latest acquisition cost (LAC) orlatest repair cost (LRC) plus a supply-management surcharge to recover the costs ofoperating the wholesale supply system.24 Even if the Army’s LAC is low because it isable to make volume buys, the surcharge acts as a “tax” on purchases from the supplysystem. When items have commercial equivalents, customers are likely to choose theleast-expensive alternative, if it is easily available. Even when the Army’s acquisitioncost is lower than local vendors’ prices, a high surcharge may make local purchase the____________22 This discussion draws upon earlier RAND work and is presented to explicitly address the linkage of financialissues within the reparable-management process. For further discussion of related defense financial policies, seeBaldwin and Gotz, 1998; and Pint et al., 2002.23 The wholesale supply system acts as a “middle man” for logistics customers. It maintains inventories of spareparts to meet demands from customers by buying repairs from Army maintenance facilities or private-sector con-tractors and new parts from vendors.24 DLA and the other services set their own surcharge rates for the items they manage. Non-Army-managed itemsdo not incur any additional surcharge from the Army.

66 Improving the Army’s Management of Reparable Spare Parts
least expensive option. Diversions of purchases may cause the AWCF to not fullyrecover all of its fixed costs, necessitating further surcharge increases. If the AWCF’sactual sales volume is higher or lower than was expected when the surcharge rate wascalculated, the AWCF will either overrecover or underrecover any fixed costs in-cluded in the surcharge.
An analysis of the supply-management surcharge shows that it includes fixedcosts that do not vary with supply-management activity; these fixed costs could befunded by direct appropriations to avoid distorting customers’ supply and repair de-cisions, while variable costs could be allocated more specifically to the items that gen-erate them. Fixed costs include the costs of DoD agencies such as the Defense Logis-tics Services Center (DLSC), the Defense Automated Addressing System Center(DAASC), and the Defense Reutilization and Marketing Service (DRMS) (theagency referred to above in the discussion of disposal of condemned unserviceables);depreciation; and adjustments for prior-year losses or gains. Variable costs includedepot storage and distribution costs, transportation costs, condemnation rates, andlosses and obsolescence. In FY2000, a shift in funding such as that described herecould have reduced the surcharge from 26.7 percent to 15.4 percent and provideddirect funding of $136.5 million. This would imply a corresponding shift of $136.5million from other accounts (e.g., Operations and Maintenance, Army (OMA)). Inthis case, the price charged the OMA customer for a $600,000 engine would be re-duced by $53,000. All things being equal, the total cost to the Army would remainunchanged, but the marginal cost of each order would be more transparent.
Similarly, depot repair costs are based on computed depot-maintenance hourlylabor rates, which include fixed costs that do not vary with repair activity and coststhat could be allocated on an item-by-item basis. Fixed costs include Defense Infor-mation Systems Agency (DISA) and Defense Finance and Accounting Service(DFAS) bills, depreciation, rent, utilities, facilities maintenance, and prior-year gainsor losses.25 Fixed costs could be recovered through direct appropriations or lump-sum payments from customers. Variable costs that could be allocated on an item-by-item basis rather than on the basis of a labor-hour factor include spare parts, supplies,transportation and distribution, and equipment and engineering support providedfor specific types of items. In FY2000, reprogramming these costs would have re-duced the depot-maintenance hourly rate from $111.87 to $48.04. These changeswould require revision of OSD policy.
The benefits associated with the direct funding of fixed costs include the fol-lowing:____________25 Some proportion of these costs, such as utilities and facilities maintenance, could vary with maintenance activ-ity and could be allocated on an item-by-item basis, using activity-based costing. The Army has used activity-based costing to develop installation-cost maps for intermediate-sustainment management (ISM) and for theservice-based costing system for installation support services. See Brauner et al., 1997; and Tsai and Evanovich,1999.
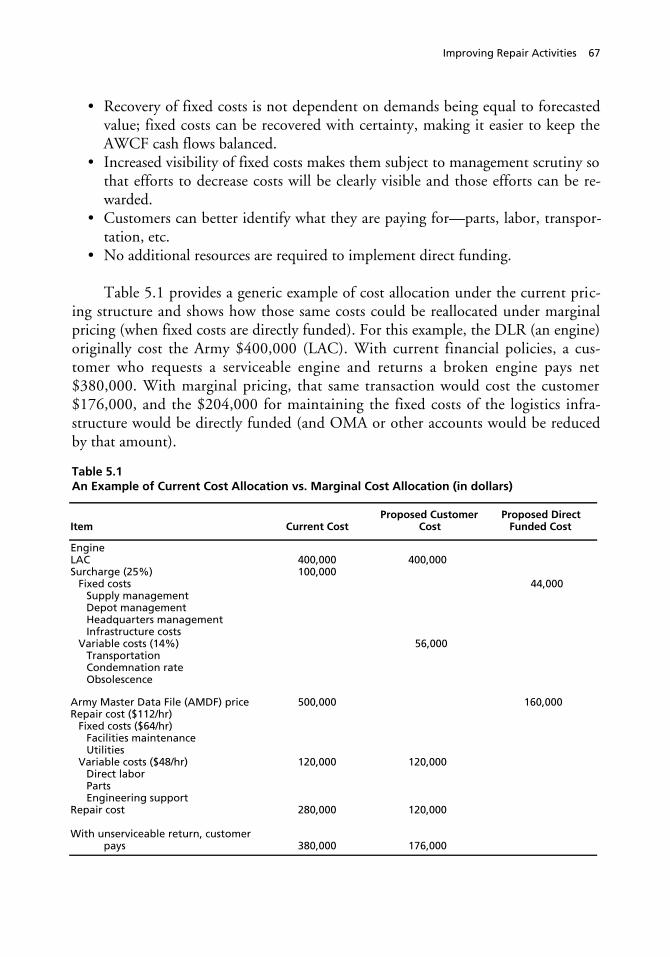
Improving Repair Activities 67
• Recovery of fixed costs is not dependent on demands being equal to forecastedvalue; fixed costs can be recovered with certainty, making it easier to keep theAWCF cash flows balanced.
• Increased visibility of fixed costs makes them subject to management scrutiny sothat efforts to decrease costs will be clearly visible and those efforts can be re-warded.
• Customers can better identify what they are paying for—parts, labor, transpor-tation, etc.
• No additional resources are required to implement direct funding.
Table 5.1 provides a generic example of cost allocation under the current pric-ing structure and shows how those same costs could be reallocated under marginalpricing (when fixed costs are directly funded). For this example, the DLR (an engine)originally cost the Army $400,000 (LAC). With current financial policies, a cus-tomer who requests a serviceable engine and returns a broken engine pays net$380,000. With marginal pricing, that same transaction would cost the customer$176,000, and the $204,000 for maintaining the fixed costs of the logistics infra-structure would be directly funded (and OMA or other accounts would be reducedby that amount).
Table 5.1An Example of Current Cost Allocation vs. Marginal Cost Allocation (in dollars)
Item Current CostProposed Customer
CostProposed Direct
Funded Cost
EngineLAC 400,000 400,000Surcharge (25%) 100,000
Fixed costsSupply managementDepot managementHeadquarters managementInfrastructure costs
Variable costs (14%)TransportationCondemnation rateObsolescence
56,000
44,000
Army Master Data File (AMDF) price 500,000 160,000Repair cost ($112/hr)
Fixed costs ($64/hr)Facilities maintenanceUtilities
Variable costs ($48/hr) 120,000 120,000Direct laborPartsEngineering support
Repair cost 280,000 120,000
With unserviceable return, customerpays 380,000 176,000
68 Improving the Army’s Management of Reparable Spare Parts
Exchange pricing, under which requests and returns are combined in the samefinancial transaction, offers another opportunity to improve the Army’s financialpolicy for spare parts. Continuing with the same example, under current policy, thecustomer first obligates $500,000 (AMDF price) when the serviceable engine is re-quested. If the customer returns the broken engine to the supply system, his accountwill be credited with $120,000 (AMDF price minus surcharge minus repair cost).Under exchange pricing, the two transactions (request and return) would be com-bined into one financial transaction for $320,000. Under exchange pricing, there isno net difference in the total amount debited to the customer’s account. The onlydifference is that there is one financial transaction, not two. Thus, exchange pricingreduces financial uncertainty and workload for both the customer and supply man-agement.
In addition, in the current environment, Army maintenance depots have un-used facilities and equipment capacity. Therefore, any additional use or marginalproduction of that capacity for repairing DLRs has the effect of spreading fixed costsover more transactions and thereby reducing the total cost per repair. As a result, ap-parently less-expensive DLR repairs below the depot level can have a financial conse-quence for the Army. Under the current pricing policies, a unit might decide that itwould be cheaper to repair an item than to buy a serviceable one through standardsupply channels. However, that economic decision must include the cost to the Armyto operate the depot-level capability even if it is not used. The marginal cost-allocation approach is a direct attempt to bring that cost to the Army into the pricingpresented to the customer.26
Conclusion
This chapter has identified several options for improving the Army’s repair process.These options, along with those presented in Chapter Four, can help make the repa-rable-management process more responsive to customer needs. However, as with theprocess-improvement options discussed in the previous chapter, the repair-activitiesoptions are not of equal relevance or ease of implementation.
The frequent replanning and sharing of current information between the supplyand repair activities is key to improved responsiveness. Within repair activities,____________26 The reliability of the repaired DLR should also be included in that economic decision analysis. For example,TACOM compared the mean operating hours between failures (MTBF) for M1A1 engines repaired by DS+ (adirect support repair capability at armor units), using a repair standard that calls for inspection and repair only asnecessary (255 hrs), the depot using the DMWR for service-life-extension (SLE) engines (600 hrs), and depotrepair to a newly developed national maintenance work requirement (NMWR) standard (800 hrs). Both theArmy’s fixed costs and the product’s reliability are relevant to the customer’s decision to repair locally or buy areplacement. However, the relevant information must be made available to enable the decisionmakers to makethe right decisions.

Improving Repair Activities 69
mechanisms are needed to translate revised output schedules into internal shop sig-nals regarding priorities.
The next most critical area for improvement is repair-part availability. The ex-amples discussed related most directly to the case-study NIIN and shop environ-ment. Not all the same issues will necessarily apply at the same levels for all NIINs.For example, the availability of unserviceable assets for induction varies by NIIN andmay not be a critical factor to improvement in some cases.
There is near-universal acceptance that issues related to financial-managementpolicy constrain the reparable-management process (as well as other logistics pro-cesses). However, those issues do not prevent efforts to improve the reparables pro-cess from moving forward. Financial-policy improvement can proceed in parallelwith the logistics-process efforts.


71
CHAPTER SIX
Recommendations for Pilot Implementation
In this chapter, we summarize and structure the alternatives discussed above into aset of overarching recommendations for an initial pilot implementation. The repara-ble-management process for returning unserviceable assets to a serviceable conditionto meet customer needs is complex and involves many stakeholders. Thus, our intentis to sketch an integrated approach that addresses some of the fundamental causes ofthe lack of adequate serviceable DLRs for issue to customers.
The Need for a More-Responsive Reparable-Management Process
For a process as complex as reparable management, the causes of the current unsatis-factory performance levels are certainly open to debate. While we have not attemptedto identify either the root causes or the dominant causes of the problems, our case-study-based analysis identified evidence of some causal relationships, and we haveproposed some alternative approaches to attain improvement.
The availability of reparables to customers can be dramatically improved with-out increased resources. Examples of ways to efficiently improve each area can befound in successful commercial practice, as well as in some isolated successes withinmilitary practice that deserve expansion.
The case study suggests a need to emphasize an integrated approach to plan-ning and execution (i.e., frequent replanning), one that involves both the item-management team at the MSC and the depot-maintenance team. This analysis ex-amines the management of availability of reparables to meet the dynamic needs ofArmy warfighters.1 It assumes current DLR reliability, existing information technol-ogy at the MSC and the depot, available repair capabilities and capacity, and currentDLR inventory-level (with the exception of safety-stock levels) determination meth-____________1 The reliability of reparable assets requires an inventory of serviceable spares to buffer the mission needs of theArmy. The focus in this study has been on management of the availability of serviceable reparable assets and al-ternative approaches that could make the process more responsive to changing demand patterns.

72 Improving the Army’s Management of Reparable Spare Parts
odology and practices. In the long term, all of these assumptions are subject to chal-lenge.
Recommendations for a Pilot Effort
Implementation of improvement initiatives can be made more tractable by startingwith a pilot effort focused on DLRs for which there are applicable improvement al-ternatives. Because this analysis focuses on the reparables process, the activities in-volved include a vertical slice of interdependent activities at both the MSC and thesupporting depot. Therefore, alternatives potentially cross organizational and func-tional boundaries. With a pilot implementation effort, limited permission can begranted to try new procedures and policy proposals in a “laboratory” setting, therebyreducing the risk of change for the larger organization. Results can be measured, rulesadjusted, and confidence developed before widespread change is implemented. Ofcourse, practical mechanisms must be developed to apply the successful and provenconcepts to a broader workload. With literally thousands of reparable NIINs poten-tially involved, full implementation of the desired changes will take careful planningand time.
The overall measure of success would be a reduction in the number and dura-tion of BOs for the selected NIINs without exceeding the serviceable inventory levelsneeded to meet customer requirements. Therefore, both BO rates and CWT shouldbe used as performance metrics.
We recommend that senior management at an MSC appoint a small pilot im-plementation team that focuses initially on a few reparable NIINs related to a singleweapon system or end-item that is repaired at the same facility.
Following the discussion in Chapters Four and Five, we recommend that thepilot implementation should
• Address uncertainty concerns.• Properly link long-term planning and replanning for responsive execution.• Improve repair responsiveness.
The first two recommendations focus extensively on the managing MSC. Thethird primarily concerns the supporting repair activities. However, the MSC and therepair depot need to work as a team to improve the overall process by integrating andsynchronizing their efforts.
The discussion that follows expands briefly on each of the alternatives describedearlier. Interactions exist among the alternatives, and care is required to ensure thatthe initiatives implemented are sufficiently complementary to achieve the desiredlevel of improvement. The level of such interaction may vary, depending on the

Recommendations for Pilot Implementation 73
NIINs chosen for the pilot program. For example, in the case study, merely improv-ing the responsiveness of replanning and changes to repair PRON quantities was notsufficient when the parts available to support the repair also had deficiencies. Whilecoordination or synchronization of implementation may not necessarily be requiredfor individual alternatives, it may often be necessary to ease more than one constraintsimultaneously; alternatively, the easing of a constraint can permit the clear visibilityof the next constraint.
Addressing Uncertainty
We recommend addressing uncertainty in four ways:
1. Use current forecast models while looking to future improvement.2. Use revised monthly forecasts for near-term decisions.3. Selectively adjust DLR safety stock.4. Implement strategies that shorten lead times.
First, we suggest continued use of the current forecasting model in the RD&ESmodule. In the long term, the Army should evaluate all such decision models withthe aim of developing and implementing improvements, but there is no evidence thata dramatically improved forecasting tool is available at this time. The limitations ofthe current model are associated with the long planning horizons required for thebudget and other long-term planning tasks. Therefore, the best basic approach is fre-quent replanning using revised forecasts based on current data, where possible. Thealready-implemented move to monthly execution of RD&ES against the reparableitems is thus the appropriate approach.
Second, in the near term, it will be important to place greater emphasis on useof the monthly production projections from the current RD&ES module of CCSS.The activities at both the MSC and the depot require revised (near-term-horizon)forecasts of production needs. In addition, adjustments can also help prevent over-production when demand declines. For example, not only does the depot repair shopneed to know the revised number of units required for the month, it must also berecognized that the IM will often need that output delivered to DLA distributioncenters more frequently than just once at the end of the month. Provisions areneeded to facilitate direct discussion between the IM and the depot scheduling clerkor shop chief to negotiate desires and limitations that will benefit the customer. Ex-isting e-mail and telephone capability could be used.
Third, selective adjustment of safety-stock levels for some DLRs could havean immediate impact on responsiveness (i.e., CWT). It is not initially necessary tochange safety-level policy for Army DLRs. The implementation team need onlyanalyze and determine a level for pilot implementation that recognizes the realitiesassociated with a specific NIIN and then evaluate the impact the stock level has on

74 Improving the Army’s Management of Reparable Spare Parts
customer requirements and the ability of stock to better accommodate demand un-certainty.
Finally, the same analysis that informs the decision on safety stock should pro-duce an initial target for effectively shortening the repair lead time for a given NIIN.There is interaction between operating stock, safety stock, and repair lead times,and thus a coordinated strategy is called for. Moreover, revisions to both parametersshould be possible over time as various activities and conditions improve throughoutthe process. For example, lower repair lead times reduce the need for operating stock;faster repair can substitute for inventory investment.
As progress is made to improve customer support, it will also be important toupdate the data in the CCSS database for the NIIN, so that better revised monthlyforecasts are available to permit informed decisions. While the examples presentedhere have emphasized reducing customer BOs, it is just as important in the long runto prevent unnecessary repairs that place a NIIN in a long supply condition (i.e., theaccumulation of serviceable assets above the desired inventory level). As an example,when programmed changes to fielding densities are not updated in the database, themodel calculus will not properly reflect desired inventory levels.
The approaches recommended here address issues similar to those that shouldbe considered and communicated during a thorough monthly supply-control study.However, our recommendations raise some specific issues and parameters that werenot being considered when we analyzed the M88A1 engine case study: safety stock,lead-time strategies, and direct contact with the source of repair. While this maysound complex and time-consuming when considered for each DLR, the real com-plexity rests in the initial analysis for the NIIN. Once the strategy for that NIIN isdetermined, monthly effort can focus on communication with the depot and data-base-maintenance actions. Mechanisms such as e-mail could be the basis for im-proved communication between IMs and repair supervisors. The key issue here is tomake repair-program execution activities that respond directly to customer demandsthe first priority for those involved. These strategies do not reduce variability in de-mand over the planning horizon. Rather, they mitigate the impact of that variability.
Properly Linking Long-Term Planning and Replanning for Responsive Execution
We recommend properly linking the management of long-term planning and near-term execution:
1. Long-term planninga. Focus on budget and capacity-planning activities.b. Revise the future program basis at least quarterly.
2. Near-term replanninga. Focus on responsive execution and metrics that reflect customer support at
least monthly.

Recommendations for Pilot Implementation 75
b. Take a NIIN-level and customer-needs view.c. Link production output to actual customer demands.d. Decentralize execution decisionmaking.
Long-term planning activities must continue to address the needs of budget de-velopment and capacity planning. These activities deliberately call for long planninghorizons. We are advocating the use of revised forecasts to revise planned PRONsand other actions as new information becomes available. The long-term planningtasks exist to take imperfect predictions of future requirements and plan the best re-sponse possible that can meet those requirements. Therefore, near-term replanningactions are critical.
The emphasis recommended here brings the focus of the IM and the repair de-pot to the daily task of responding to the warfighter’s requirements. CWT should bea key metric. How long the customer waits for the need to be satisfied and the consis-tency of that service level are important. Metrics such as BO rates provide further,deeper insight into causation. However, visibility of customer needs is key to re-sponding effectively. Between the SSF implementation and the improved visibility oftactical customers through the Integrated Logistics Analysis Program (ILAP) and theADM website, the IM has a better view of the requirement and now needs a path toimprovement. The near-term alternatives link repair production to sales and needs byusing the monthly RD&ES output to pull just enough production for the NIIN tomeet and sustain the current demand. As lead time is reduced, the IM will needmechanisms to share sales information even more frequently with the repair shop sothat it can respond effectively. The implementation team will need to revise policiesand procedures that will enable IM and repair personnel to operate promptly at ac-ceptable risk to achieve the desired results. There is clearly an implication that somedecisions will be decentralized or will be permitted outside the current decisionchain.
Procedures and bounds will need to be developed, and some training may berequired. However, a systematized decision structure is envisioned that is still muchmore flexible than the current structure. The key is in the small incremental adjust-ments that would be involved with the shorter decision horizons associated with re-planning. Most IMs already make incremental decisions daily to allocate scarce DLRresources among customers awaiting assets. The decisions envisioned would be nomore complex or risky, but the goal would be to focus the IM’s efforts on maintain-ing defined levels of stock so that the CCSS software logic can handle the DLR allo-cations from the available serviceable inventory. There are still decision constraintsaround PRONs, shop capacity, etc. Within the bounds of those constraints, incre-mental decisions that improve customer support are the objective.
However, effective planning alone does not put serviceable assets on the shelf.The case study showed that improvements are also needed in the repair environment.

76 Improving the Army’s Management of Reparable Spare Parts
Improving Repair Responsiveness
The designated repair activity must have the capability and capacity to respondpromptly if the overall process is to effectively and efficiently meet customer needs.We recommend addressing improvements to repair responsiveness in four ways:
1. Production and scheduling controlsa. Use pull production scheduling.b. Improve controls on WIP.c. Reduce lead time to complete repair of the next asset and continuously re-
duce overall repair flow time.
2. Repair parts availabilitya. Revise current DOS policy to add diversity, depending on different NIIN
characteristics.b. Make demand-based investment decisions.
3. Unserviceables availabilitya. Improve asset turn-in and retrograde.
4. Financial policiesa. Ensure that any carryover workload addresses current customer demands, not
customer BOs.b. Improve economic transparency.c. Evaluate and pilot net and marginal pricing.
The first requirement for success is the ability to accept changes in workload, in-tegrate them into the affected work centers, and ensure that all workload require-ments can continue to be met over time. The long-term planning and PRON ap-proval include coordination with the maintenance depot. In addition, the morefrequent replanning and coordination described above provide a continuing dialogueon the incremental changes to the schedules. Therefore, as long as the depot plan-ning activity and the work-center schedulers and supervisors are kept informed on acontinuing basis, the depot will be aware of the critical constraints and can be proac-tive about developing alternatives to ease the critical constraints in time to accom-modate customer needs.
The alternative we recommend calls for the work-center scheduling clerk andthe repair supervisor to use the revised production requirements from the IM to ad-just the production schedule and repair-parts ordering. The most significant changewould be the shift to a pull schedule, which can reduce lead time, provide flexibilityfor dealing with demand changes, and protect against overproduction when demandslows. A pull schedule is also relatively easy to manage with minimal IT require-ments.

Recommendations for Pilot Implementation 77
Lead-time reduction to improve the responsiveness of the repair activitiesshould deal with time until the completion of the next repair and also reduction ofthe overall repair flow time. The pull scheduling and production-control techniqueswould facilitate these efforts.
The second issue that must be addressed is that of assuring the availability ofsufficient repair parts for every task required in the repair procedure. The pull sched-uling approach provides one option for addressing this issue. Stock should be issuedto repair technicians at their work locations, and “kitting” of parts for NIIN repair ata location should be pursued to the maximum extent possible. In addition, all partsused in support of DLR repair should be ordered as recurring-demand materiel sothat the demand history is provided to the relevant IMs for planning vendor replen-ishment. The ASRS provides critical control and visibility for both new repair partsand serviceable reclaimed material. Provision should exist for the use of a local-purchase credit card for prompt resolution of part shortages for material backorderedfrom the national provider. Such purchases should be only for quantities sufficient tomeet schedules and customer needs (i.e., responsive repair quantities).
After the depot has brought its inventories under better control, better coordi-nation and support for new repair parts from the IMs will be needed in AMC andDLA. The coding of parts as recurring demands is the first important step towardproviding more-accurate information to IMs. That information clarifies the need forcontinuing vendor support. However, the IM for the DLR NIIN also has parts-consumption data about low-usage items that are still necessary for support of theDLR. These data need to be coordinated with the appropriate IMs so they can de-termine inventory and vendor availability. In some cases, the Army may decide tobuy assets for depot shop-stock inventory as insurance for future availability. TheIMs must also be aware of vendor lead times for items to ensure that either vendorrelationships are in place or that procurement actions are taken in time to supportthe repair programs.
The costs associated with low-usage and long-lead-time parts are some of thehighest investment costs to support DLRs (after the cost of the DLR itself). A 60-DOS policy may not be nearly sufficient with respect to such items. On the otherhand, many items used on nearly every repair and ordered frequently as recurringdemand could be stocked at less than 60 DOS. Furthermore, the scheduling initia-tive described above will both reduce WIP and provide shorter repair-cycle times thattogether may permit reductions in future DLR investments.
As the overall reparable process becomes more responsive to the customer, theissue of the availability of unserviceables will become more apparent. The limitedavailability of some DLRs has already increased the need for improved flow throughthe reverse logistics pipeline for the retrograde of these unserviceable assets. However,for some DLRs for older current systems, “excess” unserviceable carcasses are themost efficient source of critical repair parts. Furthermore, the importance of an effi-

78 Improving the Army’s Management of Reparable Spare Parts
cient reverse pipeline will grow as the Army’s maintenance transformation to two-level maintenance progresses.
Finally, the financial policies related to reparables need to be aligned withsending signals to customers and all the other participants in the process. Individualsthroughout the Army try to do the right thing. In the absence of full and correct in-formation, they try to act rationally in their local context. The challenge is to recog-nize and acknowledge just how motivated some individuals are and to give them theinformation they need to make logical decisions in the best interest of the Army atlarge, not just the local situation. The current practice for handling carryover work-load is an example of an incentive within the maintenance depot that tends to stretchout repair completions.
Conclusion
The recommendations discussed here comprise a coherent set of interdependent ini-tiatives that should be pursued as a pilot implementation that vertically integrates theIM and the depot-level repair work centers. Specifics will necessarily differ amongDLRs. However, we recommend the immediate undertaking of a pilot implementa-tion to verify concepts, prototype procedures, and develop confidence in expandingthe implementation rapidly within a depot, across depots, and across MSCs.
In the future, demands could eventually decrease because the quality of DLRrepair will improve with common repair standards occurring at fewer locations. Ifdemands decline and repair locations are further consolidated, systemwide cost sav-ings should result. Excess maintenance capacity and the associated resources can bothbe reduced.
As with all process-change efforts, the devil is in the details. That is precisely thestrength of a recommendation for a pilot implementation effort. Experimentation,performance measurement, and analytical feedback for continuous adjustment andimprovement are envisioned. Whether the improvement methodology used is theDMI methodology illustrated in Figure 1.1 or the methodologies incorporated in thelean-manufacturing or six-sigma approaches, these iterative continuous-improvementtechniques will identify the detailed issues that must be resolved. Improvement ac-tions can be initiated before a complete, optimal plan of action is developed.
As the reparable-management process improves, some trends should begin toemerge. The underlying intent of this effort is to provide significantly more-responsive service to the ultimate customer. The application of lean-thinking con-cepts to processes normally provides dramatic improvements in both throughput ef-fectiveness and efficiency. The expectation is that excess repair capacity will be elimi-nated while responsiveness to customer demands improves. The greater use of depotcapacity should help with fixed-cost absorption at those locations. A single standard

Recommendations for Pilot Implementation 79
of DLR repair under the NMWR approach could assure improved performance andimproved overall MTBF even before basic reengineering of component reliability isaddressed. Together, the efficiency improvements should result in cost reductionsthroughout the Army.


81
Bibliography1
Abell, J. B., G. M. Carter, K. E. Isaacson, and T. F. Lippiatt, Estimating Requirements forAircraft Recoverable Spares and Depot Repair, Santa Monica, CA: RAND Corporation,R-4210-AF, 1993.
Air Force Materiel Command Instruction 21-129, “Depot Maintenance Management,Depot Repair Enhancement Process (DREP),” Headquarters, Air Force Materiel Com-mand, Department of the Air Force, Wright-Patterson Air Force Base, Ohio, March 9,2001.
American Management Association, Blueprints for Service Quality: The Federal ExpressApproach, 3d ed., New York: AMA Publications, 1997.
American Production and Inventory Control Society, Remanufacturing Seminar, Salt LakeCity, Utah, September 1992.
Army Regulation 750-1, “Army Materiel Maintenance Policy and Retail MaintenanceOperations,” Headquarters, Department of the Army, Washington, DC, July 1, 1996.
Baldwin, Laura, and Glenn Gotz, Transfer Pricing for Air Force Depot-Level Reparables, SantaMonica, CA: RAND Corporation, MR-808-AF, 1998.
Blackburn, J. D., Time-Based Competition: The Next Battle in American Manufacturing,Homewood, IL: Irwin Business One, 1991.
Brauner, Marygail K., J. Bondanella, et al., ISM-X: Evaluation and Policy Implications, SantaMonica, CA: RAND Corporation, MR-829-A, 1997.
Brauner, Marygail K., Ellen M. Pint, John R. Bondanella, Daniel A. Relles, Paul Steinberg,and Rick Eden, Evaluating Five Proposed Price and Credit Policies for the Army, SantaMonica, CA: RAND Corporation, DB-291-A, 2000.
Brauner, Marygail K., Ellen M. Pint, Daniel A. Relles, and Paul Steinberg, Dollars and Sense:A Process Improvement Approach to Logistics Financial Management, Santa Monica, CA:RAND Corporation, MR-1131-A, 2000.
____________1 Most RAND documents are available at http://www.rand.org.

82 Improving the Army’s Management of Reparable Spare Parts
Byrne, P. M., and W. J. Markham, Improving Quality and Productivity in the Logistics Process:Achieving Customer Satisfaction Breakthroughs, Oak Brook, IL: Council of Logistics Man-agement, 1991.
Cohen, I. K., John B. Abell, and T. Lippiatt, Coupling Logistics to Operations to Meet Un-certainty and the Threat (CLOUT): An Overview, Santa Monica, CA: RAND Corpora-tion, R-3979-AF, 1991.
Cohen, I. K., David Kassing, J. Bondanella, and James R. Chiesa, Issues in Materiel Distribu-tion: A Background Note, Santa Monica, CA: RAND Corporation, N-2791-P&L, 1989.
Crawford, G. B., Variability in the Demands for Aircraft Spare Parts: Its Magnitude and Impli-cations, Santa Monica, CA: RAND Corporation, R-3318-AF, 1988.
CWT and RWT Metrics Measure the Performance of the Army’s Logistics Chain for Spare Parts,Santa Monica, CA: RAND Corporation, RB-3035-A, 2003.
Define, Measure, Improve: The Change Methodology That Has Propelled the Army’s SuccessfulVelocity Management Initiative, Santa Monica, CA: RAND Corporation, RB-3020, 2000.
Delurgio, S., Forecasting Principles and Applications, Burr Ridge, IL: Irwin/McGraw-Hill,1998.
Department of Defense, Financial Management Regulation, DoD 7000.14-R, Washington,DC.
Department of Defense, Secondary Item Stratification Manual, DoD 4110.1-M, Washington,DC, June 1995.
“Depot Maintenance Reengineering,” Air Force Journal of Logistics, Special Features, Vol. 27,No. 1, Spring 2003.
Diener, David, Eric Peltz, Arthur Lackey, Darlene J. Blake, and Karthik Vaidyanathan,Value Recovery from the Reverse Logistics Pipeline , Santa Monica, CA: RAND Corporation,MG-238-A, 2004.
Dougherty, John, Inventory Reduction Report, New York, NY: Institute of Management andAdministration, July 2001.
Drucker, P., “Drucker on Management: A Turnaround Primer,” Wall Street Journal, Febru-ary 1, 1993, p. A14.
Dumond, John, Marygail K. Brauner, Rick Eden, et al., Velocity Management: The BusinessParadigm That Has Transformed U.S. Army Logistics, Santa Monica, CA: RAND Corpora-tion, MR-1108-A, 2001.
Dumond, John, Rick Eden, and John R. Folkeson, Velocity Management: An Approach forImproving the Responsiveness and Efficiency of Army Logistics Processes, Santa Monica, CA:RAND Corporation, DB-126-1-1, 1995.
Eden, Rick, et al., “Reinventing the DoD Logistics System to Support Military Operationsin the Post-Cold War Era,” in Paul K. Davis (ed.), New Challenges for Defense Planning:Rethinking How Much Is Enough, Santa Monica, CA: RAND Corporation, 1994, pp.699–725.

Bibliography 83
Edwards, T. J., and R. Eden, “Velocity Management and the Revolution in Military Logis-tics,” Army Logistician, Vol. 31, Issue 1, January–February 1999, pp. 52–57.
Frangos, S. J., and S. J. Bennett, Team Zebra, Essex Junction, VT: Oliver Wright Publica-tions, Inc., 1993.
GAO, Air Force Depot Maintenance: Budget Difficulties and Operational Inefficiencies,NSIAD-00-185, Washington, DC, August 15, 2000.
GAO, Army Inventory: Growth in Inventories That Exceed Requirements, NSIAD-90-68,Washington, DC, March 1990a.
GAO, Army Inventory: Parts Shortages Are Impacting Operations and Maintenance Effective-ness, NSIAD-01-772, Washington, DC, July 2001a.
GAO, Army Maintenance: Clearer Guidance Needed to Ensure Programs Reflect CurrentRequirements, NSIAD-90-229, Washington, DC, August 13, 1990b.
GAO, Commercial Practices: DoD Could Save Millions by Reducing Maintenance and RepairInventories, NSIAD-93-155, Washington, DC, June 1993.
GAO, Defense Working Capital Fund: Improvements Needed for Managing the Backlog ofFunded Work, GAO-01-559, Washington, DC, May 30, 2001b.
GAO, Department of Defense: Status of Financial Management Weaknesses and ProgressToward Reform, GAO-03-931T, Washington, DC, June 25, 2003.
GAO, Status of Efforts to Implement Personnel Reductions in the Army Materiel Command,Washington, DC, March 1999.
Georgoff, D. M., and R. G. Murdick, “Managers Guide to Forecasting,” Harvard BusinessReview, January–February 1986.
Gitlow, H. S., and S. J. Gitlow, The Deming Guide to Quality and Competitive Position,Englewood Cliffs, NJ: Prentice-Hall, 1987.
The Global Logistics Research Team, Michigan State University, World Class Logistics: TheChallenge of Managing Continuous Change, Oak Brook, IL: Council of Logistics Manage-ment, 1995.
Goldratt, E. M., It’s Not Luck, Great Barrington, MA: North River Press, 1994.
Goldratt, E. M., Theory of Constraints, New York: North River Press, 1990.
Goldratt, E. M., and J. Cox, The Goal, Croton-on-the-Hudson, NY: North River Press,1984.
Hammer, M., and J. Champy, Reengineering the Corporation, New York: Harper Collins,1993.
Hillier, F. S., and G. J. Lieberman, Introduction to Operations Research, 7th ed., New York:McGraw-Hill, 2001.
Hix, William M., J. Bondanella, Bruce J. Held, et al., Options for Managing the Army’sArsenals and Ammunition Plants, Santa Monica, CA: RAND Corporation, DB-353-A,2003.

84 Improving the Army’s Management of Reparable Spare Parts
Hix, William M., Ellen M. Pint, J. Bondanella, et al., Rethinking Governance of the Army’sArsenals and Ammunition Plants, Santa Monica, CA: RAND Corporation, MR-1651-A,2003.
Hodges, James S., and Raymond A. Pyles, Onward Through the Fog: Uncertainty and Man-agement Adaptation in Systems Analysis and Design, Santa Monica, CA: RAND Corpora-tion, R-3760, 1990.
Imai, M., Kaizen: The Key to Japan’s Competitive Success, New York: McGraw Hill, 1986.
Johnson, H. T., and R. S. Kaplan, Relevance Lost: The Rise and Fall of Management Account-ing, Boston, MA: Harvard Business School Press, 1987.
Jones, D. T., Lean Thinking: Banish Waste and Create Wealth in Your Corporation, NewYork: Simon and Schuster, 1996.
Juran, J. M., Juran on Planning for Quality, New York: The Free Press, 1988.
Kaplan, R. S., and D. P. Norton, The Balanced Scorecard: Translating Strategy into Action,Boston, MA: Harvard Business School Press, 1996.
Kearns, D. T., and D. A. Nadler, Prophets in the Dark, New York: Harper Collins, 1992.
Keen, P.G.W., The Process Edge: Creating Value Where It Counts, Boston, MA: HarvardBusiness School Press, 1997.
Lepore, D., and O. Cohen, Deming and Goldratt: The Theory of Constraints and the System ofProfound Knowledge, Great Barrington, MA: North River Press, 1999.
Levine, A., and J. Luck, The New Management Paradigm, Santa Monica, CA: RAND,MR-458-AF, 1994.
Makridakis, S., and S. C. Wheelwright, Interactive Forecasting: Univariate and MultivariateMethods, 2nd ed., San Francisco, CA: Holden-Day, 1978.
Mentzer, John T., and Carol C. Bienstock, Sales Forecasting Management: Understanding theTechniques, Systems and Management of the Sales Forecasting Process, Thousand Oaks, CA:Sage Publications, 1998.
Office of Management and Budget, Circular A-34, Department of Defense Directive7200.1, Washington, DC.
Osborne, D., and T. Gaebler, Reinventing Government: How the Entrepreneurial Spirit IsTransforming the Public Sector, Reading, MA: Addison-Wesley Publishing Co., Inc., 1992.
Pagonis, W. G., with J. L. Cruikshank, Moving Mountains: Lessons in Leadership and Logisticsfrom the Gulf War, Cambridge, MA: Harvard University Press, 1992.
Peltz, Eric, Marc L. Robbins, Patricia Boren, and Melvin Wolff, Diagnosing the Army’sEquipment Readiness: The Equipment Downtime Analyzer, Santa Monica, CA: RANDCorporation, MR-1481-A, 2002.
Pint, Ellen M., Marygail K. Brauner, J. Bondanella, Daniel A. Relles, and Paul Steinberg,Right Price, Fair Credit: Criteria to Improve Financial Incentives for Army Logistics Deci-sions, Santa Monica, CA: RAND Corporation, MR-1150-A, 2002.

Bibliography 85
Pyzdek, T., The Complete Guide to Six Sigma, Tucson, AZ: QA Publishing, 1999.
Ried, P. C., Well Made in America: Lessons from Harley-Davidson on Being the Best, NewYork: McGraw-Hill, 1989.
Senge, Peter, The Fifth Discipline: The Art and Practice of the Learning Organization, NewYork: Currency Doubleday, 1990.
Sephehri, M., Just-in-Time, Not Just in Japan, Case Studies of American Pioneers in JIT Im-plementation, Falls Church, VA: American Production and Inventory Control Society,Inc., 1986.
Sherbrooke, C. C., Optimal Inventory Modeling Systems: Multi-Echelon Techniques, NewYork: Wiley, 1992.
Speeding the Flow: How the Army Cut Order-and-Ship Time, Santa Monica, CA: RANDCorporation, RB-3006, 1998.
Stalk, G., Jr., and T. M. Hout, Competing Against Time: How Time Based Competition IsReshaping Global Markets, The Free Press, 1990.
Stevenson, W. J., Operations Management, 7th ed., New York: McGraw-Hill Companies,Inc., 2002.
Thor, C. G., “The Evolution of Performance Measurement in Government,” Journal of CostManagement, May/June 2000, pp. 18–26.
Tsai, Michael J., and Peter Evanovich, Evaluating the Use of Contractors for InstallationSupport Using Service Based Cost Data, Alexandria, VA: Institute for Defense Analyses,1999.
Wang, M.Y.D., Accelerated Logistics: Streamlining the Army’s Supply Chain, Santa Monica,CA: RAND Corporation, MR-1140-A, 2000.
Womack, J. P., et al., The Machine That Changed the World, New York: Harper Perennial,1991.
Womack, J. P., and D. T. Jones, Lean Thinking: Banish Waste and Create Wealth in YourCorporation, New York: Simon and Schuster, 1996.