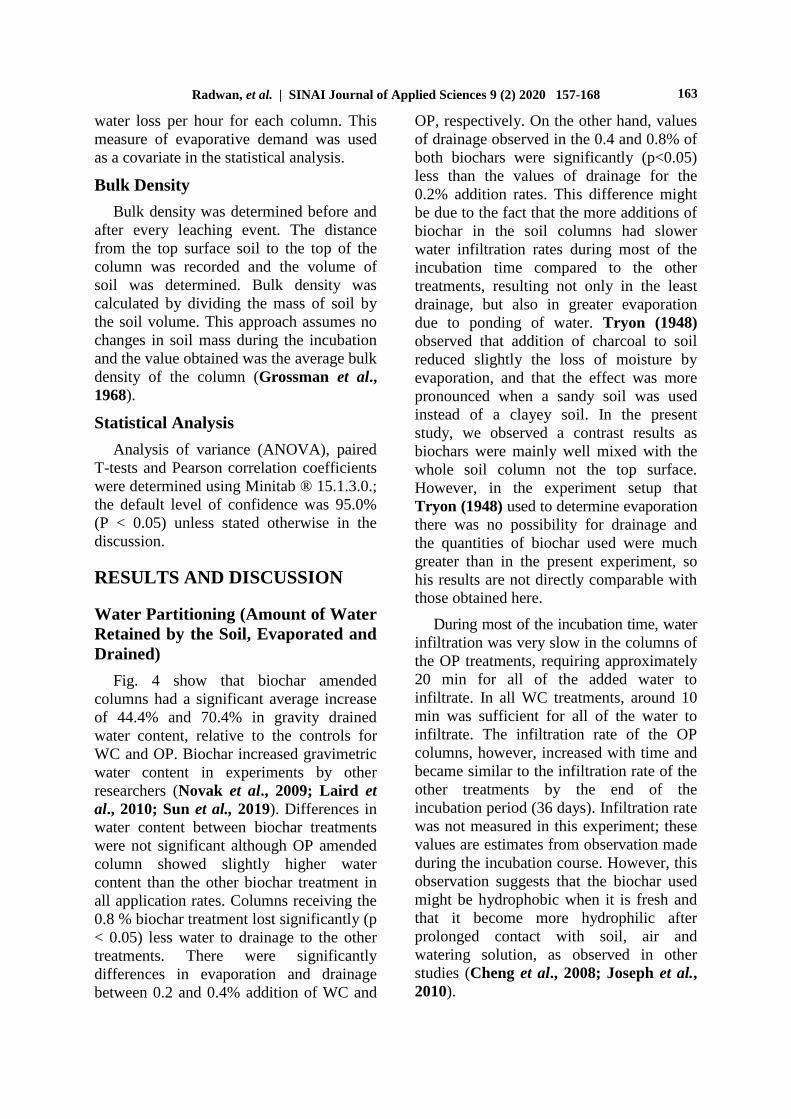
Biochar and biochar-compost as soil amendments: Effects on ...
SINAI Journal of Applied Sciences 9 (2) 2020 157-168
ـــــــــــــــــــــــــــــــــــــــــــــــــــــــــــــــــــــــ
* Corresponding author: E-mail address: [email protected]
https://doi.org/10.21608/SINJAS.2020.86405
© 2020 SINAI Journal of Applied Sciences. Published by Fac. Environ. Agric. Sci., Arish Univ. All rights reserved.
IMPROVING SANDY SOIL PROPERTIES BY USING BIOCHAR
Nedaa M. Radwan1; Ezzat R. Marzouk
2; Atif M. El-Melegy
1; Mostafa A. Hassan
2
1. Inst. Res. Soil and water, Minist. Agric. and Land Reclam., Egypt.
2. Dept. Soil and water, Fac. Environ, Agric. Sci., Arish Univ., Egypt.
ARTICLE INFO
ABSTRACT
Article history:
Received: 01/03/2020
Revised: 31/03/2020
Accepted: 02/05/2020
Available online: 02/05/2020
Increasing water-holding capacity of sandy soils will help improve efficiency
of water use in agricultural production. We hypothesized that addition of
biochar will increase the water-holding capacity and decrease drainage of
sandy soil. Biochar used from local plant residuals; olive wastes including
olive pomace (OP) and olive trees wood chops (WC). column experiment had
undertaken at the laboratory of the Faculty of Environmental Agricultural
Sciences, Arish University, Arish City, Egypt, using different rates of OP and
WC. Slow pyrolysis had undertaken on 400oc at 75 min for (OP) and 350
oc at
150min for (WC). Biochar was mixed with soil at (0%, 0.2%, 0.4% and 0.8%
W/W) and placed into columns. Biochar amended columns had a significant
average increase of 44.4% and 70.4% in gravity drained water content,
relative to the controls for WC and OP. Columns receiving the 0.8% biochar
treatment lost significantly less water to drainage comparably with the other
treatments. There were significantly differences in evaporation and drainage
between 0.2 and 0.4% addition of WC350 and OP400, respectively. On the
other hand, values of drainage observed in the 0.4 and 0.8% of both biochars
were significantly less than the values of drainage for the 0.2% addition rates.
Bulk density of the control columns increased significantly during the
incubation from 1.42 to 1.47 g cm-3
for incubation day 0 and 36, respectively.
On incubation day 36, significant lower bulk densities of 8.82, 10.6, 3.11,
85.1, 5.45, and 8.56% for OP400-0.2%, OP400-0.4%, OP400-0.8%, WC350-
0.2%, WC350-0.4%, and WC350-0.8% treatments we observed, respectively,
relative to controls. The results suggest that biochar added to sandy soil
increases water-holding capacity, decrease drainage of sandy soil and might
increase water available for crop use.
Keywords:
Biochar,
sandy soil,
drainage,
bulk density,
water holding capacity.
INTRODUCTION
Soil water movement and storage are
crucial for nutrient delivery and plant
productivity. Agricultural and environmental
applications of biochar to soils have received
increasing attention as a possible means of
improving productivity and sustainability
(Lehmann and Joseph, 2015). Biochar is a
fine-grained, carbon rich product obtained
by heating biomass such as wood, manure,
or leaves in a closed container with a
limited or no supply of oxygen. Amending
soil with biochar is an approach to mitigate
climate changed to improve crop
productivity (Sohi et al. 2009). Once mixed
with soil, Biochar can affect plant growth
by altering soil hydrologic properties and
nutrient availability (Liu et al. 2017).
Biochar is known for its neutral to high
surface area, high water holding capacity,
and high cation exchange capacity (CEC)
(Mukherjee et al., 2011).
Increasing population, economic growth,
and climate change are putting substantial
stress on the world’s water resources.
Biochar has the potential to alter soil
hydrology and to drive shifts in the amount
Available online at www.sinjas.journals.ekb.eg
SINAI Journal of Applied Sciences
Print ISSN 2314-6079
Online ISSN 2682-3527
Check for
updates

Radwan, et al. | SINAI Journal of Applied Sciences 9 (2) 2020 157-168
158
of water stored in soils. Previous studies
concerning the addition of biochar to soil
have shown the potential for increasing soil
water holding capacity (Smith et al., 2016).
The ability of biochar to increase water
holding capacity of soils might have a
positive effect by either reducing the
amount of water used by the agricultural
sector or increasing food production for a
given amount of water (Basso et al., 2013).
Sandy soils generally have low capacity for
retaining water; hence supplement an
irrigation is often needed for agricultural
production on these soils. There are only a
few studies testing the impact of biochar
additions on water retention by sandy soils
(Sohi et al., 2010). Current work assesses
the potential of adding different ratio of
biochar on increasing water holding
capacity and decreasing drainage of sandy
soil by using infiltration soil column
experiment.
MATERIALS AND METHODS
Soil
The soil used in this study was a sandy soil sampled from the surface 20 cm of a field on the research farm, Faculty of Environmental Agricultural Sciences, Arish University, North Sinai, Egypt. Soil sample was air dried, ground with a wooden mallet and passed through a 2 mm sieve and stored in clean dry plastic bags for further use. General soil properties were presented in Table 1. Soil texture was determined using hydrometer methods as described by (McKeague, 1978). The tested soil was sandy in nature with 4.50% and 2.30% clay and 93.2% sand fractions, respectively. Soil pH was determined in soil: water suspensions (1:2.5 ratio) using a pH meter and combined glass electrode (Ag/AgCl) (Model pH 209, HANNA Instruments, Bedford, UK). Electric conductivity (EC) was measured in 1:5 soil: water suspension using a Conductivity meter (Model HI 9033 Multi-range, Hanna instruments, Bedford,
UK). Total soil carbonate content was measured using the Collins' Calcimeter method (Piper, 1954). Briefly, 1 g dried soil (< 2 mm size) interacted with 2 ml of 6 M HCl in a sealed connected vail to the instrument. After a set reaction time, CO2 was measured to calculate CaCO3%. The instrument was calibrated using pure reagent grade CaCO3. Soil organic carbon (SOC) concentrations were determined in HCl treated samples using a CNS Analyzer (FlashEA® 1112) following standard methods as described by Mahayni (2012). Multi-element analysis was undertaken by ICP-MS (Model X-Series
II, Thermo-Fisher
Scientific, Bremen, Germany).
Biochar
Two types of biochars were used in soil column experiment. Olive pomace (OP) samples were collected from an extra-virgin olive oil extractor located in the Faculty of Environmental Agricultural Sciences, Arish University, Arish City and the Wood branches (WC) were collected from olive trees grown in Experimental Farm of the Faculty of Environmental Agricultural Sciences, Arish University, Arish city. A known quantity of dried material of olive wood chops (WC) and olive pomace (OP) wastes were taken in closed perforated crucible and heated in muffle furnace (Sadaka et al., 2014), (OP) on 400
oC/75
min and (WC) on 350oC/150 min slow
pyrolysis.
Biochar Characteristics
Characteristics of the biochar are
provided in Tables 2 and 3.
Yield
After the pyrolysis process, the biochar
yield was recorded. Biochar yield was
calculated using the following equation:
Mass yield (%) = (Wf / W0) × 100
Where:
Wf is the dry mass (g) of the produced
biochar and W0 is the dry mass (g) of the
precursors (Vijayanand et al., 2016).

Radwan, et al. | SINAI Journal of Applied Sciences 9 (2) 2020 157-168
159
Table 1. Tested Soil chemical characterization
Parameter Value
PH 7.66
EC dSm-1
0.30
CaCO3 (%) 0.05
Organic matter (%) 0.01
Total element concentrations mg kg-1
Na 3134
Mg 2502
K 4410
Mn 140
Fe 6106
Particle size distributions (%)
Sand 93.2
Silt 2.30
Clay 4.50
Soil Texture Sand
Table 2. Total elemental and phenol concentrations in Biochar from OP and WC
synthesized by different pyrolysis time and temperature
Element OP at 400 °C and 75 min WC at 350 °C and 150 min
C (%) 73.20 74.50
H (%) 3.01 3.01
N (%) 0.30 0.20
Molar ratio
H:C
C: N
0.490
285.0
0.481
434
Fe (mg kg-1
) 317.0 166
Mn (mg kg-1
) 13.3 18.3
Ca (%) 1.31 1.51
Mg (%) 0.106 0.244
Na (%) 0.100 0.14
K (%) 0.900 0.14
T. Phenol (%) 0.32 (0.61)* n.a
*Value in parenthesis is the concentration of total phenol in OP raw materials

Radwan, et al. | SINAI Journal of Applied Sciences 9 (2) 2020 157-168
160
Table 3. Summary of physicochemical analysis of Biochar from OP and WC synthesized
by different pyrolysis time and temperature
Parameter OP at 400 °C and 75 min WC at 350 °C and 150 min
Pore number per unit area 39400 21500
Pore diameter nm 66.3 55.9
pH 8.09 7.49
EC dSm-1
0.145 0.245
ORP mV 115 70.0
Biochar yield (%) 42.7 41.2
OM (%) 46.0 40.6
SOM (%) 49.8 55.3
SOMYI 2130 2280
Moisture content
Cleaned oven-dried porcelain crucibles
were weighed and added to each
approximately 1 g and weighed to the
nearest 0.1 mg of the ground WC and OP.
The samples were placed in the oven at
105°C for 120 minutes, dried in a
desiccator for an hour and the crucible was
weighed. Percent moisture in the sample
was calculated according to: Moisture (%)=
[(A-B)/A] x 100
Where:
A= Grams of the air-dry sample used, B=
Grams of the sample after drying at 105°C
(Vijayanand et al., 2016).
Organic matter, stable organic matter,
and indexed organic matter
The manufactured biochar was
characterized for oxidizable organic carbon
(OC) content by the potassium dichromate
oxidation method using methods described
by the Black and Weekly method modified
as described by Sopok (1992). Loss on
ignition (LOI) was determined by ASTM
method D-1762-84. The carbon liability
index was calculated as the OC/LOI ratio.
A comparative measure of stable organic
matter (SOM) was calculated as below
(Thomas et al., 2013):
SOM= LOI - (OC × 1.724)
Where:
1.724 is the factor to convert organic carbon to organic matter.
Stable organic matter yield index (SOMYI) was determined by the following equation: SOMYI= Char yield 100 × SOM
pH, oxidation-reduction potential (ORP) and electrical conductivity (EC)
Sample pH and ORP of biochars were measured according to the procedure described by Ahmedna et al. (2000). A proportion of 1.0% (W/W) water suspension of each type of Biochar was heated to approximately 90°C, and stirred for 20 min. The mixture was allowed to cool to room temperature and the pH and ORP were determined using pH Meter (HANNA Instruments, Ann Arbor Michigan) after initial calibration with standard pH 4 and pH 7 buffers. The EC was determined by stirring a 1.0% (W/W) solution of biochar for 20 min and was measured using a Conductivity meter (HANNA Instruments, Ann Arbor Michigan). All analyses were performed in triplicate.

Radwan, et al. | SINAI Journal of Applied Sciences 9 (2) 2020 157-168
161
Scanning electron microscope (SEM)
The microstructural features of some
biochar samples produced at different
pyrolysis temperatures and times were
investigated by means of scanning electron
microscopy (SEM; Quanta 450 FEG-
ESEM, FEI Company) as shown in Fig. 1.
Pore number and size per area unit
The SEM images were imported into
ImageJ software to analyze them in order to
find out the number and size of samples’
pores and the average pore diameter.
BET surface area
The surface area was determined using
dry biochar samples via N2 adsorption at 77
K on Surface Area Analyzer (Micromeritics
ASAP 2020 BET).
Zeta potential
Zeta potential (ZP) was determined for
each sample in duplicate using a Zeta-
Meter 3.0 system (Zeta Meter Inc., VA).
Total phenolic content
Phenolic compounds were determined
using the Folin–Ciocalteu method
(Singleton et al., 1965).
Available elements
Available (Fe, Mn, Ca, Mg, Na and k)
were extracted according to the method
of Soltanpour (1991) by mixture
solution of ammonium bicarbonate and
diethylenetriamine pentaacetic acid 97%
(AB-DTPA) with adjusting pH at 7.6; 20 g
of biochar sample was shaken with 40 ml
from the mixture solution to 15 minutes
before being filtered through filter paper.
Incubation
The soil incubation was carried out in
PVC columns of 29 cm height and 6 cm
external diameter. A PVC end cap on the
bottom of each column had a drain hole (3
mm) with an attached tube (4.3 mm) for
collecting water draining out the bottom of
the columns. The total mass of oven dry
soil in each column was 1000 g. There were
four rates of biochar application 0% (control),
0.2%, 0.4% and 0.8% (W/W) for each
feedstock OP and WC. The biochar
completely mixed with soil in all treatments.
The columns were incubated for six leaching
events. Every event lasting for a week. The
24 columns were randomly distributed in
two square tables (Fig. 2). Every seven days
150 mL of 0.001M CaCl2 solution was
added to each column to produce a leaching
event. Dilute CaCl2 was used to reduce soil
dispersion. The solution was introduced on
the top of each column at approximately 4
mlmin-1
, using a dropper system. Fiberglass
filter paper was placed at the soil surface of
each column to help disperse solution drops
as they impacted the soil.
Water Partitioning
Water partitioning was assessed for every
leaching event during the incubation by
measuring the mass of water draining out
the bottom of the column, water retained
within the column, and water evaporated
out the top of the column. The weight of
each column was determined before the
start of a leaching event and the mass of
water retained within the column was
determined by subtracting the initial dry
column weight. Drainage was collected for
approximately 24 hr., after the beginning of
the leaching event in plastic bottles placed
below each column and connected with the
drainage tube. The collection bottles had a
cap with a small hole that allowed the drain
tube to be fitted into the bottle to minimize
evaporation loss. The weight of each bottle
was subtracted from the weight of the bottle
without solution and weekly drainage was
determined. Evaporation was assessed by
computing the difference between water
added and drainage plus any change in
water content. In order to wet the entire
column and produce leaching, the first
leaching event was made using 300 ml of
solution. The remaining leaching events

Radwan, et al. | SINAI Journal of Applied Sciences 9 (2) 2020 157-168
162
Fig. 1. SEM images for OP pyrolysis at 400°C and for 75 min and WC pyrolysis at
350°C and for 150 min.
Fig. 2. Soil column experiments design incubated for 36 days with different rate of (OP)
and (WC).
were completed using 150 mL of solution.
The amount of water potentially available
for evapotranspiration (ET) was the sum of
water retained in the column and the
amount of water lost to evaporation
between watering events.
Evaporative demand temperature in the
room where the columns were incubated
was kept constant during the incubation.
Nevertheless, there were differences in
temperature across the room and
evaporative demand was also influenced by
proximity to overhead air circulation fans.
In order to take into account these
differences, evaporative demand was
determined. For this, PVC cups were filled
with an equal amount of water and placed
above each column. Several times during
the period of two or three days, the PVC
cups were weighed to determine average
OP at 400 C and 75 min
WC at 350 C and 150 min
Radwan, et al. | SINAI Journal of Applied Sciences 9 (2) 2020 157-168
163
water loss per hour for each column. This
measure of evaporative demand was used
as a covariate in the statistical analysis.
Bulk Density
Bulk density was determined before and
after every leaching event. The distance
from the top surface soil to the top of the
column was recorded and the volume of
soil was determined. Bulk density was
calculated by dividing the mass of soil by
the soil volume. This approach assumes no
changes in soil mass during the incubation
and the value obtained was the average bulk
density of the column (Grossman et al.,
1968).
Statistical Analysis
Analysis of variance (ANOVA), paired
T-tests and Pearson correlation coefficients
were determined using Minitab ® 15.1.3.0.;
the default level of confidence was 95.0%
(P < 0.05) unless stated otherwise in the
discussion.
RESULTS AND DISCUSSION
Water Partitioning (Amount of Water
Retained by the Soil, Evaporated and
Drained)
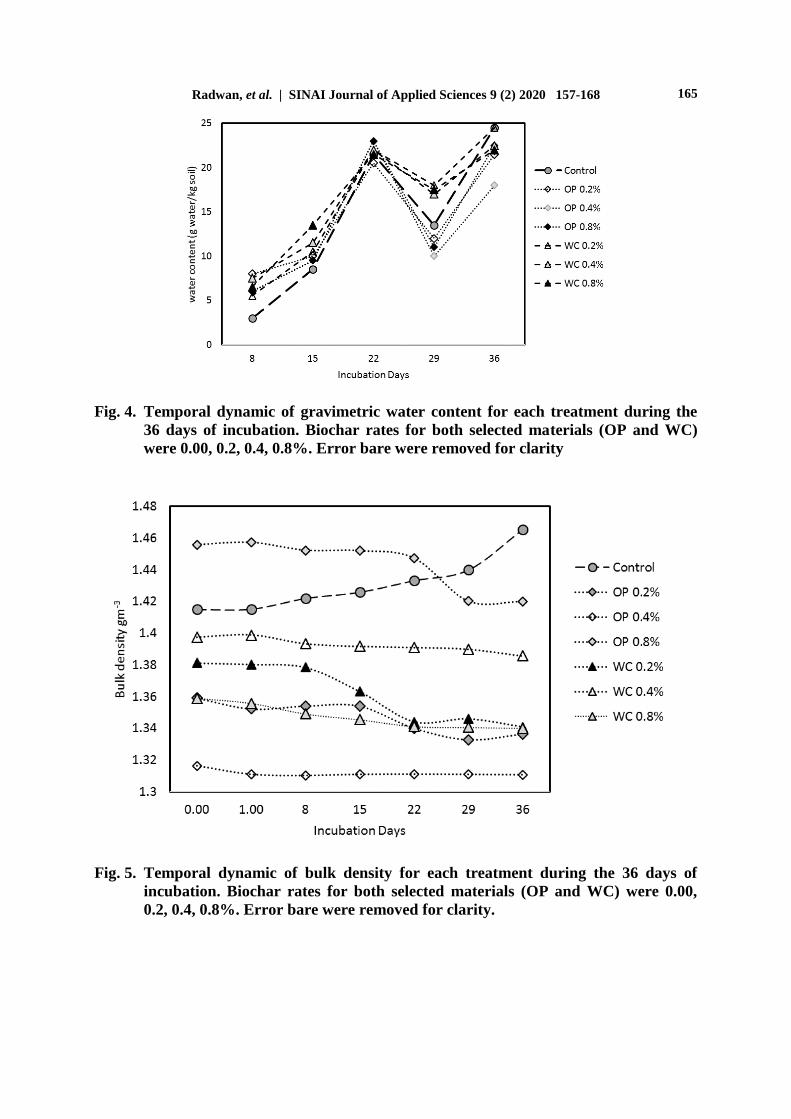
Fig. 4 show that biochar amended
columns had a significant average increase
of 44.4% and 70.4% in gravity drained
water content, relative to the controls for
WC and OP. Biochar increased gravimetric
water content in experiments by other
researchers (Novak et al., 2009; Laird et
al., 2010; Sun et al., 2019). Differences in
water content between biochar treatments
were not significant although OP amended
column showed slightly higher water
content than the other biochar treatment in
all application rates. Columns receiving the
0.8 % biochar treatment lost significantly (p
< 0.05) less water to drainage to the other
treatments. There were significantly
differences in evaporation and drainage
between 0.2 and 0.4% addition of WC and
OP, respectively. On the other hand, values
of drainage observed in the 0.4 and 0.8% of
both biochars were significantly (p<0.05)
less than the values of drainage for the
0.2% addition rates. This difference might
be due to the fact that the more additions of
biochar in the soil columns had slower
water infiltration rates during most of the
incubation time compared to the other
treatments, resulting not only in the least
drainage, but also in greater evaporation
due to ponding of water. Tryon (1948)
observed that addition of charcoal to soil
reduced slightly the loss of moisture by
evaporation, and that the effect was more
pronounced when a sandy soil was used
instead of a clayey soil. In the present
study, we observed a contrast results as
biochars were mainly well mixed with the
whole soil column not the top surface.
However, in the experiment setup that
Tryon (1948) used to determine evaporation
there was no possibility for drainage and
the quantities of biochar used were much
greater than in the present experiment, so
his results are not directly comparable with
those obtained here.
During most of the incubation time, water
infiltration was very slow in the columns of
the OP treatments, requiring approximately
20 min for all of the added water to
infiltrate. In all WC treatments, around 10
min was sufficient for all of the water to
infiltrate. The infiltration rate of the OP
columns, however, increased with time and
became similar to the infiltration rate of the
other treatments by the end of the
incubation period (36 days). Infiltration rate
was not measured in this experiment; these
values are estimates from observation made
during the incubation course. However, this
observation suggests that the biochar used
might be hydrophobic when it is fresh and
that it become more hydrophilic after
prolonged contact with soil, air and
watering solution, as observed in other
studies (Cheng et al., 2008; Joseph et al.,
2010).

Radwan, et al. | SINAI Journal of Applied Sciences 9 (2) 2020 157-168
164
Fig. 3. Water partitioning for each treatment averaged across 36 days of incubation.
Biochar rates for both selected materials (OP and WC) were 0.00, 0.2, 0.4, 0.8%
Soil water content of columns treated
with biochar were relatively constant during
the incubation period while the water
content of the control slowly increased
during the incubation from day 7 to 36 (Fig.
4), probably due to the decrease in soil bulk
density observed for the control columns
(Fig. 5).
The same as control, all other treatments
behalf the same trend. In comparing day 29
with other event days, there were significant
decreases in water content for all columns
that received biochar and the control.
Average values of available water for ET
for each treatment at incubation day 36
were 35.0, 35.7, 34.6, 36.3, 39.3, 38.8 and
40.4 g of water per kg of oven-dry soil for
the control, OP 0.2%, OP 0.4%, OP 0.8%,
WC 0.2%, WC 0.4%, and WC0.8% treatment,
respectively. These values represent a
significant increase in available water for
ET for the biochar treatment with high rate
of additions of WC relative to OP treatments.
Determine Changes in Bulk Density
after Biochar Addition to the Soil
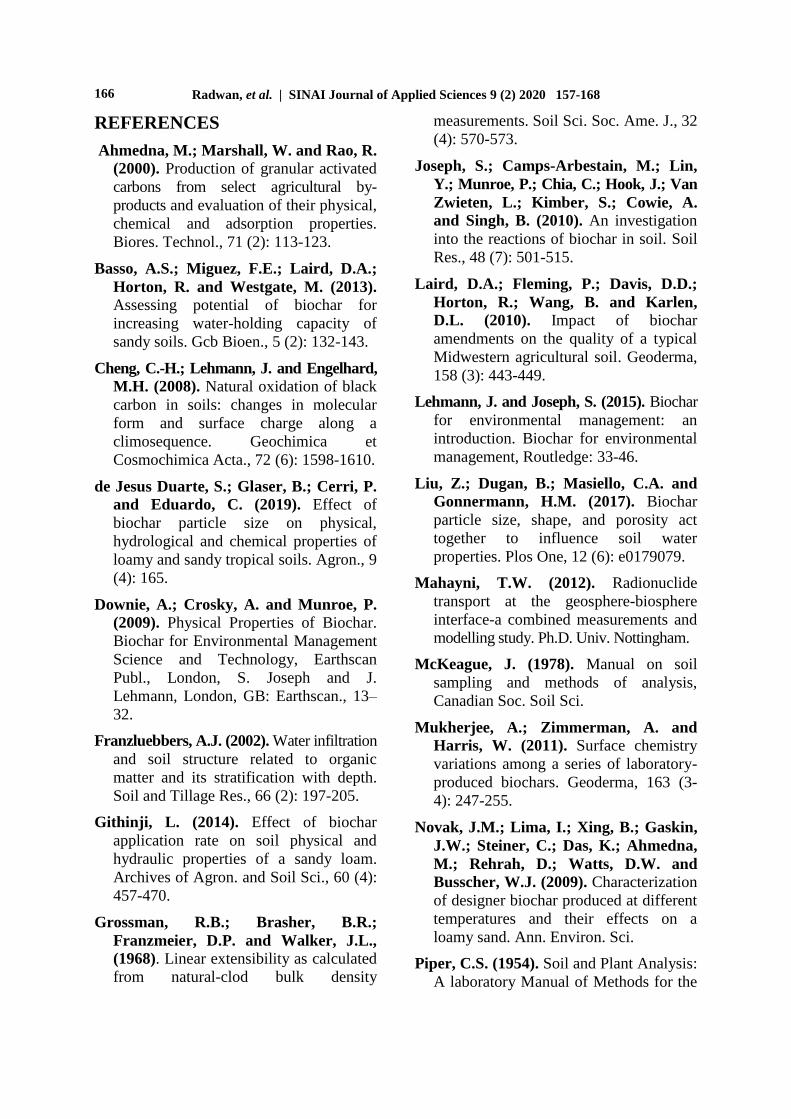
Bulk density of the control columns
increased significantly during the incubation
from 1.42 to 1.47 g cm-3
for incubation day
0 and 36, respectively (Fig. 4). On the other
hand, changes in bulk density for the
biochar treatments were not significant
along the incubation period for OP and WC
at 0.4% (Fig. 4). At the end of the incubation,
the average values of bulk density were
1.43 (control), 1.35 (OP 0.2%), 1.31 (OP
0.4%), 1.44 (OP0.8%), 1.36 (WC 0.2%),
1.39 (WC 0.4%) and 1.35 (WC 0.8%) gcm-3
.
Other researchers have also found a
decrease in soil bulk density after biochar
additions (Laird et al., 2010; Githinji,
2014; de Jesus Duarte et al., 2019),
probably due to the low bulk density of the
biochar itself (Downie et al., 2009). On
incubation day 36, we observed a significant
(p<0.05) lower bulk densities of 8.82, 10.6,
3.11, 85.1, 5.45, and 8.56% for OP 0.2%,
OP 0.4%, OP 0.8%, WC 0.2%, WC 0.4%,
and WC 0.8% treatments, respectively,
relative to controls. Decrease in bulk
densities may promote plant root elongation
(Voorhees et al., 1975) and root density
(Thompson et al., 1987). In addition,
reduction of bulk density by 12% has been
shown to improve water infiltration by 27%
(Franzluebbers, 2002).
Radwan, et al. | SINAI Journal of Applied Sciences 9 (2) 2020 157-168
165
Fig. 4. Temporal dynamic of gravimetric water content for each treatment during the
36 days of incubation. Biochar rates for both selected materials (OP and WC)
were 0.00, 0.2, 0.4, 0.8%. Error bare were removed for clarity
Fig. 5. Temporal dynamic of bulk density for each treatment during the 36 days of
incubation. Biochar rates for both selected materials (OP and WC) were 0.00,
0.2, 0.4, 0.8%. Error bare were removed for clarity.
Radwan, et al. | SINAI Journal of Applied Sciences 9 (2) 2020 157-168
166
REFERENCES
Ahmedna, M.; Marshall, W. and Rao, R.
(2000). Production of granular activated
carbons from select agricultural by-
products and evaluation of their physical,
chemical and adsorption properties.
Biores. Technol., 71 (2): 113-123.
Basso, A.S.; Miguez, F.E.; Laird, D.A.;
Horton, R. and Westgate, M. (2013). Assessing potential of biochar for
increasing water-holding capacity of
sandy soils. Gcb Bioen., 5 (2): 132-143.
Cheng, C.-H.; Lehmann, J. and Engelhard,
M.H. (2008). Natural oxidation of black
carbon in soils: changes in molecular
form and surface charge along a
climosequence. Geochimica et
Cosmochimica Acta., 72 (6): 1598-1610.
de Jesus Duarte, S.; Glaser, B.; Cerri, P.
and Eduardo, C. (2019). Effect of
biochar particle size on physical,
hydrological and chemical properties of
loamy and sandy tropical soils. Agron., 9
(4): 165.
Downie, A.; Crosky, A. and Munroe, P.
(2009). Physical Properties of Biochar.
Biochar for Environmental Management
Science and Technology, Earthscan
Publ., London, S. Joseph and J.
Lehmann, London, GB: Earthscan., 13–
32.
Franzluebbers, A.J. (2002). Water infiltration
and soil structure related to organic
matter and its stratification with depth.
Soil and Tillage Res., 66 (2): 197-205.
Githinji, L. (2014). Effect of biochar
application rate on soil physical and
hydraulic properties of a sandy loam.
Archives of Agron. and Soil Sci., 60 (4):
457-470.
Grossman, R.B.; Brasher, B.R.;
Franzmeier, D.P. and Walker, J.L.,
(1968). Linear extensibility as calculated
from natural-clod bulk density
measurements. Soil Sci. Soc. Ame. J., 32
(4): 570-573.
Joseph, S.; Camps-Arbestain, M.; Lin,
Y.; Munroe, P.; Chia, C.; Hook, J.; Van
Zwieten, L.; Kimber, S.; Cowie, A.
and Singh, B. (2010). An investigation
into the reactions of biochar in soil. Soil
Res., 48 (7): 501-515.
Laird, D.A.; Fleming, P.; Davis, D.D.;
Horton, R.; Wang, B. and Karlen,
D.L. (2010). Impact of biochar
amendments on the quality of a typical
Midwestern agricultural soil. Geoderma,
158 (3): 443-449.
Lehmann, J. and Joseph, S. (2015). Biochar
for environmental management: an
introduction. Biochar for environmental
management, Routledge: 33-46.
Liu, Z.; Dugan, B.; Masiello, C.A. and
Gonnermann, H.M. (2017). Biochar
particle size, shape, and porosity act
together to influence soil water
properties. Plos One, 12 (6): e0179079.
Mahayni, T.W. (2012). Radionuclide
transport at the geosphere-biosphere
interface-a combined measurements and
modelling study. Ph.D. Univ. Nottingham.
McKeague, J. (1978). Manual on soil
sampling and methods of analysis,
Canadian Soc. Soil Sci.
Mukherjee, A.; Zimmerman, A. and
Harris, W. (2011). Surface chemistry
variations among a series of laboratory-
produced biochars. Geoderma, 163 (3-
4): 247-255.
Novak, J.M.; Lima, I.; Xing, B.; Gaskin,
J.W.; Steiner, C.; Das, K.; Ahmedna,
M.; Rehrah, D.; Watts, D.W. and
Busscher, W.J. (2009). Characterization
of designer biochar produced at different
temperatures and their effects on a
loamy sand. Ann. Environ. Sci.
Piper, C.S. (1954). Soil and Plant Analysis:
A laboratory Manual of Methods for the

Radwan, et al. | SINAI Journal of Applied Sciences 9 (2) 2020 157-168
167
Examination of Soils and the
Determination of the Inorganic
Constituents of Plants, Int. Sci. Publisher
Inc., New York.
Sadaka, S.; Sharara, M.; Ashworth, A.;
Keyser, P.; Allen, F. and Wright, A.
(2014). Characterization of biochar from
switchgrass carbonization. Energies, 7
(2): 548-567.
Smith, P.; House, J.I.; Bustamante, M.;
Sobocká, J.; Harper, R.; Pan, G.;
West, P.C.; Clark, J.M.; Adhya, T.
and Rumpel, C. (2016). Global change
pressures on soils from land use and
management. Global Change Biol., 22
(3): 1008-1028.
Sohi, S.P.; Krull, E.; Lopez-Capel, E. and
Bol, R. (2010). A review of biochar and
its use and function in soil. Advances in
Agronomy, Elsevier, 105: 47-82.
Sohi, S.; Lopez-Capel, E.; Krull, E. and
Bol, R. (2009). Biochar, climate change
and soil: A review to guide future
research. CSIRO Land and Water Sci.
Rep., 5 (09): 17-31.
Soltanpour, P. (1991). Determination of
nutrient availability and elemental
toxicity by AB-DTPA soil test and ICPS.
Advances in soil science, Springer, 165-
190.
Sopok, S. (1992). Determination of
Copper Cyanide Plating Solutions
and Cadmium in Cadmium Cyanide
Plating Solutions by Atomic
Absorption Spectrometry. Army
Armament Research Development
and Engineering Center Watervliet
Ny Benet Labs.
Sun, J.; Yang, R.; Zhu, J.; Pan, Y.;
Yang, M. and Zhang, Z. (2019). Can
the increase of irrigation frequency
improve the rate of water and salt
migration in biochar-amended saline
soil?" J. Soils and Sediments, 1-10.
Thomas, S.C.; Frye, S.; Gale, N.;
Garmon, M.; Launchbury, R.;
Machado, N.; Melamed, S.; Murray,
J.; Petroff, A. and Winsborough, C.
(2013). Biochar mitigates negative
effects of salt additions on two
herbaceous plant species. J. Environ.
Manag., 129: 62-68.
Thompson, P.; Jansen, I. and Hooks, C.
(1987). Penetrometer Resistance and
Bulk Density as Parameters for
Predicting Root System Performance in
Mine Soils 1. Soil Sci. Soc. Ame. J., 51
(5): 1288-1293.
Tryon, E.H. (1948). Effect of charcoal on
certain physical, chemical, and
biological properties of forest soils. Ecol.
Monographs, 18 (1): 81-115.
Vijayanand, C.; Kamaraj, S.;
Sriramajayam, S. and Ramesh, D.
(2016). Biochar production from
arecanut waste. Int. J. Farm Sci., 6 (1):
43-48.
Voorhees, W.; Farrell, D. and Larson,
W. (1975). Soil Strength and Aeration
Effects on Root Elongation 1. Soil Sci.
Soc. Ame. J., 39 (5): 948-953.

Radwan, et al. | SINAI Journal of Applied Sciences 9 (2) 2020 157-168
168
ــــــــــــــــــــــــــــــــــ
المحكمــــــــون:
اعخ، خبعخ اىضقبصيق، صش.، مييخ اىضسالأساضي اىيبأسزبر يــأيمه محمود حلم. أ.د -1
، صش.اىعشيش، خبعخ اىعي اىضساعيخ اىجيئيخمييخ ،الأساضي اىيب اىسبعذأسزبر سعذ القصاصمـذ ـ. محد -2
الملخض العربي
ارــــــــــــــــــــوتشــــذام البيـــــتخـــــاسـة بــــــــــرمليـــة الــــربـــــواص التــــيه خـــــــتحس
2مصطفي علي حسه ،1، عاطف محمد المليجي2عست رشاد مرزوق ،1وداء محمد رضوان
هعهد بحىث الأراضي والويبه والبيئت ببلجيزة، هركز البحىث الزراعيت، هصر. .1
هصر. جبهعت العريش، ،يئيتالأراضي والويبه، كليت العلىم الزراعيت البقسن .2
،الإزبج اىضساعي رحسي مفبءح اسزخذا اىيب فيإ صيبدح قذسح اىزشثخ اىشييخ عي الاحزفبظ ثبىيب سيسبعذ عي
في اىعو اىحبىي ، اسزخذا اىجيرشبس قذ يضيذ قذسح اىزشثخ اىشييخ يسب في رقييو اىصشف اىسشيع ىيزشثخ اىشييخ
( خيفبد رقيي OPيرشبس اىزح ثقبيب اىخيفبد اىحييخ ثو خيفبد اىضيز ثب في رىل رفو اىضيز )اسزخذب اىج
ر عو ردشثخ أعذح ثعو مييخ اىعي اىضساعيخ اىجيئيخ، خبعخ اىعشيش، ذيخ اىعشيش ثبسزخذا ، (WCاىضيز )
٠٤٤شاسح ازبج اىجيرشبس ثبلاحلاه اىجطيء رحذ دسخبد ح (. رOP( )WCعذلاد خزيفخ ىنو عي اىجيرشبس )
دقيقخ. ر خيط 150( ىذح صيخ WCدسخخ ئيخ ثبىسجخ ىـ ) ٠٥٤دقيقخ 75ىذح صيخ (OP)دسخخ ئيخ ثبىسجخ ىـ
بئح رأثيش ضع في أعذح. أغشد اىز [ص/ص %0.8، %0.4، %0.2، %0صفش]اىجيرشبس ثبىزشثخ ثبىست اىزبىيخ
في اىزسط قبسخ %70.4 %44.4مجيش لإضبفخ اىجيرشبس عي الاحزفبظ ثبىشطثخ ضذ اىدزة الأسضي ثسجخ
% اقو 0.8قذ ىحع أ قي صشف اىيب ثبىسجخ ىعذه إضبفخ اىزاىي. عي WC OPثبىعبيخ د إضبفخ ثبىسجخ ىـ
% 0.2ضبفخ الأخش، أيضب مب بك اخزلاف ؤثش ثي عذىي الإضبفخ عذلاد الإثيش قبسخ ثقي اىصشف اىيب ثثن
مو اىجيرشبس %0.8 0.4 بحيخ أخش، مبذ قي اىصشف اىزي ىحػذ في ، عي اىزاىي WC OP% ىـ 0.4
. صادد اىنثبفخ اىػبشيخ لأعذح د إضبفخ ثشنو مجيش أثبء %0.2أقو ثنثيش قي اىصشف ىعذلاد الإضبفخ
خ س 1.47إى 1.42اىزدشثخ -3
، لاحػب اخفبضب 36عي اىزاىي. في ي اىزحضي 36خلاه أيب اىزحضي اىـ
OP0.2% OP0,4%ىيعبلاد %8.56 5.45 85.1 3.11 10.6 8.82مجيشا في اىنثبفخ اىػبشيخ
OP0.8% WC0.2% WC0.4% ،WC0.8% عي اىزاىي، قبسخ ثبىعبيخ د إضبفخ. رشيش اىزبئح إى أ ،
اىجيرشبس اىضبف إى اىزشثخ اىشييخ يضيذ قذسح اىزشثخ ثبلاحزفبظ ثبىيب، يقيو رصشيف اىزشثخ اىشييخ قذ رضيذ
اىيب اىزبحخ لاسزخذا اىحبصيو.
.الاحزفبظ ثبىيب قذسح اىزشثخ عي ،اىنثبفخ اىػبشيخ اىجيرشبس، اىزشثخ اىشييخ، اىصشف،: سترااديةالاالكلمات