
Improving Risk Quality to Drive Value - Oxford...
22
Improving Risk Quality to Drive Value
Transcript of Improving Risk Quality to Drive Value - Oxford...
Improving Risk Quality to Drive Value

Improving Risk Quality to Drive Value
An independent executive briefing commissioned by


Contents
Foreword . . . . . . . . . . . . . . . . . . . . . . . . . . . . . . . . . . . . . . . . . . . . . . . . . . 2
Executive Summary . . . . . . . . . . . . . . . . . . . . . . . . . . . . . . . . . . . . . . . . . . 3
1 A Matter of Governance . . . . . . . . . . . . . . . . . . . . . . . . . . . . . . . . . . . . . 4
2 The Concept of Value . . . . . . . . . . . . . . . . . . . . . . . . . . . . . . . . . . . . . . . 5
3 Defining the Risk and Value Metrics . . . . . . . . . . . . . . . . . . . . . . . . . . . . 7
4 Connecting Risk Quality to Performance. . . . . . . . . . . . . . . . . . . . . . . . 10
5 The Study Portfolio. . . . . . . . . . . . . . . . . . . . . . . . . . . . . . . . . . . . . . . . 12
Appendix . . . . . . . . . . . . . . . . . . . . . . . . . . . . . . . . . . . . . . . . . . . . . . . . . 14
All financial and market data underlying this study are publicly available. The raw data on share prices, market indices, operating cash flow and earnings were obtained from ThomsonFinancial Datastream financial database. The proprietary data on risk quality, as captured byRisk Mark, were obtained directly from FM Global. Whilst every effort has been made to ensurethe accuracy and integrity of these data, Oxford Metrica accepts no liability for any inaccuracies contained herein.

2
ForewordIs the management of risk a cost or an investment? And, if an investment, arecompanies communicating the value of this investment effectively to their shareholders, existing and potential stakeholders, as well as internal audiences?
The findings of this study, Improving Risk Quality to Drive Value, show thatimproving risk quality demonstrates good corporate governance and has clearimplications for shareholder value.
This independent research was carried out by Oxford Metrica, one of themost respected strategic advisory firms in the area of shareholder value. We are pleased that Oxford Metrica chose Risk Mark®—FM Global’s bench-marking system for evaluating a firm’s risk quality—as the data source for itsanalysis. It is the first time that historical data of this kind has been availablefor research.
FM Global has been helping corporations improve their property risks and protect the value created by their businesses for nearly two centuries. We hope this research will spark a more informed discussion about the returns shareholders may expect from a firm’s investment in sound risk management.
Ruud BosmanExecutive Vice PresidentFM Global
3
Executive SummaryThis research provides the first empirical evidence that there is a clear correlation between companies’ risk quality and their financial performance. In the context of this study, risk quality is defined in terms of property riskmanagement. It is driven by the core operational activities of a business, thephysical location of those activities, and how they are managed and protected.The research identifies a strong correlation with value and provides evidencefor what is intuitively understood but, to-date, has not been demonstratedquantitatively.
The research finds that diligently pursuing property risk improvement practices is a characteristic of value-creating firms. Risk quality is demonstratedto be a core component of effective corporate governance policy and valuemanagement.
Key Conclusions
1 A clear, empirical connection was found between risk quality and shareholder value performance.
2 High-quality risk engineering was found to be strongly correlated with low cash flow volatility, a core value driver. Stable cash flow is a strong driver of value creation.
3 Risk quality is a strategic issue and an essential aspect of effective corporate governance procedures.
The study analysed an international portfolio of 438 quoted firms; regionaland sectoral distributions are presented in the Appendix. This represents thefull universe of quoted firms for which both risk quality data and sufficientfinancial data were available. The total market capitalisation of this portfolioon 31 July 2003 was US$3.4 trillion.
First, this briefing presents an explanation of value and identifies the corevalue drivers. Second, the metrics of risk and value to be used in the study are defined. Third, the relationship between risk quality and financial performance is demonstrated and measured. Finally, the study portfolio isanalysed in a broader context to establish the generalisability of results.
There are many well-publicised examples of companies that have suffered significant share value decline due to physical damage and disruption to theirbusiness activities. The premise of this study is that a company need not experience a disruption to its business to demonstrate the value of investing in risk quality.

4
1 A Matter of GovernanceProtecting the assets of a firm and creating shareholder value are integral to good corporate governance. The responsibilities of a firm’s directors and officers particularly are central to the implementation of best governance practice. Regulators around the world also are committed to promoting, and enforcing, robust management systems of internal control.
When asset protection fails, the value impact can be significant. Previousresearch undertaken by Oxford Metrica demonstrates the considerable contribution that effective risk management can make to aid value recoveryfollowing a corporate crisis1. The ability of management, particularly the chiefexecutive officer (CEO), to deal with the unexpected and turn the situationaround, is shown to be more important in driving recovery than, for example,the direct financial consequences of the loss.
Investment in risk management and property loss prevention procedures minimises the probability that a loss incident even occurs or escalates into crisis. Such investment is fundamental to good governance. It is imperativethat managers seek to protect the assets under their care, be they human,physical or intangible. Failure to do so may result in tragedy, at worst, or asudden loss in shareholder value, at best.
Sudden drops in shareholder value tend to be sustained. In a previous study2,Oxford Metrica analysed the largest 100 sudden drops in value (risk-adjustedand relative to the market) experienced by the largest 1,000 firms worldwide(the Global 10003) over a five-year period. The research results demonstratedthat these sudden value shifts tend to be “destiny-determining,” both asregards the future value pattern for the firm and in terms of the direct consequences for the CEO’s tenure.
However, loss prevention and control is not a costless activity. In the contextof scarce resources and budgetary constraints, some challenging investmentdecisions are required from management. All investments should be evaluatedwithin a shareholder value framework. Investment in risk quality is no excep-tion. The research summarised herein attempts to shed some light on thiscomplex, but important, issue.
1 Reputation and Value—the case of corporate catastrophes, by R F Knight & D J Pretty, Oxford Metrica, (2001).
2 Risks That Matter—sudden increases and decreases in shareholder value and the implications for CEOs, commissioned by Ernst & Young, (2002).
3 The Global 1000 portfolio is compiled by Oxford Metrica and includes the largest (by market capitalisation) 1,000 quoted firms worldwide.
5
2 The Concept of ValueIn order to evaluate the risk management investment decision in a shareholdervalue framework, it is necessary first to define what is meant by ‘value’ and to identify its core drivers. This section defines value and decomposes it into its core drivers, describing how quality risk engineering might interact withthese drivers.
Shareholder value relies on formed investor expectations of future financialperformance. These expectations are based on corporate and financial infor-mation made available to investors, and will be revised as new information is received. The prevailing market value of a firm, therefore, is dynamic, forward-looking and expectations-based.
Information asymmetries typically exist between management and share-holders. Managers have easier access to internal operational information, for example. In the context of physical loss control programmes, risk managerswill have insight into the risk quality of their properties, but this informationseldom is passed on to investors. It does not follow that managers inevitablywill reach a fairer view of firm value than investors, however, and the stockmarket, as a whole, will form its own collective opinion. Modern finance theory holds that this convergent consensus reflects an unbiased estimate ofthe present value of the firm’s long-run future cash flow.
The value of a firm, therefore, may be defined simply as the presentvalue of future cash flow from operations.
The Multiplicative Effect on Value
By investing in loss prevention and mitigation techniques, corporate risk managers help to protect and enhance current operational cash flow. This current cash flow generates different multiples of value across firms, based oninvestors’ expectations of future cash flow. By helping to protect these currentflows, risk managers achieve a multiplicative effect on shareholder value.Protecting one dollar of current cash flow translates into the protection ofmultiple dollars of value. The cash flow multiple at which a given firm tradesdetermines the potency of this effect.
6
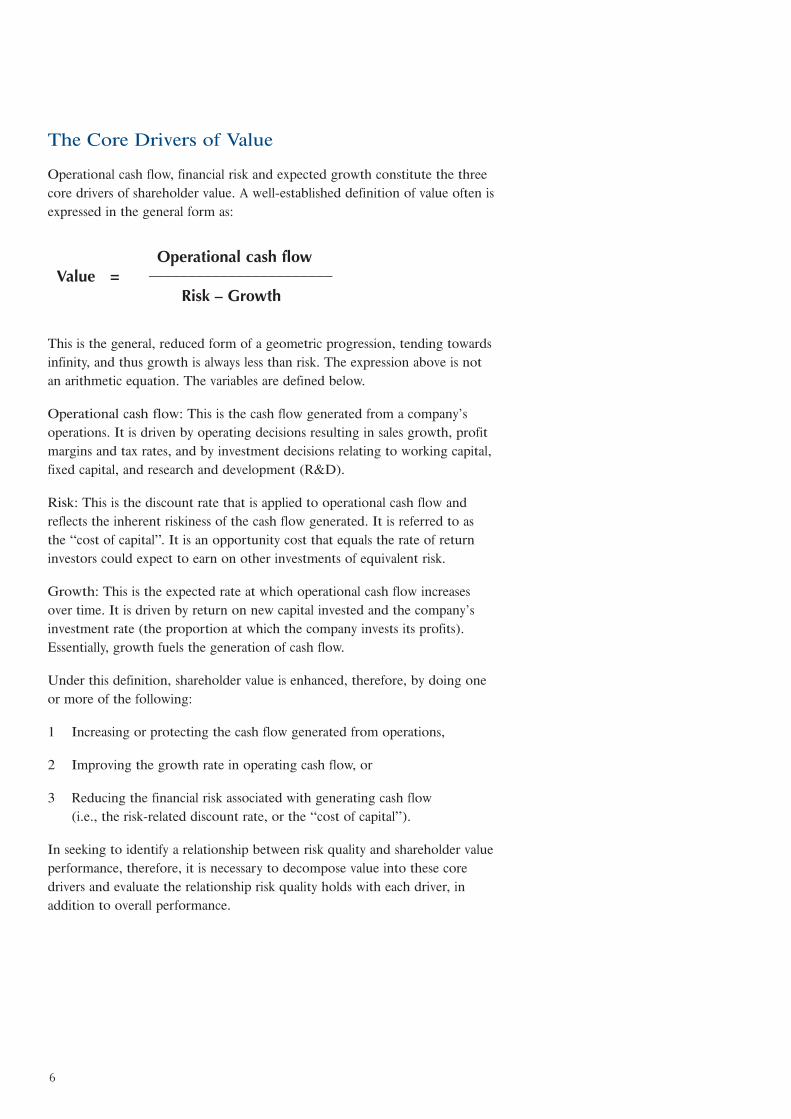
The Core Drivers of Value
Operational cash flow, financial risk and expected growth constitute the threecore drivers of shareholder value. A well-established definition of value often isexpressed in the general form as:
This is the general, reduced form of a geometric progression, tending towardsinfinity, and thus growth is always less than risk. The expression above is notan arithmetic equation. The variables are defined below.
Operational cash flow: This is the cash flow generated from a company’soperations. It is driven by operating decisions resulting in sales growth, profitmargins and tax rates, and by investment decisions relating to working capital,fixed capital, and research and development (R&D).
Risk: This is the discount rate that is applied to operational cash flow andreflects the inherent riskiness of the cash flow generated. It is referred to asthe “cost of capital”. It is an opportunity cost that equals the rate of returninvestors could expect to earn on other investments of equivalent risk.
Growth: This is the expected rate at which operational cash flow increasesover time. It is driven by return on new capital invested and the company’sinvestment rate (the proportion at which the company invests its profits).Essentially, growth fuels the generation of cash flow.
Under this definition, shareholder value is enhanced, therefore, by doing oneor more of the following:
1 Increasing or protecting the cash flow generated from operations,
2 Improving the growth rate in operating cash flow, or
3 Reducing the financial risk associated with generating cash flow(i.e., the risk-related discount rate, or the “cost of capital”).
In seeking to identify a relationship between risk quality and shareholder valueperformance, therefore, it is necessary to decompose value into these coredrivers and evaluate the relationship risk quality holds with each driver, inaddition to overall performance.
Operational cash flowValue = _______________________
Risk – Growth
7
3 Defining the Risk and Value Metrics
This section defines the metrics of risk quality and financial performance analysed.
Defining the Metrics of Risk Quality
Most assessments of quality necessarily involve a subjective element. Toachieve both credibility and analytical viability, it was essential, therefore, toidentify a measurement system of risk quality that met the following criteria:
1 Consistent measurement across firms
2 Quantitative output
3 Independence from financial analysis
4 Driven by extensive experience in risk engineering
5 Application across all industry sectors and regions
6 Availability of data for a large portfolio of firms
A metric that meets all the above criteria is FM Global’s Risk Mark score. This is compiled by the insurer’s engineering force that evaluates more than100,000 locations annually. Whilst no system is perfect, the consistency inapplication, the independence from Oxford Metrica’s analysis and the large sample size, ensures that the results are as credible and robust as practicably possible.
The Risk Mark benchmarking system uses a 100-point scale and evaluatesfirms’ risk quality based on three major causes of physical damage: fire andexplosion, natural hazard and occupancy. These key causes of loss are weighted respectively in 45 per cent, 35 per cent and 20 per cent proportions.In essence, Risk Mark reflects the core activities of a business, how they aremanaged and the physical location of those activities. Each component isdescribed below.
Fire and Explosion – These factors include overall management of loss prevention and loss control, recommended risk improvement measures and the consequently reduced loss expectancies, and the adequacy of sprinkler protection.
Natural Hazard – Half of the natural hazards score is based on whether thelocation is in a recognised wind, earthquake or flood zone, and the other halfis based on natural hazard loss control recommendations and loss expectancies.
Occupancy – Some occupancies (the type of work performed, equipmentused) are more hazardous than others, even when well-protected. The occu-pancy factor reflects this difference, based on losses during a 10-year period.
8
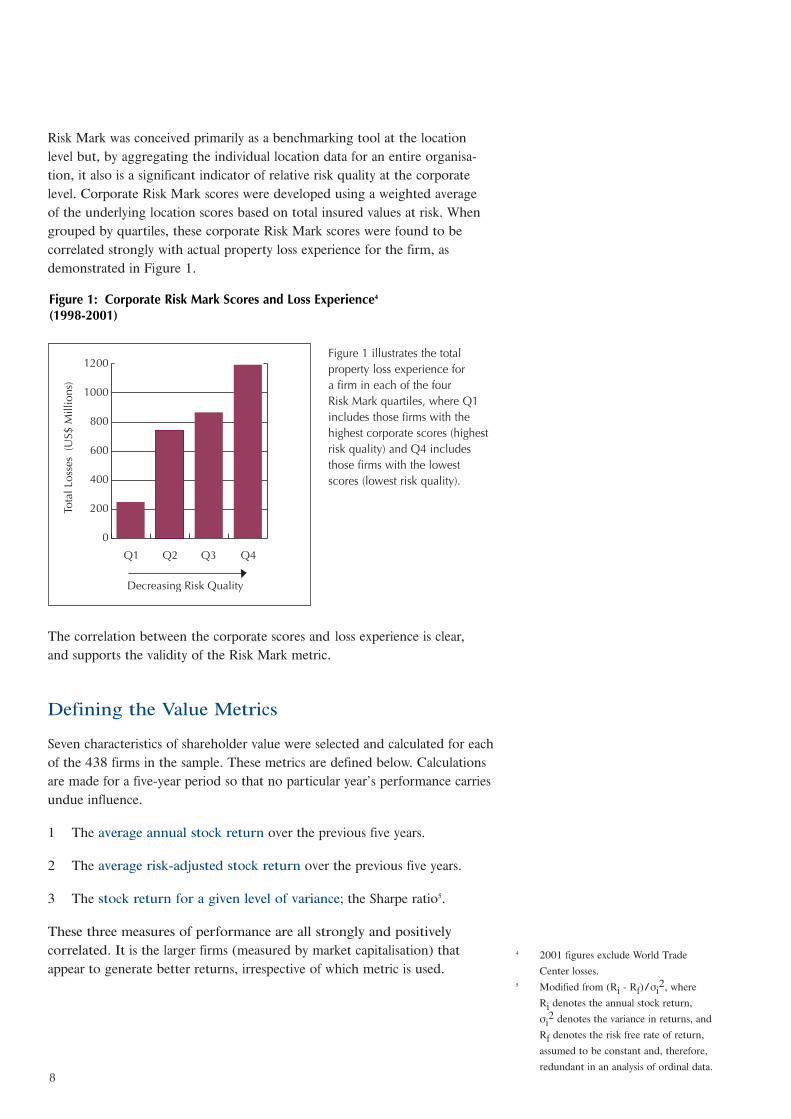
Risk Mark was conceived primarily as a benchmarking tool at the locationlevel but, by aggregating the individual location data for an entire organisa-tion, it also is a significant indicator of relative risk quality at the corporatelevel. Corporate Risk Mark scores were developed using a weighted average of the underlying location scores based on total insured values at risk. Whengrouped by quartiles, these corporate Risk Mark scores were found to be correlated strongly with actual property loss experience for the firm, asdemonstrated in Figure 1.
The correlation between the corporate scores and loss experience is clear, and supports the validity of the Risk Mark metric.
Defining the Value Metrics
Seven characteristics of shareholder value were selected and calculated for eachof the 438 firms in the sample. These metrics are defined below. Calculationsare made for a five-year period so that no particular year’s performance carriesundue influence.
1 The average annual stock return over the previous five years.
2 The average risk-adjusted stock return over the previous five years.
3 The stock return for a given level of variance; the Sharpe ratio5.
These three measures of performance are all strongly and positively correlated. It is the larger firms (measured by market capitalisation) thatappear to generate better returns, irrespective of which metric is used.
Q1 Q2 Q3 Q4
Tota
l Los
ses
(US$
Mill
ions
)
0
200
400
600
800
1000
1200
Decreasing Risk Quality
Figure 1: Corporate Risk Mark Scores and Loss Experience4
(1998-2001)
Figure 1 illustrates the total property loss experience for a firm in each of the four Risk Mark quartiles, where Q1includes those firms with thehighest corporate scores (highestrisk quality) and Q4 includesthose firms with the lowestscores (lowest risk quality).
4 2001 figures exclude World Trade
Center losses.5 Modified from (Ri - Rf)/σi
2, where
Ri denotes the annual stock return,
σi2 denotes the variance in returns, and
Rf denotes the risk free rate of return,
assumed to be constant and, therefore,
redundant in an analysis of ordinal data.
9
Given that the focus of this analysis is on the relationship between Risk Mark—a measure of risk—and performance, the stock returns unadjusted for risk will be used primarily. Otherwise, the risk-adjustment pro-cedure could be removing the associations that the research seeks to capture.
4 The total variance of daily stock returns over the last five years.The variance in stock returns is a measure of risk and is negatively relatedto performance (as shown by the Sharpe ratio).
5 Beta, the sensitivity of the share price to general market movements.
These two measures of financial risk at the market level—stock pricevolatility and beta—are strongly and positively correlated.
6 The variance of annual changes in operating cash flow over the last five years. The variance in cash flow is a core driver of stock price variance and, therefore, is strongly and inversely related to performance. Beta is strongly and positively related to the variance in cash flow, but the statistical significance disappears when the effect of leverage by debt is removed.
7 The variance of annual changes in earnings over the last five years. Earnings volatility also drives the variance in share price and pulls back performance. As with the variance in cash flow, beta is positively related to earnings volatility, but the significance disappears with the effect of leverage.
These two measures of financial risk at the operating level—cash flow and earnings volatility—are strongly and positively correlated.
All the correlations referred to in these descriptions are well-established andwere borne out again during this research6. It follows that risk quality—as captured by the corporate Risk Mark scores—will have a relationship withshareholder value performance if one or more of the following relationshipscan be demonstrated:
• that Risk Mark is positively and significantly related to stock returns.
• that Risk Mark is negatively and significantly related to stock price volatility.
• that Risk Mark is negatively and significantly related to a core driver of stock price volatility, such as the variance in operating cash flow or the variance in annual earnings.
Given that Risk Mark is a measure of risk rather than of performance, it ismore likely that a relationship is discovered with stock price volatility thanwith stock returns directly. It is more likely still that any relationship dis-covered will be at the operating level of the firm, reflected by volatility inearnings and cash flow, before the effects of financing decisions have hadan impact on the stock price.
6 Spearman rank-order correlation
coefficients (Spearman, ρ) were
calculated so as to avoid making
unnecessary assumptions regarding the
underlying distributions of the data.
10
4 Connecting Risk Quality to Performance
Aided by risk and value metrics, it is now possible to evaluate the relationshipbetween risk quality and shareholder value performance. Risk quality is measured using Risk Mark and the resultant relative scores for each of the 438 firms studied were provided directly to Oxford Metrica by FM Global.
Cash Flow Stability—The Missing Link
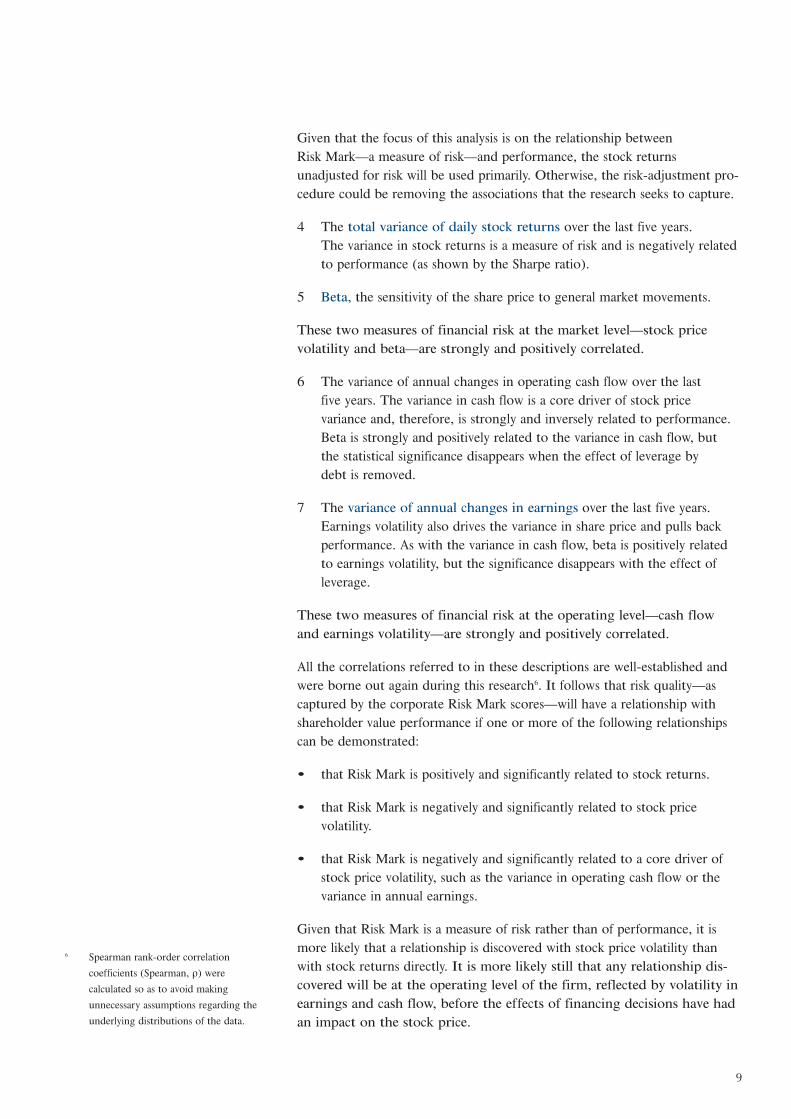
A strong and negative correlation is identified between the corporate Risk Mark score and both the variance in cash flow and the variance in earn-ings. In the case of cash flow volatility, the correlation coefficient is calculatedas -0.152 and is strong at 99 per cent confidence levels. For earnings volatility,the correlation coefficient is -0.1 and is strong at a 95 per cent level of confi-dence. Figure 2 illustrates the pattern of correlation between these variables.
Figure 2: Risk Quality – A Path to Value Creation
Risk quality, therefore, is found to be strongly and negatively correlatedwith the volatility in operating cash flow and in earnings volatility. Asthese two value metrics are the core drivers of the variance in stockreturns, which is negatively correlated with performance, it follows that a high risk quality is strongly associated with positive shareholder valueperformance.
These results support the hypothesis concluding the previous section that,should a relationship be found between engineering risk quality and value, itmost likely would be through a risk measure, and at the operating level.
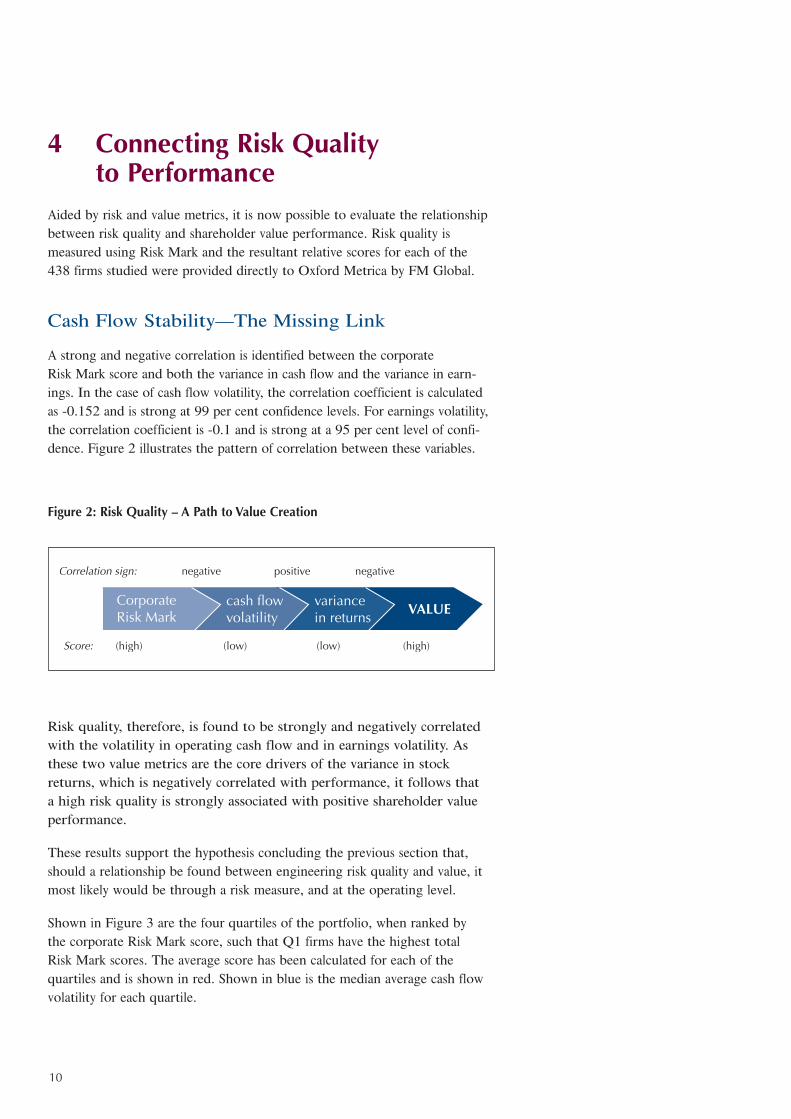
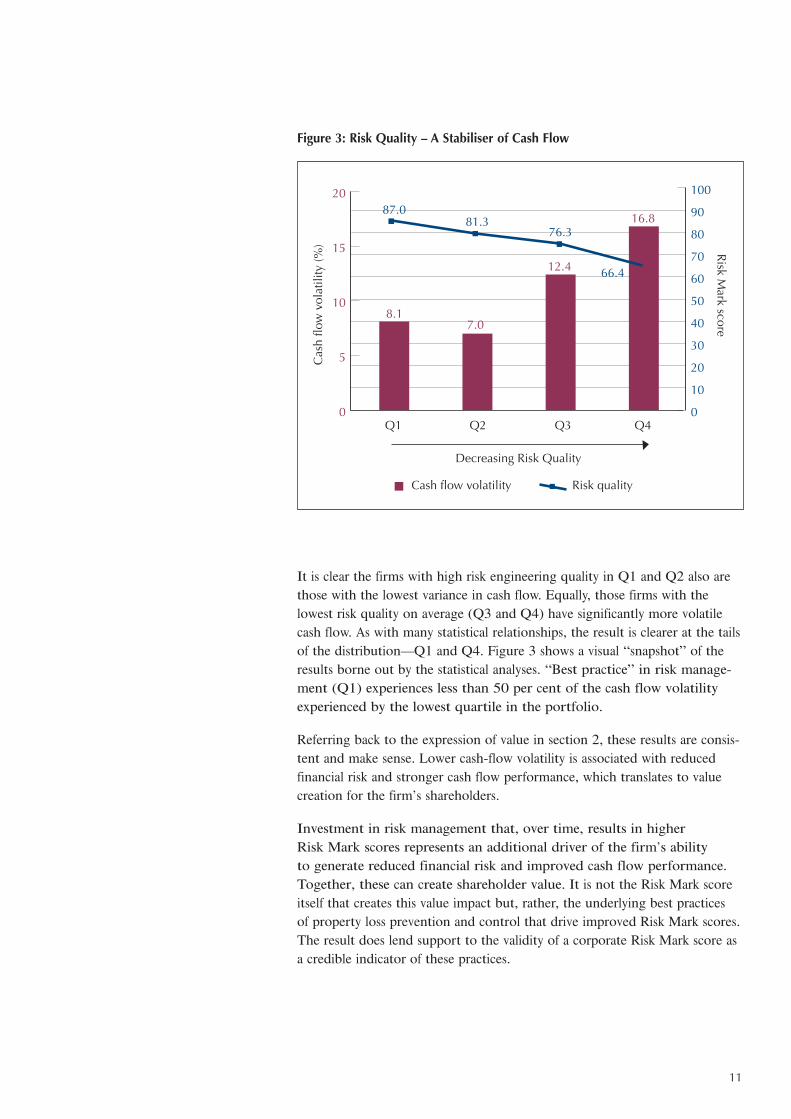
Shown in Figure 3 are the four quartiles of the portfolio, when ranked by the corporate Risk Mark score, such that Q1 firms have the highest total Risk Mark scores. The average score has been calculated for each of the quartiles and is shown in red. Shown in blue is the median average cash flowvolatility for each quartile.
11
Figure 3: Risk Quality – A Stabiliser of Cash Flow
It is clear the firms with high risk engineering quality in Q1 and Q2 also arethose with the lowest variance in cash flow. Equally, those firms with the lowest risk quality on average (Q3 and Q4) have significantly more volatilecash flow. As with many statistical relationships, the result is clearer at the tailsof the distribution—Q1 and Q4. Figure 3 shows a visual “snapshot” of theresults borne out by the statistical analyses. “Best practice” in risk manage-ment (Q1) experiences less than 50 per cent of the cash flow volatilityexperienced by the lowest quartile in the portfolio.
Referring back to the expression of value in section 2, these results are consis-tent and make sense. Lower cash-flow volatility is associated with reducedfinancial risk and stronger cash flow performance, which translates to valuecreation for the firm’s shareholders.
Investment in risk management that, over time, results in higher Risk Mark scores represents an additional driver of the firm’s ability to generate reduced financial risk and improved cash flow performance.Together, these can create shareholder value. It is not the Risk Mark scoreitself that creates this value impact but, rather, the underlying best practices of property loss prevention and control that drive improved Risk Mark scores.The result does lend support to the validity of a corporate Risk Mark score asa credible indicator of these practices.
Cash flow volatility Risk quality
0
5
10
15
20
0
10
20
30
40
50
60
70
80
90
100
Q1 Q2 Q3 Q4
8.17.0
12.4
16.8
Decreasing Risk Quality
Risk Mark score
Cas
h flo
w v
olat
ility
(%)
87.081.3
76.3
66.4
12
The Power Lies in the Process
When the corporate Risk Mark total score was decomposed into its three coreelements—fire and explosion, natural hazard and occupancy—and analysedwith respect to financial performance, it was found that no single componentwas responsible for the relationship.
It is beneficial to shareholders that managers invest in promoting a culture of loss prevention at their firms. Significantly, the power in the relationship between quality risk engineering and value appears to lie in theinteraction between the components of Risk Mark (i.e., fire and explosion,natural hazard and occupancy), rather than in any single component. Risk managers, therefore, cannot pick and choose between the components of risk quality in order to enhance value. Credibility and integrity in the riskmanagement culture across the firm are essential.
5 The Study PortfolioThe final stage of analysis involved evaluating the study portfolio, for whichrisk quality data exist, in a broader context. This is necessary to ascertainwhether the sample is, in any way, self-selecting. In other words, can theresults be generalised to firms for which Risk Mark data is not available? In responding to this question, the study portfolio was placed in the contextof the Global 1000 portfolio; the largest (by market capitalisation) 1,000quoted, non-financial firms worldwide. Two specific questions provokedexamination:
1 Are the relationships demonstrated in the previous section uniqueto the study portfolio?
2 Is selection bias present in the study portfolio?
Correlation analysis revealed a very similar structure for the study portfolioas for the Global 1000. In particular, the strong and positive relationshipbetween variance in returns and cash flow volatility was shown to be robust.This supports the notion that the relationships previously described are robustand are not peculiar to the study portfolio (firms surveyed by FM Global’srisk engineers and assigned a Risk Mark score of risk quality).
The second question relates to whether the study portfolio represents a “random sampling.” Appropriate statistical analyses7 were conducted on thetwo portfolios (FM Global clients for which Risk Mark data exist and theGlobal 1000) and it was demonstrated there was no significant differencebetween the portfolios as regards stock returns, variance in cash flow or variance in earnings. This means the results found are not a function of clientselection bias on the part of FM Global and the value-adding potential of riskquality at the operating level is universal across all firms.
7 Two-tailed t-tests.
13
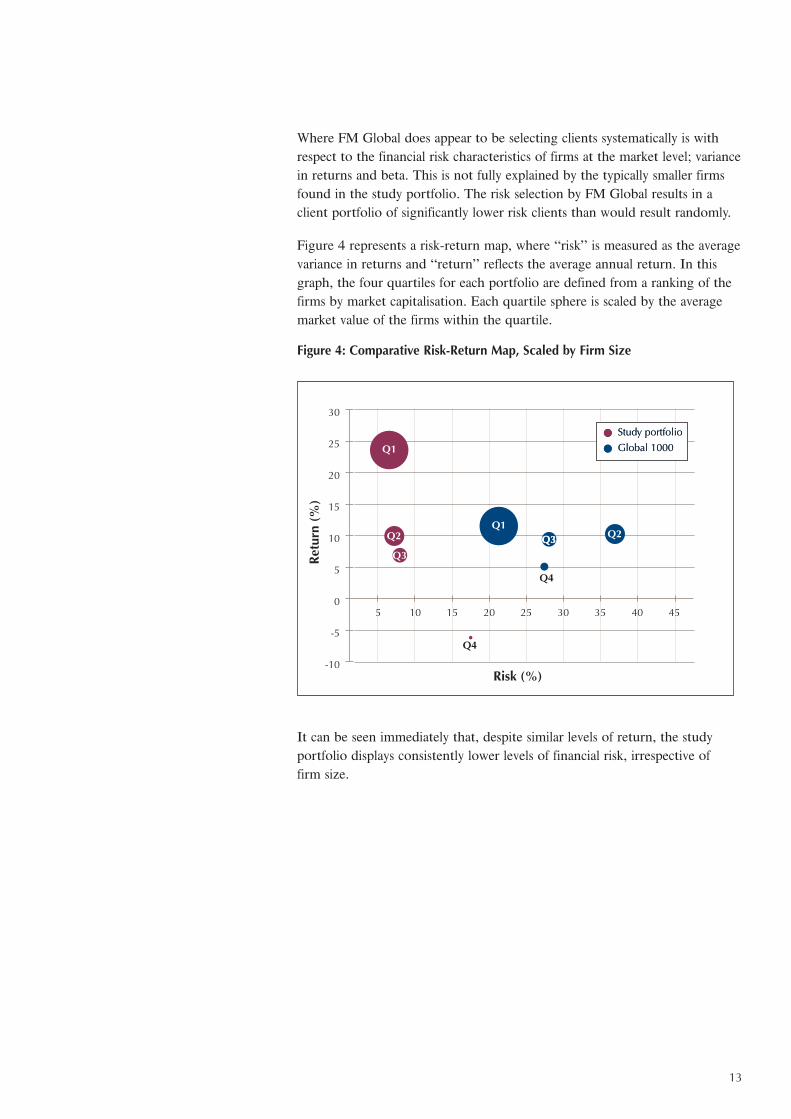
Where FM Global does appear to be selecting clients systematically is withrespect to the financial risk characteristics of firms at the market level; variancein returns and beta. This is not fully explained by the typically smaller firmsfound in the study portfolio. The risk selection by FM Global results in aclient portfolio of significantly lower risk clients than would result randomly.
Figure 4 represents a risk-return map, where “risk” is measured as the averagevariance in returns and “return” reflects the average annual return. In thisgraph, the four quartiles for each portfolio are defined from a ranking of thefirms by market capitalisation. Each quartile sphere is scaled by the averagemarket value of the firms within the quartile.
Figure 4: Comparative Risk-Return Map, Scaled by Firm Size
It can be seen immediately that, despite similar levels of return, the studyportfolio displays consistently lower levels of financial risk, irrespective of firm size.
-10
-5
0
5
10
15
20
25
30
Retu
rn (%
)
5 10 15 20 25 30 35 40 45
Risk (%)
Q1
Q2
Q3
Q4
Q1Q2
Q4
Study portfolioGlobal 1000 Study portfolioGlobal 1000
Q3Q3

14
AppendixProvided in the Appendix are the regional and sectoral compositions of thestudy portfolio of 438 quoted firms analysed and the Global 1000 portfolio,the largest (by market capitalisation on 31 December 2001) 1,000 non-finan-cial quoted firms worldwide. Forty-three per cent of the European firms inthe Global 1000 are from the UK.
Study Portfolio by Region
Global 1000 by Region8
Twenty-four per cent of the largest 1,000 quoted firms worldwide are finan-cial institutions. Therefore, a non-financial Global 1000 portfolio has beencompiled for this study so as to avoid skewing the results, given the minimal(3 per cent) representation of Financials in the study portfolio. The sectoralcomposition across the two portfolios analysed is largely similar, with a greaterpresence of firms from the study portfolio in Materials and fewer firms inInformation Technology.
8 Japan and Korea have been excluded from
the Global 1000 portfolio owing to the
insufficient availability of cash flow data.
To ease comparison, the six South
African firms in the Global 1000 have
been included in th Asia/Pacific category.

15
Study Portfolio by Sector9
Global 1000 by Sector
9 The industry classification used is based
on the Global Industry Classification
Standard (GICS) as determined by
Morgan Stanley Capital International and
Standard & Poor’s.

16

P0302 Printed in USA (9/03) © 2003 Factory Mutual Insurance Company All rights reserved. www.fmglobal.comwww.oxfordmetrica.com
FM Global
With nearly two centuries of experi-ence, FM Global is an insuranceorganisation specializing in propertyprotection and risk management.Many Global 1000 and leading international corporations rely on FM Global’s superior financialstrength, loss prevention engineeringand research, risk management skillsand risk transfer capabilities to minimise business disruption and the financial impact of a loss.
Oxford Metrica
Oxford Metrica is an independentstrategic advisor. The firm addressesthe CEO agenda and focuses on risk,value, reputation and governance—the strategic aspects of financial performance. The firm connectsfinancial and risk theory with realdata to provide empirical, quantita-tive and practical analysis for financialand corporate clients worldwide.Oxford Metrica is about real-worldsolutions with rigour and precision.

www.oxfordmetrica.com