IMPROVING REGIONAL AND RURAL DEVELOPMENT FOR …
25
IMPROVING REGIONAL AND RURAL DEVELOPMENT FOR INCLUSIVE GROWTH IN EGYPT Hafez Ghanem GLOBAL ECONOMY & DEVELOPMENT WORKING PAPER 67 | JANUARY 2014 Global Economy and Development at BROOKINGS
Transcript of IMPROVING REGIONAL AND RURAL DEVELOPMENT FOR …

IMPROVING REGIONAL AND RURAL DEVELOPMENT FOR INCLUSIVE GROWTH IN EGYPT
Hafez Ghanem
GLOBAL ECONOMY & DEVELOPMENT
WORKING PAPER 67 | JANUARY 2014
Global Economyand Developmentat BROOKINGS
Global Economyand Developmentat BROOKINGS
Hafez Ghanem is a senior fellow in the Global
Economy and Development program at the Brookings
Institution.
Acknowledgements:
I would like to thank Abdessalam Ould Ahmed for providing excellent comments on an earlier version of this paper.
I have also benefitted from my participation in the MENA Regional Dialogue on Family Farming that was
organized in Tunis in November 2013 by the Food and Agriculture Organization of the United Nations (FAO). I
am grateful to participants in this dialogue—particularly Nora Ourabah Haddad, Benoit Horemans, Noureddine
Nasr and Mohamed Bengoumi—for very useful discussions that have helped me improve this paper.

Abstract:
This paper examines how economic growth in Egypt can be made more inclusive through a focus on rural develop-
ment and reducing regional disparities. Nearly all of the extremely poor in Egypt live in rural areas and 83 percent
of them live in Upper Egypt. The youth in those rural areas feel particularly excluded.
The paper proposes a three-pronged strategy for dealing with regional inequalities and reducing the rural-urban
divide. First, there is a need to move to a more transparent and inclusive system for economic planning and the
allocation of public expenditures. The poor and lagging regions have been receiving less than their fair share of
public funds, and this would only change if the whole decision-making process for budget allocation is revised so
that ordinary citizens, particularly the poor, have a greater say in budgetary allocations. Second, the approach to
social protection and social safety nets needs to be modernized and made more sensitive to the needs of rural-
dwellers. The current system that relies mainly on subsidized prices, especially for energy, does not properly tar-
get the rural poor. It is argued here that the rural poor would be better served by a system based on direct cash
transfers similar to the systems used in Brazil and Mexico. Third, since most of the rural poor depend directly or
indirectly on agriculture for their livelihoods, agriculture development and modernization focusing on support to
small-holder farmers would be important for rural poverty reduction.
CONTENTS
Introduction . . . . . . . . . . . . . . . . . . . . . . . . . . . . . . . . . . . . . . . . . . . . . . . . . . . . . . . . . . . . . . . . . . . . . . . . . . .1
Egypt’s Agriculture and Rural Space . . . . . . . . . . . . . . . . . . . . . . . . . . . . . . . . . . . . . . . . . . . . . . . . . . . . . 3
Large Regional Variations in Poverty and Opportunities . . . . . . . . . . . . . . . . . . . . . . . . . . . . . . . . . . . . 4
Allocation of Public Investment . . . . . . . . . . . . . . . . . . . . . . . . . . . . . . . . . . . . . . . . . . . . . . . . . . . . . . . . . 7
Social Protection and Safety Nets . . . . . . . . . . . . . . . . . . . . . . . . . . . . . . . . . . . . . . . . . . . . . . . . . . . . . . . 9
Developing Agriculture and Agro-Industries . . . . . . . . . . . . . . . . . . . . . . . . . . . . . . . . . . . . . . . . . . . . . . 12
Concluding Remarks and the Role of Development Partners . . . . . . . . . . . . . . . . . . . . . . . . . . . . . . . .17
References . . . . . . . . . . . . . . . . . . . . . . . . . . . . . . . . . . . . . . . . . . . . . . . . . . . . . . . . . . . . . . . . . . . . . . . . . . 18
LIST OF TABLES
Table 1: Poverty in Egypt, 2011 (% of total population) . . . . . . . . . . . . . . . . . . . . . . . . . . . . . . . . . . . . . . 4
Table 2: Regional Distribution of Poverty in Egypt, 2012 (%) . . . . . . . . . . . . . . . . . . . . . . . . . . . . . . . . 5
Table 3: Human Opportunity Index in Egypt, 2009 . . . . . . . . . . . . . . . . . . . . . . . . . . . . . . . . . . . . . . . . . 6
Table 4: Aggregate HOI in Egypt by Region, 2009 . . . . . . . . . . . . . . . . . . . . . . . . . . . . . . . . . . . . . . . . . 6
Table 5: Distribution of Public Investment in Selected Sectors in Egypt, 2009 (%) . . . . . . . . . . . . . 7
Table 6: Land Use of Major Agricultural Products in Egypt, 1980-2007 (% of farmland) . . . . . . . . 12
Table 7: Industrial Transformation of Agricultural Products in Egypt, 2009 . . . . . . . . . . . . . . . . . . . 14
IMPROVING REGIONAL AND RURAL DEVELOPMENT FOR INCLUSIVE GROWTH IN EGYPT 1
IMPROVING REGIONAL AND RURAL DEVELOPMENT FOR INCLUSIVE GROWTH IN EGYPT
Hafez Ghanem
INTRODUCTION
The Egyptian economy needs to start growing again,
and the benefits from growth need to be more fairly
distributed. Egypt was growing at a healthy rate of
5 to 7 percent during the 5-year period before the
2011 revolution. However, as Ghanem (2013) argues,
growth was not sufficiently inclusive. The middle
class did not benefit enough from growth and the
proportion of Egyptians living on less than $5 per
day remained stagnant at about 85 percent. This is
quite different from the experience of other emerging
economies, such as Brazil and India, where percent-
age of poor fell dramatically during high-growth pe-
riods. Assaad and Barsoum (2008) show that youth
felt particularly excluded as they suffered from a high
unemployment rate of about 25 percent, and even
those who found jobs usually ended up working in the
informal sector where they typically earn less than $4
per day and have no job security or social benefits.
There is also a spatial dimension to this lack of inclu-
siveness. About 57 percent of Egypt’s population lives
in rural areas. Rural poverty is three times higher
than urban poverty and more than 80 percent of the
extremely poor live in Upper Egypt, which is home to
about half of Egypt’s population.
Ghanem and Shaikh (2013) show that Egypt’s eco-
nomic situation deteriorated after the revolution as
political instability and a sense of insecurity led to a
decline in investment, capital flight and rising unem-
ployment. By mid-2013 growth was down from 5 per-
cent to about 2 percent, overall unemployment rose
from 9 percent to 13.5 percent, and foreign reserves
declined so that they barely covered 3 months of im-
ports. The low international reserves made it more
difficult to import, and the prices of many imported
necessities, including food, rose rapidly. As usual it is
the lower middle class and the poor, especially rural
poor, who suffer most from the slow economy. That
is why it is important that Egypt adjust its economic
policies and adopts a strategy to achieve inclusive
growth.
Several emerging economies (e.g., Brazil under
President Luiz Inácio Lula da Silva) have succeeded
in drastically reducing rural poverty. As described by
Da Silva et al.. (2011), economies successful at reduc-
ing rural poverty have adopted a three-pronged strat-
egy: (1) supporting institutional reforms that ensure
that the rural poor have a greater voice in economic
decision making, (2) developing agriculture and agro-
processing so as to enhance rural livelihoods, and (3)
2 GLOBAL ECONOMY AND DEVELOPMENT PROGRAM
putting in place targeted social protection programs
that mainly consist of cash transfers to the rural poor.
This paper presents an analysis of Egypt’s experience
in rural and regional development and compares it
with international experiences. It argues that reforms
along the lines that were adopted in Brazil could help
improve rural incomes and reduce regional disparities
in Egypt.
The remainder of the paper is divided into six sec-
tions. The first describes Egypt’s rural space and its
agricultural sector as well as the evolution of rural
development policies over time, the second presents
the data on regional inequalities, the third deals with
the allocation of public spending, the fourth analyses
social safety nets, the fifth discusses agricultural poli-
cies and the sixth concludes by looking at what donors
can do to support inclusive growth through regional
and rural development.

IMPROVING REGIONAL AND RURAL DEVELOPMENT FOR INCLUSIVE GROWTH IN EGYPT 3
EGYPT’S AGRICULTURE AND RURAL SPACE
Egypt has been an agricultural country for millennia,
with agricultural and peasant society forming the ba-
sis of Egyptian civilization. Even today more than half
of the population is rural. The country’s area is about
one million square kilometers, but 97 percent of it is
desert. Therefore, nearly all of the population lives on
3 percent of the land which is in the Nile valley South
of Cairo (Upper Egypt) and its delta (Lower Egypt).
Thus, land and water availability are important con-
straints on agriculture and rural development. Arable
land per person is about 0.05 hectares, one of the
lowest in the world, and water availability is limited to
Egypt’s quota of Nile water.
Abaab et al. (2000) describe Egyptian agriculture
as a special case in the Mediterranean region. It is a
very intensive irrigated agriculture with two or three
plantings every year. Rural space in Egypt consists
of about 5,000 villages built along the Nile and the
cultivated areas around them, which are in turn sur-
rounded by desert. The typical agriculture production
unit is a small family farm, with about 75 percent of
farms being less than one hectare. Family members
typically have multiple activities: agriculture, animal
production and off-farm employment. Most farm fam-
ilies have cows or water-buffalos, with an average of
two animals per family. There are very little industrial
or service activities in rural areas. Hence, employ-
ment for small farmers typically means wage labor on
one of the larger farms nearby.
Historically, Lower Egypt has always been more de-
veloped than Upper Egypt. Lower Egypt’s proximity
to major ports on the Mediterranean has encouraged
trade and the export of agriculture products. It has
also led to the development of industry. Nearly all of
Egypt’s textiles industry, which started growing in the
mid-19th century, is in Lower Egypt.
Because of the need to centrally manage the country’s
irrigation system, the Egyptian state has been heavily
involved in regulating agriculture since the days of
the Pharaohs. Starting in the 1950s, the government
adopted a very interventionist policy and regulatory
framework. The state controlled all crop areas, and
farmers were not left free to plant what they wanted.
The rent of agricultural land was also fixed by the gov-
ernment. It also controlled all farm-gate prices, which
were typically 40 to 60 percent below international
prices. By paying farmers a low price for their output,
the government could then ensure inexpensive food
for the urban centers. In a sense, like in most devel-
oping countries, the government was implicitly taxing
farmers to subsidize city dwellers. This all changed
with the de-regulation that began in 1986. Now farm-
ers are free to produce what they want and sell it at
market prices, and the market for agricultural land
has been liberalized.

4 GLOBAL ECONOMY AND DEVELOPMENT PROGRAM
LARGE REGIONAL VARIATIONS IN POVERTY AND OPPORTUNITIES
In spite of the deregulation, the probability of be-
ing extremely poor in Egypt is still nearly four times
higher for people living in rural areas than for those
in urban areas. Table 1 shows the poverty headcount
index using three poverty lines. The line for extreme
poverty is defined by the cost of buying sufficient
food. That is, the extreme poor are defined here as
those who cannot afford to buy a minimum food bas-
ket. The table shows that 6.7 percent of the popula-
tion of Egypt is extremely poor. The figure for urban
areas is only 2.6 percent while that for rural areas is
9.6 percent. That is, nearly one out of every 10 rural
inhabitants in Egypt is extremely poor and food inse-
cure.
Table 1 also shows the incidence of poverty using two
other poverty lines. The lower poverty line is based on
a basket of goods and services that is considered by
the government to be the minimum. According to this
lower poverty line 22 percent of Egypt’s population is
poor, but rural poverty is 30 percent—which is nearly
three times higher than the incidence of poverty in ur-
ban areas. The World Bank has developed a high pov-
erty line in order to help identify the near-poor. Using
this higher poverty line yields a national headcount
index of 41.2 percent, and a rural poverty rate of 52.7
percent, about double the urban poverty rate.
In addition to the rural-urban differences, poverty in
Egypt also varies by region. In analyzing the incidence
of poverty it is useful to divide Egypt into four regions:
(1) metropolitan Egypt, which includes the large cit-
ies especially Cairo and Alexandria, (2) lower Egypt,
which includes the fertile delta region north of Cairo,
(3) upper Egypt, which includes the Nile valley south
of Cairo, and (4) borders regions, which include the
desert areas along the border with Libya and in the
Sinai Peninsula. Each of those regions (except the
metropolitan region) is divided into rural areas and
urban centers.
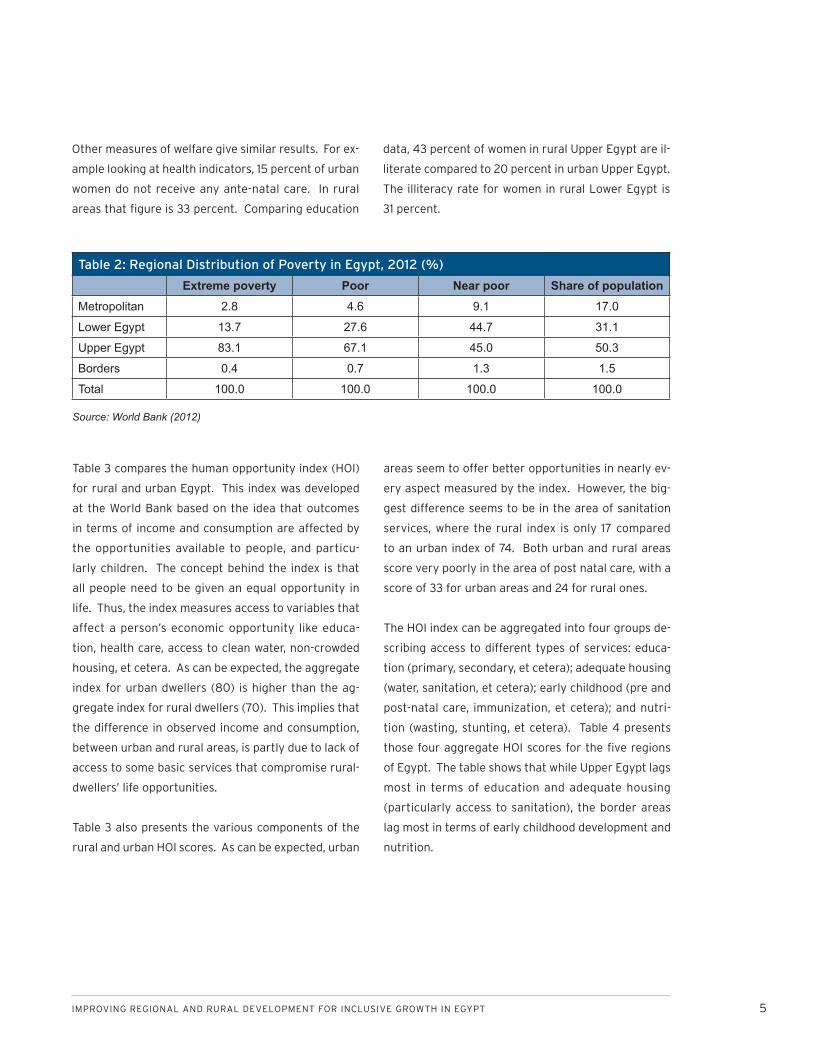
Table 2 shows that Upper Egypt represents a special
problem. It has about 50 percent of the country’s
population, but hosts 83 percent of the extremely
poor and 67 percent of the poor. The problem in
Upper Egypt is especially serious in the rural areas.
Urban Upper Egypt has 11.6 percent of Egypt’s ex-
tremely poor and 11.3 percent of the country’s poor.
On the other hand, rural Upper Egypt has 71.5 percent
of the extremely poor and 55.8 percent of the poor.
Lower Egypt has less poverty. About 30 percent of
Egypt’s population lives in Lower Egypt and the re-
gion is home to 13.7 percent of the country’s extreme
poor and 27.6 percent of the poor. However, it is im-
portant to note that the vast majority of the poor and
extremely poor in Lower Egypt also live in rural areas.
Table 1: Poverty in Egypt, 2011 (% of total population)
People Living Under Extreme Poverty Line
People Living Under Lower Poverty Line
People Living Under Upper Poverty Line
Urban 2.6 10.6 24.6
Rural 9.6 30.0 52.7
Total 6.7 22.0 41.2
Source: World Bank (2011)
IMPROVING REGIONAL AND RURAL DEVELOPMENT FOR INCLUSIVE GROWTH IN EGYPT 5
Other measures of welfare give similar results. For ex-
ample looking at health indicators, 15 percent of urban
women do not receive any ante-natal care. In rural
areas that figure is 33 percent. Comparing education
data, 43 percent of women in rural Upper Egypt are il-
literate compared to 20 percent in urban Upper Egypt.
The illiteracy rate for women in rural Lower Egypt is
31 percent.
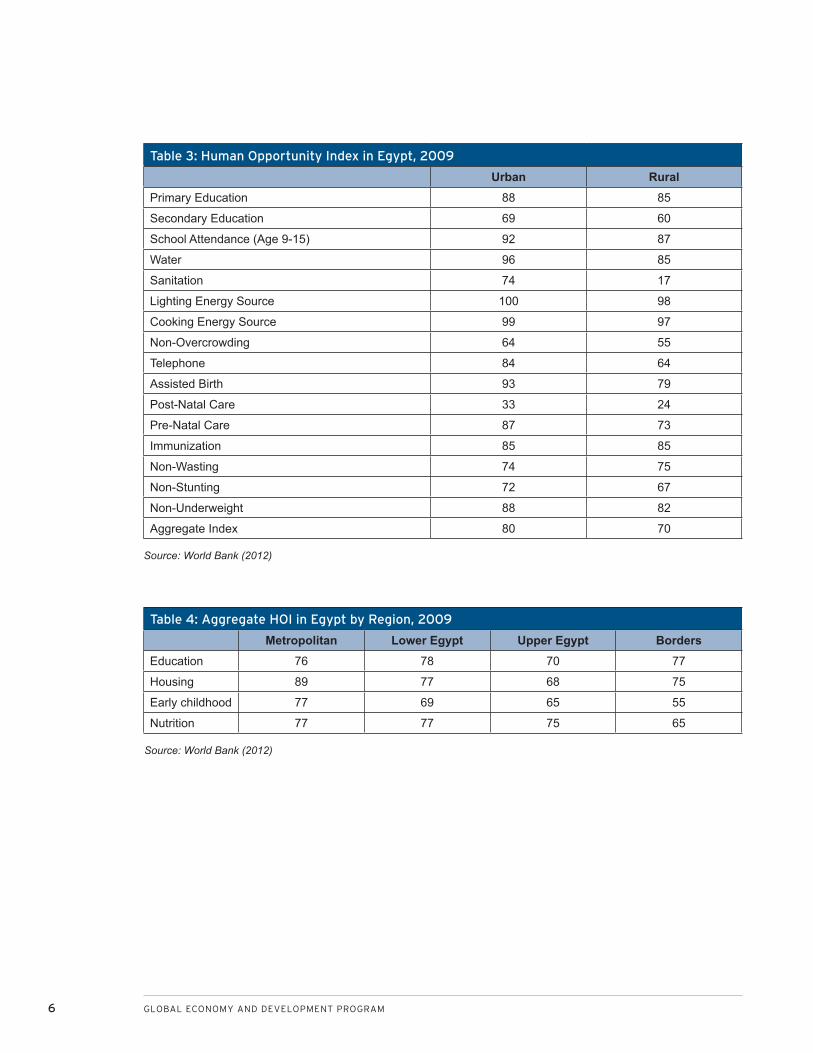
Table 3 compares the human opportunity index (HOI)
for rural and urban Egypt. This index was developed
at the World Bank based on the idea that outcomes
in terms of income and consumption are affected by
the opportunities available to people, and particu-
larly children. The concept behind the index is that
all people need to be given an equal opportunity in
life. Thus, the index measures access to variables that
affect a person’s economic opportunity like educa-
tion, health care, access to clean water, non-crowded
housing, et cetera. As can be expected, the aggregate
index for urban dwellers (80) is higher than the ag-
gregate index for rural dwellers (70). This implies that
the difference in observed income and consumption,
between urban and rural areas, is partly due to lack of
access to some basic services that compromise rural-
dwellers’ life opportunities.
Table 3 also presents the various components of the
rural and urban HOI scores. As can be expected, urban
areas seem to offer better opportunities in nearly ev-
ery aspect measured by the index. However, the big-
gest difference seems to be in the area of sanitation
services, where the rural index is only 17 compared
to an urban index of 74. Both urban and rural areas
score very poorly in the area of post natal care, with a
score of 33 for urban areas and 24 for rural ones.
The HOI index can be aggregated into four groups de-
scribing access to different types of services: educa-
tion (primary, secondary, et cetera); adequate housing
(water, sanitation, et cetera); early childhood (pre and
post-natal care, immunization, et cetera); and nutri-
tion (wasting, stunting, et cetera). Table 4 presents
those four aggregate HOI scores for the five regions
of Egypt. The table shows that while Upper Egypt lags
most in terms of education and adequate housing
(particularly access to sanitation), the border areas
lag most in terms of early childhood development and
nutrition.
Table 2: Regional Distribution of Poverty in Egypt, 2012 (%)
Extreme poverty Poor Near poor Share of populationMetropolitan 2.8 4.6 9.1 17.0
Lower Egypt 13.7 27.6 44.7 31.1
Upper Egypt 83.1 67.1 45.0 50.3
Borders 0.4 0.7 1.3 1.5
Total 100.0 100.0 100.0 100.0
Source: World Bank (2012)
6 GLOBAL ECONOMY AND DEVELOPMENT PROGRAM
Table 3: Human Opportunity Index in Egypt, 2009
Urban RuralPrimary Education 88 85
Secondary Education 69 60
School Attendance (Age 9-15) 92 87
Water 96 85
Sanitation 74 17
Lighting Energy Source 100 98
Cooking Energy Source 99 97
Non-Overcrowding 64 55
Telephone 84 64
Assisted Birth 93 79
Post-Natal Care 33 24
Pre-Natal Care 87 73
Immunization 85 85
Non-Wasting 74 75
Non-Stunting 72 67
Non-Underweight 88 82
Aggregate Index 80 70
Source: World Bank (2012)
Table 4: Aggregate HOI in Egypt by Region, 2009
Metropolitan Lower Egypt Upper Egypt BordersEducation 76 78 70 77
Housing 89 77 68 75
Early childhood 77 69 65 55
Nutrition 77 77 75 65
Source: World Bank (2012)

IMPROVING REGIONAL AND RURAL DEVELOPMENT FOR INCLUSIVE GROWTH IN EGYPT 7
ALLOCATION OF PUBLIC INVESTMENT
Public spending appears to reflect political realities
rather than a desire to reduce regional inequalities.
Table 5 shows that Metropolitan areas with 17 per-
cent of the population receive nearly 34 percent of
public investment, although they have lower poverty
rates than the rest of the country. Upper Egypt—with
about half of the population and the vast majority of
the extremely poor—only receives 25 percent of pub-
lic investment. This probably reflects a desire to keep
the big cities relatively satisfied to avoid demonstra-
tions and unrest that could jeopardize political sta-
bility. Prioritizing the welfare of relatively better-off
urban dwellers, and hence neglecting rural areas, is
a common phenomenon in developing countries with
weak institutions where the rural poor are unable to
participate in economic decision-making.
The cross-sector allocation of public investment also
appears to need revision. For example, the border
areas receive a disproportionate amount of public
investment given their share of population and pov-
erty. Nevertheless, this could have made sense if the
investment was directed at early childhood develop-
ment and nutrition, sectors in which the border areas
are lagging. However, as Table 5 shows, the dispro-
portionate share of public investment in border areas
has been directed at the electricity sector, rather than
health or education. Similarly, there is pressing need
for investment in sanitation infrastructure in Upper
Egypt, a sector that has been long neglected; and in
post-natal care across the whole country.
Problems with the geographic and sectoral allocation
of public investment reflect the non-inclusive way in
which planning is carried out and the lack of a real link
between plans and actual expenditures. Sakamoto
(2013) analyzes the planning process in Egypt and
compares it with good practices in successful econo-
mies of East Asia. He argues that a new approach to
both planning and thus allocation of public spending
is needed. The planning process needs to include
representatives of different ministries as well as the
private sector and civil society. Beneficiaries of pub-
lic expenditures, particularly the poor, need to have a
voice in the decision-making process. There is also a
need to better coordinate activities of the various line
ministries and to put in place a mechanism that links
plans to actual expenditure decisions.
Egypt needs a transparent and inclusive planning
system that allows a societal dialogue on economic
issues and building a consensus around key priorities.
The absence of such a system creates an environ-
Table 5: Distribution of Public Investment in Selected Sectors in Egypt, 2009 (%)
Total Electricity Water Education HealthMetropolitan 33.6 6.4 16.9 30.4 32.1
Lower Egypt 30.3 20.0 53.9 35.6 32.4
Upper Egypt 25.6 29.7 20.9 30.2 30.9
Borders 10.4 43.9 8.4 3.9 4.6
Total 100.0 100.0 100.0 100.0 100.0
Source: World Bank (2012)
8 GLOBAL ECONOMY AND DEVELOPMENT PROGRAM
ment where corruption can develop and weak imple-
mentation is tolerated. The experiences of Japan,
Indonesia and Malaysia with inclusive planning dem-
onstrate how inclusiveness goes hand-in-hand with
economic growth and poverty reduction. As argued by
Sakamoto (2013), Japan’s Economic Planning Council,
Malaysia’s implementation monitoring mechanism
and Indonesia’s participatory planning process during
its democratic transition are examples that could be
adapted to the Egyptian context.
Brazil also provides an example of inclusive planning.
When Luis Ignacio Lula da Silva was elected president
of Brazil, fighting hunger was one of his top priori-
ties for achieving social justice. Therefore, he cre-
ated a National Food and Nutritional Security Council
(Consea), which is a good example of an inclusive
economic institution. It had 59 members, 17 govern-
ment representatives and 42 members representing
civil society, and was chaired by a civil-society rep-
resentative. The council met on the premises of the
presidency and made their recommendations directly
to President Lula. Because the problem of hunger
is inter-sectoral in nature the council had a broad
membership so that all sectors of the economy were
represented. Consea was also conceived as a tool to
provide voice for those suffering from hunger and to
improve cooperation between government and civil
society. Under Consea and President Silva, Brazil was
extremely successful in eliminating hunger.

IMPROVING REGIONAL AND RURAL DEVELOPMENT FOR INCLUSIVE GROWTH IN EGYPT 9
SOCIAL PROTECTION AND SAFETY NETS
The relatively large numbers of extremely poor peo-
ple, mostly concentrated in rural Upper Egypt, are not
being reached by the existing social safety net system
(SSN). Egypt’s SSN accounts for a substantial share
of public spending, but does not have a commen-
surate impact on poverty and human development.
Much of the spending goes to universal fuel subsidies
(about 7 percent of GDP), which benefit the rich more
than the poor and distort resource allocation.
Bread subsidies cost Egypt about 1.5 percent of GDP.
According to World Bank (2011), in the absence of
food subsidies poverty in Egypt would have been sig-
nificantly higher—31 percent instead of 22 percent.
However, the World Bank study also shows that the
cost of food subsidies could be greatly reduced if leak-
ages were eliminated and coverage narrowed to those
who really need it.
Cash transfers to the poor and vulnerable represent
only 0.1 percent of GDP. Those non-subsidy SSN pro-
grams are largely fragmented, poorly targeted and
limited in scope. Currently, there is no cohesive SSN
system that can adequately protect the growing num-
ber of the poor, provide mitigation against some of the
adverse impacts of economic reform programs and be
scaled up in times of crisis.
Egypt should consider reforming the fuel subsidies
system, improving governance and financial viability
of key energy sector actors, replacing untargeted sub-
sidies with an efficient and well-targeted social safety
net system and providing immediate protection to the
poor and the vulnerable hard-hit by the deteriorating
economic conditions and subsidy reforms.
The objective should not be to eliminate universal
subsidies to reduce overall spending, but rather to
replace them with more effective mechanisms that
target the extremely poor. The net effect on the bud-
get deficit could be zero. Nevertheless, reductions
in fuel subsidies will need to be carried out carefully.
The fact that in Egypt 57 percent of the fuel subsidy
goes to the top two-fifths of the income distribution
can be misinterpreted; the vast majority of this group
lives on just $4 to $10 per day. Thus, the vast major-
ity of those two top quintiles should be classified as
either middle class or even poor, but certainly not
rich. Moreover, the 57 percent figure implies that 43
percent of the subsidy benefits people who live on
less than $4 a day. Therefore, notwithstanding the
regressive nature of the subsidy, it seems clear that
reducing or eliminating it will hurt the middle class,
and therefore will be politically difficult to implement.
This is not a new problem. When President Anwar
Sadat tried reducing subsidies in Egypt in 1977, there
were massive street riots and he was forced to reverse
the decision. President Habib Bourghiba in Tunisia
faced the same problem. In 2011, Nigeria tried elimi-
nating fuel subsidies; but, faced with massive protests,
the government was compelled to restore them in
part. Jordan too faced street riots in 2012 when it
lowered fuel subsidies.
A change in the social protection system from untar-
geted subsidies to targeted social protection would
require a broad national dialogue and consensus
building. The objective needs to be clearly stated as
using the huge resources that are currently channeled
to untargeted subsidies in a more efficient way to help
the poor.
10 GLOBAL ECONOMY AND DEVELOPMENT PROGRAM
There are developing countries (including Ghana and
Indonesia) that have succeeded in reducing energy
subsidies and replacing them with better targeted
mechanisms. Egypt can draw important lessons
from these experiences. Vagliasisdi (2012) studied
20 developing countries and found that they man-
aged to reduce the average cost of energy subsidies
in their budgets from 1.8 percent of GDP in 2004 to
1.3 percent in 2010—and that this, in turn, led to both
a reduction in energy intensity and increased energy
efficiency.
Programs that succeeded in reducing energy subsi-
dies have usually included two features: compensa-
tory measures to help the most vulnerable and a
strong communications strategy to convince the pub-
lic of the benefits. In Indonesia, President Megawati
Sukarnoputri tried to implement energy price reforms
in 2003, but was faced with stiff opposition and had
to roll back the program. Three years later President
Susilo Bambang Yudhoyono tried again, starting with
a public information campaign that clearly identified
the benefits of the reform and the new safety net
programs for the poor. The people were apparently
convinced by the need for the reform and the govern-
ment’s commitment to protect the most vulnerable.
He was able to reduce subsidies with little opposition.
In 2004, the government of Ghana launched a study
on the impact of fuel subsidies. The study’s steering
committee included a variety of stakeholders (govern-
ment officials, academics, company representatives,
et cetera). By 2005, the government was able to
use the committee’s report to launch an information
effort that subsequently reduced fuel subsidies by
50 percent. The study had detailed social mitigation
measures and how to minimize backlash in order to
achieve its end goal. As a result, the government knew
how best to avoid public opposition on the issue and
how to communicate its policies to the public. In par-
ticular, the government clearly outlined how it plans
to use the savings from the reduced fuel subsidies to
provide targeted assistance to the poor.
Egypt may consider expanding the use of targeted
cash transfer mechanisms. Those could be region
specific, with different programs for Upper Egypt
and Lower Egypt, but initially they need to focus on
rural areas where nearly all the extremely poor live.
Such programs could be conditional or unconditional
depending on the region’s context. For example, in
Upper Egypt where 44 percent of women are illiterate
cash transfers could be conditioned on girls’ school at-
tendance. Alternatively, they could be unconditional,
only based on a means-testing system.
Egypt needs to move away from fragmented project-
based social protection to a systemized approach.
This means using common administrative mecha-
nisms, unique beneficiary identification, common
targeting techniques, common monitoring and
evaluation systems, and integrated transfer modali-
ties. Naturally, such a system needs to be built up
gradually as administrative capacity is being built. A
mechanism to avoid leakages and corruption, perhaps
through a partnership with civil society, needs to be
built in the design of the new system.
Egypt can benefit from Latin America’s experience in
this area, especially Brazil’s Bolsa Familia and Mexico’s
Progresa-Oportunidades. Bolsa Familia is the largest
program in the world of its kind. It covers 26 million
families, about 25 percent of the population. The
program gives poor families (defined as living on less
than $55 a month) a transfer of $13 per month per
vaccinated child attending school up to a maximum
of five children. It also provides a transfer of $15 per
month for each youth (16 to 17 years old) attending

IMPROVING REGIONAL AND RURAL DEVELOPMENT FOR INCLUSIVE GROWTH IN EGYPT 11
school up to a maximum of two per family. In addition
extremely poor families (defined as living on less than
$ 28 per month) receive a basic unconditional benefit.
The money is transferred, preferably to the female
head of household, through special debit cards issued
by a publicly-owned bank.
Mexico’s Progresa-Oportunidades was created with
the express objective of replacing price subsidies
with a cash transfer program. Today it covers about
5 million families, representing 24 percent of Mexico’s
population and nearly all of the country’s extremely
poor. It operates in all of the country’s 31 states with a
budget of $2.8 billion. Cash transfers are conditioned
on changes in the recipient’s behavior. Beneficiaries
need to invest in their own nutrition, health and edu-
cation. Progress is periodically measured through
comprehensive evaluations of programs, operations
and results.
The experience of Latin America shows that direct
cash transfers can be used to achieve poverty reduc-
tion as well as development objectives. By providing
cash to poor families those programs help raise their
consumption and get them out of poverty. It is a much
more direct method than generalized price subsidies
for products that can be consumed by the poor as
well as the non-poor. By making part of the transfer
conditional on school attendance or immunization the
programs also encourage investment in human capital
and thus help achieve long-term development objec-
tives. There is also some evidence that recipients of
cash transfers in rural areas tend to save part of it and
use it for investments in productive physical capital.
Many of the cash transfer programs are also used to
enhance women’s social and economic empowerment.
Many studies have shown that transferring money to
women instead of men lead to an increase in family
welfare, particularly improving children’s education,
nutrition and health. By putting cash in the hands
of women programs like Bolsa Familia and Progresa-
Oportunidades have improved women’s status within
the household and enhanced their self- esteem and
socio-economic empowerment.
12 GLOBAL ECONOMY AND DEVELOPMENT PROGRAM
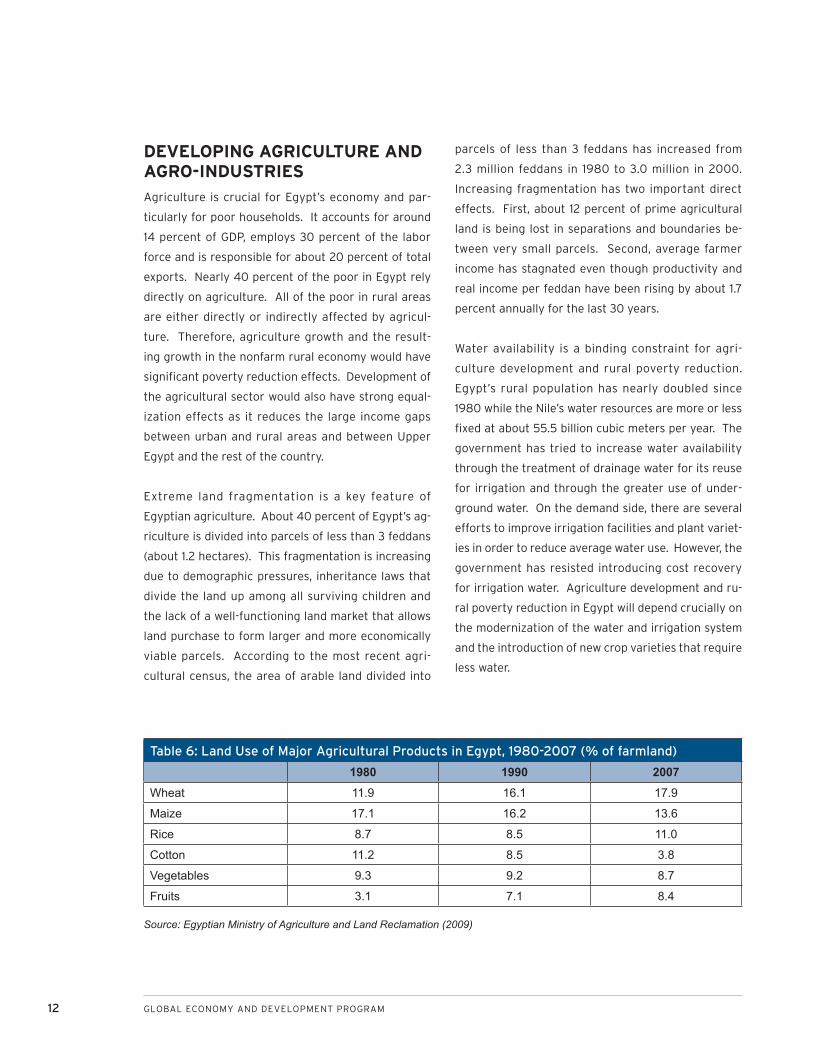
DEVELOPING AGRICULTURE AND AGRO-INDUSTRIES
Agriculture is crucial for Egypt’s economy and par-
ticularly for poor households. It accounts for around
14 percent of GDP, employs 30 percent of the labor
force and is responsible for about 20 percent of total
exports. Nearly 40 percent of the poor in Egypt rely
directly on agriculture. All of the poor in rural areas
are either directly or indirectly affected by agricul-
ture. Therefore, agriculture growth and the result-
ing growth in the nonfarm rural economy would have
significant poverty reduction effects. Development of
the agricultural sector would also have strong equal-
ization effects as it reduces the large income gaps
between urban and rural areas and between Upper
Egypt and the rest of the country.
Extreme land fragmentation is a key feature of
Egyptian agriculture. About 40 percent of Egypt’s ag-
riculture is divided into parcels of less than 3 feddans
(about 1.2 hectares). This fragmentation is increasing
due to demographic pressures, inheritance laws that
divide the land up among all surviving children and
the lack of a well-functioning land market that allows
land purchase to form larger and more economically
viable parcels. According to the most recent agri-
cultural census, the area of arable land divided into
parcels of less than 3 feddans has increased from
2.3 million feddans in 1980 to 3.0 million in 2000.
Increasing fragmentation has two important direct
effects. First, about 12 percent of prime agricultural
land is being lost in separations and boundaries be-
tween very small parcels. Second, average farmer
income has stagnated even though productivity and
real income per feddan have been rising by about 1.7
percent annually for the last 30 years.
Water availability is a binding constraint for agri-
culture development and rural poverty reduction.
Egypt’s rural population has nearly doubled since
1980 while the Nile’s water resources are more or less
fixed at about 55.5 billion cubic meters per year. The
government has tried to increase water availability
through the treatment of drainage water for its reuse
for irrigation and through the greater use of under-
ground water. On the demand side, there are several
efforts to improve irrigation facilities and plant variet-
ies in order to reduce average water use. However, the
government has resisted introducing cost recovery
for irrigation water. Agriculture development and ru-
ral poverty reduction in Egypt will depend crucially on
the modernization of the water and irrigation system
and the introduction of new crop varieties that require
less water.
Table 6: Land Use of Major Agricultural Products in Egypt, 1980-2007 (% of farmland)
1980 1990 2007Wheat 11.9 16.1 17.9
Maize 17.1 16.2 13.6
Rice 8.7 8.5 11.0
Cotton 11.2 8.5 3.8
Vegetables 9.3 9.2 8.7
Fruits 3.1 7.1 8.4
Source: Egyptian Ministry of Agriculture and Land Reclamation (2009)

IMPROVING REGIONAL AND RURAL DEVELOPMENT FOR INCLUSIVE GROWTH IN EGYPT 13
As described earlier, the agriculture sector has gone
through a series of liberalization efforts since the
1990s. These reforms included liberalizing the land
market as well as product prices. Moreover, farmers
are now free to decide on which crops to produce on
their land and they follow market signals. This has
led to a change in the structure of Egyptian agricul-
ture. As shown in Table 6 the area under cotton (tra-
ditionally Egypt’s largest cash crop and main export)
declined from 11.2 percent of the total in 1980 to 3.8
percent in 2007; while the area allocated for wheat
production and for fruits increased significantly.
The structure of the agricultural labor force has also
been changing rapidly. The proportion of young peo-
ple has increased, reflecting the overall demographic
change in Egypt. Moreover there has been a huge in-
crease in the number of university graduates with ag-
riculture degrees. However, according to the Ministry
of Agriculture (2009) the quality of new graduates
has declined significantly. Education institutions are
not producing graduates with the types of practical
skills demanded by the labor market. The ministry
has been trying to remedy this situation by developing
special training programs in areas where labor supply
is insufficient to meet the demand.
With limited land and water resources, agricultural
growth and farmers’ incomes depend crucially on
increasing yields. Over the last three decades yields
for many crops have increased at fast rates. Wheat
yields doubled between 1980 and 2007. Yields for rice
increased by 67 percent over the same period, and
water consumption per unit was reduced by 25 per-
cent. During the same period maize yields increased
by 90 percent, sugar cane yields by 44 percent, to-
mato yields by 116 percent and strawberry yields by
673 percent. On the other hand, yields of some major
crops—like cotton—remained stagnant, which could
explain farmers’ decisions to reduce the area under
cotton production. Future growth and rural poverty
reduction will require a continued increase in yields
through technological enhancement.
Livestock production (including poultry and fisheries)
represents 40 percent of the value of total agricul-
ture production in Egypt. Moreover, it is an impor-
tant source of income for small and landless farmers.
Landless farmers own 17 percent of all cows in Egypt,
6 percent of all water buffalos, and 25 percent of all
sheep and goats. Moreover, 93 percent of all cows,
86 percent of all buffalos and 55 percent of all sheep
and goats are owned by small producers who own less
than 10 animals. Demand for livestock products is in-
creasing rapidly as income increases. Therefore, this
is a sector that can contribute significantly to rural
poverty reduction.
Marketing—whether domestically or for exports—is a
serious constraint to agriculture development and for
increasing farmers’ incomes. The majority of small
holders continue to use the traditional marketing sys-
tem known as kerala. Under this system the crop is
sold in the field at a price per feddan. The buyer takes
control of the product in the field and handles the
harvesting, selection, grading and transportation. An
obvious problem with this system is that it does not
allow for much price differentiation to reflect quality.
This also means that the farmer gets a lower share of
the market value of the product as the buyer needs
to be compensated for harvesting and grading. For
example, in the case of many vegetables the farmer’s
share of the market price is only about 20 percent. As
Egypt tries to expand its exports, and as the domestic
market becomes more quality–sensitive, some buyers
are trying to make changes to kerala by introducing
some quality criteria.

14 GLOBAL ECONOMY AND DEVELOPMENT PROGRAM
Weak marketing, storage and transportation systems
also lead to large post-harvest losses. The Ministry
of Agriculture and Land Reclamation estimates that
about 15 percent of all of Egypt’s agriculture output is
lost after harvest. This is about average for develop-
ing countries. However, given the very tight water and
constraint that Egypt is facing and the fact that poor
farmers need to make a living out of very small land
parcels, every effort needs to be made to limit and
reduce this waste.
As shown in Table 7, agro-industries, which could
make an important contribution to value added and
employment generation in rural areas, are not suffi-
ciently developed. A very small portion of agricultural
production goes through any form of transformation,
processing, preparation or preservation. And most of
the agro-processing that takes place in Egypt (70 per-
cent according to Ministry of Agriculture estimates)
occurs in the informal sector. Agro-processors in the
informal sector do not follow quality or health-safety
norms and sell their products cheaply in local mar-
kets. There are virtually no long-term contractual
arrangements between farmers and agro-processors.
The processors rely on buying what is available in the
market, which may not always fully reflect their needs
in terms of quality and quantity.
Although Egyptian agriculture has tremendous export
potential, particularly to European and Gulf markets,
export growth has been relatively slow and concen-
trated in a few traditional commodities; raw cotton,
rice, citrus fruits and potatoes. The contribution of
nontraditional products in which Egypt has a competi-
tive advantage (including different fruits and vegeta-
bles, medicinal plants, cut flowers, et cetera) to export
growth has been very weak. Export development has
been hampered by inadequate transport infrastruc-
ture, market information and quality assurance pro-
cesses to ensure that health and safety standards are
met. Moreover, the vast majority of small holders do
not participate in export activities due to the lack of
contractual arrangements between small holders and
exporters as well as to the lack of attention to quality.
On the positive side, several examples show that when
provided with adequate support small holders are
able to meet quality standards and sell for export,
thus considerably increasing their incomes. Some
civil society organizations have been active in this
area with good results. The SUN nongovernmental
organization (NGO), which was created in 2002 and
operates in Upper Egypt, is a good example. This NGO
Table 7: Industrial Transformation of Agricultural Products in Egypt, 2009
Output (million tons) Share transformed (%)Tomatoes 8.6 0.7
Potatoes 2.3 7.8
Other vegetables 9.4 1.8
Fruits 9.8 0.9
Meat and poultry 1.5 0.3
Milk 5.0 25.0
Source: Ministry of Agriculture (2009)

IMPROVING REGIONAL AND RURAL DEVELOPMENT FOR INCLUSIVE GROWTH IN EGYPT 15
works with small holders. It organizes them into asso-
ciations and provides them with technical, managerial
and marketing support. It links small holders to large
producers and exporters through different contrac-
tual arrangements and out-grower schemes. In its
first five years of operations it signed nearly 900 dif-
ferent contracts with exporters and agro-processors.
It also prioritizes women participation in the program.
By 2007 more than 12,500 small holders had joined
SUN associations. They exported nontraditional prod-
ucts worth 85 million Egyptian pounds and estimate
that participants’ income rose by 60 million pounds.
The challenges facing Egyptian agriculture and ru-
ral development, as well as the opportunities, are
well known and the Ministry of Agriculture and Land
Reclamation has developed a comprehensive strat-
egy for the sector until the year 2030. The strategy
has six objectives: improve rural living standards and
reduce poverty; increase the sector’s contribution to
national food and nutrition security; sustainably use
natural resources; enhance land and water productiv-
ity; increase the sector’s competitiveness on interna-
tional and national markets; and improve the climate
for agricultural investments.
The strategy presents a long-term vision and a large
number of actions that need to be taken over the
next 15 to 20 years to achieve it. In today’s political
environment in Egypt it is important to focus on a few
short-term actions that can bring about fairly quick
results. Moreover, since small-holder and landless
farmers constitute the vast majority of rural dwellers
as well as the majority of poor people, policies should
target small producers and help them raise their pro-
ductivity and improve their linkages to national and
international markets.
Private investment in rural areas is important for en-
hancing livelihoods and employment. Receiving land
titles is a major constraint, as it could take more than
10 years to obtain a title to agricultural land. This dis-
courages investment and makes it difficult to use land
as collateral for bank loans. Moreover, investors in
both agriculture and agro-industries face very compli-
cated procedures and are required to obtain permits
and clearances from several different ministries and
public entities. The Ministry of Agriculture’s strategy
includes actions to simplify procedures, encourage
investment and facilitate access to credit. Those ac-
tions could be undertaken quickly and provide a signal
that the government is serious about rural develop-
ment.
Organizing small holders, providing them with exten-
sion services to increase productivity and improve
quality and linking them with local super markets as
well as exporters is an important way of raising their
incomes and helping them get out of poverty. The
SUN example discussed above demonstrates how civil
society can play a key role in this area. However, this
is just an isolated example and civil society’s role in ru-
ral development has been quite limited. As shown by
Kharas and Abdou (2012), government has not been
encouraging those activities and the legal framework
facing civil society organizations is very constrain-
ing. The Ministry of Agriculture’s strategy recognizes
the importance of developing the activities of rural
NGOs and presents proposals on how to achieve that.
It argues for new simplified legislation governing all
rural NGOs. The Ministry is also willing to provide
administrative as well as technical support to those
organizations, and help linking them with agriculture
research institutes and universities. Again, those are
actions that can be started quickly to achieve early
and tangible results.
16 GLOBAL ECONOMY AND DEVELOPMENT PROGRAM
Producer organizations are a special form of NGO
that can play an important role in strengthening the
governance system of the agriculture sector, and
particularly in developing and supporting small hold-
ers. Problems caused by the large number of very
small farms can be tackled through the development
of strong producer organizations that group farmers
together to ensure that their voice is heard in policy
discussions, and also help enhance access to technol-
ogy, inputs and markets. The lack of strong organiza-
tions representing small holders together with their
low level of political participation may explain why
development strategies and policies tend to be biased
in favor of urban activities. Independent and strong
producer organizations could play an effective advo-
cacy role and could help lobby politicians to promote
the interests of farmers. Producer organizations could
also play an important economic role, grouping farm-
ers together to enhance their access to technology
and inputs, and to improve market access and help
them retain a larger share of value added. In fact, civil
society organizations are often much better placed
than government agencies to deliver extension and
technical support to small farmers.

IMPROVING REGIONAL AND RURAL DEVELOPMENT FOR INCLUSIVE GROWTH IN EGYPT 17
CONCLUDING REMARKS AND THE ROLE OF DEVELOPMENT PARTNERS
A strategy to achieve inclusive growth in Egypt cannot
ignore the problems caused by regional inequalities
and rural poverty. This paper proposed an approach
to dealing with those issues that includes: (1) moving
to a more inclusive system of planning and budget al-
locations that would ensure that more resources flow
to lagging areas; (2) revising the social safety net sys-
tem to rely more on cash transfers that are targeted
to the poor; and (3) implementing agriculture policies
that focus on supporting small holders and linking
them to national and international markets.
Egypt’s development partners have a great deal of ex-
perience in those areas and could provide important
support to achieving inclusive growth through financ-
ing and knowledge sharing. The Japan International
Cooperation Agency is already supporting a project
on inclusive planning in Egypt. Implementation of this
project would help in improving the allocation of pub-
lic investment. The World Bank has done extensive
work on social safety nets and can support reforms in
this area. Several donors are funding agriculture de-
velopment and could scale up their interventions and
focus them on supporting small holders.
18 GLOBAL ECONOMY AND DEVELOPMENT PROGRAM
REFERENCES
Abaab, A. et al. (2000). Agricultures Familiales et
Développement Rural en Méditerranée, Editions
Karthala: Paris.
Assad, R. and Barsoum G. (2007). “Youth Exclusion in
Egypt: in Search of Second Chances,” Wolfensohn
Center for Development, The Brookings
Institution, Washington DC.
Chauffour, J. (2013). From Political to Economic
Awakening in the Arab Wor ld : The Path
of Economic Integration , The World Bank:
Washington DC.
Da Silva, J.G., Del Grossi, M. and De Franca, C. (2011).
“The Fome Zero (Zero Hunger) Program: the
Brazilian Experience,” Ministry of Agrarian
Development, Brasilia.
Ghanem H. (2013). “The Role of Micro and Small
Enterprises in Egypt’s Economic Transition,”
Global Working Paper No. 53, The Brookings
Institution, Washington DC.
Ghanem, H. and Shaikh, S. (2013). “On the Brink:
Preventing Economic Collapse and Promoting
Inclusive Growth in Egypt and Tunisia,” The
Brookings Project on US Relations with the
Islamic World, The Brookings Institution,
Washington DC.
International Monetary Fund (2010). “Arab Republic
of Egypt Article IV Consultation-Staff Report,”
Washington DC.
Kharas, H. and Abdou, E. (2012). “Regulatory Reforms
Necessary for an Inclusive Growth Model in
Egypt,” Global Views, The Brookings Institution,
Washington DC.
Ministry of Agriculture and Rural Development
(2009). “Strategy for Sustainable Agricultural
Development 2030,” Cairo.
Sakamoto, K. (2013). “Efforts to Introduce Inclusive
Planning in Egypt,” Global Working Paper No.54,
The Brookings Institution, Washington DC.
Vagliasidi, M. (2012). “Implementing Energy Subsidy
Reforms: an Overview of Key Policy Issues” Policy
Research Working Paper No. 6122, The World
Bank, Washington DC.
World Bank (2011). “Poverty in Egypt 2008-09,”
Report No. 60249-EG, Washington DC.
World Bank (2012). “Reshaping Egypt’s Economic
G e o g ra p hy : D o m est i c I n te g ra t i o n a s a
Development Platform,” Report No. 71249,
Washington DC.
The views expressed in this working paper do not necessarily reflect the official position of Brookings, its board or the advisory council members .
© 2014 The Brookings Institution
ISSN: 1939-9383
1775 Massachusetts Avenue, NW Washington, DC 20036 202-797-6000 www.brookings.edu/global