
Improving Public Transport for People with Low Vision Natalie Chan & Taku Fujiyama UCL Department of...
31
Improving Public Transport for People with Low Vision Natalie Chan & Taku Fujiyama UCL Department of Civil, Environmental and Geomatic Engineering
-
Upload
basil-flynn -
Category
Documents
-
view
215 -
download
0
Transcript of Improving Public Transport for People with Low Vision Natalie Chan & Taku Fujiyama UCL Department of...

Improving Public Transport for People with Low Vision
Natalie Chan & Taku Fujiyama
UCL Department of Civil, Environmental and Geomatic Engineering

Presentation Overview
Transport Institute in the Civil, Environmental and Geomatic Engineering Department
Presentation will be in 2 parts:
1. Investigating public transport for people with low vision
2. London Underground – Platform humps
Investigating Public Transport use for people with low vision
Natalie Chan
UCL Department of Civil, Environmental and Geomatic Engineering

Introduction
Transport is vital for access to key activities, services and facilities
Inability to use public transport may result in increased social isolation
It is important that every aspect of a journey is accessible
Even if a small part of the journey is not manageable, the whole “journey chain” is broken

Journey ChainOrigin
Walking to bus stop
Reading bus number
Boarding
BusManoeuvring
on bus
Alighting bus
Destination
Journey chain for a
bus journey
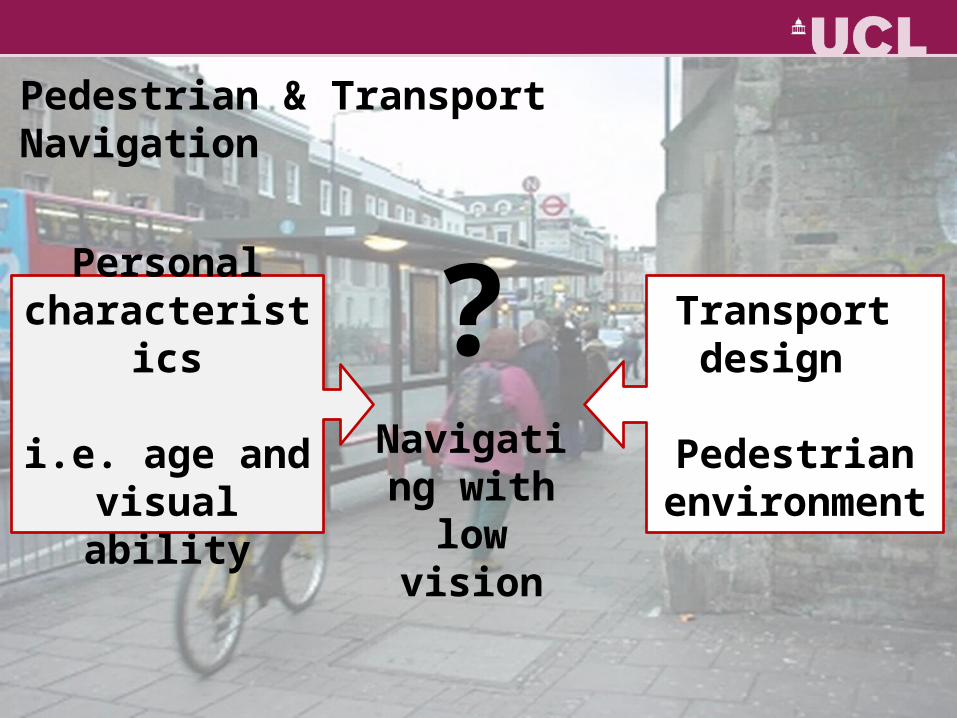
Pedestrian & Transport Navigation
Transport design
Pedestrianenvironment
Personal characteristics
i.e. age and visual ability
? Navigating
with low vision
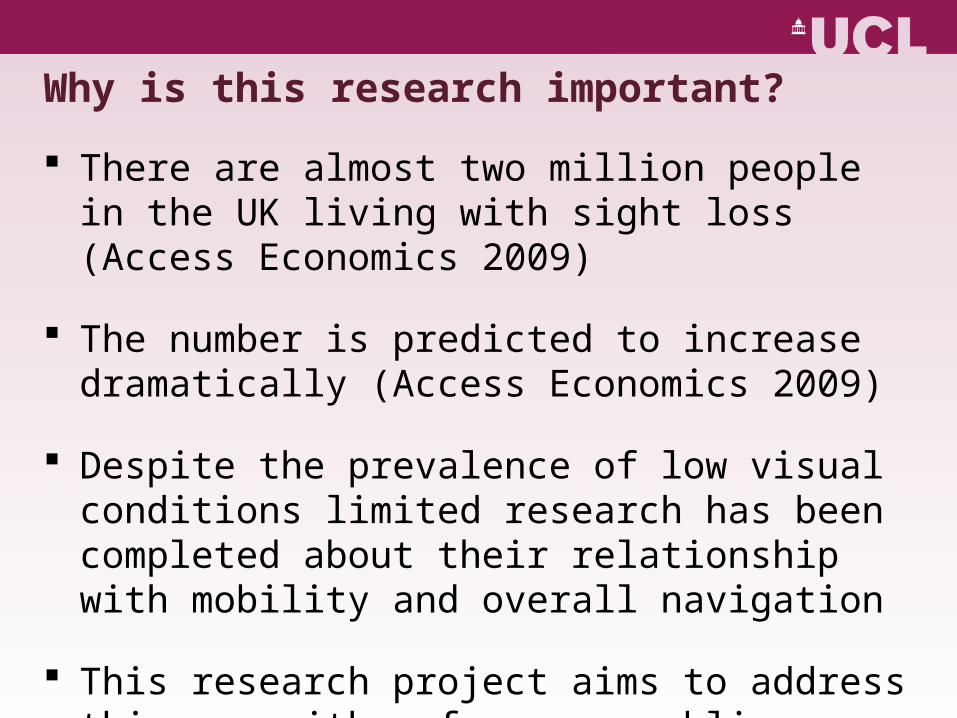
Why is this research important?
There are almost two million people in the UK living with sight loss (Access Economics 2009)
The number is predicted to increase dramatically (Access Economics 2009)
Despite the prevalence of low visual conditions limited research has been completed about their relationship with mobility and overall navigation
This research project aims to address this gap with a focus on public transport
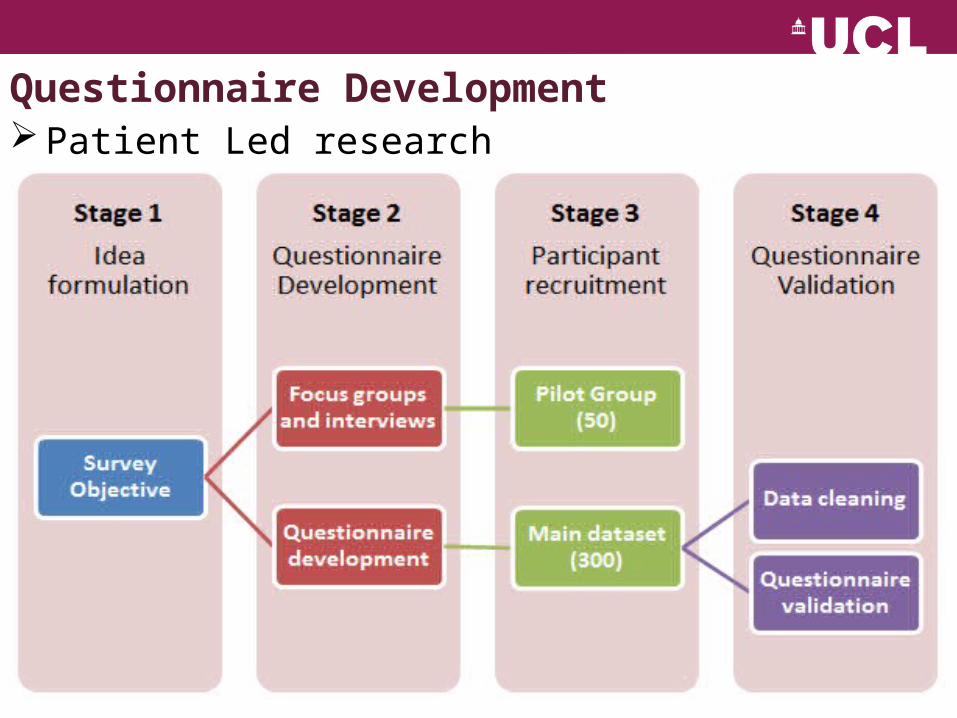
Questionnaire Development Patient Led research

Life Space Patterns
Conceptual levels in a Life-Space Model (Peel et al. 2005)
Life Space measures the extent and frequency of travel
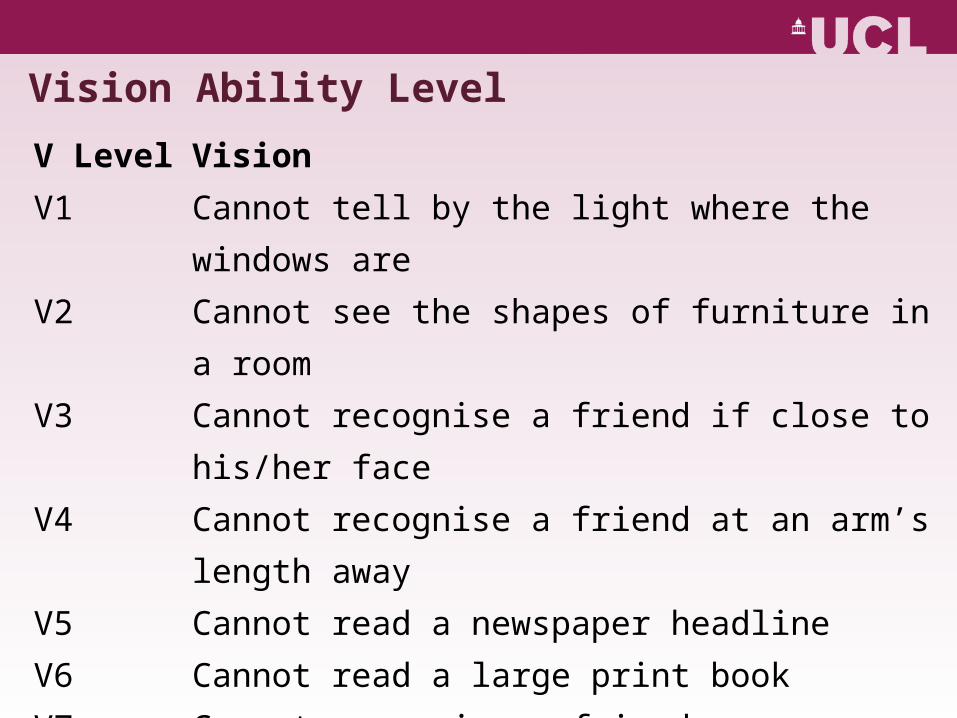
Vision Ability Level
V Level Vision
V1 Cannot tell by the light where the windows are
V2 Cannot see the shapes of furniture in a room
V3 Cannot recognise a friend if close to his/her face
V4 Cannot recognise a friend at an arm’s length away
V5 Cannot read a newspaper headline
V6 Cannot read a large print book
V7 Cannot recognise a friend across a room
V8 Has difficulty recognising a friend across the road
V9 Has difficulty reading ordinary newspaper print
V10 Full vision ability

Item Person Fit
A technique called Rasch Analysis was used to validate and analyse the questionnaire
Each person was generated a Transport Difficulty Score (Rasch Score) and each item was generated a Transport Difficulty Score (Rasch Measure)
These scores were calculated by accounting for participant ability in relation to task difficulty
The difference between these scores allow us to calculate the probability of a person being able to complete that task
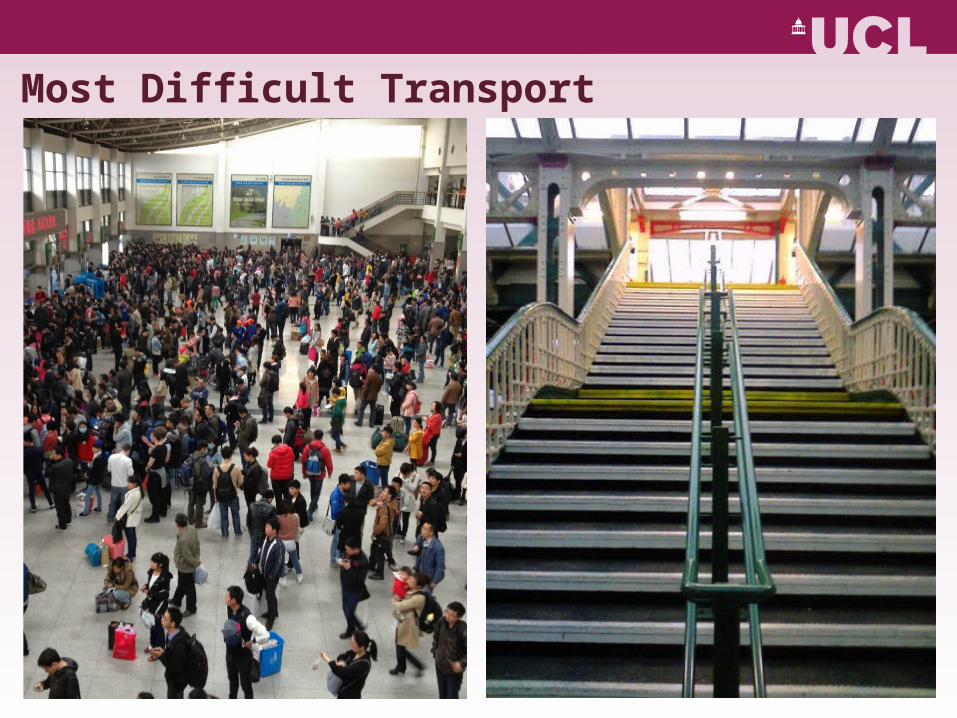
Most Difficult Transport Related Tasks
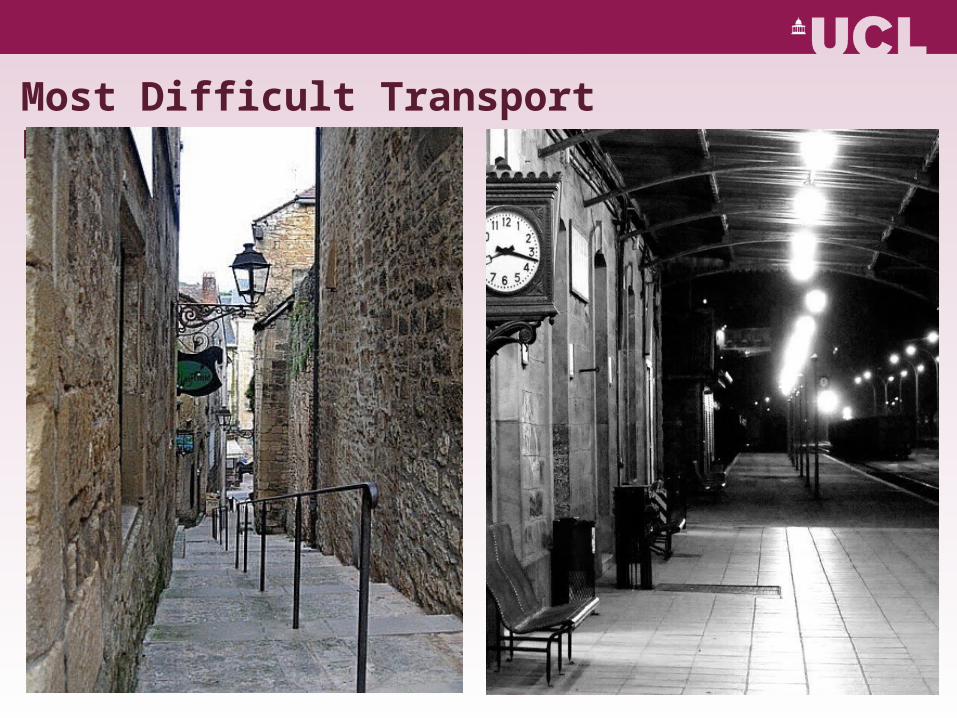
Most Difficult Transport Related Tasks
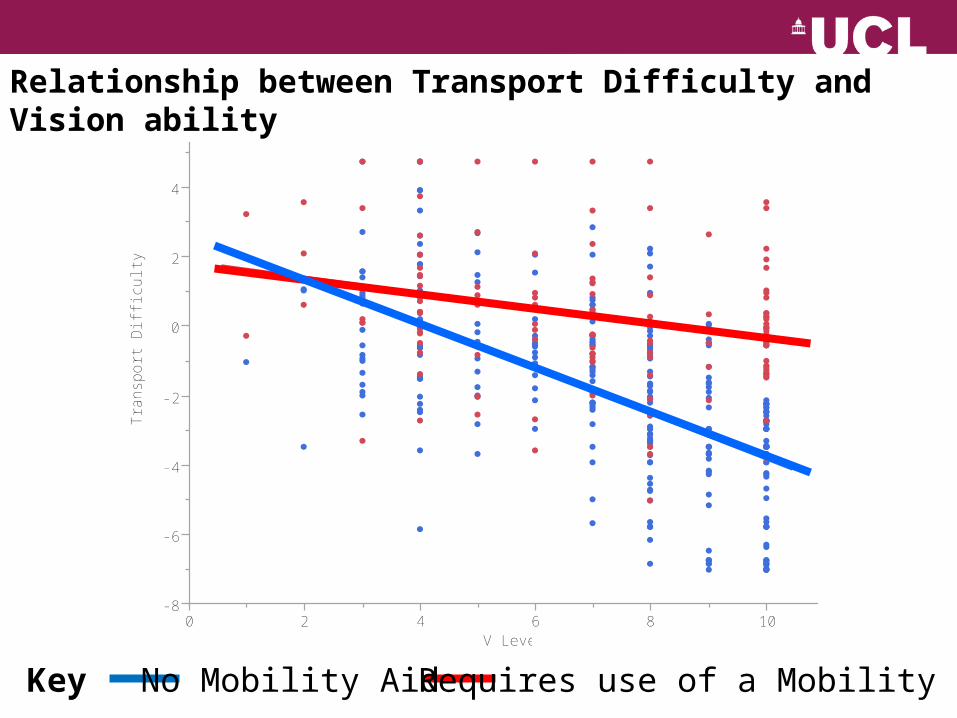
Relationship between Transport Difficulty and Vision ability
Tran
sport
Diffi
culty
-8
-6
-4
-2
0
2
4
6
0 2 4 6 8 10V Level
Requires use of a Mobility AidNo Mobility AidKey
Relationship between Transport Difficulty and Vision ability
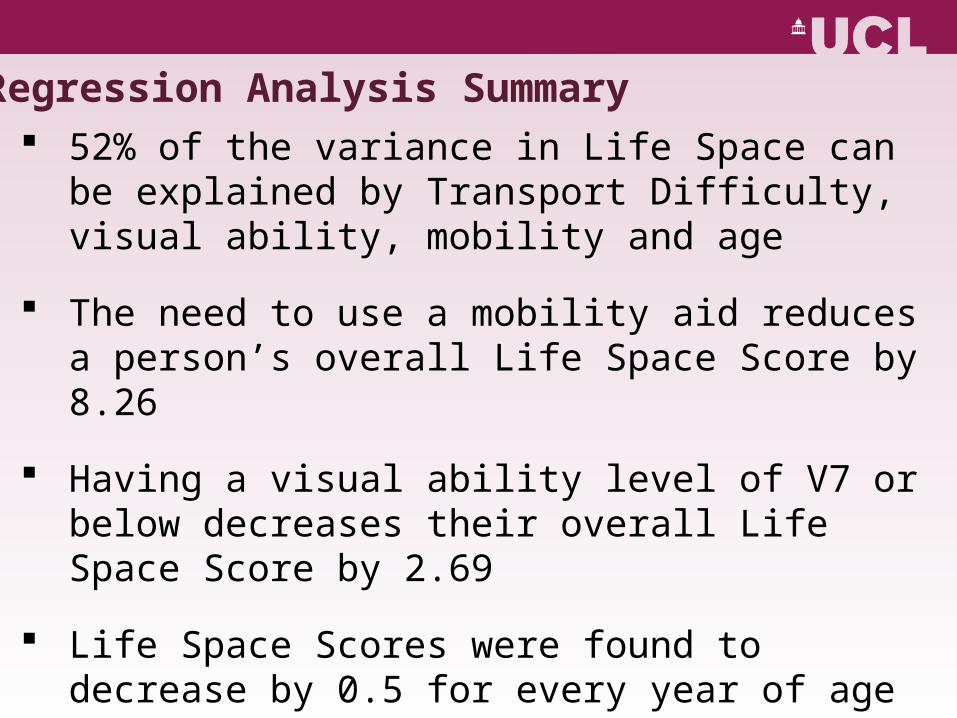
Regression Analysis Summary 52% of the variance in Life Space can be explained
by Transport Difficulty, visual ability, mobility and age
The need to use a mobility aid reduces a person’s overall Life Space Score by 8.26
Having a visual ability level of V7 or below decreases their overall Life Space Score by 2.69
Life Space Scores were found to decrease by 0.5 for every year of age
Overall Transport Difficulty levels were shown to help predict Life Space Patterns

Research Summary This study is one of the first to investigate the
relationship between low vision and mobility within a detailed public transport context
People who experience high levels of difficulty when using public transport have lower life Space scores
The effect of vision loss on transport difficulty is greater in those who require a mobility aid
This study has highlighted the most difficult tasks relating to public transport and low vision navigation that require further research and solutions
Future Research & Implications
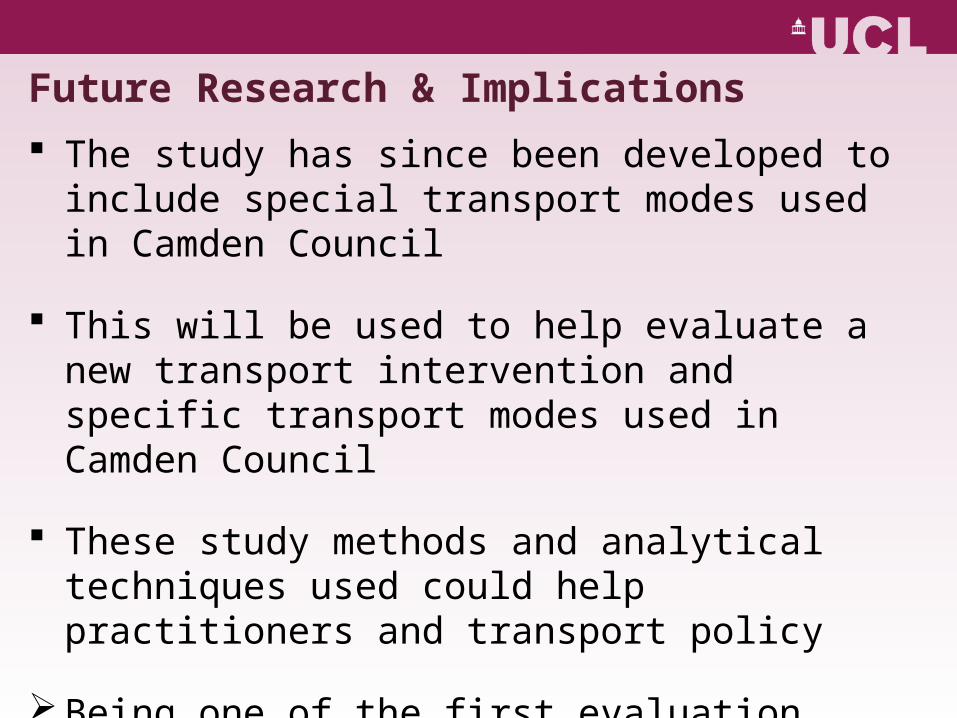
The study has since been developed to include special transport modes used in Camden Council
This will be used to help evaluate a new transport intervention and specific transport modes used in Camden Council
These study methods and analytical techniques used could help practitioners and transport policy
Being one of the first evaluation techniques to account for the entire journey chain and individual ability levels
London Underground Platform Hump
Taku Fujiyama
UCL Department of Civil, Environmental and Geomatic Engineering

Gaps between the train and the platform
Hazards which could cause serious accidents

How to solve the problem
It would be difficult to remove horizontal gaps But possible to remove vertical gaps
Platform
Train
Humps (Lisbon Metro)

Project
London Underground decided to install platform humps across its networks
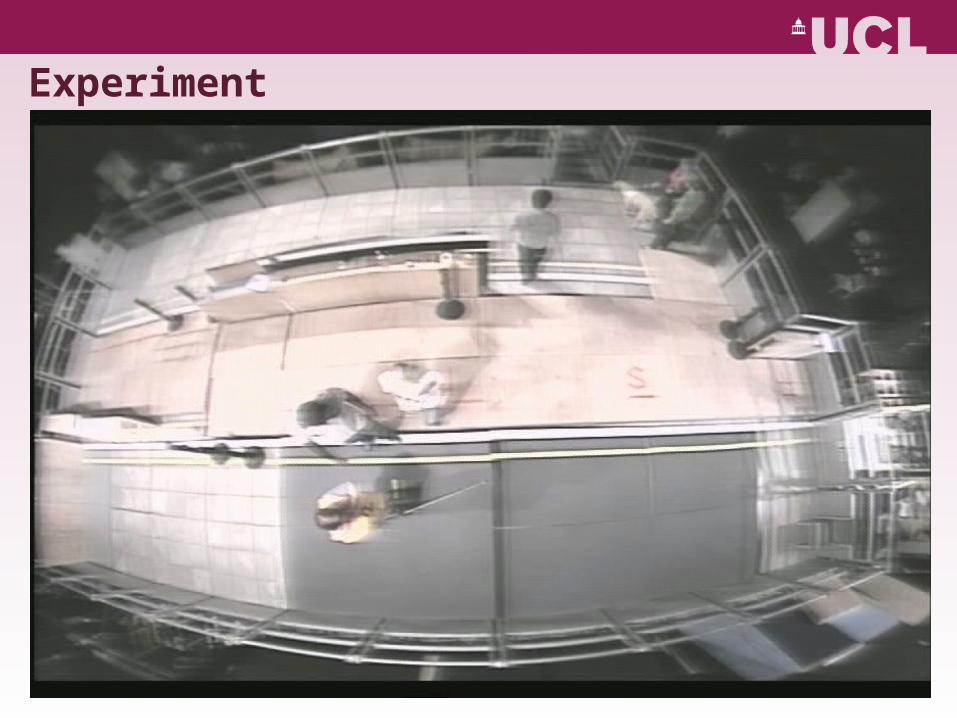
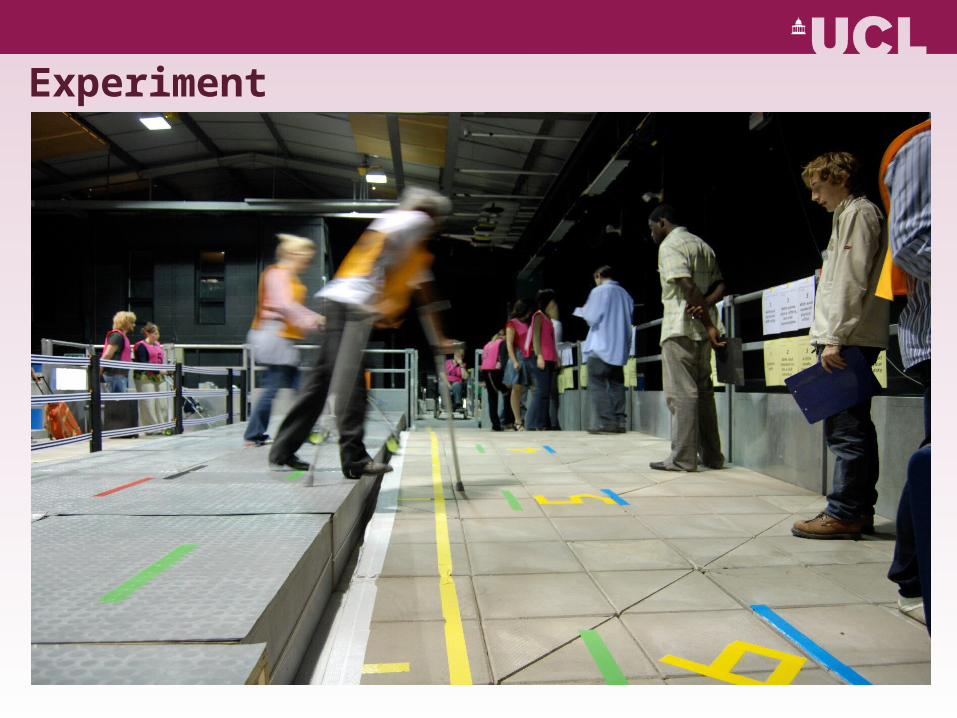
In order to decide design details, LU asked us to run experiments
At UCL PAMELA, we tested Slope and cross fall gradientsSurface colourStepping onto a sloped platform
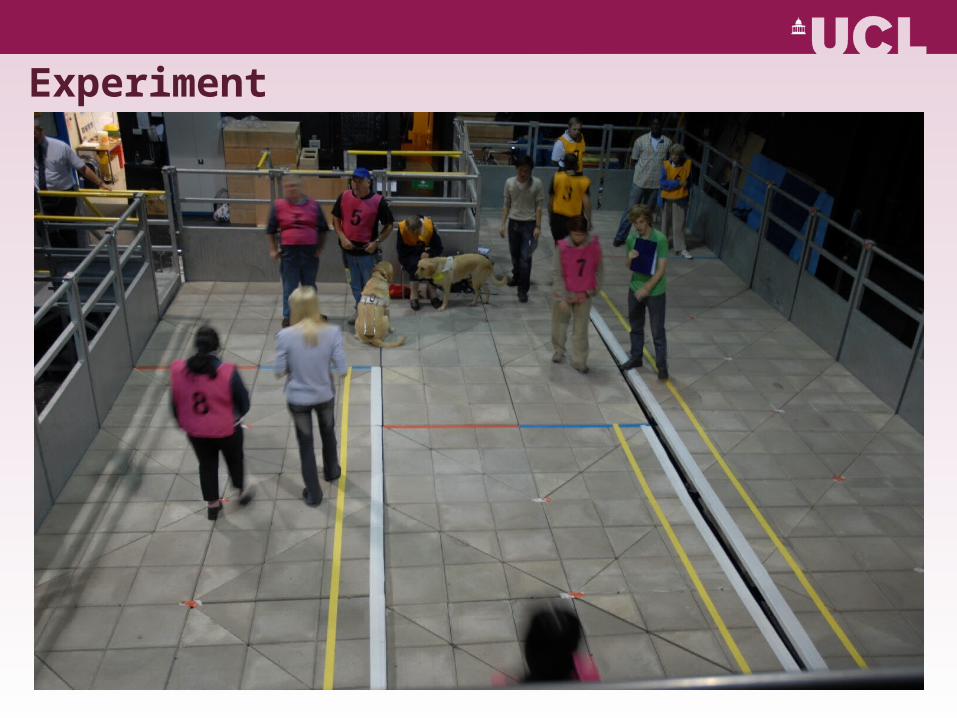
Experiment
Experiment

Experiment
Experiment
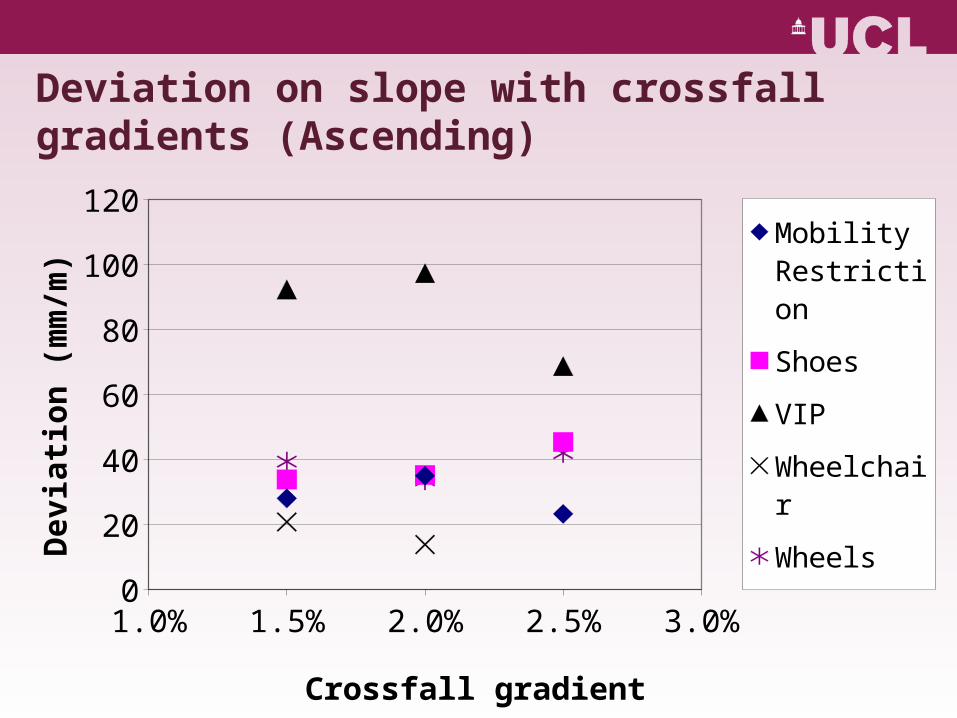
Deviation on slope with crossfall gradients (Ascending)
1.0% 1.5% 2.0% 2.5% 3.0%0
20
40
60
80
100
120
Mobility Restriction
Shoes
VIP
Wheelchair
Wheels
Crossfall gradient
De
via
tio
n (
mm
/m)
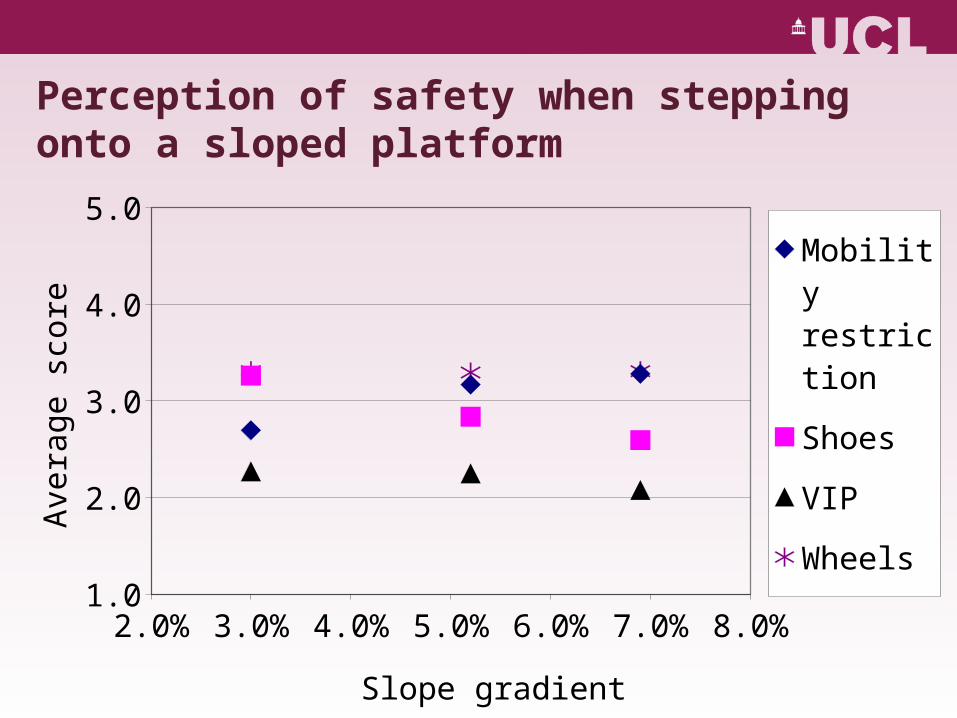
Perception of safety when stepping onto a sloped platform
2.0% 3.0% 4.0% 5.0% 6.0% 7.0% 8.0%1.0
2.0
3.0
4.0
5.0
Mobility restriction
Shoes
VIP
Wheels
Slope gradient
Ave
rag
e s
core
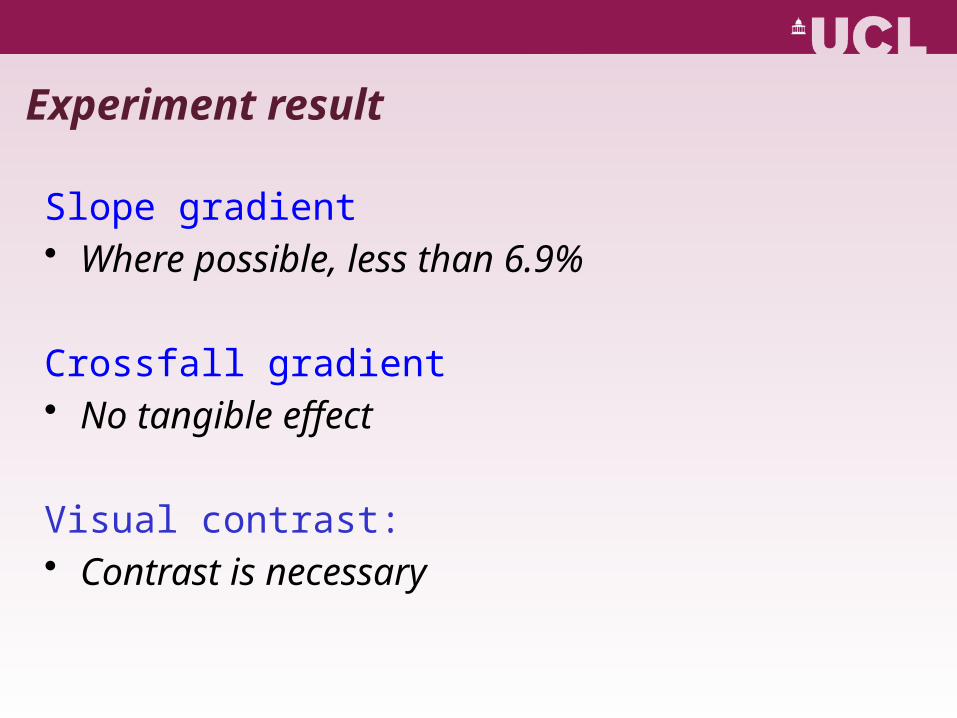
Experiment result
Slope gradient • Where possible, less than 6.9%
Crossfall gradient • No tangible effect
Visual contrast: • Contrast is necessary
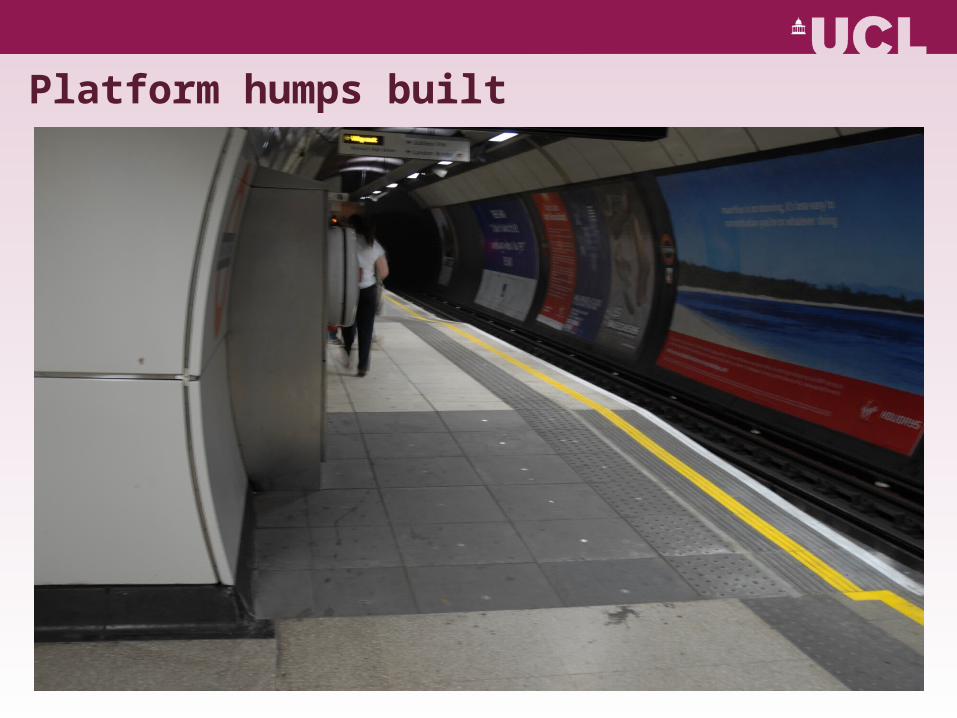
Platform humps built
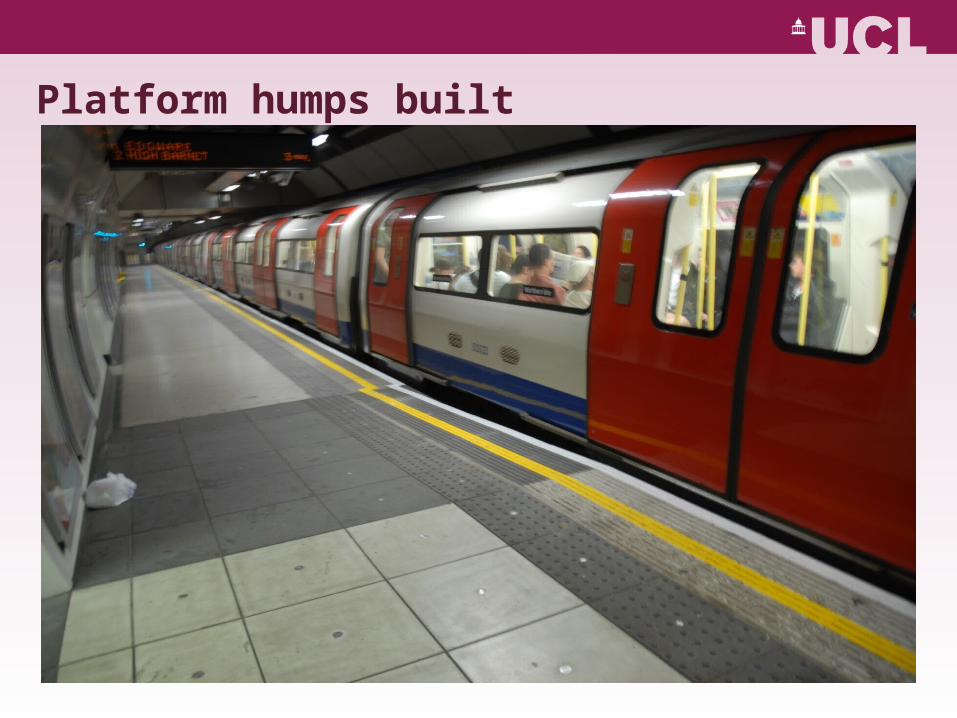
Platform humps built
Thank you for listening!
Taku Fujiyama & Natalie Chan
UCL Civil, Environmental and
Geomatic Engineering


