Improving Pipeline Management with Mobile and Web … · Improving Pipeline Management with Mobile...
25
Improving Pipeline Management with Mobile and Web Based GIS Jeff Coffey, TRWD Fernando DeVivo, TRWD Robert Finkle, IT Nexus Brian Besier, IT Nexus
Transcript of Improving Pipeline Management with Mobile and Web … · Improving Pipeline Management with Mobile...

Improving Pipeline Management with Mobile and Web Based GIS
Jeff Coffey, TRWDFernando DeVivo, TRWDRobert Finkle, IT NexusBrian Besier, IT Nexus


• Utilities/Asset Mgmt.
• Property Mgmt & Land Acquisition.
• Hydrologic Modeling & Studies.
• Floodway Maintenance Mgmt.
• Future Water Supply Studies.
• Lake and Shoreline Mgmt.
• Provide GIS support to Real Estate, Environmental, Engineering, & Operations Divisions through desktop, mobile and web based mapping applications
Use of GIS at TRWD

GIS and TRWD Pipeline Operations

• Pipeline system consists of 180+ miles of underground largediameter (72”-108”) PCCP and steel pipes. Approximately 34,000 individual 20’-24’ pipe segments.
• Approximately 800 appurtenances (valves and manholes) and 700 cathodic protection test stations
• 15 full time field pipeline operators, and up to an additional 20-40 personnel assigned to pipeline during repairs/breaks
• Multiple TRWD Departmental Stakeholders:
- Engineering: Design, Integrity, Water Supply, Operations- Real Property: Permitting, Land Acquisition, Notifications- Western\Eastern Operations: Maintenance, Operations
TRWD Pipeline Operations Overview

As-Built Plans (Dated 1972)
TRWD GIS Pipeline Operations

Benefits of a GIS Approach

• A centralized, enterprise geodatabase of pipeline features was very beneficial, but having “just” a database didn’t address all information management challenges.
• Business-driven desktop, web, and mobile applications were needed to bridge the information gap between field workforce and office personnel.
TRWD Pipeline Operations
Field Office
GIS Data Collection
GIS Data Support
TRWD Pipeline Information Flow

TRWD FieldMapper
• A customizable, modular field mapping application developed for field data viewing, collection, and remote geodatabasesynchronization
• Ability to add “modules” or “extensions” for business-specific functions
TRWD Pipeline Operations
TRWD Mobile Field
Mapping System

TRWD Mobile Field Mapping System

Primary Elements of the TRWD Pipeline Cathodic Protection Program
Anodes
Test Station
Anode Wires
ROW Boundary
X X X X
TriCorderInstrument
Sampling Wand
Test Station
Copper Wire
10 Ft. Increment
TRWD Pipeline
0.25X: 2324567Y:7874562
(Wire Spool)
1) Cathodic Protection Features
2) Analyses of System Performance
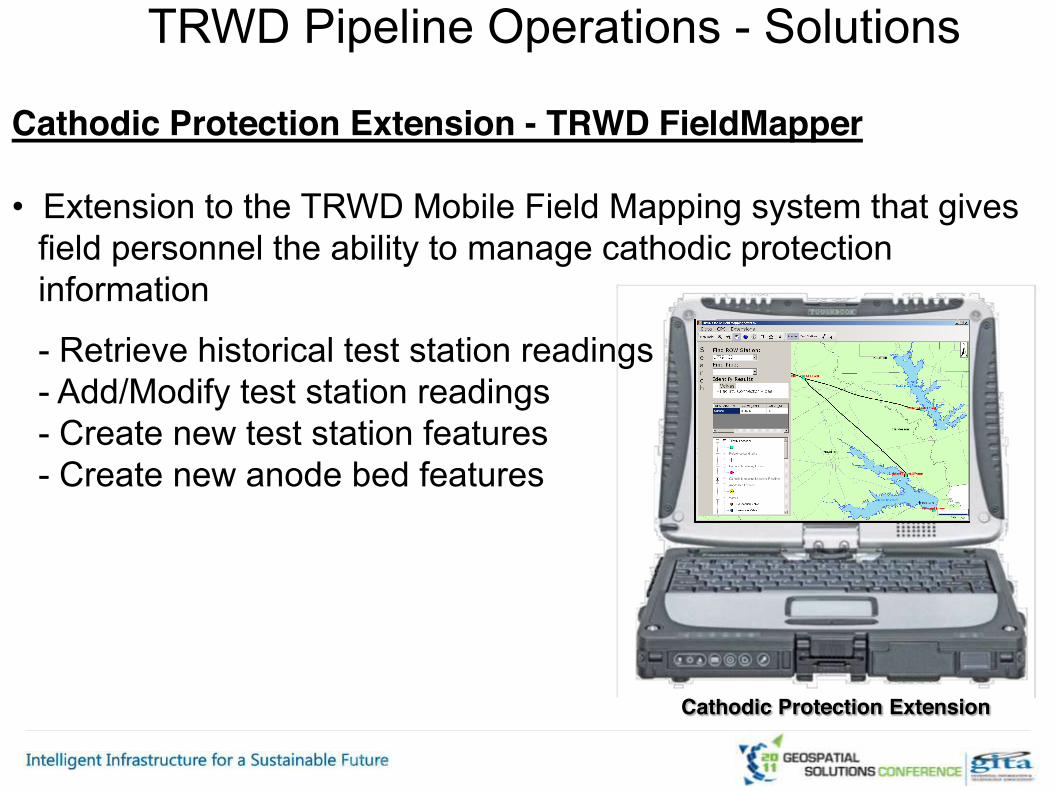
Cathodic Protection Extension - TRWD FieldMapper
• Extension to the TRWD Mobile Field Mapping system that gives field personnel the ability to manage cathodic protection information
- Retrieve historical test station readings- Add/Modify test station readings- Create new test station features- Create new anode bed features
TRWD Pipeline Operations - Solutions
Cathodic Protection Extension

TRWD Cathodic Protection Extension
- Add New Anode Bed- Edit Existing Anode Bed
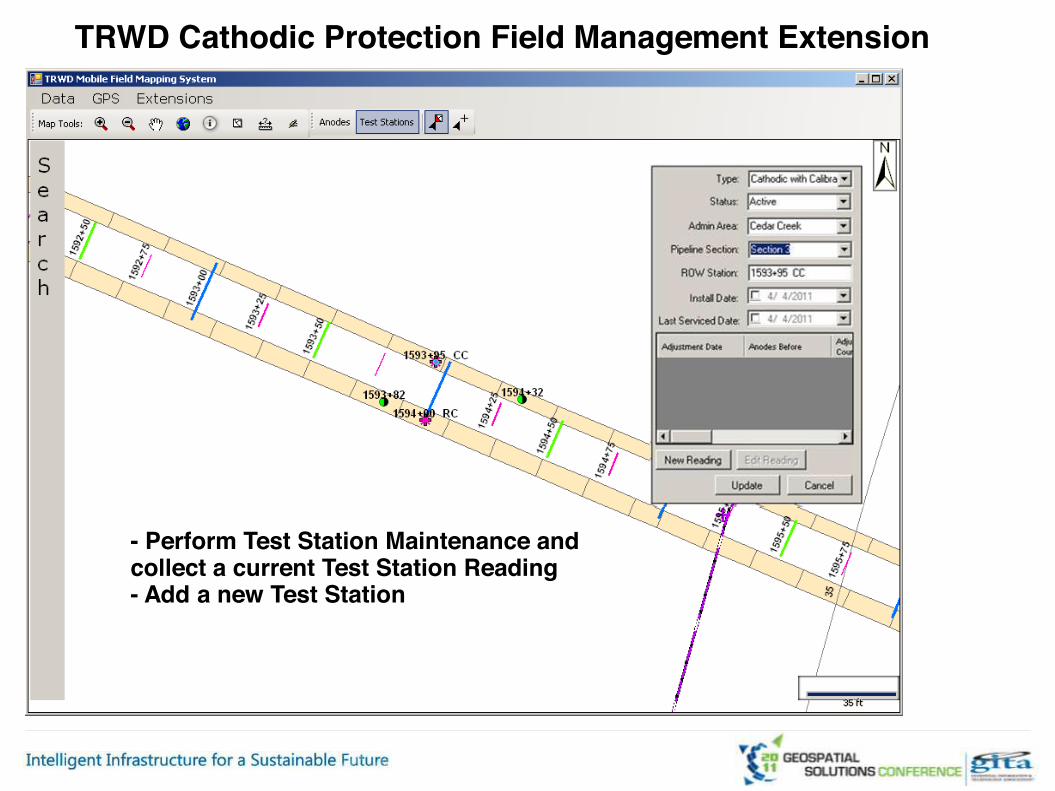
- Perform Test Station Maintenance and collect a current Test Station Reading- Add a new Test Station
TRWD Cathodic Protection Field Management Extension

TRWD Pipeline Operations - Solutions
Pipe to Soil Data Management Toolsa) Import Toolb) Pipe to Soil Visualization Tool

Sampling Wand
Hexcorder
Copper WireSpool
Wire DispensingUnit
Test Station
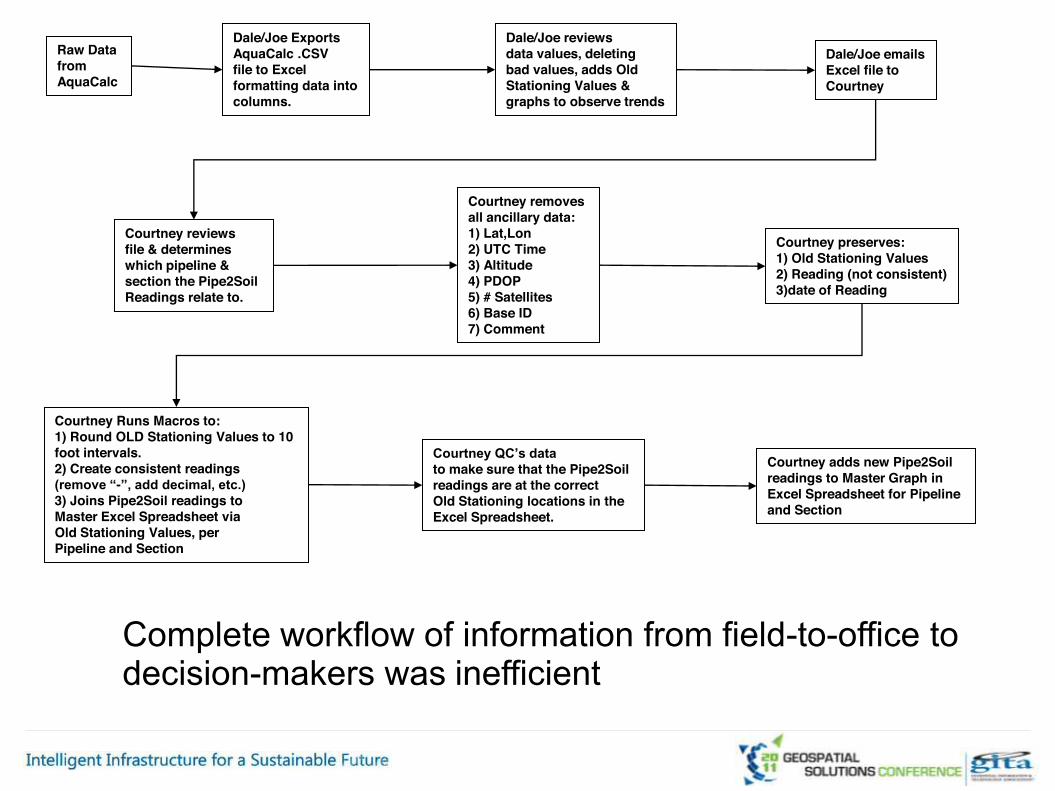
Raw Data from AquaCalc
Dale/Joe ExportsAquaCalc .CSVfile to Excel formatting data intocolumns.
Dale/Joe emailsExcel file to Courtney
Dale/Joe reviews data values, deleting bad values, adds Old Stationing Values & graphs to observe trends
Courtney reviews file & determines which pipeline & section the Pipe2Soil Readings relate to.
Courtney removes all ancillary data: 1) Lat,Lon2) UTC Time3) Altitude4) PDOP5) # Satellites6) Base ID7) Comment
Courtney preserves:1) Old Stationing Values2) Reading (not consistent)3)date of Reading
Courtney Runs Macros to:1) Round OLD Stationing Values to 10 foot intervals.2) Create consistent readings (remove “-”, add decimal, etc.)3) Joins Pipe2Soil readings to Master Excel Spreadsheet via Old Stationing Values, per Pipeline and Section
Courtney QC’s datato make sure that the Pipe2Soil readings are at the correct Old Stationing locations in the Excel Spreadsheet.
Courtney adds new Pipe2Soil readings to Master Graph in Excel Spreadsheet for Pipeline and Section
Complete workflow of information from field-to-office to decision-makers was inefficient
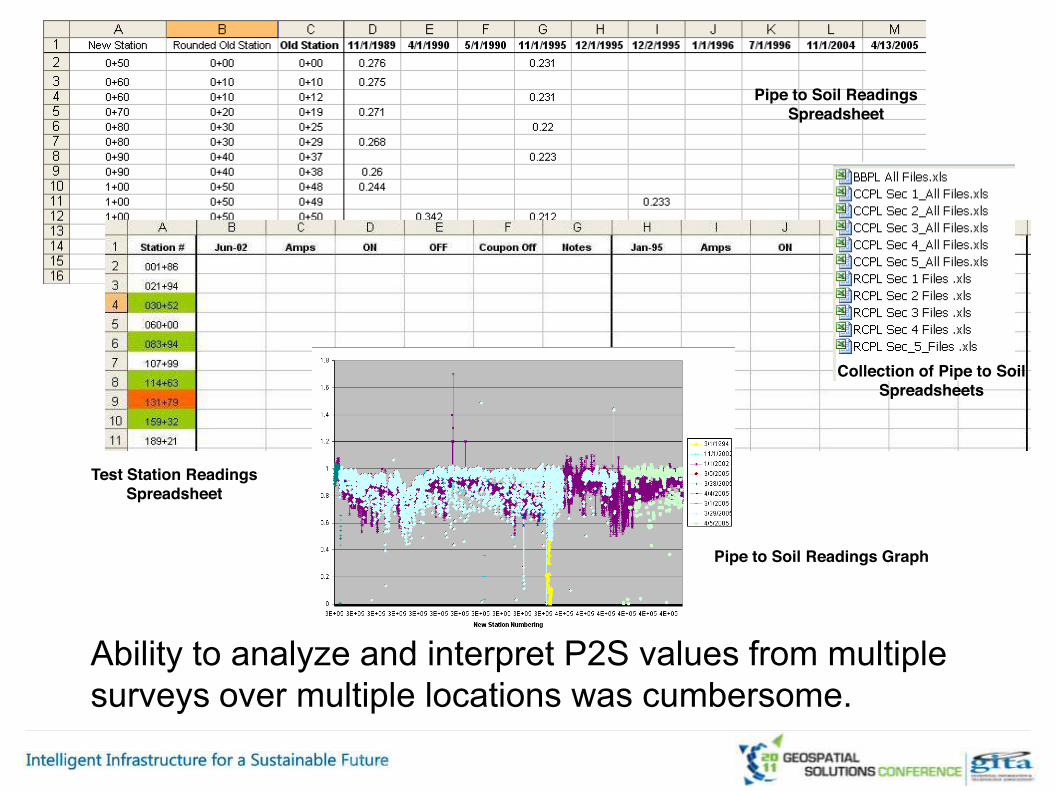
Ability to analyze and interpret P2S values from multiple surveys over multiple locations was cumbersome.
Collection of Pipe to Soil Spreadsheets
Pipe to Soil Readings Graph
Pipe to Soil Readings Spreadsheet
Test Station Readings Spreadsheet

Pipe To Soil Data Storage and Management
CollectedPipe 2 Soil
Data13
13
13
13
13
13

Pipe to Soil Data Input
Component
Pipe to Soil Data VisualizationComponent
TRWD Pipeline Geodatabase
CollectedPipe 2 Soil
Data
Finalized Pipe to Soil Data Management Strategy
Cathodic Protection Data Management Tools
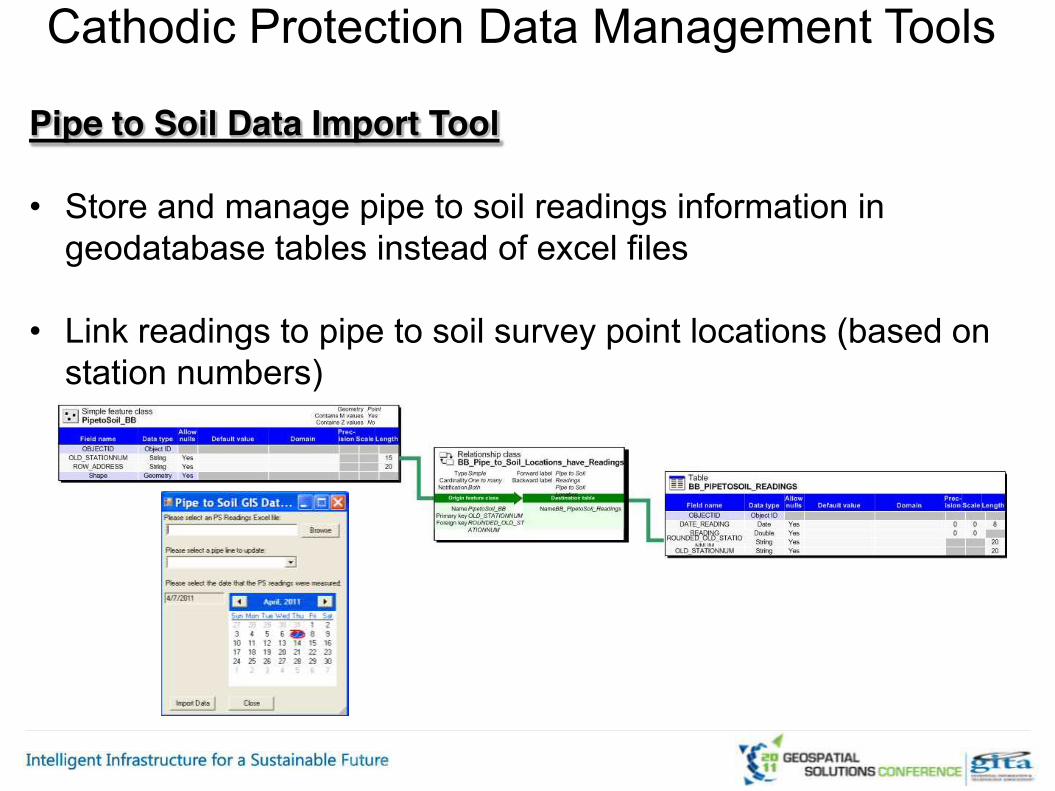
Pipe to Soil Data Import Tool
• Store and manage pipe to soil readings information in geodatabase tables instead of excel files
• Link readings to pipe to soil survey point locations (based on station numbers)
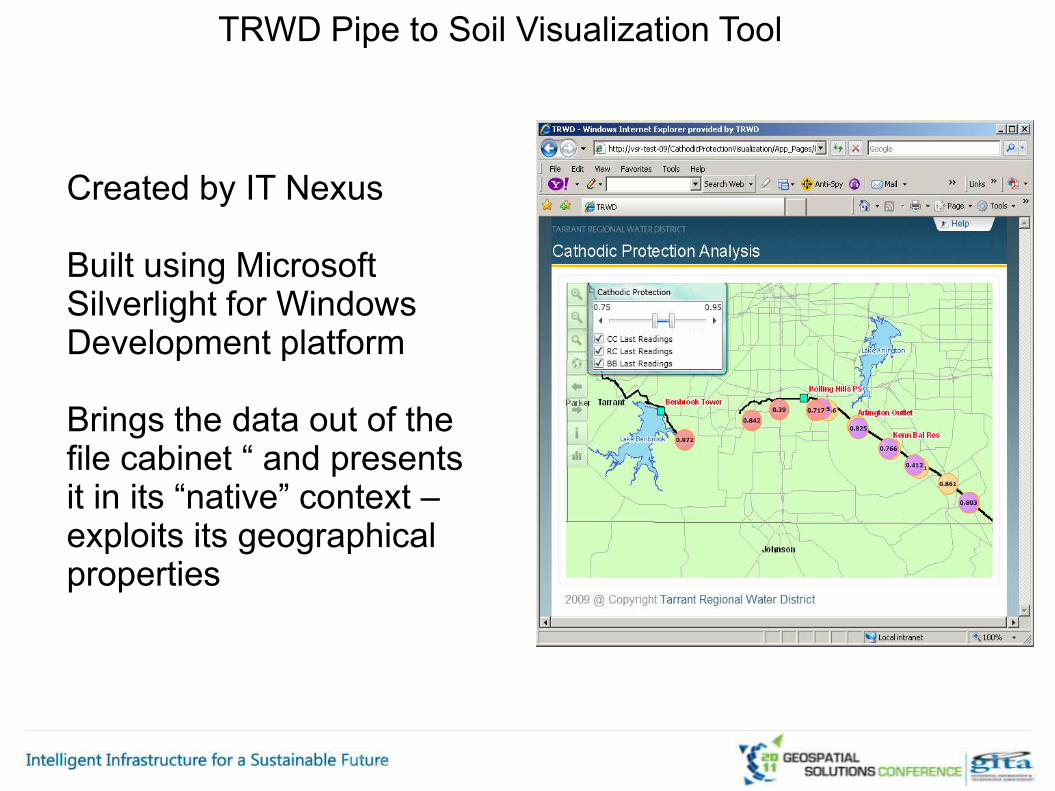
TRWD Pipe to Soil Visualization Tool
Created by IT Nexus
Built using MicrosoftSilverlight for Windows Development platform
Brings the data out of the file cabinet “ and presents it in its “native” context –exploits its geographical properties

TRWD P2S Visualization Tool Demonstration

ConclusionGIS is greatly benefitting the management of the Pipeline System by enhancing the data collection, management, and coordination opportunities by District staff.
The ability of District Staff to utilize the TRWD FieldMapper to locate, document and redline pipeline system features is helping to keep the TRWD Pipeline model accurate, timely and cost effective.
The adoption and utilization of mainstream software development technology is driving down the cost of custom software development while continuing to provide very useful tools.
The use of GIS technology at TRWD continues to empower the organization, and optimize it’s operation of the TRWD Pipelines.