Improving performance of luminescent nanothermometers ...
8
Nanoscale PAPER Cite this: Nanoscale, 2021, 13, 14139 Received 3rd March 2021, Accepted 19th July 2021 DOI: 10.1039/d1nr01395e rsc.li/nanoscale Improving performance of luminescent nanothermometers based on non-thermally and thermally coupled levels of lanthanides by modulating laser power† Natalia Stopikowska, Marcin Runowski, * Małgorzata Skwierczyńska and Stefan Lis This work sheds light on the pump power impact on the performance of luminescent thermometers, which is often underestimated by researchers. An up-converting, inorganic nanoluminophore, YVO 4 :Yb 3+ , Er 3+ (nanothermometer) was synthesized using the hydrothermal method and a subsequent calcination. This nanomaterial appears as a white powder composed of small nanoparticles (≈20 nm), exhibiting a very intense, green upconverted luminescence (λ ex = 975 nm), visible to the naked eye. Its emission spec- trum consists of four Er 3+ bands (500–850 nm) and one Yb 3+ band (>900 nm). The obtained compound exhibits temperature-dependent luminescence properties, hence it is used as an optical nanosensor of temperature. The determined band intensity ratios of the non-thermally coupled levels (non-TCLs) of Yb 3+ /Er 3+ and thermally coupled levels (TCLs) of Er 3+ are correlated with temperature, and they are used for ratiometric sensing of temperature. The effects of the pump (NIR laser) power on the luminescence properties of the material, including band intensity ratios, absolute and relative sensitivities and tempera- ture resolution are analysed. It was pointed out that the applied laser power has a huge impact on the values of the aforementioned thermometric parameters, and manipulating the laser power can signifi- cantly improve the performance of optical nanothermometers. Introduction The most commonly developed luminescent sensors of temp- erature are based on lanthanide (Ln) ions, such as Yb 3+ , Er 3+ , Tm 3+ , Ho 3+ and Nd 3+ embedded in various matrices (e.g. Gd 2 O 3 , Al 2 O 3 , YF 3 , YVO 4 and NaYF 4 ). 1–9 These ions exhibit unique luminescence properties, i.e. long luminescence life- times, narrow emission bands, multi-range emission, as well as the possibility of various energy migration processes between co-dopant ions. 10–14 The systems based on up-conversion (two-photon) lumine- scence are particularly attractive from the point of view of bio- logical research. They enable excitation of the material in the NIR range of the 1st (650–950 nm) or 2nd (1000–1350 nm) bio- logical window (e.g. by Yb 3+ excitation), 1 and detection of emis- sions in the 1st biological window (e.g. emission of Er 3+ , Tm 3+ , Ho 3+ or Nd 3+ ). 1–4,9,11,12,15–19 Emission and excitation in the bio- logical window ranges result in less absorption and scattering of light by tissues such as skin and blood. 1,15,16,18,20–22 In contrast, using conventional luminescence, where excitation often takes place in the UV or visible spectral range, a significant part of the radiation may be absorbed/scattered by the surrounding medium, diminishing excitation effectiveness of the ions embedded into the structure of such nanothermometers. 5,20 However, for temperature nanosensors used in other appli- cations, e.g. in catalysis and optoelectronics, alike excitation and emission can take place over the entire spectral range. 23–25 Optical sensors based on Ln ions usually enable tempera- ture control based on the analysis of changes in the intensity ratios of the bands associated with their thermally and non- thermally coupled levels (TCLs and non-TCLs). In the case of two thermalized levels, where the energy of these levels does not differ too much (up to ≈2000 cm −1 ), due to additional thermal energy, the photon may move from the level with lower energy to the level with higher energy. This will result in a decrease in the intensity of the lower energy band and the † Electronic supplementary information (ESI) available: Transmission data for the optical filter used; normalized emission spectra measured at increasing temperature; non-normalized emission spectra measured at increasing tempera- ture; integrated luminescence intensities as a function of temperature; log–log dependence of the luminescence intensity on the laser power; and thermal cycling experiments. See DOI: 10.1039/d1nr01395e Adam Mickiewicz University, Faculty of Chemistry, Department of Rare Earths, Uniwersytetu Poznańskiego 8, 61-614 Poznań, Poland. E-mail: [email protected] ; Tel: +48618291778 This journal is © The Royal Society of Chemistry 2021 Nanoscale, 2021, 13, 14139–14146 | 14139 Open Access Article. Published on 22 July 2021. Downloaded on 3/24/2022 2:31:36 AM. This article is licensed under a Creative Commons Attribution 3.0 Unported Licence. View Article Online View Journal | View Issue
Transcript of Improving performance of luminescent nanothermometers ...
Nanoscale
PAPER
Cite this: Nanoscale, 2021, 13, 14139
Received 3rd March 2021,Accepted 19th July 2021
DOI: 10.1039/d1nr01395e
rsc.li/nanoscale
Improving performance of luminescentnanothermometers based on non-thermally andthermally coupled levels of lanthanides bymodulating laser power†
Natalia Stopikowska, Marcin Runowski, * Małgorzata Skwierczyńska andStefan Lis
This work sheds light on the pump power impact on the performance of luminescent thermometers,
which is often underestimated by researchers. An up-converting, inorganic nanoluminophore, YVO4:Yb3+,
Er3+ (nanothermometer) was synthesized using the hydrothermal method and a subsequent calcination.
This nanomaterial appears as a white powder composed of small nanoparticles (≈20 nm), exhibiting a
very intense, green upconverted luminescence (λex = 975 nm), visible to the naked eye. Its emission spec-
trum consists of four Er3+ bands (500–850 nm) and one Yb3+ band (>900 nm). The obtained compound
exhibits temperature-dependent luminescence properties, hence it is used as an optical nanosensor of
temperature. The determined band intensity ratios of the non-thermally coupled levels (non-TCLs) of
Yb3+/Er3+ and thermally coupled levels (TCLs) of Er3+ are correlated with temperature, and they are used
for ratiometric sensing of temperature. The effects of the pump (NIR laser) power on the luminescence
properties of the material, including band intensity ratios, absolute and relative sensitivities and tempera-
ture resolution are analysed. It was pointed out that the applied laser power has a huge impact on the
values of the aforementioned thermometric parameters, and manipulating the laser power can signifi-
cantly improve the performance of optical nanothermometers.
Introduction
The most commonly developed luminescent sensors of temp-erature are based on lanthanide (Ln) ions, such as Yb3+, Er3+,Tm3+, Ho3+ and Nd3+ embedded in various matrices (e.g.Gd2O3, Al2O3, YF3, YVO4 and NaYF4).
1–9 These ions exhibitunique luminescence properties, i.e. long luminescence life-times, narrow emission bands, multi-range emission, as wellas the possibility of various energy migration processesbetween co-dopant ions.10–14
The systems based on up-conversion (two-photon) lumine-scence are particularly attractive from the point of view of bio-logical research. They enable excitation of the material in the
NIR range of the 1st (650–950 nm) or 2nd (1000–1350 nm) bio-logical window (e.g. by Yb3+ excitation),1 and detection of emis-sions in the 1st biological window (e.g. emission of Er3+, Tm3+,Ho3+ or Nd3+).1–4,9,11,12,15–19 Emission and excitation in the bio-logical window ranges result in less absorption and scattering oflight by tissues such as skin and blood.1,15,16,18,20–22 In contrast,using conventional luminescence, where excitation often takesplace in the UV or visible spectral range, a significant part of theradiation may be absorbed/scattered by the surroundingmedium, diminishing excitation effectiveness of the ionsembedded into the structure of such nanothermometers.5,20
However, for temperature nanosensors used in other appli-cations, e.g. in catalysis and optoelectronics, alike excitation andemission can take place over the entire spectral range.23–25
Optical sensors based on Ln ions usually enable tempera-ture control based on the analysis of changes in the intensityratios of the bands associated with their thermally and non-thermally coupled levels (TCLs and non-TCLs). In the case oftwo thermalized levels, where the energy of these levels doesnot differ too much (up to ≈2000 cm−1), due to additionalthermal energy, the photon may move from the level withlower energy to the level with higher energy. This will result ina decrease in the intensity of the lower energy band and the
†Electronic supplementary information (ESI) available: Transmission data forthe optical filter used; normalized emission spectra measured at increasingtemperature; non-normalized emission spectra measured at increasing tempera-ture; integrated luminescence intensities as a function of temperature; log–logdependence of the luminescence intensity on the laser power; and thermalcycling experiments. See DOI: 10.1039/d1nr01395e
Adam Mickiewicz University, Faculty of Chemistry, Department of Rare Earths,
Uniwersytetu Poznańskiego 8, 61-614 Poznań, Poland. E-mail: [email protected]
; Tel: +48618291778
This journal is © The Royal Society of Chemistry 2021 Nanoscale, 2021, 13, 14139–14146 | 14139
Ope
n A
cces
s A
rtic
le. P
ublis
hed
on 2
2 Ju
ly 2
021.
Dow
nloa
ded
on 3
/24/
2022
2:3
1:36
AM
. T
his
artic
le is
lice
nsed
und
er a
Cre
ativ
e C
omm
ons
Attr
ibut
ion
3.0
Unp
orte
d L
icen
ce.
View Article OnlineView Journal | View Issue
appearance (or increase in the intensity) of a higher energy bandin the emission spectrum.13,20,22,26,27 The Boltzmann type sensorsbased on the thermalized levels are already well-known, as theyhave been extensively investigated in the last decade.12,14,28–30
However, there are some recent reports on deviations from theBoltzmann distribution in TCLs, which are concentration- ortemperature-dependent.31,32 On the other hand, luminescentthermometers based on non-TCLs, which take advantages oftemperature-dependent rates of quenching/energy transfer, arealso becoming more and more popular.8,20,33–35 It is worth notingthat temperature influences the spectroscopic properties of Lnions such as: shortening of emission lifetimes, bandwidths (bandbroadening), changes in luminescence intensity ratios, and soforth.12,13,16,19,26,29,32,34 Such temperature-dependent propertiescan be further used for thermal sensing purposes.
The optimal nanothermometer should show a high relativesensitivity and good temperature resolution.8,12,20,36 It shouldbe emphasized that the relative sensitivity of the luminescentthermometers operating with TCLs is intrinsically limited withthe energy difference between these TCLs.21,34,35 These limit-ations can be overcome by operating with non-TCLs of theoptically active ions. Sensors showing the best performancecan be successfully used in biological, electronic, engineeringand other industrial processes to control the temperature ofthe system, e.g. the rate of catalytic processes or the progress ofthe polymerization process.1,18,20,23–25,37
Here we report the development of a ratiometric, opticalnanothermometer, YVO4:Yb
3+,Er3+ working in a broad spectralrange (VIS-NIR). The nanomaterial synthesized shows greenup-conversion luminescence visible to the naked eye, andgood temperature response (temperature-dependent lumine-scence). The selected luminescence intensity ratios of thebands associated with TCLs and non-TCLs of Er3+ and Yb3+ areused as thermometric parameters. The corresponding absoluteand relative sensitivities, and temperature resolutions areinvestigated. A very important and novel aspect of this work isthe demonstration of a strong influence of the applied pump(laser) power on the values of the mentioned thermometricparameters, as well as on the thermometer performance.
ExperimentalMaterials
RE2O3 (RE = Y3+, Yb3+ and Er3+) (99.99%, Stanford Materials)were separately dissolved in HCl (35–38%, pure P.A. – basic,POCh. S.A.) to obtain the corresponding chlorides RECl3, andthen evaporated to remove the excess acid. The followingreagents were purchased from Sigma-Aldrich: ammoniummetavanadate (ACS reagent, ≥99.0%) and PEG 6000. Sodiumhydroxide (98.8% pure P.A.) was purchased from POCh. S.A.Deionized water was used for all experiments.
Synthesis of YVO4:Yb3+,Er3+
To synthesize 0.5 g of the YVO4:20% Yb3+,2% Er3+ product,aqueous solutions of YCl3, YbCl3 and ErCl3 were mixed
together in a molar ratio 0.78 : 0.2 : 0.02, i.e. 3.478 mL of 0.5 MYCl3, 0.892 mL of 0.5 M YbCl3 and 0.089 mL of 0.5 M ErCl3.Subsequently, 10 mL of water was admixed to the solution ofLn3+ ions. Next, 0.5 g of PEG 6000 (anti-agglomeration agent)was added and dissolved in the as-prepared solution. A secondsolution was prepared by dissolving 0.2607 g of NH4VO3 in20 mL of water. Aqueous sodium hydroxide solution wasadded to the solution of ammonium metavanadate in a molarratio of 1 : 1 (0.0892 g of NaOH in 15 mL of water). These solu-tions were heated up to 343 K to obtain transparent mixtures.The solution containing vanadate ions was added dropwise tothe continuously stirred solution of Ln3+. Then water (up to40 mL volume) was added to the obtained solution, and using1.5 M solution of NaOH, the pH of the system was adjusted to≈10. The entire mixture was then transferred into a Teflon-lined vessel, and hydrothermally treated in an autoclave (18 h,453 K). After that, the obtained white precipitate was dispersedin ethanol and water, and several times centrifuged in order topurify the final product. The obtained product YVO4:Yb
3+,Er3+
was dried in an oven at 358 K for 15 h, and subsequently thesample was ground in an agate mortar. Afterwards, to improvethe crystallinity and luminescence of the material, the samplewas calcined in an oven for 4 h at 673 K. After calcination, theproduct was ground in an agate mortar once again.
Characterization
Powder X-ray diffraction pattern (XRD) was measured using aBruker AXS D8 Advance diffractometer in Bragg–Brentano geo-metry, with Cu Kα radiation (λ = 0.15406 nm). Transmissionelectron microscopy (TEM) image was taken using a HitachiHT7700 transmission electron microscope (100 kV acceleratingvoltage). Emission spectra were measured using an AndorShamrock 500i spectrograph coupled with a silicon iDus CCDcamera as a detector. The sample was excited using a fiber-coupled, solid-state diode pumped (SSDP) laser FC-975-2 W(CNI). The laser power used was adjusted to 100, 200 and300 mW (≈1 mm spot size), which correspond to the powerdensities of about 12.7, 25.4 and 38.2 W cm−2. Before theluminescence measurements, the laser power was set lowenough to avoid an uncontrolled increase in the sample temp-erature by local heating of the material with the laser beam(when the intensity ratio of the Er3+ TCL bands remained con-stant, the laser-induced heating effect did not occur).
Results and discussionStructure and morphology
The recorded XRD pattern of the obtained YVO4:Yb3+,Er3+
nanomaterial (Fig. 1a) agrees with the reference pattern fromthe ICDD database (International Centre for Diffraction Data,card no. 01-082-1968) of tetragonal YVO4, crystallizing in theI41/amd space group. The significant broadening of theobserved reflexes is associated with the nanocrystallinity of theobtained particles. The TEM image (Fig. 1b) shows that theobtained nanomaterial is composed of irregular agglomerated
Paper Nanoscale
14140 | Nanoscale, 2021, 13, 14139–14146 This journal is © The Royal Society of Chemistry 2021
Ope
n A
cces
s A
rtic
le. P
ublis
hed
on 2
2 Ju
ly 2
021.
Dow
nloa
ded
on 3
/24/
2022
2:3
1:36
AM
. T
his
artic
le is
lice
nsed
und
er a
Cre
ativ
e C
omm
ons
Attr
ibut
ion
3.0
Unp
orte
d L
icen
ce.
View Article Online
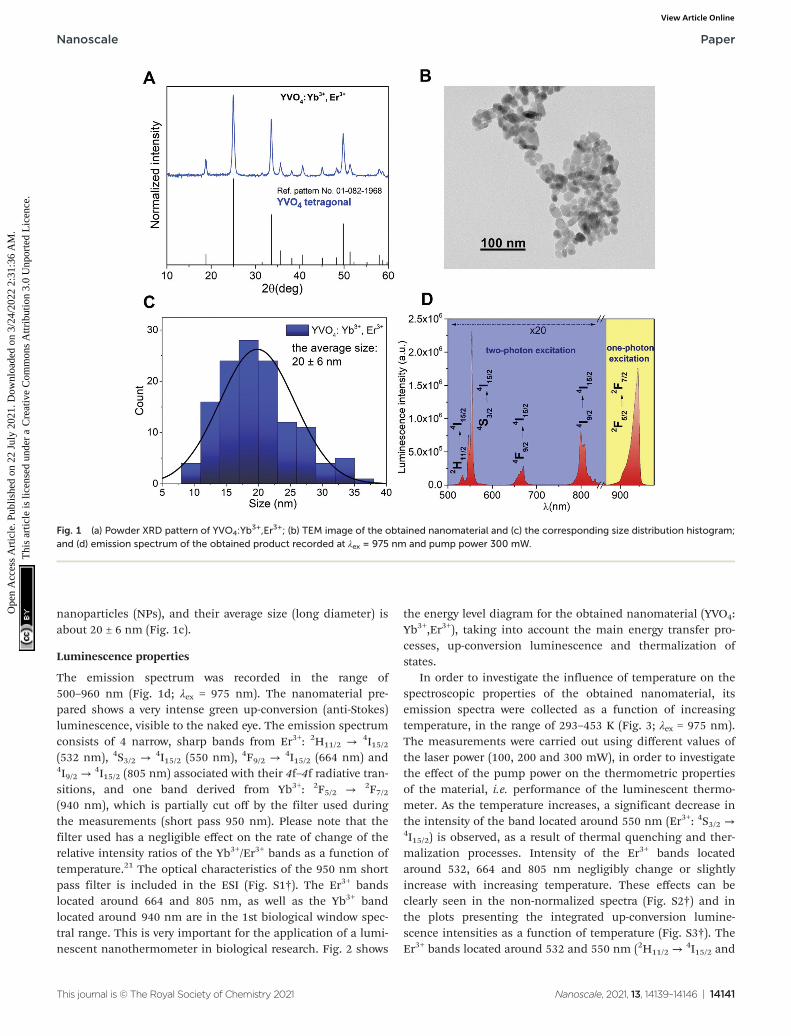
nanoparticles (NPs), and their average size (long diameter) isabout 20 ± 6 nm (Fig. 1c).
Luminescence properties
The emission spectrum was recorded in the range of500–960 nm (Fig. 1d; λex = 975 nm). The nanomaterial pre-pared shows a very intense green up-conversion (anti-Stokes)luminescence, visible to the naked eye. The emission spectrumconsists of 4 narrow, sharp bands from Er3+: 2H11/2 → 4I15/2(532 nm), 4S3/2 → 4I15/2 (550 nm), 4F9/2 → 4I15/2 (664 nm) and4I9/2 →
4I15/2 (805 nm) associated with their 4f–4f radiative tran-sitions, and one band derived from Yb3+: 2F5/2 → 2F7/2(940 nm), which is partially cut off by the filter used duringthe measurements (short pass 950 nm). Please note that thefilter used has a negligible effect on the rate of change of therelative intensity ratios of the Yb3+/Er3+ bands as a function oftemperature.21 The optical characteristics of the 950 nm shortpass filter is included in the ESI (Fig. S1†). The Er3+ bandslocated around 664 and 805 nm, as well as the Yb3+ bandlocated around 940 nm are in the 1st biological window spec-tral range. This is very important for the application of a lumi-nescent nanothermometer in biological research. Fig. 2 shows
the energy level diagram for the obtained nanomaterial (YVO4:Yb3+,Er3+), taking into account the main energy transfer pro-cesses, up-conversion luminescence and thermalization ofstates.
In order to investigate the influence of temperature on thespectroscopic properties of the obtained nanomaterial, itsemission spectra were collected as a function of increasingtemperature, in the range of 293–453 K (Fig. 3; λex = 975 nm).The measurements were carried out using different values ofthe laser power (100, 200 and 300 mW), in order to investigatethe effect of the pump power on the thermometric propertiesof the material, i.e. performance of the luminescent thermo-meter. As the temperature increases, a significant decrease inthe intensity of the band located around 550 nm (Er3+: 4S3/2 →4I15/2) is observed, as a result of thermal quenching and ther-malization processes. Intensity of the Er3+ bands locatedaround 532, 664 and 805 nm negligibly change or slightlyincrease with increasing temperature. These effects can beclearly seen in the non-normalized spectra (Fig. S2†) and inthe plots presenting the integrated up-conversion lumine-scence intensities as a function of temperature (Fig. S3†). TheEr3+ bands located around 532 and 550 nm (2H11/2 →
4I15/2 and
Fig. 1 (a) Powder XRD pattern of YVO4:Yb3+,Er3+; (b) TEM image of the obtained nanomaterial and (c) the corresponding size distribution histogram;
and (d) emission spectrum of the obtained product recorded at λex = 975 nm and pump power 300 mW.
Nanoscale Paper
This journal is © The Royal Society of Chemistry 2021 Nanoscale, 2021, 13, 14139–14146 | 14141
Ope
n A
cces
s A
rtic
le. P
ublis
hed
on 2
2 Ju
ly 2
021.
Dow
nloa
ded
on 3
/24/
2022
2:3
1:36
AM
. T
his
artic
le is
lice
nsed
und
er a
Cre
ativ
e C
omm
ons
Attr
ibut
ion
3.0
Unp
orte
d L
icen
ce.
View Article Online
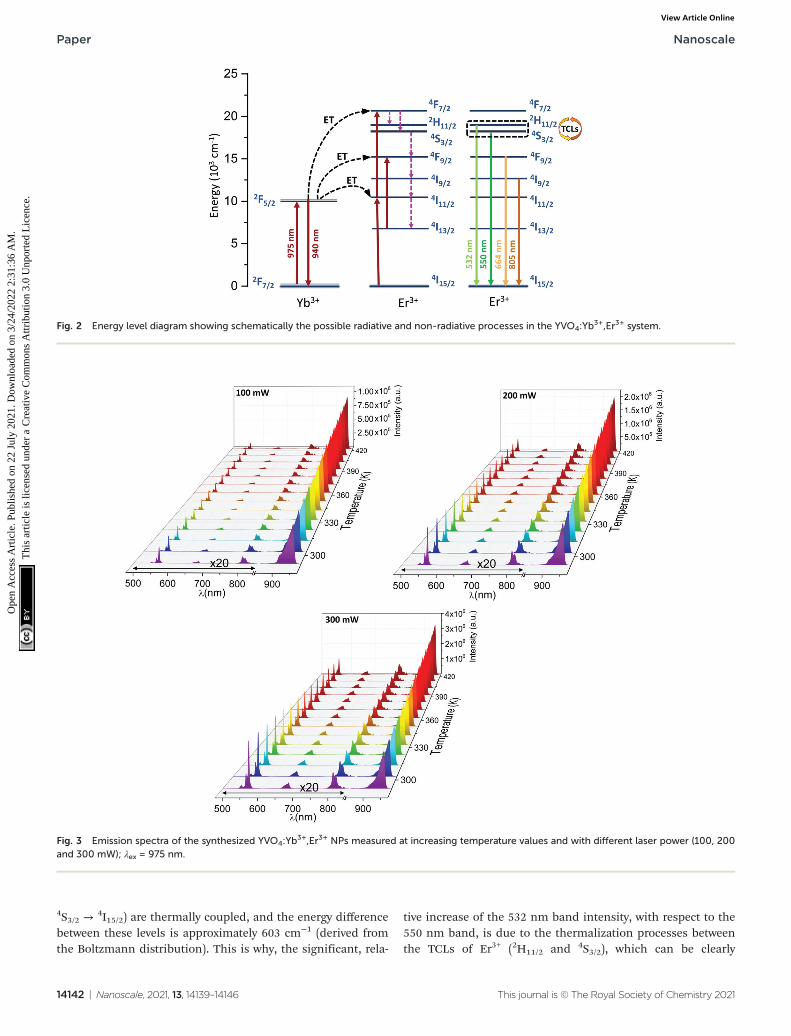
4S3/2 →4I15/2) are thermally coupled, and the energy difference
between these levels is approximately 603 cm−1 (derived fromthe Boltzmann distribution). This is why, the significant, rela-
tive increase of the 532 nm band intensity, with respect to the550 nm band, is due to the thermalization processes betweenthe TCLs of Er3+ (2H11/2 and 4S3/2), which can be clearly
Fig. 2 Energy level diagram showing schematically the possible radiative and non-radiative processes in the YVO4:Yb3+,Er3+ system.
Fig. 3 Emission spectra of the synthesized YVO4:Yb3+,Er3+ NPs measured at increasing temperature values and with different laser power (100, 200
and 300 mW); λex = 975 nm.
Paper Nanoscale
14142 | Nanoscale, 2021, 13, 14139–14146 This journal is © The Royal Society of Chemistry 2021
Ope
n A
cces
s A
rtic
le. P
ublis
hed
on 2
2 Ju
ly 2
021.
Dow
nloa
ded
on 3
/24/
2022
2:3
1:36
AM
. T
his
artic
le is
lice
nsed
und
er a
Cre
ativ
e C
omm
ons
Attr
ibut
ion
3.0
Unp
orte
d L
icen
ce.
View Article Online
observed in the normalized spectra (Fig. S4†). These thermaliz-ation processes conform the Boltzmann-type distribution:
LIR ;I2I1
¼ B exp � ΔEkBT
� �ð1Þ
where LIR is the luminescence intensity ratio of the higherenergy (I2; 532 nm) and lower energy (I1; 550 nm) bands; ΔE isthe energy separation between the barycenters I2 and I1; kB isthe Boltzmann constant; T is the absolute temperature; and Bis a constant, which depends on the rates of total spontaneousemission, state degeneracies, the branching ratio of the tran-sitions with respect to the ground state, and transition angularfrequencies.30 At the same time, the intensity of the Yb3+ bandaround 940 nm (Yb3+: 2F5/2 →
2F7/2) increases with temperatureelevation. This is because the band originates from thephonon-assisted transition of Yb3+, which may be enhancedwith temperature.8,21,24
It should be emphasized that the changes in the pump(laser) power have a significant impact on the absolute inten-sity of the emission bands, as well as their relative intensities(in the case of the non-TCL ones), especially for the lumine-scence intensity ratios of Yb3+/Er3+. The band around 940 nmcorresponds to the one-photon transition 2F5/2 → 2F7/2 (seeFig. S5,† showing the determined number of photons partici-pating in the observed transitions), i.e. conventional down-shifting emission. So, even at a relatively low laser power (i.e.100 mW), this transition is intense and clearly visible. On theother hand, in the case of the two-photon transitions comingfrom Er3+ (non-linear, up-conversion luminescence; Fig. S5†),the change of the laser power has a huge impact on the inten-sity of these bands. Together with decreasing laser power, thesignal-to-noise ratio decreases significantly for the up-conver-sion emission, and the data quality deteriorates markedly.This is why, the change of the pump power influences thedetermined thermometric parameters associated with non-TCLs, i.e. LIRs of Yb3+/Er3+, but it does not affect Er3+ TCLs, i.e.LIR 532/550 nm. The LIR values for Er3+ TCLs, i.e. 532/550 nm,were correlated with temperature applying eqn (1) (Fig. 4),whereas the LIRs corresponding to the non-TCLs, i.e. 940/550and 940/805 nm, were successfully correlated with temperatureapplying second-order polynomial fits (Fig. 5 and 6). In eachcase, the LIR parameter increases monotonously with increas-ing temperature. The use of simple polynomial fits(empirical functions) was motivated by the absence of anappropriate physical model, rationalizing the monitoredchanges of the LIR parameters (non-TCLs) with temperature.Details for all fits, i.e. values of the fitting parameters, aregiven in Table 1.
In order to investigate the performance of any nanotherm-ometer, it is necessary to determine parameters such as: absol-ute sensitivity, relative sensitivity and temperature resolution.The absolute sensitivity (SA) was calculated based on eqn (2).This parameter is usually expressed in K−1.
SA ¼ dLIRdT
ð2Þ
Another very important parameter is the relative tempera-ture sensitivity (SR; eqn (3)).
SR ¼ 100%� dLIRdT
1LIR
ð3Þ
This parameter, i.e. SR, shows how the analyzed thermo-metric parameter (LIR) changes per 1 K (expressed in % K−1),and it can be used to compare the performance of differentoptical thermometers.
Based on eqn (4), the temperature resolutions (δT ) werealso determined.
δT ¼ 1SR
δLIRLIR
ð4Þ
We have added a more detailed explanation of the tempera-ture resolution parameter δT, and have provided derivation ofthe corresponding equation in the ESI† file. It is worth men-tioning that δLIR is the uncertainty of the LIR parameter deter-mination, which is calculated from eqn (5).
δLIR ¼ LIR�ffiffiffiffiffiffiffiffiffiffiffiffiffiffiffiffiffiffiffiffiffiffiffiffiffiffiffiffiffiffiffiffiffiffiδI1I1
� �2
þ δI2I2
� �2s
ð5Þ
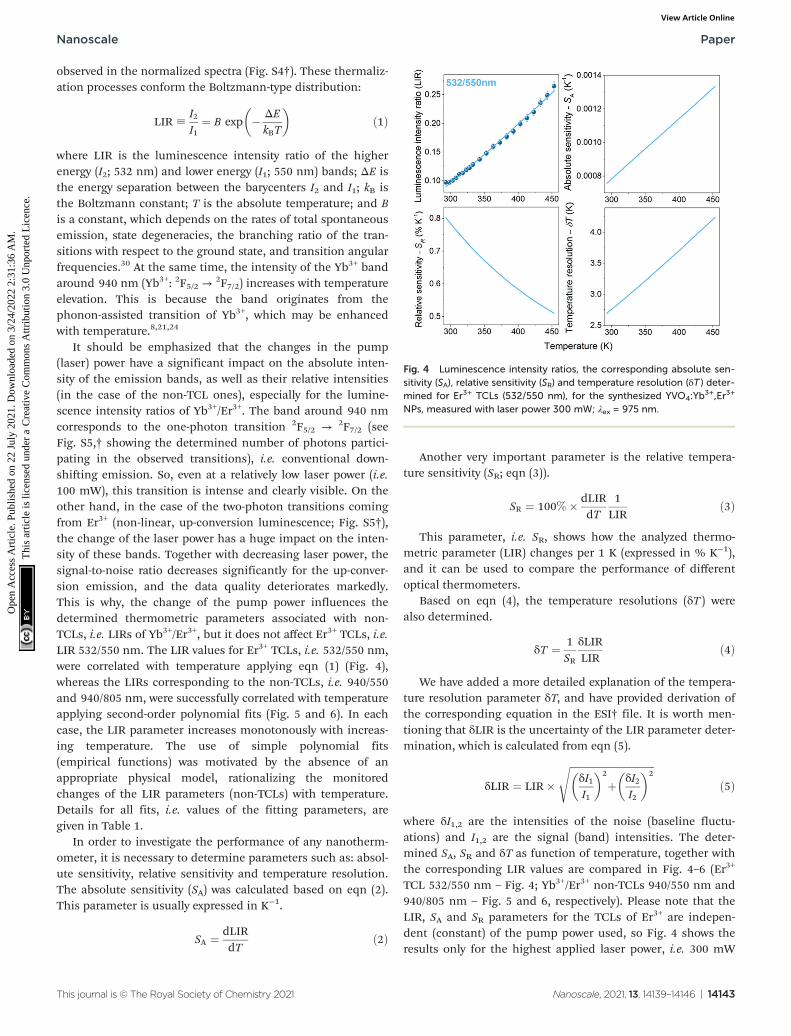
where δI1,2 are the intensities of the noise (baseline fluctu-ations) and I1,2 are the signal (band) intensities. The deter-mined SA, SR and δT as function of temperature, together withthe corresponding LIR values are compared in Fig. 4–6 (Er3+
TCL 532/550 nm – Fig. 4; Yb3+/Er3+ non-TCLs 940/550 nm and940/805 nm – Fig. 5 and 6, respectively). Please note that theLIR, SA and SR parameters for the TCLs of Er3+ are indepen-dent (constant) of the pump power used, so Fig. 4 shows theresults only for the highest applied laser power, i.e. 300 mW
Fig. 4 Luminescence intensity ratios, the corresponding absolute sen-sitivity (SA), relative sensitivity (SR) and temperature resolution (δT ) deter-mined for Er3+ TCLs (532/550 nm), for the synthesized YVO4:Yb
3+,Er3+
NPs, measured with laser power 300 mW; λex = 975 nm.
Nanoscale Paper
This journal is © The Royal Society of Chemistry 2021 Nanoscale, 2021, 13, 14139–14146 | 14143
Ope
n A
cces
s A
rtic
le. P
ublis
hed
on 2
2 Ju
ly 2
021.
Dow
nloa
ded
on 3
/24/
2022
2:3
1:36
AM
. T
his
artic
le is
lice
nsed
und
er a
Cre
ativ
e C
omm
ons
Attr
ibut
ion
3.0
Unp
orte
d L
icen
ce.
View Article Online
(the maximum power at which we did not observe laser-induced heating of the sample). On the other hand, Fig. 5 and6 show the data for the non-TCLs of Yb3+/Er3+, for three
different values of the laser power, i.e. 100, 200 and 300 mW,because in this case all measured parameters depend on thepump power used.
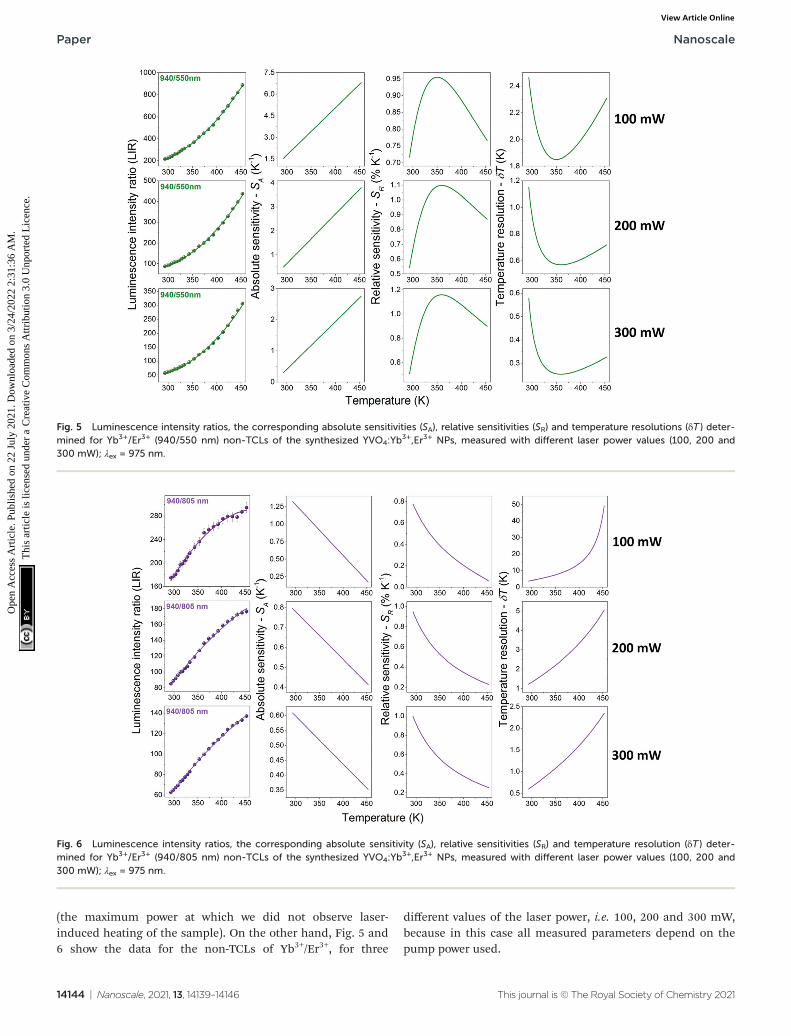
Fig. 5 Luminescence intensity ratios, the corresponding absolute sensitivities (SA), relative sensitivities (SR) and temperature resolutions (δT ) deter-mined for Yb3+/Er3+ (940/550 nm) non-TCLs of the synthesized YVO4:Yb
3+,Er3+ NPs, measured with different laser power values (100, 200 and300 mW); λex = 975 nm.
Fig. 6 Luminescence intensity ratios, the corresponding absolute sensitivity (SA), relative sensitivities (SR) and temperature resolution (δT ) deter-mined for Yb3+/Er3+ (940/805 nm) non-TCLs of the synthesized YVO4:Yb
3+,Er3+ NPs, measured with different laser power values (100, 200 and300 mW); λex = 975 nm.
Paper Nanoscale
14144 | Nanoscale, 2021, 13, 14139–14146 This journal is © The Royal Society of Chemistry 2021
Ope
n A
cces
s A
rtic
le. P
ublis
hed
on 2
2 Ju
ly 2
021.
Dow
nloa
ded
on 3
/24/
2022
2:3
1:36
AM
. T
his
artic
le is
lice
nsed
und
er a
Cre
ativ
e C
omm
ons
Attr
ibut
ion
3.0
Unp
orte
d L
icen
ce.
View Article Online
As mentioned above and clearly seen in Fig. 5 and 6, theapplied laser power has a significant influence on the valuesof the band intensity ratios, temperature sensitivities and res-olutions, when using the LIRs of the non-TCLs as thermo-metric parameters. For the analyzed band intensity ratios, i.e.940/550 and 940/805 nm, corresponding to the non-TCLs ofYb3+/Er3+, the increase in the laser power results in decreasingLIR, SA and δT, and increasing SR values. The most importantof these are the increase of the relative sensitivity (higher SR)and the improvement of temperature resolution (lower δT ).Together with increasing laser power from 100 to 300 mW, themaximal relative sensitivity (SR max) values increase from 0.78to 1.00 for the LIR 940/805 nm and from 0.95 to 1.16 for theLIR 940/550 nm. In contrast, the temperature resolutions(which depend on signal intensity and SR value) are about 6–7times better than those at 100 mW, e.g. δT decrease from 3.75to 0.60 for the LIR 940/805 nm and from 1.85 to 0.25 for theLIR 940/550 nm. It is worth noting that the resulting tempera-ture sensitivities and resolutions corresponding to Er3+ TCLs(532/550 nm), determined at the highest applied laser power(300 mW), are worse than the ones for Yb3+/Er3+ non-TCLs (seeTable 1).
Conclusions
In this paper, we demonstrate how the applied laser powermay influence the thermometric parameters and sensing per-formance, which are crucial for luminescence thermometryapplications. The developed nanothermometer is based on theYVO4:Yb
3+,Er3+ NPs (≈20 nm), synthesized using the hydro-thermal method and subsequent calcination. The nano-material shows green up-conversion (anti-Stokes) lumine-scence of Er3+, clearly visible to the naked eye, under NIR laserexcitation, at 975 nm. The temperature experiments werecarried out in the range of 293–453 K, using different values ofthe laser power, namely 100, 200 and 300 mW. As the tempera-ture increases, the intensity of the band derived from Er3+ ionslocated around 550 nm (4S3/2 → 4I15/2) decreases significantly,whereas the intensity of the Yb3+ band >900 nm (2F5/2 →
2F7/2)increases with temperature elevation. Hence, as thermometricparameters we used and compared the LIR of Er3+ (532/550 nm) and the LIRs of the mentioned Yb3+/Er3+ (940/550 and940/805 nm) bands, corresponding to their TCLs and non-TCLs. It was observed that using non-TCLs for ratiometric
temperature sensing, the selected pump (laser) power has asignificant impact on the values of the corresponding thermo-metric parameters, as well as on the determined sensitivitiesand resolutions (SR increases and δT decreases with increasinglaser power). In other words, in the case of luminescentthermometers exhibiting non-linear phenomena (e.g. up-con-version emission), and using the LIR of the bands originatingfrom the transitions with a different number of photons parti-cipating in the relevant radiative processes, change of the laserpower may significantly affect the determined thermometricparameter values, and performance of the sensor.
Conflicts of interest
The authors declare no conflict of interest.
Acknowledgements
This work was supported by the Polish National ScienceCentre (grant no. 2018/31/N/ST4/00684).
References
1 M. Kamimura, T. Matsumoto, S. Suyari, M. Umezawa andK. Soga, J. Mater. Chem. B, 2017, 5, 1917–1925.
2 S. K. Singh, K. Kumar and S. B. Rai, Sens. Actuators, A,2009, 149, 16–20.
3 B. Dong, D. P. Liu, X. J. Wang, T. Yang, S. M. Miao andC. R. Li, Appl. Phys. Lett., 2007, 90, 3–6.
4 R. G. Geitenbeek, P. T. Prins, W. Albrecht, A. VanBlaaderen, B. M. Weckhuysen and A. Meijerink, J. Phys.Chem. C, 2017, 121, 3503–3510.
5 H. Suo, F. Hu, X. Zhao, Z. Zhang, T. Li, C. Duan, M. Yinand C. Guo, J. Mater. Chem. C, 2017, 5, 1501–1507.
6 A. A. Kalinichev, M. A. Kurochkin, E. V. Golyeva,A. V. Kurochkin, E. Lähderanta, M. D. Mikhailov andI. E. Kolesnikov, J. Lumin., 2018, 195, 61–66.
7 S. Jiang, P. Zeng, L. Liao, S. Tian, H. Guo, Y. Chen, C. Duanand M. Yin, J. Alloys Compd., 2014, 617, 538–541.
8 N. Stopikowska, M. Runowski, P. Woźny, S. Goderski andS. Lis, J. Lumin., 2020, 228, 117643.
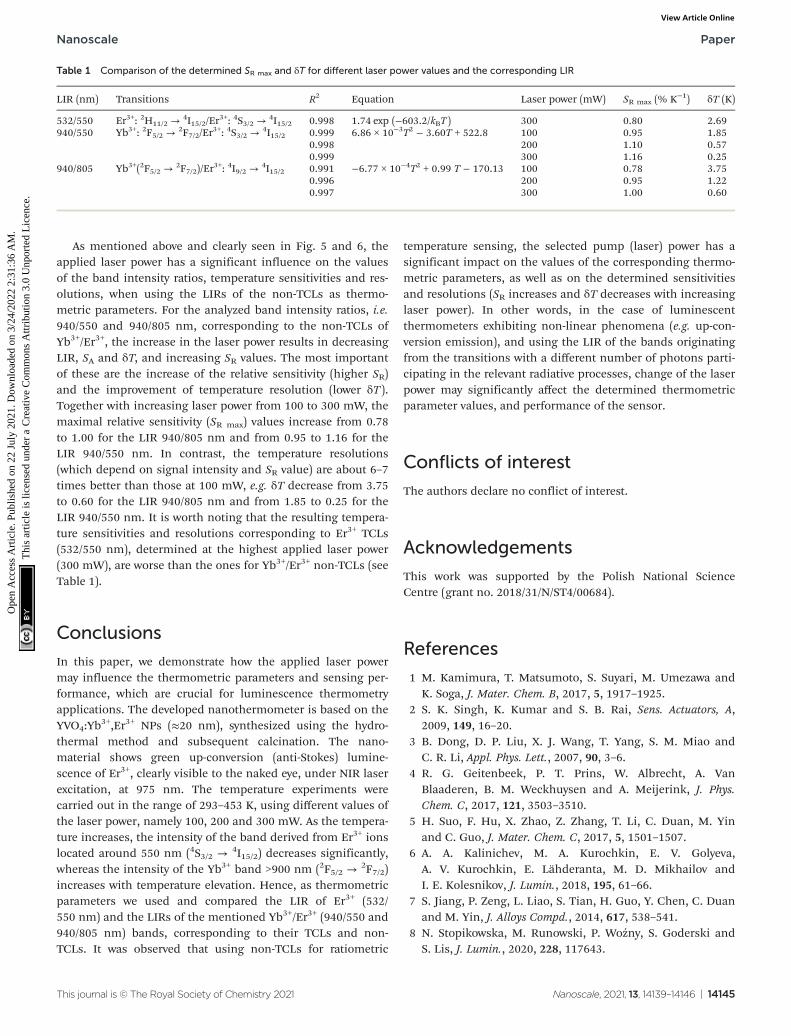
Table 1 Comparison of the determined SR max and δT for different laser power values and the corresponding LIR
LIR (nm) Transitions R2 Equation Laser power (mW) SR max (% K−1) δT (K)
532/550 Er3+: 2H11/2 →4I15/2/Er
3+: 4S3/2 →4I15/2 0.998 1.74 exp (−603.2/kBT ) 300 0.80 2.69
940/550 Yb3+: 2F5/2 →2F7/2/Er
3+: 4S3/2 →4I15/2 0.999 6.86 × 10⁻³T2 − 3.60T + 522.8 100 0.95 1.85
0.998 200 1.10 0.570.999 300 1.16 0.25
940/805 Yb3+(2F5/2 →2F7/2)/Er
3+: 4I9/2 →4I15/2 0.991 −6.77 × 10⁻⁴T2 + 0.99 T − 170.13 100 0.78 3.75
0.996 200 0.95 1.220.997 300 1.00 0.60
Nanoscale Paper
This journal is © The Royal Society of Chemistry 2021 Nanoscale, 2021, 13, 14139–14146 | 14145
Ope
n A
cces
s A
rtic
le. P
ublis
hed
on 2
2 Ju
ly 2
021.
Dow
nloa
ded
on 3
/24/
2022
2:3
1:36
AM
. T
his
artic
le is
lice
nsed
und
er a
Cre
ativ
e C
omm
ons
Attr
ibut
ion
3.0
Unp
orte
d L
icen
ce.
View Article Online
9 L. Marciniak, A. Bednarkiewicz, M. Stefanski, R. Tomala,D. Hreniak and W. Strek, Phys. Chem. Chem. Phys., 2015,17, 24315–24321.
10 M. Runowski, N. Stopikowska and S. Lis, Dalton Trans.,2020, 49, 2129–2137.
11 A. Nadort, J. Zhao and E. M. Goldys, Nanoscale, 2016, 8,13099–13130.
12 M. Runowski, in Handbook of Nanomaterials in AnalyticalChemistry, Elsevier, 2020, pp. 227–273.
13 D. Jaque and F. Vetrone, Nanoscale, 2012, 4, 4301–4326.14 T. Xia, Y. Cui, Y. Yang and G. Qian, J. Mater. Chem. C, 2017,
5, 5044–5047.15 A. Benayas, Near Infrared-Emitting Nanoparticles for
Biomedical Applications, 2020.16 M. A. Hernández-Rodríguez, A. D. Lozano-Gorrín,
I. R. Martín, U. R. Rodríguez-Mendoza and V. Lavín, Sens.Actuators, B, 2018, 255, 970–976.
17 Y. Tian, Y. Tian, P. Huang, L. Wang, Q. Shi and C. Cui,Chem. Eng. J., 2016, 297, 26–34.
18 L. Marciniak, A. Bednarkiewicz, J. Drabik, K. Trejgis andW. Strek, Phys. Chem. Chem. Phys., 2017, 19, 7343–7351.
19 W. Xu, Q. Song, L. Zheng, Z. Zhang and W. Cao, Opt. Lett.,2014, 39, 4635.
20 M. Runowski, N. Stopikowska, D. Szeremeta, S. Goderski,M. Skwierczyńska and S. Lis, ACS Appl. Mater. Interfaces,2019, 11, 13389–13396.
21 M. Runowski, S. Goderski, D. Przybylska, T. Grzyb, S. Lisand I. R. Martín, ACS Appl. Nano Mater., 2020, 3, 6406–6415.
22 L. Labrador-Páez, M. Pedroni, A. Speghini, J. García-Solé,P. Haro-González and D. Jaque, Nanoscale, 2018, 10, 22319–22328.
23 I. K. van Ravenhorst, R. G. Geitenbeek, M. J. van derEerden, J. Tijn van Omme, H. H. Peréz Garza, F. Meirer,
A. Meijerink and B. M. Weckhuysen, ChemCatChem, 2019,11, 5505–5512.
24 T. Bai and N. Gu, Small, 2016, 12, 4590–4610.25 H. Pinkerton, M. James and A. Jones, J. Volcanol. Geotherm.
Res., 2002, 113, 159–176.26 C. D. S. Brites, P. P. Lima, N. J. O. Silva, A. Millán,
V. S. Amaral, F. Palacio and L. D. Carlos, Nanoscale, 2012,4, 4799–4829.
27 M. Runowski, A. Shyichuk, A. Tymiński, T. Grzyb, V. Lavínand S. Lis, ACS Appl. Mater. Interfaces, 2018, 10, 17269–17279.
28 S. F. León-Luis, U. R. Rodríguez-Mendoza, E. Lalla andV. Lavín, Sens. Actuators, B, 2011, 158, 208–213.
29 M. D. Dramićanin, J. Appl. Phys., 2020, 128, 040902.30 C. D. S. Brites, A. Millán and L. D. Carlos, Handb. Phys.
Chem. Rare Earths, 2016, 49, 339–427.31 K. Mukhuti, V. N. K. B. Adusumalli, K. Raj, R. B. Bansal
and V. Mahalingam, J. Lumin., 2020, 227, 117542.32 R. G. Geitenbeek, H. W. De Wijn and A. Meijerink, Phys.
Rev. Appl., 2018, 10, 064006.33 L. Li, F. Qin, L. Li, H. Gao and Z. Zhang, J. Mater. Chem. C,
2019, 7, 7378–7385.34 C. D. S. Brites, K. Fiaczyk, J. F. C. B. Ramalho,
M. Sójka, L. D. Carlos and E. Zych, Adv. Opt. Mater., 2018,6, 1–5.
35 E. C. Ximendes, U. Rocha, T. O. Sales, N. Fernández,F. Sanz-Rodríguez, I. R. Martín, C. Jacinto and D. Jaque,Adv. Funct. Mater., 2017, 27, 1–10.
36 M. Runowski, P. Woźny, N. Stopikowska, I. R. Martín,V. Lavín and S. Lis, ACS Appl. Mater. Interfaces, 2020, 12,43933–43941.
37 C. Wang, Y. Jin, L. Yuan, H. Wu, G. Ju, Z. Li, D. Liu,Y. Lv, L. Chen and Y. Hu, Chem. Eng. J., 2019, 374, 992–1004.
Paper Nanoscale
14146 | Nanoscale, 2021, 13, 14139–14146 This journal is © The Royal Society of Chemistry 2021
Ope
n A
cces
s A
rtic
le. P
ublis
hed
on 2
2 Ju
ly 2
021.
Dow
nloa
ded
on 3
/24/
2022
2:3
1:36
AM
. T
his
artic
le is
lice
nsed
und
er a
Cre
ativ
e C
omm
ons
Attr
ibut
ion
3.0
Unp
orte
d L
icen
ce.
View Article Online