Improving maintenance in high-volume manufacturing
81
Improving maintenance in high-volume manufacturing Case: Ball Beverage Packaging Europe LAHTI UNIVERSITY OF APPLIED SCIENCES Degree Programme in International Business Management Master’s Thesis 2016 Henry Nieminen
Transcript of Improving maintenance in high-volume manufacturing
Improving maintenance in
high-volume manufacturing
Case: Ball Beverage Packaging Europe
LAHTI UNIVERSITY OF APPLIED SCIENCES Degree Programme in International Business Management Master’s Thesis 2016 Henry Nieminen

Lahti University of Applied Sciences Degree Programme in International Business Management
NIEMINEN, HENRY: Improving maintenance in high volume manufacturing Case: Ball Beverage Packaging Europe
Master’s Thesis 81 pages, 0 pages of appendices
Autumn 2016
ABSTRACT
The aim this thesis is to investigate the current state of the maintenance in case company and to identify process bottlenecks. After recognizing the process bottleneck equipment, situation is analyzed thoroughly by using root cause analysis. Based on the root cause analysis, improvement activities are performed and measured. Current state analysis is conducted from production downtime and spoilage data available. Final implicantions are measured by using overall equipment effectiveness as indicator.
As a result of the high volume nature of beverage can manufacturing, it is essential to keep equipment in excellent condition. Therefore, theoretical section is focusing on maintenance in manufacturing environment and connected to company’s business. Moreover, background theory discusses the total productive maintenance and process improvement.
The empirical section is qualitative research based on implementation of choosed method. This study is conducted as action research to case company. The current state was measured before the implementation, similarly situation is measured two months after the new method implemented. The method was modified from the original idea of Milton Keynes plant located in England. The method, tagging system, was implemented according to Six Sigma DMAIC roadmap. Additionally, beverage can manufacturing process is explained in this section. The results of the study are visualizing the implications after the maintenance method improvement. As a result of the tagging system implementation, overall equipment effectiveness improved significantly during the two month evaluation period. Therefore, it can be summarized that when improving company’s maintenance method, it will actualize as better production figures and business result. In addition, challenges related to the maintenance in the company were also identified in communication between personnel. Implementation of the tagging system increased the amount of communication related to maintenance activities. Tag review meeting practice was established and is held on regular basis which involves whole organization as shared tags between departments.

Key words: maintenance, manufacturing, total productive management, process improvement, six sigma
CONTENTS
ABBREVIATIONS
1 INTRODUCTION 81.1 Background 101.2 Case Company 111.3 Research objectives, questions and limitations 121.4 Structure of the research 13
2 MAINTENANCE IN MANUFACTURING BUSINESS 142.1 Role of maintenance 152.2 Maintenance as part of company’s strategy 162.3 Preventive maintenance economics 18
3 TOTAL PRODUCTIVE MAINTENANCE 223.1 5S 233.2 Eight pillars of TPM 243.2.1 Focused Improvement 253.2.2 Autonomous Maintenance 263.2.3 Preventive Maintenance 283.2.4 Education and Training 303.2.5 Early Equipment Management 303.2.6 Quality Maintenance 313.2.7 Office TPM 313.2.8 Safety, Health & Environment 323.3 Six big losses 323.4 Overall Equipment Effectiveness 34
4 PROCESS IMPROVEMENT 404.1 Six Sigma 424.2 Pareto analysis 454.3 Root cause analysis 46
5 RESEARCH APPROACH AND METHODS 485.1 Maintenance in Ball Beverage Packaging Europe 495.2 Introduction to beverage can manufacturing process 505.3 Tagging System 53
6 RESEARCH RESULTS AND ANALYSIS 616.1 Bottleneck and root cause analysis 616.2 OEE measurement and analysis 676.3 Maintenance activity 72
7 CONCLUSIONS 747.1 Discussion and conclusions 747.2 Validity and reliability 767.3 Further study suggestions 77
REFERENCES 78

LIST OF FIGURES AND TABLES
Figure 1. Structure of the research 13
Figure 2. Mean time to failure (Mobley, 2011). 18
Figure 3. Cash flow diagram of lost production
(Mobley, 2002). 19
Figure 4. Typical overall cash flow in PM
implementation (Mobley, 2002) 20
Figure 5. Balance between cost and level of
PM (Mobley, 2002) 21
Figure 6. TPM pillars (ABMS 2016) 25
Figure 7. Six big losses
(Vorne Industries Incorporation 2016). 35
Figure 8. OEE Calculation
(Vorne Industries Incorporation 2016). 35
Figure 9. OEE Model (Macey, 2015) 37
Figure 10. Deming cycle (The Deming Institute 2016) 41
Figure 11. Six Sigma and Process Improvement 44
(Evans & Lindsay, 2015).
Figure 12. Pareto diagram (MoreSteam 2016) 46
Figure 13. Cause-and-effect diagram (iSixSigma 2016) 47
Figure 14. Structure of maintenance department 49
Figure 15. Beverage Can Manufacturing (VISY 2016) 51
Figure 16. Tag example 54
Figure 17. Tagging board example in Milton Keynes 56
Figure 18. Project plan 57
Figure 19. Tag flow 58
Figure 20. Tagging system user interface and functions 59
Figure 21. Summary of tags 59
Figure 22. Downtime Pareto BE Line 1 62
Figure 23. Downtime Pareto BE Line 2 64
Figure 24. HFI Spoilage chart 65
Figure 25. Cause and effect diagram of decorator issues 66
Figure 26. OEE Line 1 Decorator 67
Figure 27. Availability OEE Line 1 68
Figure 28. Average OEE Line 1 69
Figure 29. OEE Line 2 Decorator 69
Figure 30. Availability OEE Line 2 70
Figure 31. Average OEE Line 2 71
Figure 32. Earlier maintenance activity in decorator area 72
Figure 33. Tagging system maintenance activity 72
Table 1. Downtime Pareto BE Line 1 62
Table 2. Downtime Pareto BE Line 2 63

ABBREVIATIONS
TPM Total Productive Maintenance
ROI Return On Investment
OEE Overall Equipment Effectiveness
AM Autonomous Maintenance
PM Preventive Maintenance
PDSA Plan, Do, Study, Act
DMAIC Define, Measure, Analyse, Improve, Control
CPM Cans Per Minute
HFI Hold For Inspection
BE Back End
1 INTRODUCTION
Undeniably, nowadays manufacturing companies are competing globally
and gaining the competitive edge to rivals has become essential for the
business. Strategy means making things better by performing unique and
well-chosen activities remarkably different than competitors. This is still
valid statement from Porter (1996) how he defines the profitability for a
company after two decades. By doing activities better with added value to
the customer, company is able to get higher price from the product. It is
not easy task to perform in some industries. For example, when trying to
achieve this differentiating step in manufacturing companies where the
product is exactly same, also when equipment and processes are
fundamentally similar, it can be challenging. More often, pursuing
operational effectiveness happens by improving processes and therefore
achieving better business position. Operational effectiveness will lower the
costs used in making the product. (Porter, 1996)
Global competition has forced companies to renew their processes.
Continuous improvement has gained solid foundation as part of
companies strategy driving towards the zero defects methodology.
Japanese industry has shown it to world how operational excellence could
be achieved by different methods, tools and mindsets. Quality-thinking in
all areas as error-free is in the attention on manufacturing. All
manufacturing companies do base their production in some sort of
machinery or automation. This equipment is making the profit to the
company when it is running without unplanned stops or breakdowns.
When trying to achieve the best return on investement from the
manufacturing equipment, it is truly essential to recognize that efficient
maintenance is in vital role. (Hayes 1981)
This vital role of maintenance is also explained through production output
as indicator which is strongly influenced by equipment reliability and
maintainability. It has been recognized that proper maintenance system
will improve equipment availability and reliability. (Sharma 2012)

Total productive maintenance (TPM) is part of Lean methodology and it
focuses on getting more production by lower costs by focusing in problems
and breakdowns of manufacturing equipment. TPM aims to use all the
capabilities available in the company for improving quality, reliability,
safety and reducing waste by integrating maintenance and operations.
TPM is to find out the most value-adding activity for the workers. It also
emphazises the importance of operators which are proactively taking
responsibility of equipment condition. It is rarely realized that maintenance
improvement will lead to cost reduction which is often multiplied in profit
when comparing similar increase in company’s revenue. (Levitt, 2011)
TPM is the hardest part of Lean tools to implement, but at the same time it
is the tool which could make the biggest difference (Rubrich 2016).
This study analyzes the effects to production equipment utilization when
improving maintenance system in a high-volume manufacturing company.
The background for this thesis is explained in the first chapter 1.1 and
following it with introducing the case company and connection between
the need for the research.
1.1 Background
From the very beginning of starting up the beverage can manufacturing in
Mäntsälä in 2013 it had faced simultaneous problems with manufacturing
equipment. Unplanned stops and breakdowns caused the situation where
company was dragging behind the budget. There has been lot of support
from internal and external maintenance companies. Nevertheless, there
are problems which has stayed unsolved and are still causing down time.
Not to mention the new upcoming challenges when machines are starting
to age. There has been few major breakdowns which has caused
production to stop for days partly because of mistakes made during the
installation, but also caused by lack of adequate maintenance.
One part of the bigger problem is that working happens in shifts. There
has been lot of discussion and unsatisfaction about the fact that
information does not pass by between shifts. As there was not only lack of
communication identified between shifts, but also between shop floor and
management. The survey was conducted in the year 2014 and in the
results communication was highlighted as one of the major issues. In the
manufacturing facility where production figures are presented per shift, it is
easy to notice that teams tend to think only how their shift is performing
than seeing the big picture.
In June 2016 acquisition become real when Ball Corporation bought
Rexam. There was lot of re-arragement with plants and some of the plants
were sold or shut down. Extra motivation for staying in the budget comes
from the fact that the demand for the cans is growing, when situation in
Europe was optimized along the acquisition. Mäntsälä plant is making
more and more label changeovers with different products so it becomes
essential to focus on the condition of equipment. The challenge is to get
more production time by avoiding unplanned stops or breakdowns and to
nourish the communication about the maintenance actions.

1.2 Case Company
Until the June 30th 2016, Rexam was global leading can manufacturer with
their head office based on London. In the end of June, American container
and packaging company Ball Corporation made acquisition by buying
Rexam. Before the acquisition Rexam had approximately 8000 employees
around the globe in 25 different countries and 55 manufacturing plants.
Rexam was specialized of producing beverage cans. Rexam net sales in
the year 2014 were 3832 million pounds. Rexam owned leading market
position in three out of four BRIC countries also in Europe, South America
and second in North America. (Rexam 2016b)
Rexam as company had strong culture of sharing best practices
throughout the plants. Rexam drove towards the savings by reduction of
waste from manufacturing and business processes. (Rexam PLC 2016a)
After the acquision Rexam is now part of Ball Corporation, but still
continues with similar zero defect culture and strategy as Rexam had.
Ongoing reduction projects will be continued and therefore this thesis will
be conducted to Ball Corporation.
Ball Corporation was founded in the year 1880 and is having nowadays
approximately 18 700 employees worldwide in over 70 locations. In year
2015 net sales were 11 billion dollars. Unlike Rexam, Ball Corporation
does have also other business capabilities with beverage can
manufacturing. Other market areas are focused in household, healthcare
and personal care solutions and packaging. Metal food packaging, aerosol
cans and wide variety of beverage packaging solutions are part of Ball
Corporations product range. (Ball 2016)

1.3 Research objectives, questions and limitations
The aim of the study is to investigate the current state of case company’s
process and identify the most significant areas for improvement. Through
the analysis of the current state, improvement project will be established
leaning to the resources available in the case company. As a result of
resources available for the improvement project, study will be limited on
maintenance improvement. Nevertheless, the nature of the manufacturing
business is equipment oriented and therefore maintenance plays big role
in succesful business execution of the company.
The main objective is to find appropriate method according to the situation
of the company. Then the method will be implemented and implications
analyzed in quantitative data analysis methods. The focus of the study is
not in the evaluation of the project work or implementation process.
However, improvement team is vital part of the study as the root cause
analysis is conducted to the area of improvement. According to the results
of root cause analysis, the improvement method will be considered and
implemented.
The research questions to be responded are:
1. What is the key area for improvement?
2. How maintenance should be improved in the current situation?
The scope of the research is to find method for improving maintenance
process. If the choosen method is having positive impact on manufacturing
indicators such as OEE, it will be possibly extended to other areas or
equipments as part of the maintenance procedures. This fact works as
personal motivator for conducting the thesis. Modelling the maintenance
system method could be notable topic for further study, nevertheless it is
not took into consideration when conducting this thesis.
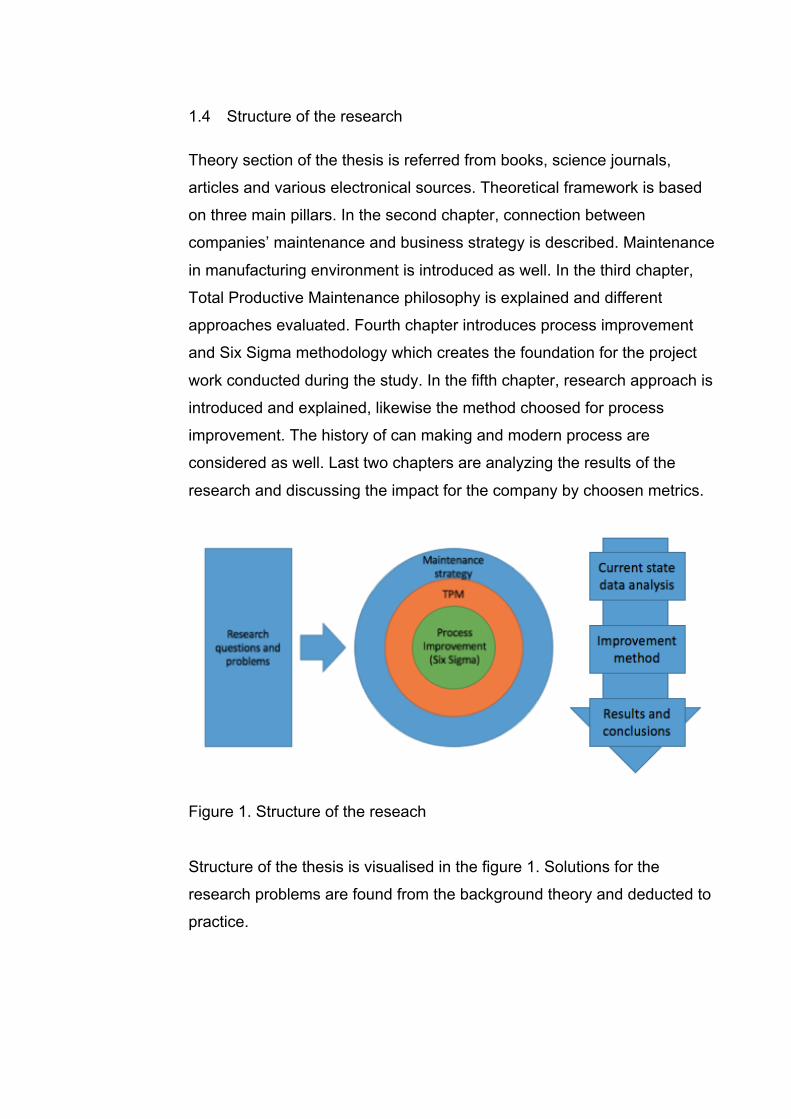
1.4 Structure of the research
Theory section of the thesis is referred from books, science journals,
articles and various electronical sources. Theoretical framework is based
on three main pillars. In the second chapter, connection between
companies’ maintenance and business strategy is described. Maintenance
in manufacturing environment is introduced as well. In the third chapter,
Total Productive Maintenance philosophy is explained and different
approaches evaluated. Fourth chapter introduces process improvement
and Six Sigma methodology which creates the foundation for the project
work conducted during the study. In the fifth chapter, research approach is
introduced and explained, likewise the method choosed for process
improvement. The history of can making and modern process are
considered as well. Last two chapters are analyzing the results of the
research and discussing the impact for the company by choosen metrics.
Figure 1. Structure of the reseach
Structure of the thesis is visualised in the figure 1. Solutions for the
research problems are found from the background theory and deducted to
practice.

2 MAINTENANCE IN MANUFACTURING BUSINESS
The history of systematic maintenance approach is fairly short when
comparing it to industrial age. Considerably far, as long as 1960s’
maintenance was equivalent with extinguishing fire. Maintenance of that
time aimed to fix equipment as it broke down. Indicator for successful
maintenance was situation where maintainers had time to sip coffee and
play card. Effectiveness of maintenance was measured in time of fixing
broken equipment. As late as 1970s’ it was recognized that maintenance
should be performed in a way which aimed to prevent breakdowns.
Company’s manufacturing process and strategy defines how maintenance
strategy is choosed. (Laine, 2010)
Challenges are multidimensional in manufacturing environment. Where
companies are trying to satisfy their customers increasing demands, at the
same time they are forced to pursue for higher quality, faster responses
and not to mention better performance. As trying to survive in this kind of
stiff situation, companies must rethink their business processes,
reorganize their production and focus on predictive rather that reactive
management methods. Management concepts should be also re-
evaluated to be more flexible and integrated. All these factors had forced
manufacturing companies to develop production lines with complex
systems where automation, integration and flexibility has been considered
thoroughly. Emerging requirements has led to situation where the need for
maximizing equipment availability, production cost effectiveness and
safety has increased. Therefore, one of the most important challenge to be
considered is optimization of the maintenance strategy. Developing
optimized maintenance strategy and approach it is possible to achieve
great impacts in overall. It is essential to recognize that maintenance is
key factor when improving equipment availability, cost optimization,
product quality, environmental issues, zero waste and energy control.
(Artiba & Riane 2005)

2.1 Role of maintenance
As mentioned in introduction chapter some maintenance engineers are still
focusing the simple fact, how fast they are fixing equipment when it breaks
down. The role of maintenance is prevent all losses caused by equipment,
not to fix breakdown as fast as possible. There are few major missions to
be sustained in world-class maintenance organization. (Mobley, 2002)
According to Mobley (2002) optimum availability of equipment is the most
important task. Equipment should be targeted to be online always and in
operating condition. Optimum operating condition should be considered in
all areas, whereas smallest problems and stops will form a huge loss when
calculated together. Every small stop will effect on plant overall
performance. Maximum utilization of maintenance resources is important
task to be fulfilled as well, even though maintenance actions are generally
minded as minor part of company’s total operating budget. It is in
maintenance manager’s responsibility to control resources effectively, like
internal and external maintenance labour, spare parts inventory and repair
parts. Spare parts inventory should be controlled the way that minimum
amount of necessary items are stored. One mission is to focus on
optimum equipment life which is could be achieved through
implementation of different maintenance programs. Even the best
programs could fail and unexpected breakdown could appear. In that point
maintenance organization should be ready to react rapidly.
When evaluating different maintenance types there are three main
indicators which could give a hint to company what is their current
situation. If production is interrupted by different maintenance reasons
more than 30 percent of total occurrences, we can say that management
philosophy is reactive, more or less breakdown oriented. For a
comparison, it is evaluated that target for maintenance related stops for
competitive manufacturing company is less than 1 percent of overall
occurrences. Next indicator for inefficient maintenance is overtime amount.
If overtime covers over 10 percent of total labor budget it is easy to

categorize company to breakdown type. Appropriate target is
approximately 1 percent of overtime. Since at some point overtime is
necessary, for example special projects do require constant participation
from experts, the overtime percent is never zero. Last indicator is labor
usage. This is part where is recognize place for improvement when
reflecting to my own experiences in manufacturing companies. Efficient
management style will utilize maintainers to perform preventive
maintenance actions for over 90 percent of working time. Actually, worst
case is to only monitor what equipment is breaking down next. Reliability
of critical plant systems is based on well-managed maintenance
organization. (Mobley, 2002)
2.2 Maintenance as part of company’s strategy
It has been mentioned repeatedly in literature that maintenance does own
a very important role in companies’ agenda, whereas it is directly related
to their competitiveness. Of course, when manufacturing systems are
measured in availability and reliability metrics they are corresponding to
company’s economic situation. Manufacturing equipment is company’s
most important capital asset and the main concern lies on its’ deterioration
and failure. At this stage some sort of the preventive maintenance is
necessary for restoring and maintaining equipment in operating condition.
With no doubt, goal for maintenance budget is to keep the expenses as
low as possible. In real life, maintenance managers are forced to answer
the question to maintain or not to maintain. Problemacy lies on the fact
that it can’t be predicted accurately when machine breaks down. Is
equipment performing reliable after maintenance, which will cause
certainly downtime for it? Is the costly operation worth it? However, if
equipment breaks down and spare parts are not ready and maintenance
planned, it will cause more downtime than planned maintenance. So, to
maintain or not to maintain? This is situation where maintenance manager
should choose his strategic approach or set-up maintenance system
according to different PM methodologies. (Artiba & Riane 2005)

Manufacturing plants normally are categorized roughly to two types of
maintenance strategies: run-to-failure or preventive maintenance. Run-to-
failure approach is simple. When equipment breaks it will be fixed. Money
spent on maintenance stays zero until equipment breaks down. Sounds
reasonable, but when equipment finally breaks down it will be expensive
case. The most significant costs are associated with high spare parts
inventory, high overtime labor, high equipment downtime and low
production availability. This approach is actually reactive, when failure
appears then maintenance team reacts. Actually, quite rarely there is not
preventive actions at all, like lubrication, cleaning or machine adjustments.
Nevertheless, what if more than one failure appears at time? Running
business like this is really risky. It has been evaluated that making
preventive maintenance actions like planning and scheduling upcoming
repairs is three times cheaper than waiting equipment to break down and
then fix it. (Mobley, 2011)
Preventive maintenance programs are mostly based on elapsed time or
hours of operation per equipment. Most commonly, there is evaluated time
to failure which is called also mean time to failure (MTTF). Figure 2.
indicates this life span of equipment deterioration. Figure indicates that
during the startup and at the end of equipment life expectancy the number
of failures will increase remarkably.
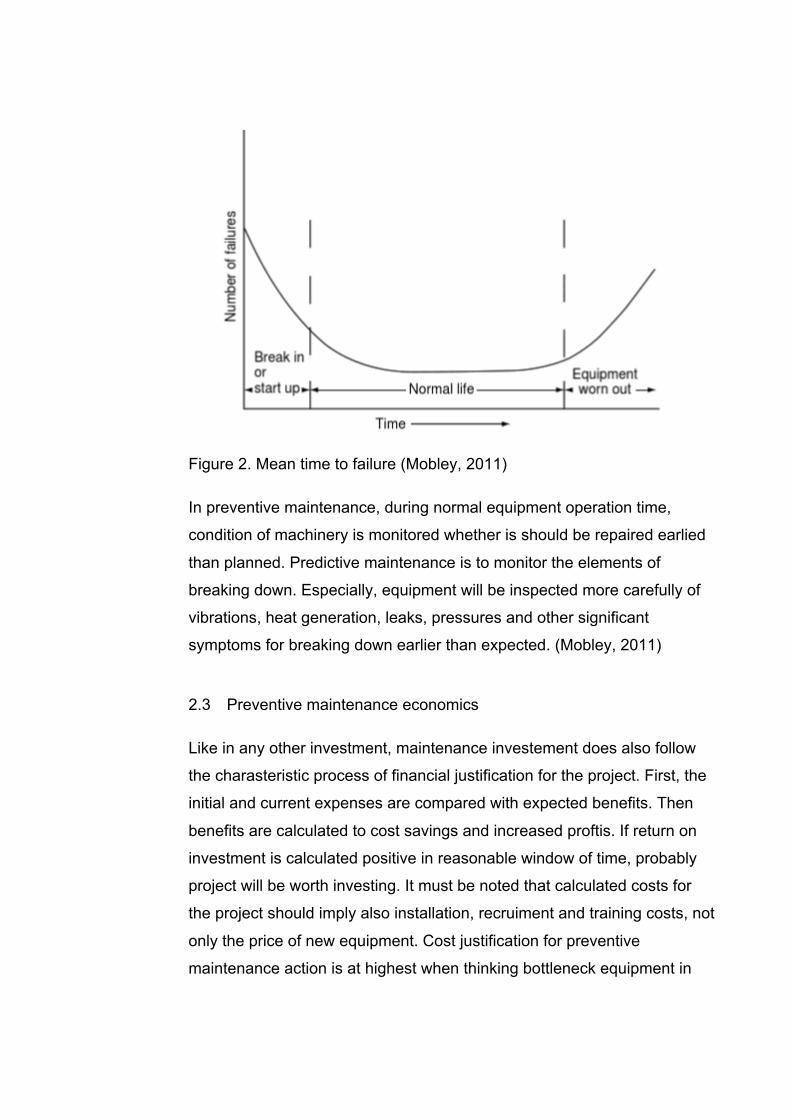
Figure 2. Mean time to failure (Mobley, 2011)
In preventive maintenance, during normal equipment operation time,
condition of machinery is monitored whether is should be repaired earlied
than planned. Predictive maintenance is to monitor the elements of
breaking down. Especially, equipment will be inspected more carefully of
vibrations, heat generation, leaks, pressures and other significant
symptoms for breaking down earlier than expected. (Mobley, 2011)
2.3 Preventive maintenance economics
Like in any other investment, maintenance investement does also follow
the charasteristic process of financial justification for the project. First, the
initial and current expenses are compared with expected benefits. Then
benefits are calculated to cost savings and increased proftis. If return on
investment is calculated positive in reasonable window of time, probably
project will be worth investing. It must be noted that calculated costs for
the project should imply also installation, recruiment and training costs, not
only the price of new equipment. Cost justification for preventive
maintenance action is at highest when thinking bottleneck equipment in

process. If condition of the machine is not monitored carefully, it will be
tremendous cost when breaking down unexpectedly. (Mobley, 2002)
Maintenance budget is usually counted as a cost overhead, fixed sum
which is reserved for staff wages, spare parts and consumables. Quite
common system is also to evaluate the performance of maintenance
department compared to budget. If budget surplusses, even when
production suffers lack of maintenance, quality or availability, it is
evaluated positively. This is wrong mindset, instead we can justify that
preventive maintenance is actually investment, not expendature.
Nevertheless, reliable data for justifying the return on investment should
be presented before implementation. Usable indicator for improvement
could be equipment performance and then translated to financial benefits.
The cost of lost production time is indicator which could be translated also
to lost units made and then again translated to financial data. (Mobley,
2002)
Figure 3. Cash flow diagram of lost production (Mobley, 2002)
Figure 3. presents the lost production effects to company’s cash flow,
which turns negative and accumulates when consecutive breakdowns
appear. It is not only the time when breakdown is causing downtime but in
many cases the full performance of equipment is not established until
certain amount of time, which is causing negative cash flow as well. So,
based on he previous arguments, this negative cash flow could be
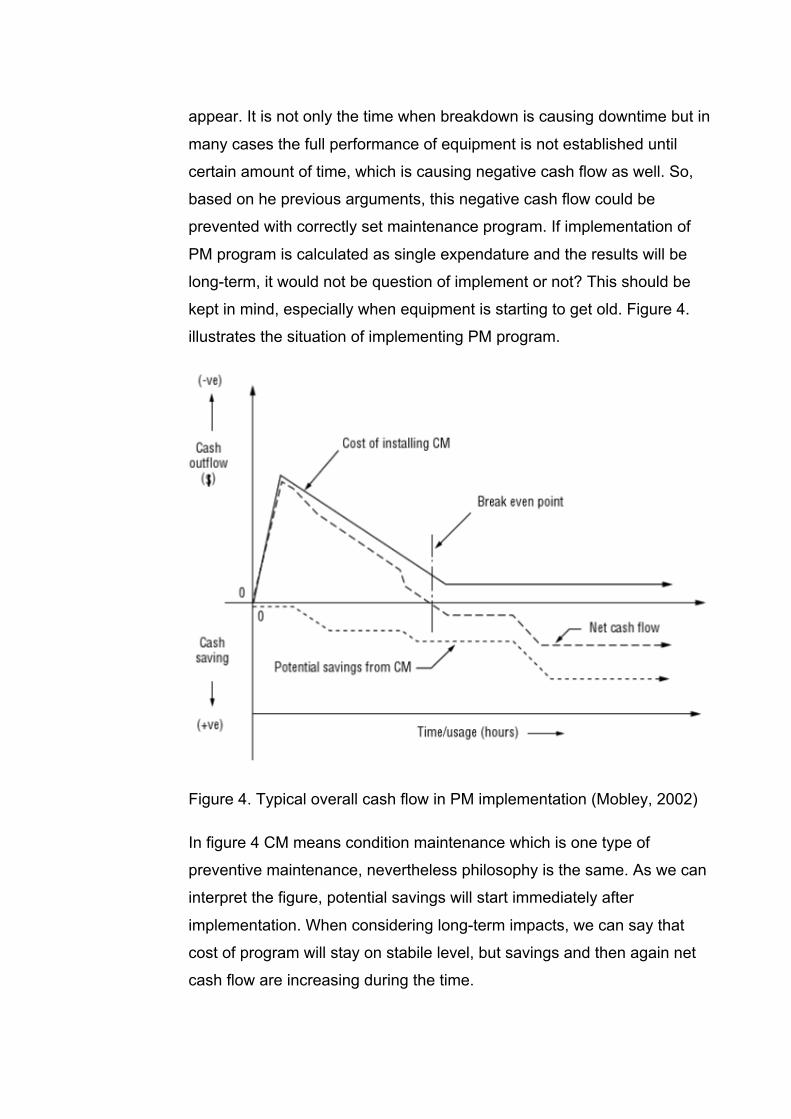
prevented with correctly set maintenance program. If implementation of
PM program is calculated as single expendature and the results will be
long-term, it would not be question of implement or not? This should be
kept in mind, especially when equipment is starting to get old. Figure 4.
illustrates the situation of implementing PM program.
Figure 4. Typical overall cash flow in PM implementation (Mobley, 2002)
In figure 4 CM means condition maintenance which is one type of
preventive maintenance, nevertheless philosophy is the same. As we can
interpret the figure, potential savings will start immediately after
implementation. When considering long-term impacts, we can say that
cost of program will stay on stabile level, but savings and then again net
cash flow are increasing during the time.

Figure 5. Balance between cost and level of PM (Mobley, 2002)
Figure 5. is illustrating different maintenance type and cost relationship.
Vertical scale presents amount of money used and horizontal line
visualizes the level of preventive maintenance. Cost of lost revenues curve
represents downtime. We can interpret from figure 5, that when executing
more preventive maintenance actions, the cost of maintenance are
expectedly increasing. However, downtime and corrective maintenance
are decreasing as result. Nevertheless, the curve indicates that at some
point preventive maintenance costs will surpass both at level of 80%. As a
result we can make assumption that finding a perfect balance of costs and
amount of preventive maintenance is essential when achieving optimal
result. Optimal amount of preventive maintenance is marked in total costs
curve when it reaches bottom at 50%.
3 TOTAL PRODUCTIVE MAINTENANCE
TPM is holistic view of the impacts of maintenance in production. TPM
means that whole organization is making commitment for sustain, develop
and maintain manufacturing capacity. One of the leading principles in TPM
is that every employee participates. TPM is basing on teamwork and for
managers especially coaching these teams to top performance. When
creating favourable environment for motivation growth we can achieve
highly motivated employees playing in our team. (Laine 2010)
Total Productive Maintenance (TPM) has been developed in Japan and
spread across the world by Japan Institute of Plant Maintenance. There
are several similar development methods and tools with TPM like TQM
(Total Quality Management) and JIT (Just-In-Time) which are supporting
each other. (Tuominen, 2010).
First, Nippondenso a Japanese component manufacturer for automotive
industry started using TPM in the year 1961. Actually, name was first
introduced as ’Productive Maintenance with Total Employee Participation’
which is quite self-explanatory term. Soon, TPM was implemented also by
Toyota and other Japanese manufacturing companies. At latest TPM
spread also to rest of the world in 1990’s when competition started to
demand quality improvement program implementations like TQM. (Sharma
2012)
TPM relies on five different sections, maintaining quality, productive
maintenance, manufacturing technique, cleaniness & order and highly
skilled employees. However, Japan Institute of Plant Maintenance defines
that TPM should be implemented according to following minimum
procedures.
1. Set goals which will maximize equipment effectiveness
2. Create sustainable productive maintenance system
3. Engage all departments – planning, production, quality,
maintenance.

4. Involve whole organization in TPM program
5. Create focus groups to motivate and support maintenance
TPM is way of thinking that maintenance is every where, it is not anymore
limited to corrective or preventive maintenance actions. In the definition of
maintenance according to the TPM belongs that maintenance is
emphasized in relation between companys overall income and cost
structure. Maintenance should be element that increases gross
productivity. Maintenance is always included as part of continuous
improvement strategy and as part of companys main strategy. Daily
maintenance agenda is not enough when goal is to get high machinery
utilization rate and productivity figures. Certain elements should be taken
into consideration according to TPM to achieve the goals set, these
elements are also called as pillars. (Laine 2010)
3.1 5S
5S is pre-phase for TPM implementation by preparing optimal
circumstances by minimizing the environmental effect to the work flow. 5S
forms the foundation for other TPM implementation activities by making
positive impact to work force motivation in early stage. Implementation of
5S is vital in terms of working safety, quality, efficiency and downtime.
Although, 5S system requires constant observation to be succesful. The
5S philosophy is focusing on simplification of the working environment.
There are five guidelines in 5S system: (Korkut et al. 2009)
1. Sort
2. Set in order
3. Shine
4. Standardize
5. Sustain
Sorting and arranging working environment to be logical is the first rule.
Rarely used material should be disposed, needed materials and
equipment should be sorted properly in their own places. This will help the
work flow when everything is in order. Second rule is to arrange work
stations to be used as fluently as possible to set and maintain own places
for tools, machines and materials. It will improve safety in around working
station and it will be more faster to find needed tool. Especially, it is
imporant to have storage areas set in order according to 5S. Third rule is
about setting regular cleaning practice. Clean working place helps to
detect abnormalities in equipment as well it makes working more
comfortable. Working place should be divided to different cleaning aresas
and responsible personnel for each area to be set. In order to do cleaning
in regular basis, cleaning times should be recorded and monitored. Fourth
5S rule concentrates to standardization of system. Visible system and
performance monitoring should be established. Cleaning procedures and
argumentation behind the system are presented in TPM board. Final setp
of 5S system is to make it sustainable. 5S training should be arranged as
well importance of the system should be explained to employees.
Together all these actions will create a solid fountation for TPM
implementatition. (Korkut et al. 2009)
3.2 Eight pillars of TPM
According to the most accepted model of TPM, consisting 8 pillars created
by Nakajima 1984 who is considered as father of TPM philosophy. Pillars
according to Nakajima model are:
• Focused Improvement
• Autonomous Maintenance
• Preventive Maintenance
• Education and Training
• Early Equipment Management
• Quality Maintenance
• Office TPM
• Safety, Health & Environment
(Sharma 2012)

Figure 6. TPM pillars (ABMS 2016)
As introduced is figure 6, all eight TPM pillars are lying in the 5S
foundation in which altogether can lead to world class results. All eight
TPM pillars are explained in next eight chapters from 3.2.1 to 3.2.8 by
starting from focused improvement pillar.
3.2.1 Focused Improvement
Focused improvement is including activities that are maximizing the overall
effectiveness of equipment and processes. The main objective is to
improve performance by eliminating losses. The performance and higher
productivity of equipment is the responsibility of not only engineers and
technicians but also operators and managers. The focused improvement
methodology of restoring equipment in basic condition and practicing it
creates the foundation for productivity improvement. It is essential for
continuous improvement to find minor defects because eventually those
will lead to major failure of equipment. Cleaning, lubrication, adjusting and

tightening are vital part of exposing hidden abnormalities. Process of
equipment restoration should be set as continuous action. (Sharma 2012)
Improvement activities are commonly set up for certain problematic
equipment or process. Improvement or suggestions are worked through
cross-functional teams where different approaches are included in
contribution. As soon as improvement team has identified problematic
equipment and trained for maintenance of it, team will set improvement
goals. Normally, improvements are achieved in maximum of five day long
kaizen event. Essential part of the event is measuring the current state
performance which could be compared to future performance after
improvements implemented. Focused improvement approach is executed
as short-term project where improvements are implemented and timeline
for follow-ups are agreed. Advantages of focused improvement are
accomplished as quick gains by using cross-functional teams by promoting
lean methodology. (Gitachu 2016)
3.2.2 Autonomous Maintenance
Organizing maintenance to be holistic approach from bottom to top levels
starts from operators, actual machine users. Autonomous maintenance is
basicly operator participation in minor maintenance tasks. The main idea
behind this kind of thinking is to share maintenance tasks with
maintenance personnel and to keep equipment in top shape. Autonomous
maintenance is activity which involves all operators to maintain the
performance, condition and cleanliness of equipment in approriate level.
Operator mindset should be ”I own the machine” instead of ”I run the
machine” to succesfully implement autonomous maintenance. It is
recognized that autonomous maintenance is one of the highly valued
pillars in TPM. Operator is in the key role of maintaining the basic
equipment condition and at the same time protecting assets of the
company, based on the simple fact that operator is using, cleaning and
inspecting equipment daily. Operator is in the key role of discovering
abnormalities of equipment. In other hand, it requires that operator is

highly skilled and trained to be able to detect faults. Second, shop floor
should be organized and cleaned in the way that detecting abnormalities is
possible in first place. Autonomous maintenance aims to prevent situation
where equipment is not utilized like unplanneds stops and breakdowns.
The main focus should be in maintaining basic condition of equipment.
(Sharma 2012)
Reporting maintenance activities made is vital part of autonomous
maintenance. Whenever operator is performing maintenance tasks or daily
checks, it should be reported. For example, if operator finds abnormalities
from equipment it must be reported in the maintenance system. Constant
monitoring of equipment is foundation for autonomous maintenance and
zero defects philosophy. (Laine, 2010)
Normal TPM route for autonomous maintenance implementation is
separated in 7 step program according to Toyota.
1. Perform initial cleaning and create metrics system for monitoring
cleanliness.
2. Eliminate factors causing disorder and improve accessibility in
maintenance locations.
3. Create standards for cleaning and equipment inspection.
4. Perform a wide scale equipment inspection.
5. Arrange training for operator checks and equipment inspection.
6. Organize working environment according to TPM principles:
(productivity, zero defects, continuous improvement)
7. Organize autonomous maintenance to be systematic (monitoring,
reporting, controlling and continuous improvement) (Laine, 2010)
When maintenance operations are more or less moved to operators’
responsibility, it might cause some challenges in organization. The
implementation of autonomous maintenance system has challenges
recognized similarly when implementing anything new in an organization.
Operators might feel that their workload is getting bigger which will
possibly decrease their motivation. Most likely this will lead to conversation
between workload and proper wages. Second, skilled maintainers might
feel that their work is undervalued and fear of resignation might occur. One
motivation for resistance could be also solidarity between operators and
their workloads. Change management skills from managers are essential
when planning to implement autonomous maintenance system. It is
important to create positive athmosphere and expectations of upcoming
routines and to explain the long-term benefits. One cornerstone of
implementing autonomous maintenance system is to start moderately and
increase maintenance tasks to operators as their skills improve. The risk of
too rapid implementation cycle and too high expectations from operators
might cause system failing and causing more disadvantages than
advantages. (Laine, 2010)
Autonomous maintenance will benefit the whole organization. Operators
will have more responsibility of equipment they are using and their skills
will increase as they participate more in maintaining equipment. Basic
maintenance tasks are performed by operators, such as cleaning and
lubrication. Whenever abnormalities appear, those can be identified and
considered to be part of next maintenance event before causing severe
breakdown. Eventually, more skilled maintenance personnel are available
for more higher-level maintenance tasks, when operators are focusing on
minor tasks. The most important advantage is that lifespan of equipment is
increasing and deterioration is prevented. (Gitachu 2016)
3.2.3 Preventive Maintenance
Preventive maintenance or planned maintenance is making scheduled
maintenance actions for obtaining optimal equipment and process
conditions. Planned maintenance actions are targeted to achieve zero
failures, zero defects and zero abnormalities. Secondarily, it is aiming to
improve the quality of maintenance department personnel. Yet, the
objective is to increase equipment availability. There are different types of
maintenance actions available in different situation, which are to reduce
maintenance tasks overall. (Sharma 2012)
Preventive maintenance consists different approaches.
Breakdown Maintenance (BM) Is activity performed when equipment is failing, stoppage or when
performance is hazardous.
Time-Based Maintenance (TBM) This is preventive maintenance activity which is set to be made frequently
on daily, weekly or monthly basis. The aim is to prevent sudden
breakdown of equipment by maintaining it regularly.
Usage-Based Maintenance (UBM) This type of preventive maintenance activity is based on number of certain
production metrics like operating hours, number of products made and
number of processed parts. It is in some cases more convenient to
schedule maintenance actions according to stress of production than time-
based.
Condition-Based Maintenance (CBM) This is more specific version of usage-based maintenance by focusing on
variation, wear and degration of equipment. For example, worn out die-set
should be replaced before quality of the product degrades
Predictive Maintenance (PM) Predictive maintenance is furthermore activity of monitoring all other
metrics concerning equipment like voltages, currents, flows, deviations
and clearances.
Corrective Maintenance (CM) Corrective maintenance activities take place when equipment is having
abnormalities effecting negatively into performance. The objective of
corrective maintenance is to eradicate failure modes by continuous
improvement actions, autonomous maintenance for example. It aims to
reduce amount of maintenance tasks performed by using TPM framework
and corrective actions.
(Sharma 2012)
3.2.4 Education and Training
Education and training pillar forms the foundation for whole TPM activity in
organization. Since, the operators’ skills and knowledge acquired for
maintenance is essential and will define the effectiveness of the TPM
implementation. Eventually, education and training pillar is supporting
others pillars and bringing content to them. The training could be
conducted in various ways. Training methods in manufacturing facilites
could be arranged as on the job training, off the job training or one point
lesson. One point lesson is widely used and recognized to be one of the
most efficient tool for skill transfer and learning. One point lesson is rapid
learning through pinpointed view of equipment structure, function or
mtehod used. It is important that one point lesson is visual and could be
practiced repeatedly during the day. Especially, when there is lack of time
for training, one point lesson could be solution to be followed. One point
lesson is highly suitable for learning minor maintenance tasks conducted
by operator. Free discussion and analysis of the specific problem and one
point lesson made is also typical approach for this way of learning.
(Sharma 2012)
3.2.5 Early Equipment Management
Early equipment management also called as maintenance prevention is
actually preface before using or purchasing equipment to consider their
reliability, maintainability, safety and operarability as well as estimated
maintenance costs. TPM approach not only consider reliability and
maintainability when purchasing new equipment but aims to overall system
improvement by prevention of all other losses. Equipment with effective
maintenance prevention should not in any case produce nonconforming
products or break down. (Sharma 2012)

Practical ways of early management are collected from previous
maintenance experience as collaboration with engineers and machinery
suppliers. By ensuring equipment to reach optimal performance, the
positive impact on profitability will be secured as reduced maintenance
costs. There are some factors which should be considered from the very
beginning when desingning new equipment. Initially, accessibility to parts,
lubrication, cleaning and inspection are in key role. Early management
should notice also ergonomical placing, feedback mechanism and safety
features. Not to mention placing of machinery considering changeover
procedures. Before installation of new equipment, operator concerns
should be adressed. (Gitachu 2016)
3.2.6 Quality Maintenance
Quality maintenance is maintaining process and product in certain
specifications. Quality maintenance is strongly formed by the combination
of other pillars. Monitoring and inspecting equipment condition is in vital
role. Quality maintenance aims to react before equipment variation or
defects take place. (Sharma 2012)
The main objective is to get specification first time right by finding root
causes of failure modes rather than using quick fixes. It is important to
undestand that when defected product appears it will cause lot of extra
work down the value chain or process. Fishbone diagram or 5 why root-
cause-analysis are well structured methods for finding root cause or
bottlenecks from manufacturing process. (Gitachu 2016)
3.2.7 Office TPM
Office TPM or administrative TPM are supportive functions or activities like
logistics and warehousing. As mentioned earlier TPM is methodology for
whole company and office is strongly part of it also. Accordingly, it is
important to improve continuosly office funtioncs as well, since they do
have implicit impact on manufacturing operations. (Sharma 2012)
Additionally, horizontal co-operation in organization according to TPM
principles will increase understanding of implementation benefits. For
example, if spareparts warehouse system is improved as support process
it will have a positive effect on the manufacturing process. (Gitachu 2016)
3.2.8 Safety, Health & Environment
Safety, health & environmental pillar is counted in as from sustainability
point of view. Manufacturing industry is globally huge source of pollution,
as a result TPM does have strong emphasis in this area. Of course, this
pillar aims to prevent any human or equipment errors leading to injuries or
accidents. Zero safety and zero environmental accidents will be achieved
by identifying and eliminating any abnormalities. (Sharma 2012)
In practice, workers must be safe when working in manufacturing site. The
value for the customer should not be done by the benefit of workers health
or life. It has been noticed that correlation exists between productivity and
safe working environment. However, if accident or near-miss situation
occurs, the investigation of equipment should be done by cross-functional
team to work towards more safe environment by placing guards or
instructions. Not to mention compulsory personal protective gear or first-
aids kits around the working area. (Gitachu 2016)
3.3 Six big losses
As TPM aims to minimize all potential losses in manufacturing, it also
emphasizes the quality of product and process. When improving
equipment effectiveness according to TPM methodology, we are actually
looking into six big losses which are derived from three main categories of
manufacturing parameters. In TPM identifying connection between losses
and effetiveness is fundamental (Almeanazel 2010). In next chapter 3.4,
the connection is explained more closely in the form of OEE calculation.

1. Downtime Losses
Downtime from the process point of view means that output of
production is zero. When output is zero, the period of time under
examination is the amount of time when equipment is not running.
Downtime losses could be separated in two different categories.
a. Downtime could appear when equipment fails or breaks
down. Breakdown losses are measured from the actual
breaking down of equipment to the point where it is fixed, up
and running again.
b. Second reason for downtime loss could be setup and
adjustment time. These losses appear when product or
process have to be changed for different reasons. The most
typical reason for setup and adjustment time losses are
changeovers, exchange of dies, jigs and tools. This loss type
generally is consisting setup, start-up and adjustment
downtimes. (Almeanazel 2010)
2. Speed Losses
Speed losses are cases where equipment is not performing as it
should be in referenced speed. Speed loss could be identified as
lower output of equipment. This is measured as comparing
theoretical working load to actual.
a. Reduced speed of equipment caused by quality variation
when operating original speed.
b. Minor stoppages and idle time are considered also as speed
loss when appering regularly. Usually, this types of
stoppages are forcing to reduce the equipment speed.
(Almeanazel 2010)
3. Defect or Quality Losses
Quality loss happens when process output is not considered to be
good according to quality specifications.

a. Quality defects are material losses and also requires labor
when products are reworked or scrapped. Calculation of this
type of losses could be done by comparing quality products
to the total production.
b. Yield losses are such as raw material losses caused by
supplier quality defect. It could be also quality defect
produced in starting up after adjustments or changeovers.
(Almeanazel 2010)
3.4 Overall Equipment Effectiveness
As introduced in chapter 3.3, six big losses in TPM are stricly related to
ideal performance and zero loss methodology and OEE calculation is way
to measure how succesfully losses are controlled. OEE could be described
as the ratio between actual equipment output and the maximum
equipment output in optimal manufacturing conditions. (Almeanazel 2010)
In manufacturing industry OEE is viewed as key performance measure
considering all kind of processes and equipment. In the year 1988
Nakajima introduced OEE as TPM performance measurement system
which focuses into manufacturing equipment by offering clear overall
metric. In todays’ manufacturing world it has become essential tool for
productivity measurement. Traditional metrics are insufficient when
handling problems and identifying required improvements for increasing
productivity. Originally used metric for availability was loading time, but
since the Nakajima days, OEE calculation has evolved by the fact of
adequate metrics in some areas like material input, labour and planned
downtime. Nevertheless, the accuracy of OEE is depending on the quality
of collected data. (Sharma 2012)

Overall equipment effectiveness is simple way to measure current status
of production. Higher productivity could be achieved by utilization of man,
machines, material and methods. OEE consists three essential
parameters, Availability (A), Performance (P) and Quality (Q). (Karthick,
Kumar & Vivekprabhu, 2014)
Figure 7 indicates how traditional six big losses are connected to OEE
calculation. Recommended six big losses are rephrased to more
explanatory form from traditional.
Figure 7. Six big losses (Vorne Industries Incorporation 2016)
OEE calculation is done by following pattern which is presented in figure 8.
Figure 8. OEE Calculation (Vorne Industries Incorporation 2016)

Availability is the first OEE factor having impact on total OEE. Availability
is calculated from the ratio of planned production time and actual run time
(Vorne Industries Incorporation 2016).
Availability = Run Time / Planned Production Time
Planned production time equals to the time that equipment is expected to
produce good units. It comes from planned stops like maintenance days or
similar schedule losses subtracted from all time available (Vorne Industries
Incorporation 2016).
Planned Production time = All Time – Schedule Loss
Run time is calculated by subtracting stop time from planned production
time. Stop time or downtime is defined as unplanned stops, breakdowns or
planned stops like changeovers (Vorne Industries Incorporation 2016).
Run Time = Planned Production Time – Downtime
For example, if beverage can decorator is planned to run 24 hours per day
and changeovers and breakdowns take 5 hours from day, availability will
be (24-5) / 24 = 0,79 = 79%
In performance rate calculation there is two main factors needed, ideal run
rate and total output including defects. Ideal run rate is designed maximun
speed for equipment to produce good parts (Almeanazel 2010).
Performance = (Total Output / Run Time) / Ideal Run Rate
For example if decorator ideal running speed is 1500 CPM (cans per
minute) and total output is 1596000 cans then the calculation is executed
as follows, (1596000 cans / 1500 cans per minute) / (19 h * 60 min) = 0,93
= 93%
Quality is last factor of OEE calculation. Quality rate indicates the effect of
rejected parts produced compared to total output. These are products to
be scrapped or reworked (Almeanazel 2010).

Quality = (Total Output - Defects) / Total Output
For example if decorator produces 188000 cans which does not meet the
quality standars the OEE value will be calculated, (1596000 - 188000) /
1596000 = 0,88 = 88%
Eventually, we can calculate the total OEE value for the decorator
example used.
OEE = 0,79 * 0,93 * 0,88 = 0,64 = 64%
To gain Japanese World Class PM Excellent Award plant has to achieve
total OEE over 85%. Calculation of OEE should always be modified and
concerned according to the process under investigation. In most of cases
calculation model is choosed based on available data collection and
analysis method. Especially, when there are many different products,
batches are short with large amount of changeovers. Naturally, quality of
the raw material have an impact on performance. Therefore, there is
possibility for greater variation of OEE average. Nevertheless, it is not
crucial when OEE calculations from same process are conducted similarly
and then could be compared as long-term results between each other.
(Laine, 2010)
In figure 9, typical OEE structure of beverage can manufacturing process
is visualized and presented. Factors highlighted in yellow are
differentiating from normal efficiency calculation of equipment. As we can
interpret the visualization, the planned shut down is counted as only factor
effecting on planned production time or loading time as in figure 9.

Figure 9. OEE Model (Macey, 2015)
OEE is indicated with yellow arrow, which is subtraction from total working
time from availability, performance and quality factors. OEE is translated
as value adding time which means the total time when good parts had
been produced. By subtracting value added time from working time we
could calculate the possible time available for operating time by using TPM
implementation for example.
In practice, when evaluating the OEE result it has to be remembered that
results could vary in different manufacturing facilities. For example, places
where changesovers consume significantly time from production time it is
challenging to improve OEE. Accordingly, OEE target should bet set by
prevalent manufacturing process. More important is to improve OEE result
incrementally than try to achieve something that is not possible. (Laine,
2010)
Laine (2010) states that improving OEE, the plant will get more products to
be sold with same amount of people working in same time frame. If
advantages of OEE improvement could not be utilized in other words if
extra products manufactured could not be sold it is in management
responsibility to balance with capacity and investments so that

overproduction does not appear. In the situation when market demand is
growing, improving OEE is way to get more production capacity without
expensive investments. In this case cost per units is decreasing.
Estimatingly, OEE improvement by 3-7% will double companys earnings
before interest and taxes. Generally, maintenance costs are 5% of
company’s revenue. Nevertheless, if savings does hit the maintenance
budget by 10 to 20 percent, the effect in OEE might be negative. Usually,
when this happens the savings gained from cutting maintence costs are
smaller than profit lost in production.
Costs of TPM are often divided into traditional accounting categories like
direct maintenance costs, spare part costs, external maintenance costs
and labour costs. It rarely happens that lost profit is calculated in, which is
actually the biggest missing opportunity for gained return. Maintenance
costs could be divided into three different categories, lost profit, indirect
costs and direct costs. Lost profit could be counted in as part of
maintenance cost in accounting system when we identify that breakdown,
changeovers, slow cycles, reduced speed, process defects and reduced
efficiency are caused by lack of proper maintenance actions. Indirect
maintenance costs are rejected process outputs and material costs.
Resource consumptions like, energy and water costs are usually
calculated in. Unavailing equity like fixed assets, working capital and
interes expenses are calculated as indirect costs. Direct costs are salaries,
spare parts, equipment, bought-in services which are certainly considered
as part of accounting. (Laine, 2010)

4 PROCESS IMPROVEMENT
Continuous improvement or process improvement is a philosophy which
was presented by Deming as improvement ideas that are increasing
successes and reducing failures or defects. Otherwise, improving
processes is seen as enhancing creativity, gaining operational excellence
and competitive edge in market. Clear fact is that involvement from all
levels of organization is needed. Process improvement or continuous
improvement does not necessarily need great investments. Especially,
when looking in the history of continuous improvement, initiatives came
from the shop floor people, not from the management. Positive
organizational changes were rewarded as early as in late 1800s.
Nowadays, we can define improvement by different measures but when
talking generally improvements, they are targeted to eliminate waste in
processes. Improvements could be gained through different tools and
techniques. (Bhuiyan & Baghel 2005)
One of the earliest process improvement methods developed is the
Deming cycle. The Deming cycle was modified from the original idea of
Walter Shewart’s three step process to continual improvement,
hypothesizing, executing an experiment and testing the hypothesis. The
Deming wheel is more evolved version of Shewarts method. The Deming
cycle consists four different steps, Plan, Do, Check/Study and Act.
PDCA/PDSA is method for both short-term and long-term organizational
learning and improvement. The Deming cycle has created a solid
foundation as companies’ process change and improvement methodology.
In the planning stage current state analysis is made and process is
described. Additionally, problems are identified and action plans are made.
In Do stage plans are implemented in different ways, for example process
pilot projects is commonly used method. Data from pilot or trial is collected
and documented. In the Study/Check stage project is evaluated whether it
is heading on right direction or if it needs still adjusting. In the Act stage
improvements are implemented as part of organizations standard working
procedure. It is introduced to all organization levels as the best practice at
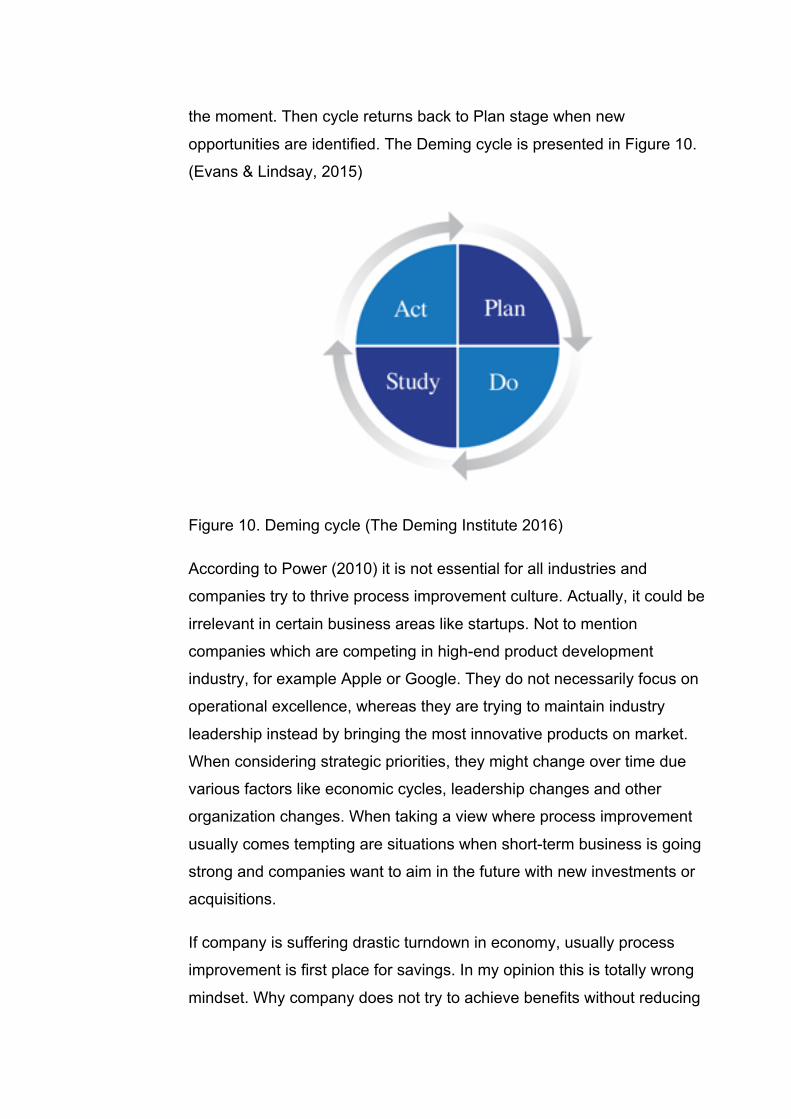
the moment. Then cycle returns back to Plan stage when new
opportunities are identified. The Deming cycle is presented in Figure 10.
(Evans & Lindsay, 2015)
Figure 10. Deming cycle (The Deming Institute 2016)
According to Power (2010) it is not essential for all industries and
companies try to thrive process improvement culture. Actually, it could be
irrelevant in certain business areas like startups. Not to mention
companies which are competing in high-end product development
industry, for example Apple or Google. They do not necessarily focus on
operational excellence, whereas they are trying to maintain industry
leadership instead by bringing the most innovative products on market.
When considering strategic priorities, they might change over time due
various factors like economic cycles, leadership changes and other
organization changes. When taking a view where process improvement
usually comes tempting are situations when short-term business is going
strong and companies want to aim in the future with new investments or
acquisitions.
If company is suffering drastic turndown in economy, usually process
improvement is first place for savings. In my opinion this is totally wrong
mindset. Why company does not try to achieve benefits without reducing
labour costs or maintenance budget? This is certain way to complete
doom when you are losing your best assets, your skilled and talented
people.
Nevertheless, according to Power (2010) I agree that it is vital to
understand where and when improving processes is critical. The idea of
improving processes is also to keep timing and focus correct and turning it
into as part of company’s competitive strategy.
There are various different methodologies available for companies to
choose the most attractive process improvement method for their needs.
Especially, Total Quality Management (TQM), Six Sigma, Business
Process Re-engineering (BPR) and Operational Excellence has been the
most popular approaches lately. Despite which methodology the company
will lean on, it is factual that they will include diffent toolsets, yet principles
included are quite close each other. In this case study the process
improvement approach is done based on Six Sigma DMAIC roadmap.
(Sokovic, Pavletic & Kern Pipan, 2010)
4.1 Six Sigma
Six Sigma came famous when Motorola was first to implement it
succesfully in mid-1980s. After that it came popular in other big companies
and wave of mass implementations started. Six Sigma is an effective and
precisely set approach in improvement of manufacturing product and
processes. The foundation of Six Sigma is strongly based on total quality
and continuous improvement principles. Originally, Six Sigma was to
improve four key metrics, quality, productivity, cost and profitability.
Nevertheless, Six Sigma is bringing new tools and variations to
improvement implementation process and philosophy. Performance
improvement is behind hard work and it requires the engagement of whole
organization to gain reduction of defects, better employee skills, efficient
operations and overall more fluent work flow. Six Sigma’s fundamental
purpose lies on improving organizational processes. It aims to find root

causes and corrective actions, reduction of cycle times, higher assets
utilization and return on investment. Six Sigma seeks to explain the
financial benefit when making improvement approach. Since, it might be
financially crucial step toward the more competitive positioning in the
market. The toolset of Six Sigma is actually in the problem solving
methodology called DMAIC. (Evans & Lindsay, 2015)
Six Sigma offers structured problem solving path which relies on quite
common route according to known quality revolutionists like Deming,
Juran and Crosby. Many common themes are building a foundation for Six
Sig problem solving and improvement methodology. First, problem is
redefined and analyzed. In practice, collecting and analyzing the data and
studying the problem from different viewpoints are the main activities to be
done. Second, events or meetings where brainstorming, free thinking and
generating ideas is in focus to develop solutions or improvements. Next
step in this path is to evaluate and select the most potential idea which will
lead to most value-adding situation. Eventually, final step is to implement
this strictly choosen idea and present the advantages of it to the
organization. The main principle behind the DMAIC methodology is –
define, measure, analyze, improve and control. (Evans & Lindsay, 2015)
When following DMAIC process improvement pattern, first in the beginning
the problem is defined. This leads to project selection and setting up the
Six Sigma project team. Project team is build-up as cross-functional, all
departments and specialist whom are adding-value to the project are
involved. Definition of project scope and problem is clearly defined, usually
it consists improving some part of the process or reliability of equipment.
Project scope should also define the impact to quality and customers. At
the beginning current state of errors, performance, customer complaints
and all other relevant metrics should be described. The definition phase
should also imply the expected level of performance after the project.
Likewise the project team, schedule, resources and project management
should be addressed. (Evans & Lindsay, 2015)
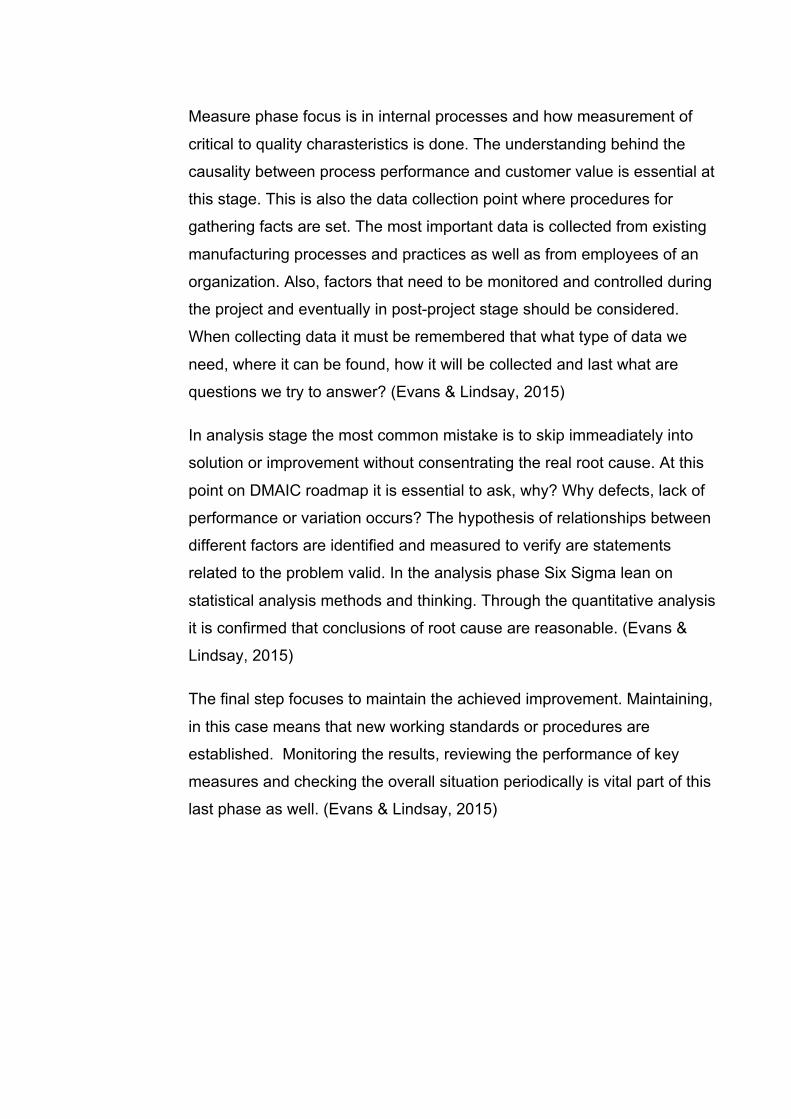
Measure phase focus is in internal processes and how measurement of
critical to quality charasteristics is done. The understanding behind the
causality between process performance and customer value is essential at
this stage. This is also the data collection point where procedures for
gathering facts are set. The most important data is collected from existing
manufacturing processes and practices as well as from employees of an
organization. Also, factors that need to be monitored and controlled during
the project and eventually in post-project stage should be considered.
When collecting data it must be remembered that what type of data we
need, where it can be found, how it will be collected and last what are
questions we try to answer? (Evans & Lindsay, 2015)
In analysis stage the most common mistake is to skip immeadiately into
solution or improvement without consentrating the real root cause. At this
point on DMAIC roadmap it is essential to ask, why? Why defects, lack of
performance or variation occurs? The hypothesis of relationships between
different factors are identified and measured to verify are statements
related to the problem valid. In the analysis phase Six Sigma lean on
statistical analysis methods and thinking. Through the quantitative analysis
it is confirmed that conclusions of root cause are reasonable. (Evans &
Lindsay, 2015)
The final step focuses to maintain the achieved improvement. Maintaining,
in this case means that new working standards or procedures are
established. Monitoring the results, reviewing the performance of key
measures and checking the overall situation periodically is vital part of this
last phase as well. (Evans & Lindsay, 2015)
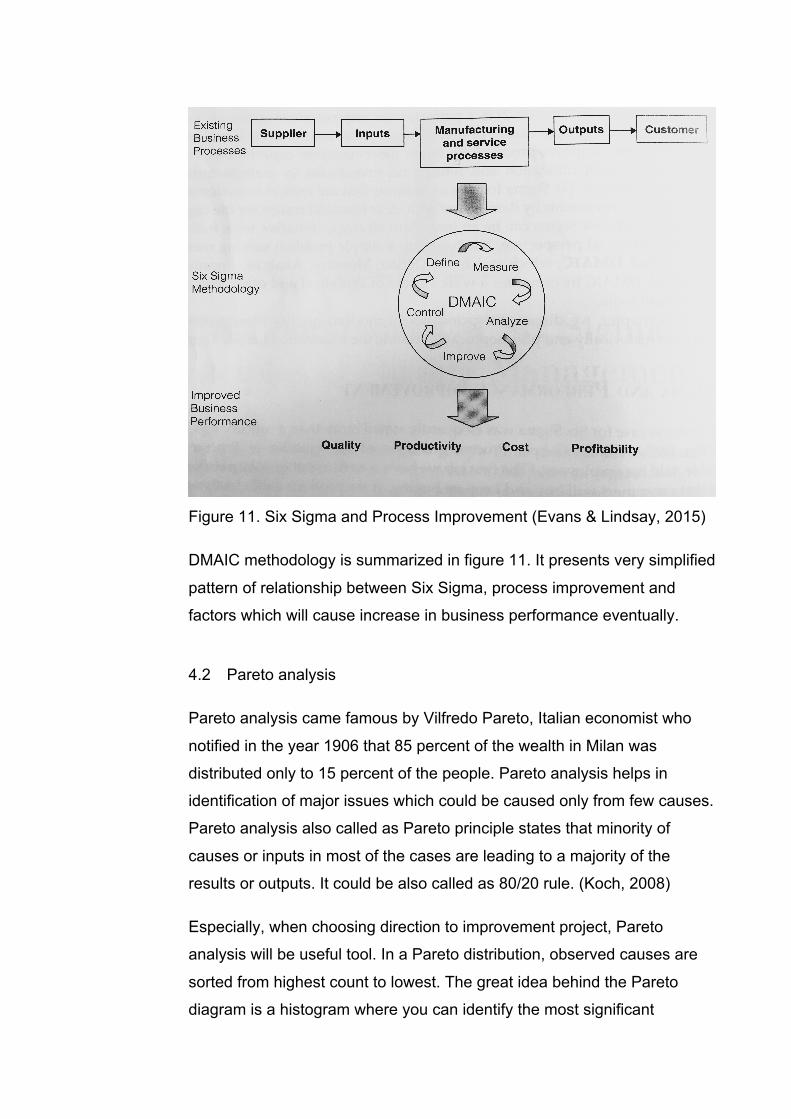
Figure 11. Six Sigma and Process Improvement (Evans & Lindsay, 2015)
DMAIC methodology is summarized in figure 11. It presents very simplified
pattern of relationship between Six Sigma, process improvement and
factors which will cause increase in business performance eventually.
4.2 Pareto analysis
Pareto analysis came famous by Vilfredo Pareto, Italian economist who
notified in the year 1906 that 85 percent of the wealth in Milan was
distributed only to 15 percent of the people. Pareto analysis helps in
identification of major issues which could be caused only from few causes.
Pareto analysis also called as Pareto principle states that minority of
causes or inputs in most of the cases are leading to a majority of the
results or outputs. It could be also called as 80/20 rule. (Koch, 2008)
Especially, when choosing direction to improvement project, Pareto
analysis will be useful tool. In a Pareto distribution, observed causes are
sorted from highest count to lowest. The great idea behind the Pareto
diagram is a histogram where you can identify the most significant
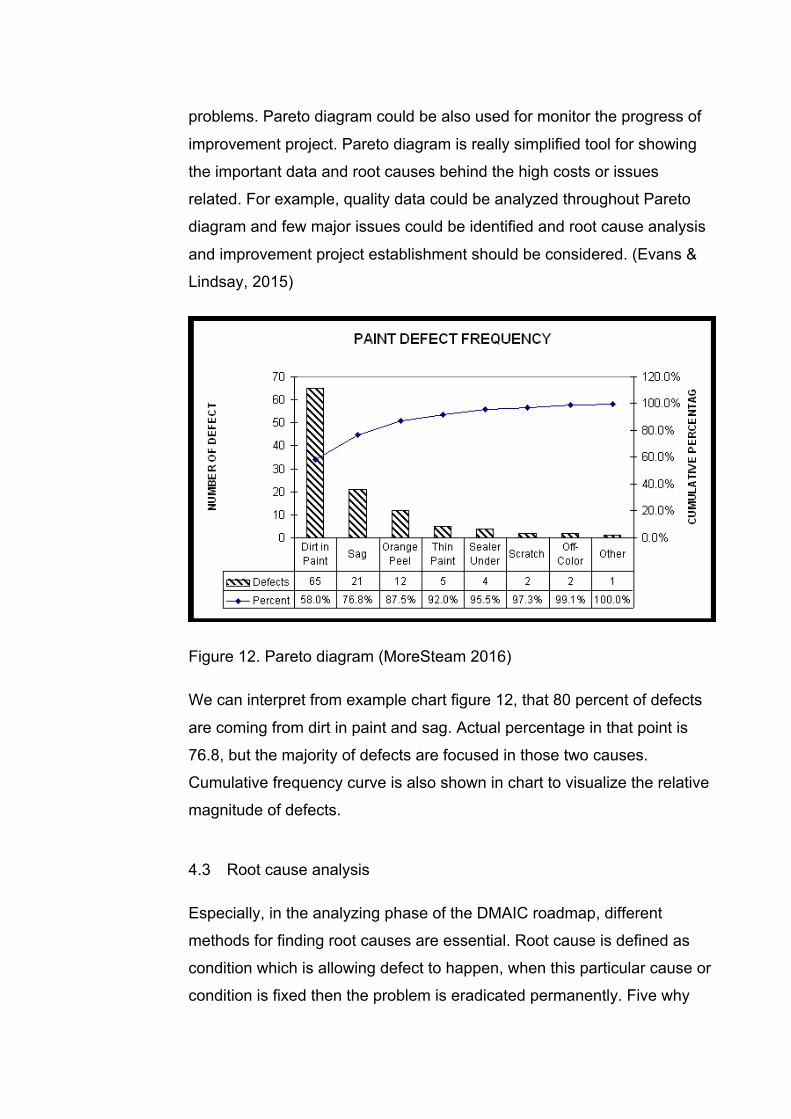
problems. Pareto diagram could be also used for monitor the progress of
improvement project. Pareto diagram is really simplified tool for showing
the important data and root causes behind the high costs or issues
related. For example, quality data could be analyzed throughout Pareto
diagram and few major issues could be identified and root cause analysis
and improvement project establishment should be considered. (Evans &
Lindsay, 2015)
Figure 12. Pareto diagram (MoreSteam 2016)
We can interpret from example chart figure 12, that 80 percent of defects
are coming from dirt in paint and sag. Actual percentage in that point is
76.8, but the majority of defects are focused in those two causes.
Cumulative frequency curve is also shown in chart to visualize the relative
magnitude of defects.
4.3 Root cause analysis
Especially, in the analyzing phase of the DMAIC roadmap, different
methods for finding root causes are essential. Root cause is defined as
condition which is allowing defect to happen, when this particular cause or
condition is fixed then the problem is eradicated permanently. Five why

technique will lead eventually in the real root cause after asking five times
why. The idea behind five why is to go behind the symptoms and identify
source of the problem. Brainstorming activities with improvement teams
and all relevant persons is key to evaluate every possible option and
cause for the problem. Cause-and-effect diagram is one popular way in
problem solving process. Cause-and-effect diagram (Figure 13) is visual
tool also called as fishbone diagram or Ishikawa diagram. There is
horizontal line which ends to problem under investigation. From the main
line there are several branches, possible causes listed. The diagram
identifies most likely causes where improvement team selects the most
obvious cause and focus on that and further data collection. (Evans &
Lindsay, 2015)
Figure 13. Cause-and-effect diagram (iSixSigma 2016)
5 RESEARCH APPROACH AND METHODS
This research is conducted as action research. Typical action research is
process which aims to change or improve things. Research topic could
vary from organization procedures to understanding behind processes and
activities. According to Tappura (2009) objective of action research is to
change existing activities and to solve problems in organization. Quite
often, workers are active part of the research. However, researcher is also
taking part to the action behind the research. Action research process
includes typically planning, action and evaluation phases. In action
research, earlier experiences and historical data are analyzed. Mostly,
action researches are qualitative approaches, nevertheless there is no
valid reason for utilizing quantitative methods. Improvement needs are
directly related to process or organizationin in question. The improvement
project is usually established by the employees of organization.
Improvements are taken into practice and results are visible in every day
work.
In this study, understanding the role of maintenance is essential to form a
improvement method which ties whole organization together. Action
research is the most suitable option for the case when improvement is
made as project type of approach. Implementation of the method follows
Six Sigma DMAIC roadmap and different analysis tools related. Holistic
approach for the case is formed from the maintenance strategy point of
view and charasteristics of TPM methodology.
Quantitative metrics are reasoned according to the nature of
manufacturing process and improvement. In this case, indicators are OEE
measurement, downtime measurement, spoilage amount and
maintenance activity as number of tasks generated.
The improvement method, tagging system, for the problem was modified
from the original idea of Milton Keynes plant, England. Tagging system is
introduced in chapter 5.3.

5.1 Maintenance in Ball Beverage Packaging Europe
Like in any modern manufacturing plant, also in Mäntsälä plant,
maintenance activities are following some of the most popular
maintenance philosophies. Actually, it is easy to detect that there is part of
TPM, part of PM and part of methods typical for can manufacturing plant
implemented for maintenance system overall.
Maintenance department is quite typically structured in Mäntsälä plant.
Under the maintenance manager, team is divided to electrical and
mechanical maintenance supervisors, following with electricians and day
maintainers. In shifts, approach is more straightforward. In every shift,
there is one electrician and two maintainers. Figure 14 visualizes the
structure of maintenance in Mäntsälä plant.
Figure 14. Structure of maintenance department
As mentioned, maintenance department is doing preventive maintenance
actions. These actions are including daily, weekly, monthly, yearly PM
tasks made by maintainers or operators. Safety checks and daily
maintenances are followed in daily basis by shift managers. Target for
daily safety checks and maintenance is 100%. The maintenance
information system in use is ArrowMaint which focuses on doing task lists
and scheduling maintenance activities. Maintainers and operators are
permitted to do entries and write down fault notifications. However, it is
identified that it is covering mostly day staff tasks than shift maintainers
and operators.

Maintenance budget is made based on 8+4 forecast, where production
figures are correlating to maintenance budget. After 8 months, the current
situation is evaluated and compared to planned forecast whether there is
shortfall and bigger investements are postponed for the remaining 4
months. When budget is surplussing there is this room for investments or
bigger maintenance tasks and spare parts. Therefore, motivation for
improving production output with adequate maintenance will eventually
come directly from the budget.
From my personal point of view, this approach is troubled. If company is
making more cans, it will get more to maintenance budget. In the end,
question is that how high production figures are achieved? By running the
machines with full speed until breakdown or time to time with planned
maintenance to maintain equipment efficiency at desired level. This is
tricky question because it actually indicates the maintenance strategy quite
straightforward and tells the mindset of maintenance department and plant
management. Is the management pursuing short term profit or long term
growth?
5.2 Introduction to beverage can manufacturing process
History of beverage can manufacturing reaches back to the year 1935
when first beer cans came to the market by American brewery Gottfried
Kruger. The first beverage cans were made out of tin and there was no
opener in the lid. Aluminium beverage cans rolled out to the market in
1960’s. Since that, the market share of aluminium cans as beverage
containers has skyrocketed across the world. The first tear-off can opener
was invented in the 1963 by Ohioan Ermal Fraze. Current opening
mechanism was invented in the year 1975 by Dan Cudzik. (Suomen
Palautuspakkaus Oy 2016a)
Beverage can manufacturing process is really straightforward process, but
particularly volatile for the unplanned down times and breakdowns. Simply,
because of the straightforward nature of the process, if some equipment in
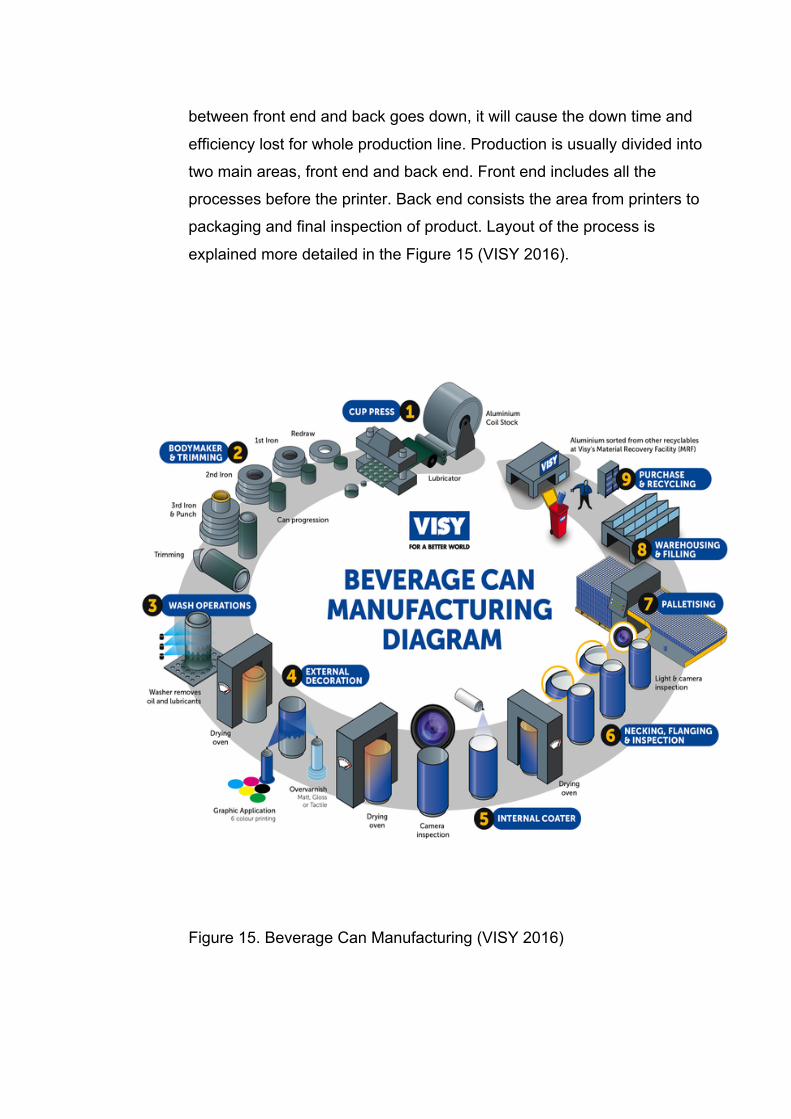
between front end and back goes down, it will cause the down time and
efficiency lost for whole production line. Production is usually divided into
two main areas, front end and back end. Front end includes all the
processes before the printer. Back end consists the area from printers to
packaging and final inspection of product. Layout of the process is
explained more detailed in the Figure 15 (VISY 2016).
Figure 15. Beverage Can Manufacturing (VISY 2016)

Front end area starts with the 10000 kg aluminum sheet coil feeded into
lubricator from uncoiler mandrel. Lubricator lubricates the surface of the
aluminum so that it will endure the upcoming shaping of cupper. Cupper
includes die set of 14 similar tooling which cuts and punches the sheet into
a form of cup. Cups will continue their flow towards the next equipment
and the left over metal sheet from cupper, skeleton, will be sucked to the
vacuum chute and to the scrap baler. Cupper makes approximately 200 to
220 strokes per minute. So when calculated 14 cups per stroke times 200
it is in total 2800 cans per minute (CPM).
Next phase is shaping the cup into a form of can. It happens in
bodymakers, in Mäntsälä plant there are 11 bodymakers in total with top
speed of 340 to 360 CPM per machine. In this stage can get its form by
drawing the punch through redraw ring and 3 differents sizes of dies which
will stretch the wall of the aluminum so that it reaches the final height and
wall thickness according to the specification. Each bodymaker will create a
can with rough edge, so it needs to be trimmed. Trimmer cuts the rough
edge of the can, by spinning the can through the blade cartridges.
Next, trimmed can is washed from all the oil and lubricants used in
shaping process and alternatively some treatment is applied for mobility of
the can. Can is dryed in the last section of the washer oven.
Then bright washed can is decorated by printer with 8 different optional
colours. Printer machine is operating at mechanical maximum speed of
2000 CPM and in Mäntsälä there are 2 printers, but rated speed is set to
1500CPM each. After the ink is applied into the surface by the customer
design requirements the overvarnish is applied to cover the inks or to
create additional effects. In this point, inks and overvarnish are still wet, so
they need to be dried in pin oven in 200 celcius degrees.
After printing, cans are sprayed inside with lacquer to cover the aluminium
of corrosive beverages like energy drinks and soft drinks, not that much of
lacquer is applied to beer products. Lacquer is dried and cured in the
inside bake oven, to vaporize possible solvent residues. Maximum speed

for single spray machine is 400 CPM, in Mäntsälä plant there are 14 inside
spray machines in total, seven per line.
In next phase, the neck of the can is shaped in necker flanger machine in
12 differents stages step by step. At this point, the aluminium is so thin
and fragile that neck needs to be shaped bit by bit to stay intact. Maximum
speed for one necker is 3000 CPM, Mäntsälä holds two of them.
After necking process cans are inspected by inside inspection camera to
be sure that there is no foreign substance, dirt or residue of previous
process materials inside the can. Label verifier is located right after the
inside inspection camera to secure that there is only one desing of label in
the line at once.
Finally cans are palletized, stacked into layers of 391 cans each, usually
consisting 22 layers per pallet. Final step is visual inspection of the pallets,
performed by quality control before sending complete pallets into
warehouse to be shipped.
If quality defects appear pallets will be put aside for further investigation.
These pallets are called Hold For Inspection pallets (HFI spoilage). HFI
pallets are either scrapped or reworked. Reworking happens through
offline sorting which requires extra manning. Scrapped pallets are sent
back to aluminium sheet supplier to be recycled.
5.3 Tagging System
During the year 2015 several improvement projects were launched in
Mäntsälä plant by different initiatives and actual need for improvements
were recognized. Nevertheless, many of projects were focusing on
changeover time which are planned downtimes everytime. How come the
sudden unplanned downtimes have not gained bigger attention? As
discussed in theory chapters, unplanned downtimes will create huge

amount of downtime when calculated together. Situation at the beginning
of the 2016 was that the crew I was working in had not initiated any
improvement actions. As a result, I travelled to England in March 2016. My
destination was Milton Keynes plant, which is one of the oldest still
functioning plants in Europe, to see how they are coping with old
equipment. Primarily, the reason for my visit was to explore their
maintenance practices and to see if there is something valuable for
Mäntsälä plant to be implemented. As a result the tagging system was
noticed and potential of it was recognized. Especially, because it was
based on operators’ daily actions and moreover proactive approach than
reactive. There was typical characteristics of TPM based autonomous
maintenance actions identified. I noticed also that it was involving not only
maintenance management but whole organization and therefore the
communication between shopfloor and management was immediate.
The foundation of tagging system is in operator’s ability to observe any
anomalies in equipment and come up with proper solution.
The idea behind the tagging system method is to create a tag whenever
anomaly is detected. Tag is simply a piece of cardboard with different
categories of defects and problems. Optimal situation is to have operators
filling a tag and finding corrective action immeadiately by themselves. If
operator could not solve the problem, it will be forwarded to more skilled
maintenance personnel.

Figure 16. Tag example
Different defects related to equipment condition are vital to be detected
and therefore operator is the optimal choice for monitoring if any strange
noises, oil leaks, vibrations or smells are appearing. Tags are collected
from different crews, operators and maintainers. After filling the tag, it will
be typed into a tag register which holds all the tags. From the tag register
the status of the tags could be followed and changed according to the
situation. In Milton Keynes plant, tagging system was very visual and
tagging board was established next to equipment in question.

Figure 17. Tagging board example in Milton Keynes
The tagging system project started in 25th of April 2016 by kick-off
meeting. In the kick-off meeting, improvement team was established
containing two operators, shift manager and shift maintainer. Project was
supervised by maintenance manager, production manager and zero loss
coordinator. I worked personally as project manager.
Before starting the actual implementation project, the defining phase had
to be conducted. The area for the improvement was choosed according to
different production KPIs. When examining the data in chapter 6.1 it
became obvious to choose both decorators as target of improvement
project.
Project was implemented in 6 different phases according to Figure 18
project plan.
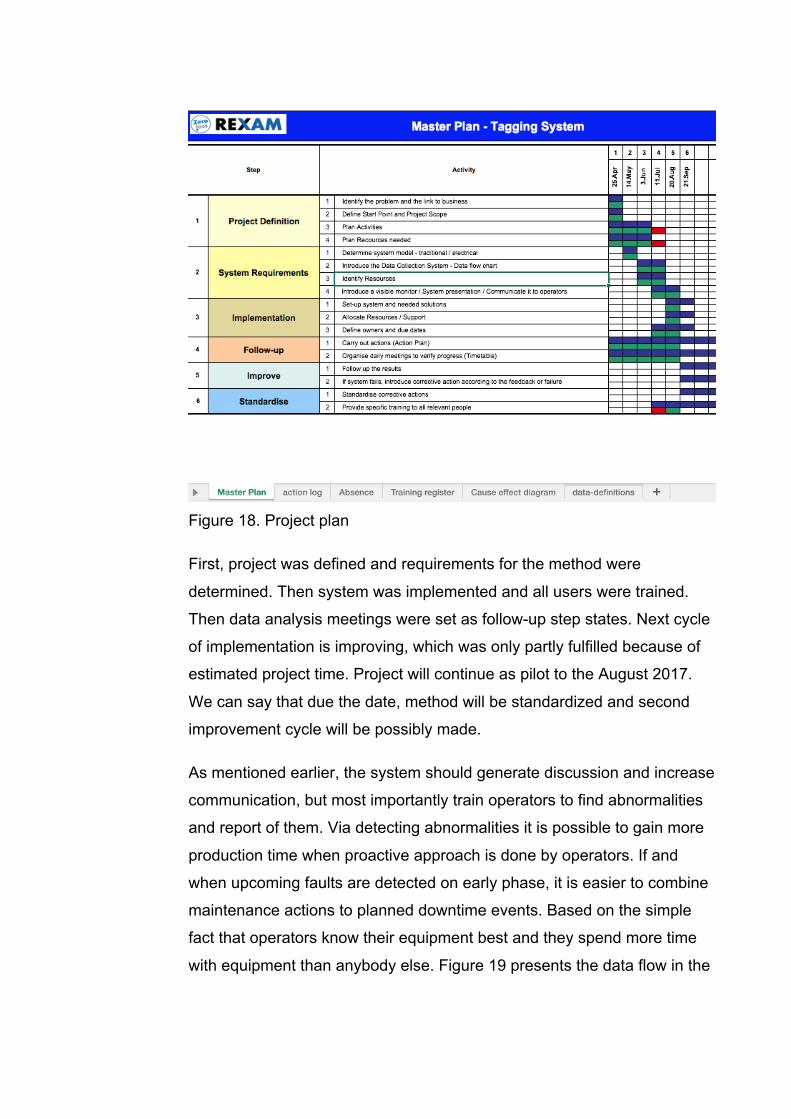
Figure 18. Project plan
First, project was defined and requirements for the method were
determined. Then system was implemented and all users were trained.
Then data analysis meetings were set as follow-up step states. Next cycle
of implementation is improving, which was only partly fulfilled because of
estimated project time. Project will continue as pilot to the August 2017.
We can say that due the date, method will be standardized and second
improvement cycle will be possibly made.
As mentioned earlier, the system should generate discussion and increase
communication, but most importantly train operators to find abnormalities
and report of them. Via detecting abnormalities it is possible to gain more
production time when proactive approach is done by operators. If and
when upcoming faults are detected on early phase, it is easier to combine
maintenance actions to planned downtime events. Based on the simple
fact that operators know their equipment best and they spend more time
with equipment than anybody else. Figure 19 presents the data flow in the

tagging system. Actually, it presents flow of tag data after anomaly is
detected.
Figure 19. Tag flow
First, after anomaly is detected it will be reviewed by designated person of
the tagging area whether the tag is eradicated already or it needs further
actions. Anyhow, after reviewing the tag it will be typed into tag register.
Tag register is register which is based on MS Excel and it holds functions
for exporting different charts and summaries of tag situation. Figure 20 and
21 captured from the tag register are visualizing the system.

Figure 20. Tagging system user interface and functions
Figure 21. Summary of tags
Tags could be analyzed and sorted by the anomaly, area and crew. It is
possible to view also tags related to safety, quality and food safety.
Next in tag flow, tag is brought to maintenance morning meeting which are
held from monday to friday. In the meetings, it is decided what are
possible countermeasures for the anomaly and who will be responsible for
fixing the tag. Optimal situation for fixing tags is when there would be
downtime anycase, like planned downtime or changeover. Actually,
anytime that it would not interrupt normal manufacturing situation. The
type of tag determines whether it is sorted out by mechanical, eletrical or
crew personnel. Eventually, the main target is to eradicate the tag, so that
same fault or anomaly woud not appear in any possible case.
Project was implemented to roll-out phase at 20th of August 2016. After
the implementation to shopfloor, using the tagging system was started
immediately by operators and person who was designated to tag collection
and as main user for tag register. In chapter 6, the results of the tagging
system maintenance improvement method are presented as before and
after in OEE metrics and maintenance activity.
6 RESEARCH RESULTS AND ANALYSIS
The original challenge was to gain more production time by avoiding
unplanned stops or breakdowns and to nourish the communication about
the maintenance actions. However, to get that point it was essential to find
out bottleneck of the process and analyze the root causes, before taking
any actions towards improving maintenance. According to research results
we can state that bottleneck was found. Equipment downtime from both
back end lines and HFI spoilage indicators were choosed as bottleneck
investigation paretos. In addition, root cause analysis of bottleneck
revelead more specific factors causing production losses. As relying on the
analysis of the current situation tagging system method was implemented.
Next, OEE results before and after implementation were recorded and
analyzed. Nevertheless, also the communication and co-operation in
maintenance were mentioned as problems. Therefore, maintenance
activity was measured in bottleneck area by comparing before and after
situation in maintenance tasks generated. In following chapters 6.1 and
6.2 results are analyzed thoroughly. More profound analysis and
conclusions are discussed in the chapter 7.
6.1 Bottleneck and root cause analysis
The bottleneck was identified simply by using pareto diagram to see from
choosed indicators which are the most major causes for production losses.
Data was exported and analyzed from information systems monitoring
production and quality figures such as HFI and production downtime.
Downtime is essential factor to be analyzed, because it does have direct
influence on plant performance. HFI spoilage is indirect factor, which is
causing rework activities like sorting, scrapping and warehouse
reservations. As combining these two, it will form a comprehensive review
of current situation.

Machine Time
Elapsed % Speed
Downtime effect
to production Spray Gun #14 1806:55:16 13,14% 320 2,80 % Spray Gun #12 1758:34:31 12,79% 320 2,73 % Decorator #1 1626:03:00 11,82% 1500 11,82 %
Spray Gun #13 1555:32:31 11,31% 320 2,41 % Spray Gun #16 1385:14:49 10,07% 320 2,15 % Spray Gun #15 1121:52:34 8,16% 320 1,74 % Spray Gun #17 1119:52:14 8,14% 320 1,74 % Spray Gun #11 1099:33:13 8,00% 320 1,71 %
Necker #1 985:11:08 7,16% 1500 7,16 % Palletizer #1 799:46:08 5,82% 1500 5,82 %
IBO #1 305:34:56 2,22% 1500 2,22 % Decorater #1
Oven 185:03:49 1,35% 1500 1,35 % Camera #1 03:02:18 0,02% 1500 0,02 %
Mixed Label #1 00:00:22 0,00% 1500 0,00 %
Table 1. Downtime Pareto BE Line 1
When analyzing data from the year 2016 to identify bottleneck and major
downtime sources, we can see it from the table 1. Spray gun #12 and #14
has beed down more than decorator #1 but the effect to production
efficiency is not as significant.
Figure 22. Downtime Pareto BE Line 1
0,00%2,00%4,00%6,00%8,00%10,00%12,00%14,00%
Downtimeeffecttoproduction

Pareto diagram indicates clearly the largest source of downtime when
speed of equipment is considered as one of the calculation parameters. It
is justified to compare it that way, because spray guns are working as one
unit with 7 guns in series. Even if 2 guns are down, the output is still 1600
CPM and there is no significant effect to production flow.
Machine Time
Elapsed % Speed
Downtime effect
to production Decorator #2 1981:21:33 13,80% 1500 13,80 %
Spray Gun #27 1918:31:12 13,36% 320 2,85 % Spray Gun #26 1282:54:31 8,93% 320 1,91 % Spray Gun #23 1269:22:04 8,84% 320 1,89 % Spray Gun #21 1252:53:58 8,73% 320 1,86 % Spray Gun #22 1244:23:19 8,67% 320 1,85 % Spray Gun #25 1238:09:00 8,62% 320 1,84 % Spray Gun #24 1194:28:02 8,32% 320 1,77 %
Necker #2 1093:06:51 7,61% 1500 7,61 % Palletizer #2 1078:11:11 7,51% 1500 7,51 %
Mixed Label #2 307:43:45 2,14% 1500 2,14 % IBO #2 235:44:53 1,64% 1500 1,64 %
Camera #2 135:25:29 0,94% 1500 0,94 % Decorator #2
Oven 111:34:44 0,78% 1500 0,78 % Light Tester #2 15:17:34 0,11% 1500 0,11 %
Table 2. Downtime Pareto BE Line 2
Also when analyzing data from table 2 downtime pareto BE line 2, it is
obvious that decorator #2 is effecting the most significantly on production
downtime.

Figure 23. Downtime Pareto BE Line 2
Pareto diagram (figure 23) is illustrating clearly that decorator #2 is
similarly bottleneck machine as decorator #1 is in line 1. Therefore, based
on downtime data from both lines we can state that best platform for
improvement will be decorator area.
In addition, it is relevant to consider HFI spoilage as one indicator for
choosing equipment to be in the focus area of improvement. Because,
defects causing HFI spoilage are in some cases related to equipment
malfunction. Therefore, maintenance actions are effecting indirectly to HFI
spoilage. Figure 24 shows HFI spoilage chart from 2016. HFI chart is
divided by areas, HFI reason groups and eaches are in vertical axis. HFI
chart data is collected from both lines. When comparing HFI reasons, it is
evident that decorator area is causing almost twice as much HFI spoilage
as next two reasons, packaging and front end.
0,00%2,00%4,00%6,00%8,00%10,00%12,00%14,00%16,00%
Downtimeeffecttoproduction
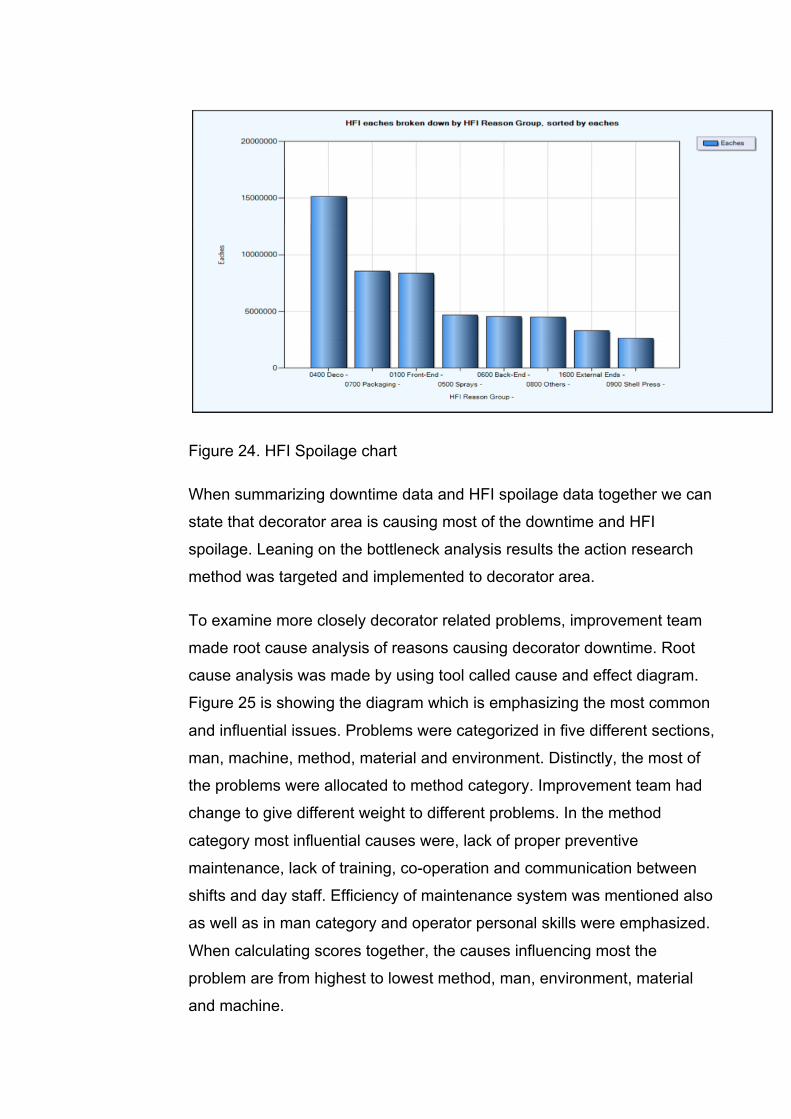
Figure 24. HFI Spoilage chart
When summarizing downtime data and HFI spoilage data together we can
state that decorator area is causing most of the downtime and HFI
spoilage. Leaning on the bottleneck analysis results the action research
method was targeted and implemented to decorator area.
To examine more closely decorator related problems, improvement team
made root cause analysis of reasons causing decorator downtime. Root
cause analysis was made by using tool called cause and effect diagram.
Figure 25 is showing the diagram which is emphasizing the most common
and influential issues. Problems were categorized in five different sections,
man, machine, method, material and environment. Distinctly, the most of
the problems were allocated to method category. Improvement team had
change to give different weight to different problems. In the method
category most influential causes were, lack of proper preventive
maintenance, lack of training, co-operation and communication between
shifts and day staff. Efficiency of maintenance system was mentioned also
as well as in man category and operator personal skills were emphasized.
When calculating scores together, the causes influencing most the
problem are from highest to lowest method, man, environment, material
and machine.

Figure 25. Cause and effect diagram of decorator issues
Overall, when putting together the data and evaluation of the decorator
related problems and root causes, it can be identified that tagging system
will be applicable method for implementation. Since, it is involves whole
organization and therefore increases the communication and co-operation
between departments. Likewise, the most influential cause, lack of proper
maintenance will be addressed by operator involvement and proactive
approach. Nevertheless, if operator can’t fix the anomaly, in this case tag,
it will be relocated to more skilled personnel. As such, the principles
behind the tagging system should cover the issues raised in the root
cause analysis. Anyhow, the situation after the implementation will be
evaluated in chapter 6.2 OEE measurement and analysis.
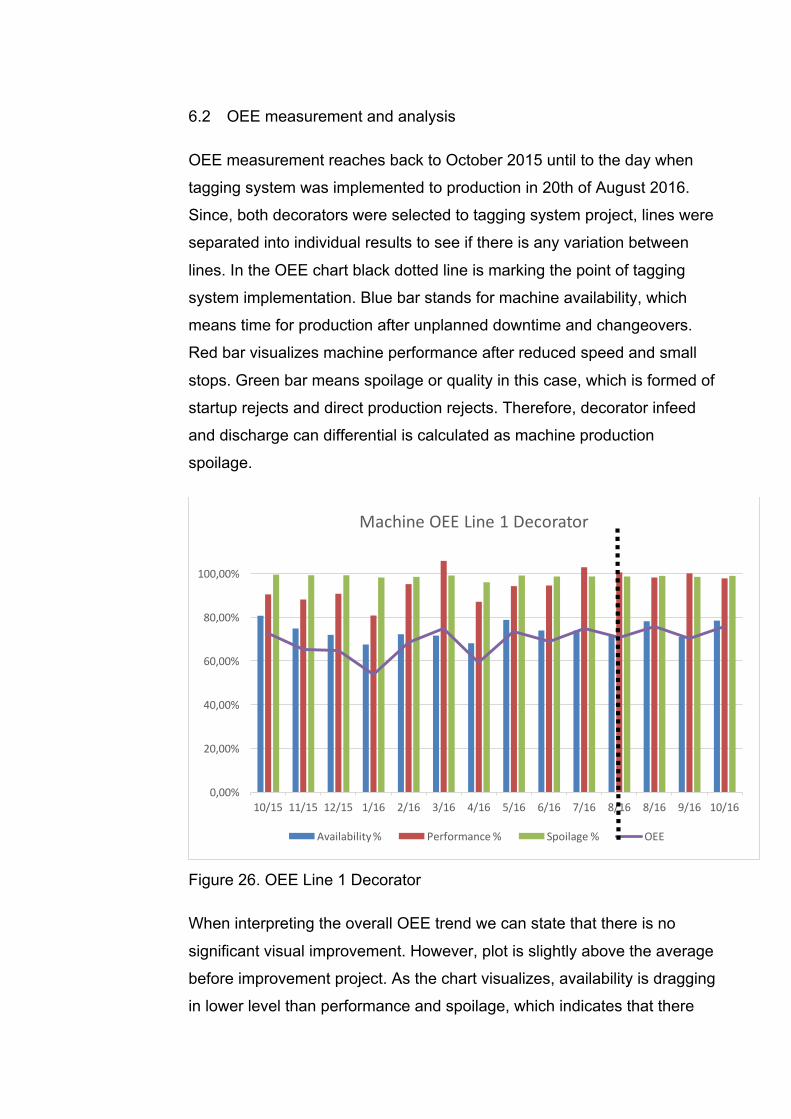
6.2 OEE measurement and analysis
OEE measurement reaches back to October 2015 until to the day when
tagging system was implemented to production in 20th of August 2016.
Since, both decorators were selected to tagging system project, lines were
separated into individual results to see if there is any variation between
lines. In the OEE chart black dotted line is marking the point of tagging
system implementation. Blue bar stands for machine availability, which
means time for production after unplanned downtime and changeovers.
Red bar visualizes machine performance after reduced speed and small
stops. Green bar means spoilage or quality in this case, which is formed of
startup rejects and direct production rejects. Therefore, decorator infeed
and discharge can differential is calculated as machine production
spoilage.
Figure 26. OEE Line 1 Decorator
When interpreting the overall OEE trend we can state that there is no
significant visual improvement. However, plot is slightly above the average
before improvement project. As the chart visualizes, availability is dragging
in lower level than performance and spoilage, which indicates that there
0,00%
20,00%
40,00%
60,00%
80,00%
100,00%
10/15 11/15 12/15 1/16 2/16 3/16 4/16 5/16 6/16 7/16 8/16 8/16 9/16 10/16
MachineOEELine1Decorator
Availability% Performance% Spoilage% OEE
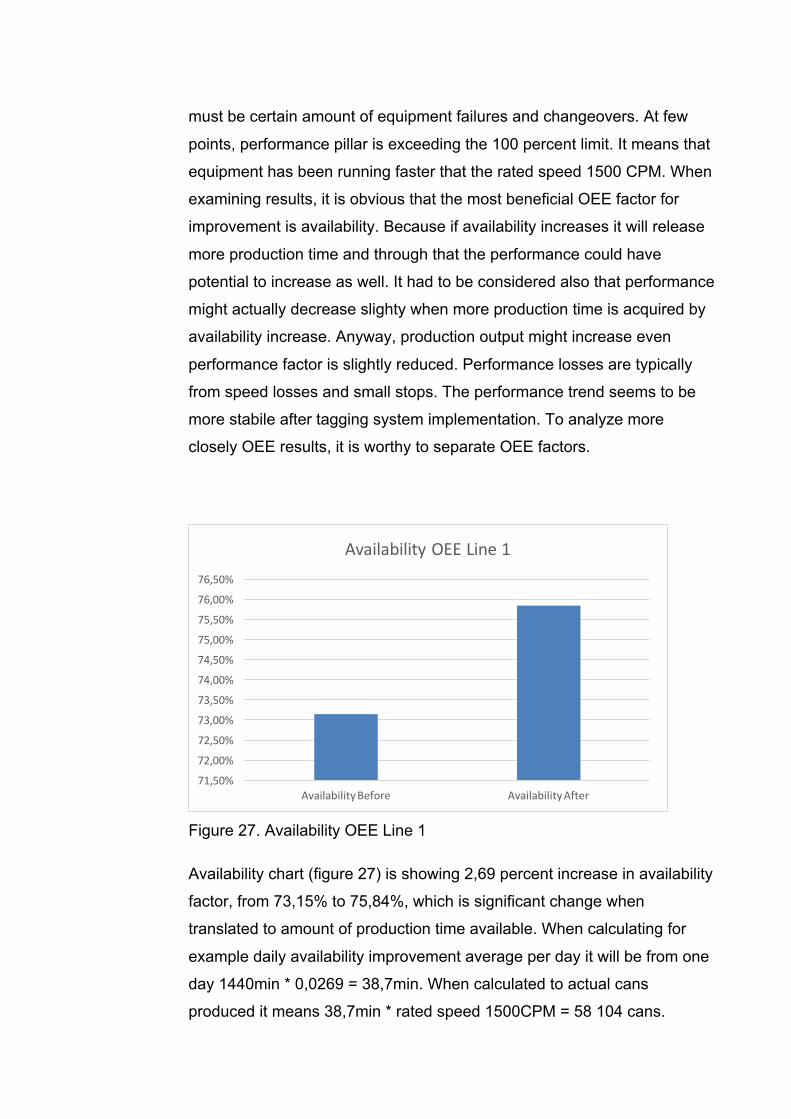
must be certain amount of equipment failures and changeovers. At few
points, performance pillar is exceeding the 100 percent limit. It means that
equipment has been running faster that the rated speed 1500 CPM. When
examining results, it is obvious that the most beneficial OEE factor for
improvement is availability. Because if availability increases it will release
more production time and through that the performance could have
potential to increase as well. It had to be considered also that performance
might actually decrease slighty when more production time is acquired by
availability increase. Anyway, production output might increase even
performance factor is slightly reduced. Performance losses are typically
from speed losses and small stops. The performance trend seems to be
more stabile after tagging system implementation. To analyze more
closely OEE results, it is worthy to separate OEE factors.
Figure 27. Availability OEE Line 1
Availability chart (figure 27) is showing 2,69 percent increase in availability
factor, from 73,15% to 75,84%, which is significant change when
translated to amount of production time available. When calculating for
example daily availability improvement average per day it will be from one
day 1440min * 0,0269 = 38,7min. When calculated to actual cans
produced it means 38,7min * rated speed 1500CPM = 58 104 cans.
71,50%
72,00%
72,50%
73,00%
73,50%
74,00%
74,50%
75,00%
75,50%
76,00%
76,50%
AvailabilityBefore AvailabilityAfter
AvailabilityOEELine1
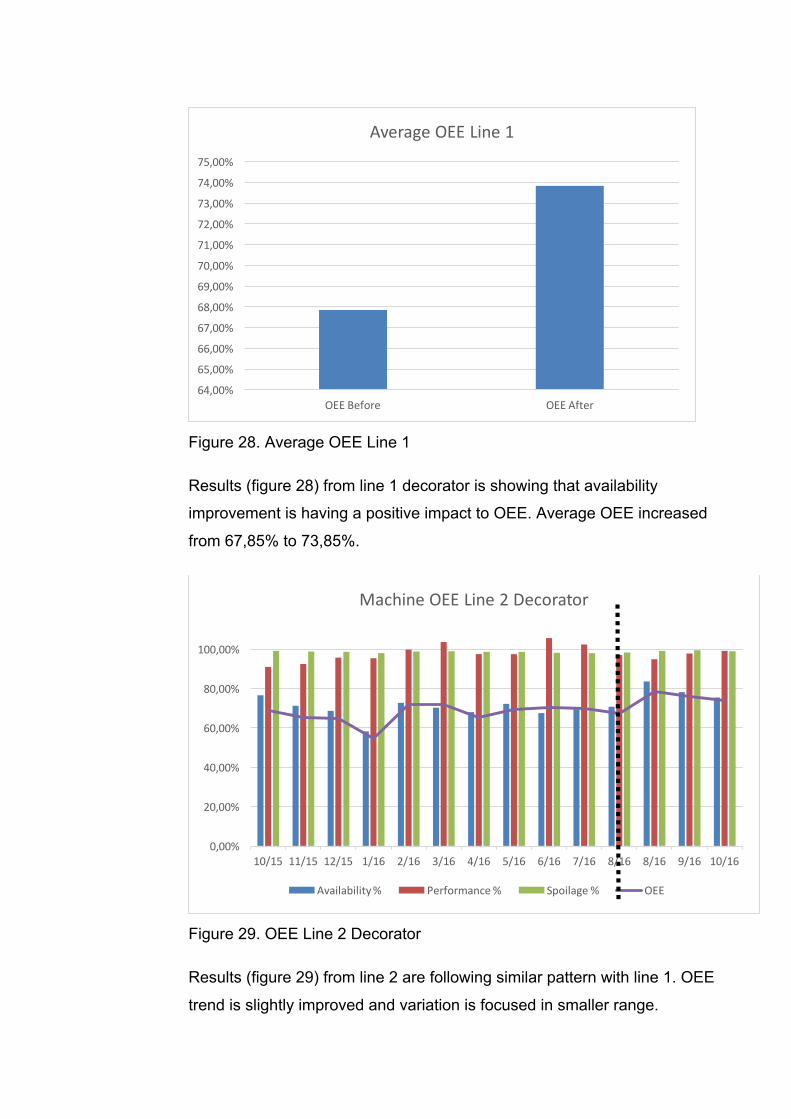
Figure 28. Average OEE Line 1
Results (figure 28) from line 1 decorator is showing that availability
improvement is having a positive impact to OEE. Average OEE increased
from 67,85% to 73,85%.
Figure 29. OEE Line 2 Decorator
Results (figure 29) from line 2 are following similar pattern with line 1. OEE
trend is slightly improved and variation is focused in smaller range.
64,00%
65,00%
66,00%
67,00%
68,00%
69,00%
70,00%
71,00%
72,00%
73,00%
74,00%
75,00%
OEEBefore OEEAfter
AverageOEELine1
0,00%
20,00%
40,00%
60,00%
80,00%
100,00%
10/15 11/15 12/15 1/16 2/16 3/16 4/16 5/16 6/16 7/16 8/16 8/16 9/16 10/16
MachineOEELine2Decorator
Availability% Performance% Spoilage% OEE

Availability factor is improved as well, whereas performance factor has
stayed almost in the same level or even lower. Earlier performance results
are exceeding 100 percent limit, which indicates that decorator has been
running faster than rated speed 1500 CPM. Possible cause for running
higher speeds could be explained trying to cover losses in equipment
availability. Similarities with line 1 results are easy to identify, when
inspecting results more closely before and after implementation.
Figure 30. Availability OEE Line 2
Availability factor (figure 30) increased in line 2 by 9,46%. Average
improved from 69,61% to 79,07%. Change is really significant to
production volume if the improvement in availability is utilized to
performance advantage. Similarly, when calculating benefit in time and
production output: it will be from one day 1440min * 0,0946 = 136,224 min.
When calculated to actual cans produced it means 136,224 min * rated
speed 1500CPM = 204 336 cans.
64,00%
66,00%
68,00%
70,00%
72,00%
74,00%
76,00%
78,00%
80,00%
AvailabilityBefore AvailabilityAfter
AvailabilityOEELine2

Figure 31. Average OEE Line 2
Average in line 2 (figure 31) improved from 67,24% to 76,25% causing
9,01% positive impact to overall equipment effectiveness.
Summarized, OEE average increased in both lines after the
implementation of tagging system method. When calculating the
production improvement figures together and forecasting the average
improvement based on the data acquired for the time period of one year
per line:
Line 1: Daily improvement (58 104 cans ) * (365 days) = 21 207 960 cans
or
21 207 960 cans / 1500 CPM (rated speed) = 14 138,65 mins = 9,81 days available for production.
Line 2: Daily improvement (204 336 cans ) * (365 days) = 74 582 640 cans or
74 582 640 / 1500 CPM (rated speed) = 49 721,76 mins = 34,53 days available for production.
Whether the positive results are caused by the tagging system or not, it is
evaluated in the chapter 7.2 validity and reliability.
62,00%
64,00%
66,00%
68,00%
70,00%
72,00%
74,00%
76,00%
78,00%
OEEBefore OEEAfter
OEEAverageLine2
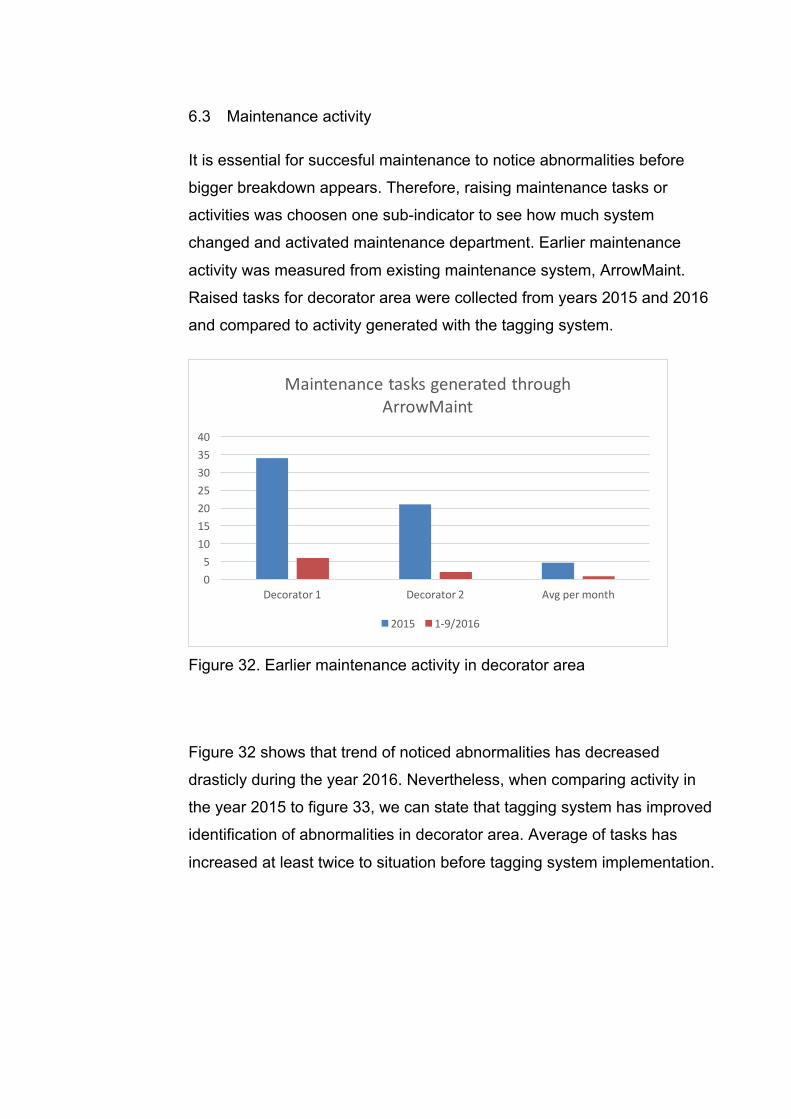
6.3 Maintenance activity
It is essential for succesful maintenance to notice abnormalities before
bigger breakdown appears. Therefore, raising maintenance tasks or
activities was choosen one sub-indicator to see how much system
changed and activated maintenance department. Earlier maintenance
activity was measured from existing maintenance system, ArrowMaint.
Raised tasks for decorator area were collected from years 2015 and 2016
and compared to activity generated with the tagging system.
Figure 32. Earlier maintenance activity in decorator area
Figure 32 shows that trend of noticed abnormalities has decreased
drasticly during the year 2016. Nevertheless, when comparing activity in
the year 2015 to figure 33, we can state that tagging system has improved
identification of abnormalities in decorator area. Average of tasks has
increased at least twice to situation before tagging system implementation.
0510152025303540
Decorator1 Decorator2 Avgpermonth
MaintenancetasksgeneratedthroughArrowMaint
2015 1-9/2016
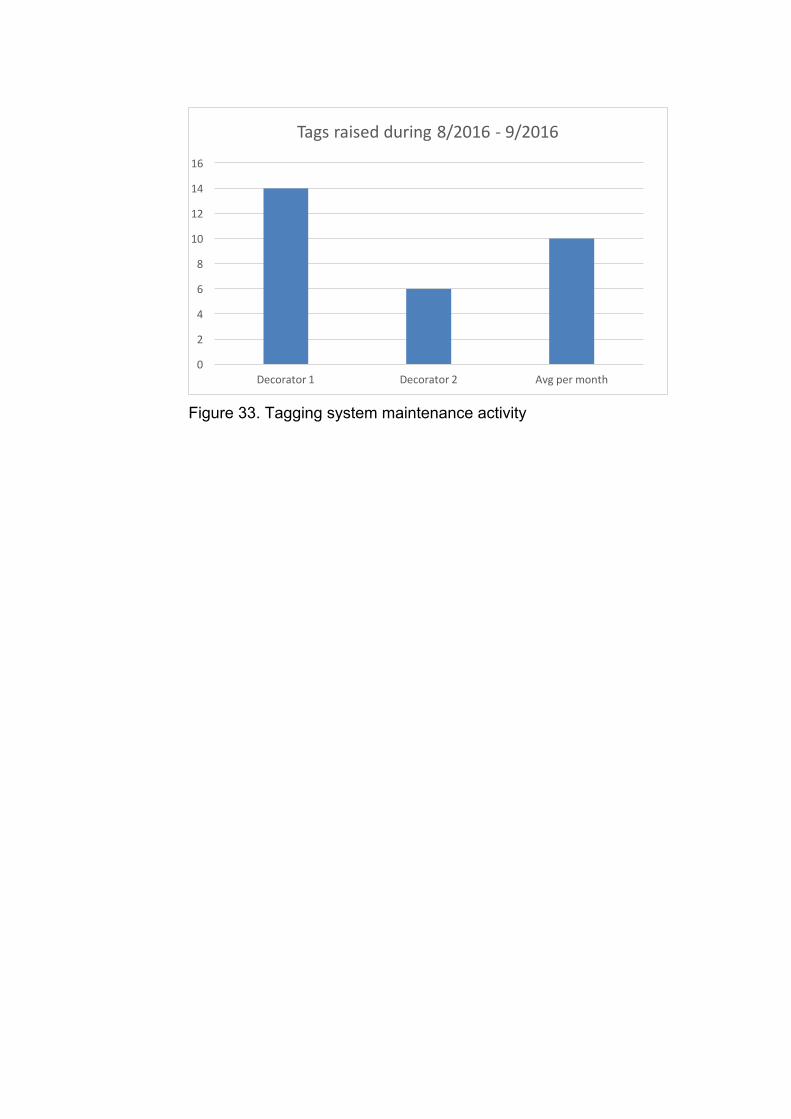
Figure 33. Tagging system maintenance activity
0
2
4
6
8
10
12
14
16
Decorator1 Decorator2 Avgpermonth
Tagsraisedduring8/2016- 9/2016

7 CONCLUSIONS
This final chapter includes three sub-chapters, first starting with discussion
7.1. Discussion and conclusions chapter summarizes the findings and
results of the study. Likewise, it also highlights research questions and
challenges before conducting the study. Situation after the improvement
project is analyzed as well. Chapter 7.2 evaluates the validity and the
reliability of the study, whereas the are some uncertainty factors in the
changing environment of manufacturing facility and process. Chapter 7.3
is the final chapter of this thesis. It evaluates possible topics and
phenomenas for further study.
7.1 Discussion and conclusions
The original challenge when starting the study was to get more production
time by avoiding unplanned stops or breakdowns and to nourish the
communication about the maintenance actions. Supporting this challenge
to be solved, research questions were positioned as follows:
1. What is the key area for improvement?
2. How maintenance should be improved in the current situation?
The reasearch results found out that key area for improvement was
decorator area equipment, which was lacking in different maintenance
activities. Problematic issues like, lack of co-operation, communication and
preventive maintenance were mentioned in the root cause analysis by the
improvement team which was established for the project.
Based on the root cause analysis, method for improving these earlier
mentioned issues were implemented. Tagging system method is
originated from Milton Keynes, England beverage manufacturing plant,
which is one the the oldest plants in Ball Corporation. System was slightly
modified to respond the needs better in Mäntsälä plant and implemented
according to Sig Sixma DMAIC roadmap. The theory of tagging system is
deducted to practice from TPM approaches like, focused improvement and

autonomous maintenance. The holistic view to improvement cycle of
implementation is based on continuos improvement philosophy.
Situation was evaluated as OEE metrics before and after implementation
of the method, to see actual implications by factors: performance,
availability and quality. During the two month evaluation period, OEE
results were positively increased. Significant improvement was noticed
especially in the equipment availability factor, which is result of improved
production time of machine. Availability factor is measured from the total
time avalaible after unplanned stops, small stops and lower speeds.
Therefore it can be said that equipment was able to run rated speed with
smaller amount of unplanned stops.
From the author’s point of view in project manager position, it was great
situation for learning, to see how project work is handled. However, there
was not that big emphasis on project work. Since, there was great amount
of attention focused on company’s maintenance activities, it showed how
influential maintenance is to manufacturing companies business result. As
stated before, equipment with professional operators maintaining them, is
the greatest asset a company could have. Without proper maintenance,
equipment condition will degrade and cause huge expenses to company in
the future. Quite often maintenance is separate department which is rarely
in focus. However, culture change towards more proactive maintenance
activities would be beneficial to many companies. Significant observation
from this project was that, by almost zero budget, it is possible to obtain
great benefits by improving maintence activities even in short period. By
involving whole organization to change, it will create new attitudes to see
that maintenance is actually part of all core processes in manufacturing
environment.

7.2 Validity and reliability
Validity defines how well choosen indicator is applied to the case or how
well the phenomenon can be measured by using it. Study can be stated to
be valid when it is focus to right group and questions are correctly
positioned. Validity also shows how well researcher performed. If there is
no new or correct information available after study, it is not valid. Reliability
indicates that if research method is correct. It also measures if study is
easily repeated and whether the results would be same. When study is
repeated in same circumstances, the results should be same, if not then
study is not reliable and results are random. (Hiltunen, 2009)
The validity of the study is based on the indicators and equipment
choosed under study. Relation between maintenance, equipment and
overall equipment effectiveness is immeadiate. Therefore, it is justifiable to
say that study is valid.
The reliability of study results can be evaluated from different angles.
Those information systems, where data was collected, are reliable and
possibility for acquiring inaccurate information is neglible. However, the
data was collected only from two months time of period, which is not
sufficient. Final evaluation after the improvement project will give the most
reliable data whether the method choosen was succesful or not.
Nevertheless, overall equipment effectiveness as improvement indicator is
commonly used in similar TPM projects. OEE result is giving reliable data
as long as data is collected in the same way every time. Data analysis
should be made similarly as well. There was no room for human errors
since information systems are collecting automated data from equipment
operation. Based on this information we can say that study is reliable from
the two months of time when data was collected. However, certain factors
like production planning are effecting to changeover times and then there
is slightly space for reliability improvement.

7.3 Further study suggestions
There is probably some kind of future for the implemented method, as it
was improving the current situation based on two months of time quite
significantly. Since, project will continue as pilot for one year, the ultimate
decision for modelling the method for other areas in the plant will be made
in the August 2017. Further study could measure, what were the final
implications of the executed project. If the results were encouraging then
there is reason to expand it. However, the possible topic for further study
could be around the modelling of improvement method.
For the case company’s point of view, it would be beneficial to interview
employees and ask their opinions about the tagging system after one year
of period. It is possible that improvement ideas might be generated.
Eventually, the most interesting thing from the author’s perspective is to
see what is the status of the system after one year of operational time and
what are the overall equipment effectiveness indicators telling to company.
REFERENCES
Electronic References
Advanced Business Management Solutions(ABSM), 2016, Total Productive Maintenance TPM, viewed 27 August 2016, Almeanazel, O.T. 2010,‘Total Productive Maintenance Review and Overall Equipment Effectiveness Measurement’, Jordan Journal of Mechanical and Industrial Engineering, vol.4, no.4, pp.517-522, viewed 25 August 2016, http://jjmie.hu.edu.jo/files/v4n4/JJMIE-129-08_Revised(11)/JJMIE-129-08_modified.pdf Artiba, A., & Riane, F. 2005,’Maintenance strategies and reliability optimization’, Journal of Quality in Maintenance Engineering, vol.11, no.2, viewed 4 October 2016, http://site.ebrary.com.aineistot.lamk.fi/lib/lamk/reader.action?docID=10085637 Ball Corporation, 2016,’Overview’, viewed 22 July 2016, http://www.ball.com/eu/about-ball/overview
Bhuiyan, N., & Baghel, A. 2005,’An overview of continuous improvement: from the past to the present’, The Emerald Research Register: Mechanical and Industrial Engineering, Concordia University, vol.43, no.5, viewed 27 September 2016, http://www.iem.unifei.edu.br/turrioni/PosGraduacao/PQM07/Continuous_improvement_aula_4_e_5/0010430509%20melhoria%20continua.pdf Gitachu, D. 2016,‘TPM Pillars – Eight Pillars of Total Productive Maintenance’, ToughNickel, viewed 8 August 2016, https://toughnickel.com/industries/what-is-total-productive-maintenance-definition-tpm-pillars-tools#mod_27041593 Hayes, R.H. 1981,’Why Japanese Factories Work’, Harvard Business Review, viewed 20 June 2016, https://hbr.org/1981/07/why-japanese-factories-work Hiltunen, L. 2009,’Validiteetti ja reliabiliteetti’, Jyväskylän Yliopisto, viewed 24 November 2016, http://www.mit.jyu.fi/ope/kurssit/Graduryhma/PDFt/validius_ja_reliabiliteetti.pdf iSixSigma, 2016,’The Fundamentals of Cause-and-effect Diagrams’, viewed 27 September 2016, https://www.isixsigma.com/tools-templates/cause-effect/the-fundamentals-of-cause-and-effect-aka-fishbone-diagrams/
iSixSigma, 2016,’Six Sigma DMAIC Roadmap’, viewed 15 September 2016, https://www.isixsigma.com/new-to-six-sigma/dmaic/six-sigma-dmaic-roadmap/ Karthick, R., Kumar, G.S., & Vivekprabhu, M. 2014,‘Optimization of Overall Equipment Effectiveness in A Manufacturing System’, International Journal of Innovative Research in Science, Engineering and Technology, vol.3, no.3, viewed 28 August 2016, https://www.researchgate.net/publication/285586296_Optimization_of_Overall_Equipment_Effectiveness_in_a_Manufacturing_System Korkut, D.S., Cakicier, N., Erdinler, E.S., Ulay, G. & Dogan, A.M. 2009,‘5S activities and its application at a sample company’, African Journal of Biotechnology, vol.8, no.8, pp. 1720-1728, viewed 4 September 2016, http://search.proquest.com.aineistot.lamk.fi/docview/1658766790?accountid=16407 MoreSteam, 2016,’Pareto Chart (Manufacturing Example)’, viewed 6 September 2016, https://www.moresteam.com/toolbox/pareto-chart-manufacturing.cfm Porter, M.E. 1996,’What is strategy?’, Harvard Business Review, viewed 1 July 2016, https://hbr.org/1996/11/what-is-strategy
Power, B. 2010,’When Is Process Improvement Strategically Important’, Harvard Business Review, viewed 25 September 2016, https://hbr.org/2010/10/i-admit-im-a-process Rexam PLC. 2016b,‘Media - Facts & figures’, viewed 29 February 2016, http://www.rexam.com/index.asp?pageid=420 Rexam, 2016a,‘About us - The Rexam story’, viewed 29 February 2016, http://www.rexam.com/index.asp?pageid=604 Rubrich, L. 2016,’TPM is most difficult of all lean tools to implement’, Noria Corporation – Reliableplant, viewed 27 June 2016, http://www.reliableplant.com/Read/26210/tpm-lean-implement Sharma, A.K. 2012,’Manufacturing performance and evolution of TPM’, International Journal of Engineering Science and Technology (IJEST), viewed 25 July 2016, http://www.ijest.info/docs/IJEST12-04-03-012.pdf Sokovic, M., Pavletic, D., & Kern Pipan, K. 2010,‘Quality Improvement Methodologies – PDCA Cycle, Radar Matrix, DMAIC and DFSS’, Journal of Achievements in Material and Manufacturing Engineering, vol.43 no.1, viewed 24 September 2016, http://w.journalamme.org/papers_vol43_1/43155.pdf
Suomen Palautuspakkaus Oy, 2016, ‘Juomatölkin historiaa’, PALPA, viewed 22 April 2016, http://pantilliset.fi/perustietoa/juomatolkin-historiaa/ Tappura, S. 2009,’Toimintatutkimus’, Tampereen Teknillinen Yliopisto – Teollisuustalous – Turvallisuuden johtaminen ja suunnittelu, viewed 25 October 2016, http://matriisi.ee.tut.fi/hmopetus/hmjatko-opintosemma/2008/Tappura_Toimintatutkimus090109.pdf
The Deming Institute, 2016,’The Deming Cycle’, viewed 28 September 2016, https://www.deming.org/theman/theories/pdsacycle Visy Beverage Cans, 2016,’Beverage Can Manufacturing, viewed 28 October 2016, http://www.abmsindia.com/TPM.html https://static1.squarespace.com/static/534fe620e4b0337f7ff5c5da/t/55e63b25e4b02a211f803c45/1441151853362/Beverage+can+manufacturing+diagram Vorne Industries Incorporation (OEE.com), 2016,’Calculate OEE’, viewed 26 August 2016, http://www.oee.com/calculating-oee.html
Vorne Industries Incorporation (OEE.com), 2016,’Six Big Losses’, viewed 26 August 2016, http://www.oee.com/oee-six-big-losses.html
Written references Evans, J.R, & Lindsay, W.M. (2015) An Introduction to Six Sigma & Process Improvement. 2nd Ed. Stamford, CT. Cengage Learning Koch, R. (2008) The 80/20 Principle: The Secret to Achieving More with Less. 2nd Ed. New York, US.: The Doubleday Publishing Group Laine, H.S. (2010) Tehokas kunnossapito: Tuottavuutta käynnissäpidolla. 1st Ed. Kerava.: KP-Media Oy Levitt, J. (2011) Complete Guide to Preventive and Predictive Maintenance. 2nd Ed. New York, NY.: Industrial Press Inc. Mobley, R.K. (2002) Plant Engineering: An Introduction to Predictive Maintenance. Saint Louis, US.: Butterworth-Heinemann. ProQuest ebrary Mobley, R.K. (2011) Plant Engineering: Maintenance Fundamentals. Saint Louis, US.: Butterworth-Heinemann. ProQuest ebrary