AS - Strategies for Improving Ruminant Utilisation (Gilbert)
JISTEM - Journal of Information Systems and Technology Management
Revista de Gestão da Tecnologia e Sistemas de Informação
Vol. 13, No. 3, Set/Dez., 2016 pp. 389-404
ISSN online: 1807-1775
DOI: 10.4301/S1807-17752016000300002
___________________________________________________________________________________________
Manuscript first received/Recebido em: 13/01/2016 Manuscript accepted/Aprovado em: 17/08/2016
Address for correspondence / Endereço para correspondência
Bong-Keun Jeong, Metropolitan State University of Denver, Denver, CO, United States E-mail:
Tom E Yoon, Metropolitan State University of Denver, Denver, CO, United States E-mail:
Published by/ Publicado por: TECSI FEA USP – 2016 All rights reserved.
IMPROVING IT PROCESS MANAGEMENT THROUGH VALUE
STREAM MAPPING APPROACH: A CASE STUDY
Bong Keun Jeong
Tom E Yoon
Metropolitan State University of Denver, Denver, CO, United States
______________________________________________________________________
ABSTRACT
Value-Stream mapping (VSM) is a helpful tool to identify waste and improvement areas. It
has emerged as a preferred way to support and implement the lean approach. While lean
principles are well-established and have broad applicability in manufacturing, their
extension to information technology is still limited. Based on a case study approach, this
paper presents the implementation of VSM in an IT firm as a lean IT improvement
initiative. It involves mapping the current activities of the firm and identifying
opportunities for improvement. After several interviews with employees who are currently
involved in the process, current state map is prepared to describe the existing problem
areas. Future state map is prepared to show the proposed improvement action plans. The
achievements of VSM implementation are reduction in lead time, cycle time and resources.
Our finding indicates that, with the new process change, total lead time can be reduced
from 20 days to 3 days – 92% reduction in overall lead time for database provisioning
process.
Keywords: value stream mapping, VSM, lean principle, IT process management
1. INTRODUCTION
In today’s highly competitive business environment, information technology (IT)
plays a critical role in supporting business functions and satisfying business
requirements. Effective and efficient IT management has the potential to transform
business as well as positively impact on a company’s performance (Iden, 2012). As
business requirements constantly change, the business function expects IT to streamline
IT service provision to improve time-to-market responsiveness. Furthermore, firms are
performing continuous IT process re-engineering initiatives to reduce complexity and
cost while providing high quality of services, control, and availability (Attaran, 2004).
Lean IT is an approach for creating cost-effective, agile and flexible IT process
management (Bell and Orzen, 2010). Lean principles were originally developed to
improve quality and reduce cost in manufacturing. Later, Lean tools were used to
390 Jeong, Bong Keun, Yoon, Tom E.
JISTEM, Brazil Vol. 13, No. 3, Set/Dez., 2016 pp. 389-404 www.jistem.fea.usp.br
improve quality and reduce costs of services. In Lean IT, the thinking has evolved into a
robust approach for optimizing IT service provisioning and IT-enabled business
processes by improving quality, eliminating waste, shortening lead times and reducing
cost. Lean IT principles have gained significant attention as a viable option to address
the challenges of enabling and sustaining the continuous IT process improvement.
According to McKinsey & Company, applying Lean IT principles can increase
application development and maintenance productivity by as much as 40% while
improving the quality and speed of execution (Kindler et al., 2007). Among various
Lean IT tools, Value-Stream mapping (VSM) is a helpful tool to identify waste and
improvement areas. VSM is a standardized way of documenting the process steps and
flow of work items, and then applying a systematic way to analyze these processes in
order to develop an improvement plan (Ali et al., 2016; Chen et al., 2012; Damelio,
1996; Tapping and Shuker, 2003). The visualization and quantification of the process
flow makes it easier to identify waste and other constraints on value chain. VSM has
emerged as a preferred way to support and implement the lean approach (Grewal, 2008;
Serrano et al., 2008; Seth and Gupta, 2005; Tortorella et al., 2016; Tyagi et al., 2015).
This paper describes the implementation of VSM in an IT firm as a lean IT
improvement initiative. While VSM is well-established and has broad applicability in
manufacturing, little consideration has been given in service areas such as healthcare
and banking, least of all in information technology (Bonaccorsi et al., 2011; Machado
and Leitner, 2010; Piercy and Rich, 2009; Snyder et al., 2005; Wang and Chen, 2010).
We apply VSM for improving IT process management to achieve operational efficiency
such as reducing project delivery time, time-to-market or eliminating non-value added
steps. A case study conducted at ABC Company is presented. ABC is a leading firm in
information technology services. However, the company faces several challenges in
delivering IT services such as database provisioning. Due to process inefficiency, it
creates a high number of project escalations which cause more costs to the company.
We discuss the company’s current process flows and identify bottlenecks. Based on the
analysis, we also provide recommendations and present future state map (to-be-process).
2. VALUE-STREAM MAPPING: AN OVERVIEW
Value Stream Mapping (VSM) is a standardized way of documenting (mapping)
processes and information/material flows as they are, and applying a systematic way to
analyze these processes in order to identify various waste and target specific areas for
improvement (Ciarapica et al., 2016; Damelio, 1996; Kuipera et al., 2016; Rother and
Shook, 1998; Tapping and Shuker, 2003). This visual representation facilitates the
process of lean implementation by identifying value-adding steps in a value stream and
eliminating non-value-adding steps or waste (Grewal, 2008). VSM was originally
developed to focus on the analysis and improvement of disconnected flow lines in
manufacturing environments (Rother and Shook, 1998), but it has emerged as the
preferred way to support and implement the lean approach for all industries. VSM
enables a company to see the entire process in both its current and desired future (lean)
state, and identify and eliminate waste, thereby streamlining work processes, cutting
lead times, reducing costs and increasing quality (Abuthakeer et al., 2010; Ballard and
Howel, 1994; Jasti et al., 2014; Rother and Shook, 1998; Tabanli and Ertay, 2013).
The first step to implement VSM is to draw a current state map. The value stream
map of current process is created and identifies different kinds of value-added as well as
non-value-added activities in this stage. The current state map is typically drawn by a
Improving IT process management through value stream mapping approach: a case study 391
JISTEM, Brazil Vol. 13, No. 3, Set/Dez., 2016 pp. 389-404 www.jistem.fea.usp.br
cross-functional, multi-disciplined team to document how things actually operate (“as-
is” process). The next step is to develop a future state map (“as should be”). In order to
do so, the current state map should be analyzed first. The team needs to identify gaps or
improvement areas (e.g. large inventories, long lead/cycle time), and provide rationale
as to how and why these activities identified are non-value-added. Based on the gap
areas found, the team proposes what must change in the process, methods, and
organization. Then, the future state map is developed to design a lean process flow
through the elimination of non-value-added activities and through process
improvements. The last step is to analyze the results after implementing the proposed
changes. This has to be quantified in terms of lead time reduction, cycle time reduction,
inventory reduction, etc. In addition, the team needs to develop a change plan that
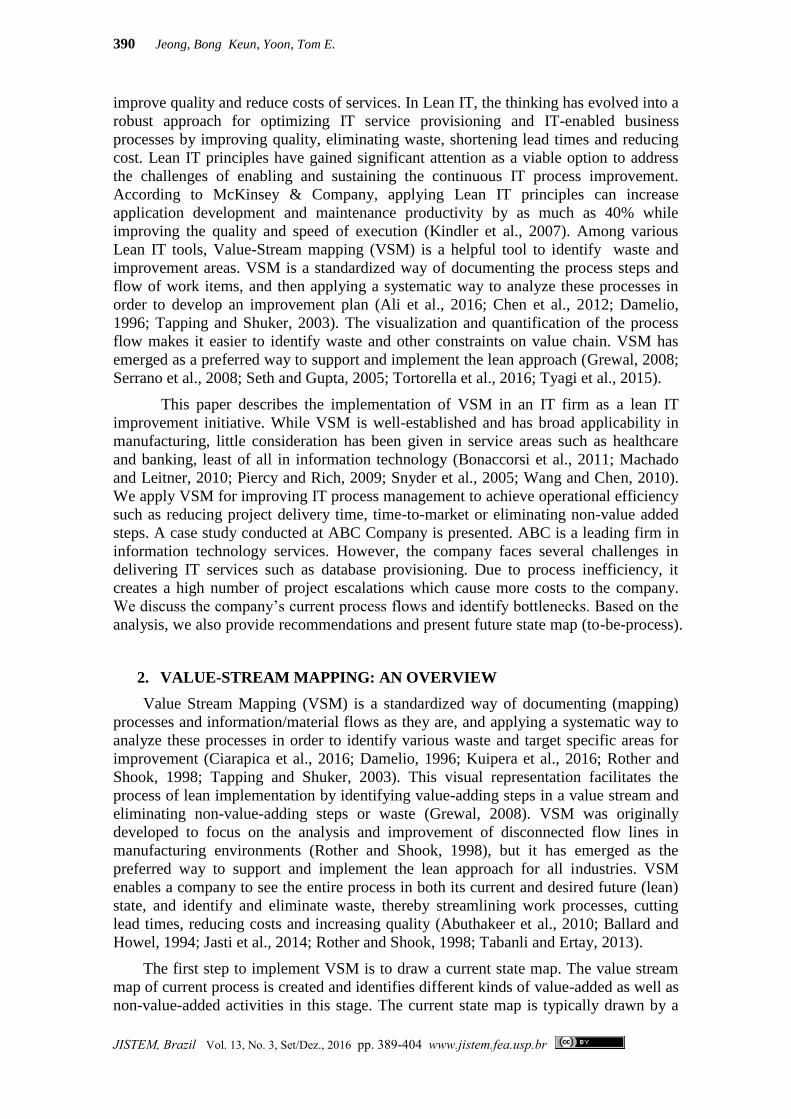
provides action steps needed to support the proposed changes. The steps in the
implementation of VSM are shown in Figure 1.
Figure 1. Steps in implementation of VSM
3. RESEARCH METHODOLOGY: CASE STUDY
Since the objective of this study is to describe how VSM can be implemented within
a real-life context, a case study was used. According to Yin (2002), the case study
method is well suited when a contemporary event is examined within its real-life
context and when the researcher has little or no capability of manipulating the event. In
addition, it is pertinent when research addresses a “how” question (McCutcheon and
Meredith, 1993).
3.1 Case Description
ABC is a leading firm in information technology services. It had 315,000
employees and its revenue was approximately $138 billion in 2015. The company has
comprehensive product portfolios which include hardware products, software solutions,
and IT services to large enterprises, small and medium business and individual
customers. The firm’s business operations have been organized in seven different
functions: Enterprise Services, Enterprise Storage and Servers, Personal System Groups,
Software, Imaging and Printing Group, Financial services, and Technological Solution
Group.
ABC has its own huge internal IT infrastructure setups and data centers to support

392 Jeong, Bong Keun, Yoon, Tom E.
JISTEM, Brazil Vol. 13, No. 3, Set/Dez., 2016 pp. 389-404 www.jistem.fea.usp.br
IT needs for different business units. They are managed by a large unit which is called
“ABC IT”. ABC IT consists of several departments. Some departments provide IT
support and services to business units (e.g. enterprise system, personal system,
technological solutions). Other departments are responsible for other IT functions such
as storage support, network service or database support that provide services across all
vertical business units.
3.2 Data Collection
Since this is a study of IT processes, unlike the manufacturing industry, we do not
have any physical shop floors to walk through and do a visual study. For the data
collection, engineers and IT managers across different geographical regions are
involved. They work with each other in virtual environment and through virtual
meetings. Only physical infrastructure which will get implemented is going to be
located in one of the US data centers, and every involved team will be accessing
remotely over the network. Below are the geographic locations from where teams of
engineers and managers have been interviewed.
United States
Mexico
Singapore
Malaysia
We conducted multiple virtual interviews with the detailed demand review (DDR)
team located only in United States. Also, database infrastructure build team, database
operation team, database build engineers and database SMEs (subject matter experts)
were interviewed from Singapore (on-site interview), Malaysia, Mexico and United
States. A total of 22 employees were interviewed for this study. More specifically, they
were asked to give a walkthrough, step by step process, and/or activities “what do they
do during the database build activity?” A paper and pencil was used to make a rough
map as the engineers are going through various activities. Collected information and
rough process or activity steps recorded during the interviews were reviewed with other
engineers and build managers using the virtual room sharing, and ensured the quality of
the collected data.
This data collection process was repeated with some of the old build engineers who
now has moved to different projects and with current build engineers. The current state
of processes was also discussed with senior managers to gather their management view
and requirements which helped us to finalize an “expected/ideal goal”. Once all
involved personnel was interviewed, we moved to the next stage where “current state”
process map of various activities were created.
4. CASE STUDY: IMPROVING DATABASE PROVISIONING PROCESS TO
MEET BUSINESS DEMANDS
4.1. Step 1: Problem definition
ABC IT faces several challenges in delivering IT services. One of the bottlenecks
in delivery of IT services is the database support and service process in Global Database
Administration (GDBA) department. GDBA department is responsible for delivering all
kinds of back-end database infrastructure needs and maintaining database operations.
As business demands have been constantly changing, the current database server
provisioning process is no longer suitable to meet the level of requirements.

Improving IT process management through value stream mapping approach: a case study 393
JISTEM, Brazil Vol. 13, No. 3, Set/Dez., 2016 pp. 389-404 www.jistem.fea.usp.br
Furthermore, the process inefficiency has led to even higher number of project
escalations, causing more costs to the company. Databases and servers are the backbone
of application deployments or enterprise services, so timely delivery of these services
plays an important role in business. It becomes necessary to review the current database
provisioning processes and evaluate against new demands and forecasting.
4.2. Step 2: Preparation of Current State Map
Figure 2 illustrates the overall database build and delivery process. In three-phase
process below, each phase also has its own set of sub-processes. We present more
details of each phase in the following.
Figure 2. Overview of database building and delivery process
Phase 1 - Planning
Upon receiving a business request for database(s), GDBA Detail Demand Review
(DDR) team meets with a business manager to identify database infrastructure
requirements in details1. Planning process is mostly standardized in a way that DDR
team manually goes through a set of pre-defined questionnaires to get requirements
from the business manager. Various aspects of infrastructure requirement such as
demand feasibility, availability of engineers, standard, hardware, and configuration are
reviewed. Once DDR team and the business manager come to an agreement, the request
for change (RFC) of database allocation and configuration is submitted. If the RFC is
approved by different managers involved, final requirements are locked down and the
work order is sent to the build team (however, if the request from business units is
infeasible, it will go back to the business manager for repeated review). Figure 3
provides a detail view of planning phase and its value-added and non-value-added time
for each activity. The completion time of each activity varies, so we used an average
time based upon information collected during the interview process. In the planning
phase, we estimated 130 minutes of value-added activity time and 20 days of non-value-
added time.
1 It takes an average of 15 days even for a business manager to schedule a meeting with DDR team. We
decide not to include this non-value-added time in the analysis since it is not a part of database provisioning process, however, this should be noted as another major bottleneck.

394 Jeong, Bong Keun, Yoon, Tom E.
JISTEM, Brazil Vol. 13, No. 3, Set/Dez., 2016 pp. 389-404 www.jistem.fea.usp.br
Figure 3. Sub-processes in planning phase
1. PlanningD
DR
Tea
m
1.1
Demand
Qualification
1.2
Project
Interlock
1.3
Standard
Verification
1.4
Hardware
Specification
1.5
RFC for
Database
Configuration
and Allocation
1.6
Demand
Confirmation
and Move
Package
10 mins 10 mins 30 mins 30 mins 20 mins 30 mins
20 days
Total Value Added Time:
Total Non Value Added Time:
130 minutes
20 days
Total Lead Time: 20 days 130 minutes
Value Added
Non Value Added
Phase 2 - Execution
This is the process which takes the inputs from approved work order for actual
database implementation. The execution process is mainly related to technical work
done by engineers. The assigned engineers verify the type of database needs to be
created and identify the hardware for installation. Once the type of database and
hardware is confirmed, UNIX team starts configuring the new hardware as per standard,
and the build team works on software installation and database creation. Lastly,
database backup request is submitted, and backup team sets up appropriate backup
infrastructure and database backup. Figure 4 shows the detail activities involved in the
execution process and their timelines. In the execution phase, we estimated 505 minutes
of value-added activity time and 8 days of non-value-added time.
Figure 4. Sub-processes in execution phase
2. Execution
Un
ix T
eam
Ba
cku
p
Tea
mB
uil
d T
eam
2.1
Build Type
Verification
2.2
Server
Identification
2.3
Unix Storage
Creation
2.4
Database
Build
2.5
Database
Backup
Request
2.6
Database
Backup
Configuraton
15 mins 10 mins 120 mins 60 mins
5 days
Total Value Added Time:
Total Non Value Added Time:
505 minutes
8 days
Total Lead Time: 8 days 505 minutes
Value Added
Non Value Added
60 mins
3 days
240 mins
Improving IT process management through value stream mapping approach: a case study 395
JISTEM, Brazil Vol. 13, No. 3, Set/Dez., 2016 pp. 389-404 www.jistem.fea.usp.br
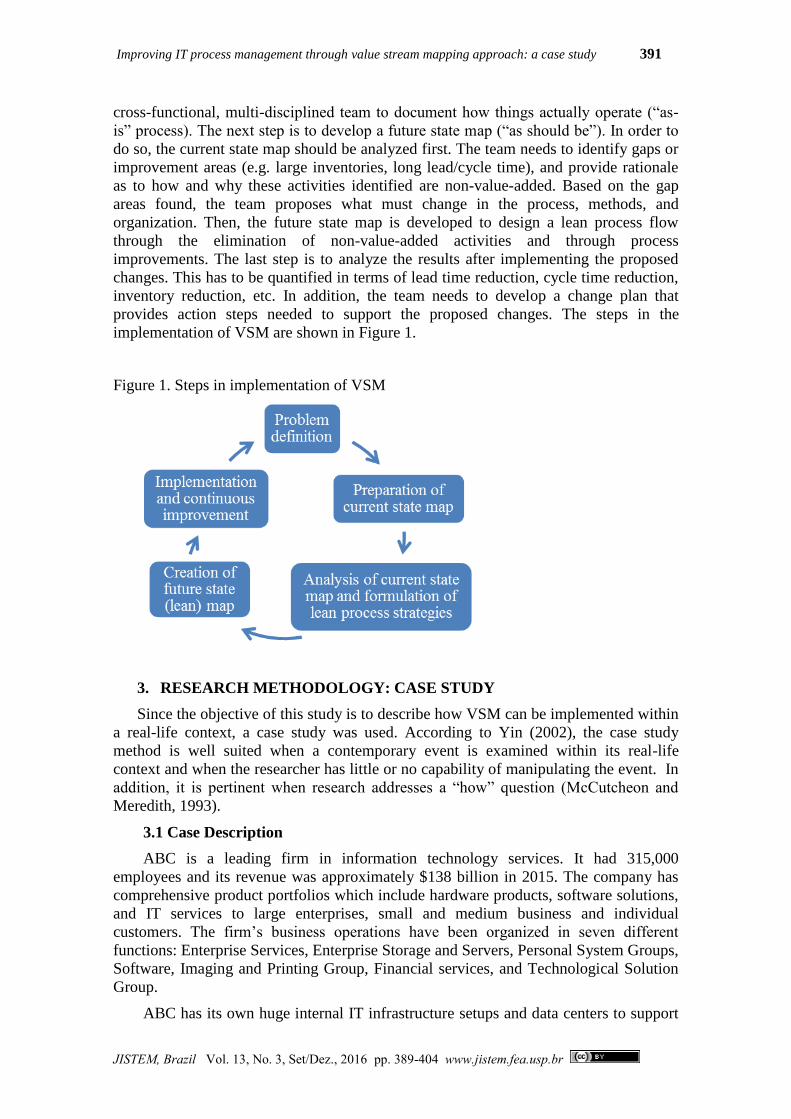
Phase 3 - Quality Assurance and Handover
Once the database creation is completed, a quality assurance and handover
process will start. This process is iterative in nature and goes for several rounds of
standard quality checks and corrections between databases engineers and MTP (Move-
To-Production) team. This iteration is mainly because of differences in standard check
parameters that each team has. Each team follows their own manual check list to ensure
the quality of new database. Once this phase is cleared, the database will be handed over
to MTP team and go live. Figure 5 illustrates the detail activities involved in the quality
control and handover process and their timelines. In the quality control and handover
phase, we estimated 120 minutes of value-added activity time and 3 days of non-value-
added time.
Figure 5. Sub-processes in quality assurance and handover phase
3. Quality Assurance and Handover
MT
P T
eam
Bu
ild
Tea
m
60 mins 60 mins
3 days
Total Value Added Time:
Total Non Value Added Time:
120 minutes
3 days
Total Lead Time: 3 days 120 minutes
Value Added
Non Value Added
3.1
Quality Check
3.3
Acknowledgement
3.4
Database Move to
Production (Go Live)
3.2
Review of Quality
Assurance
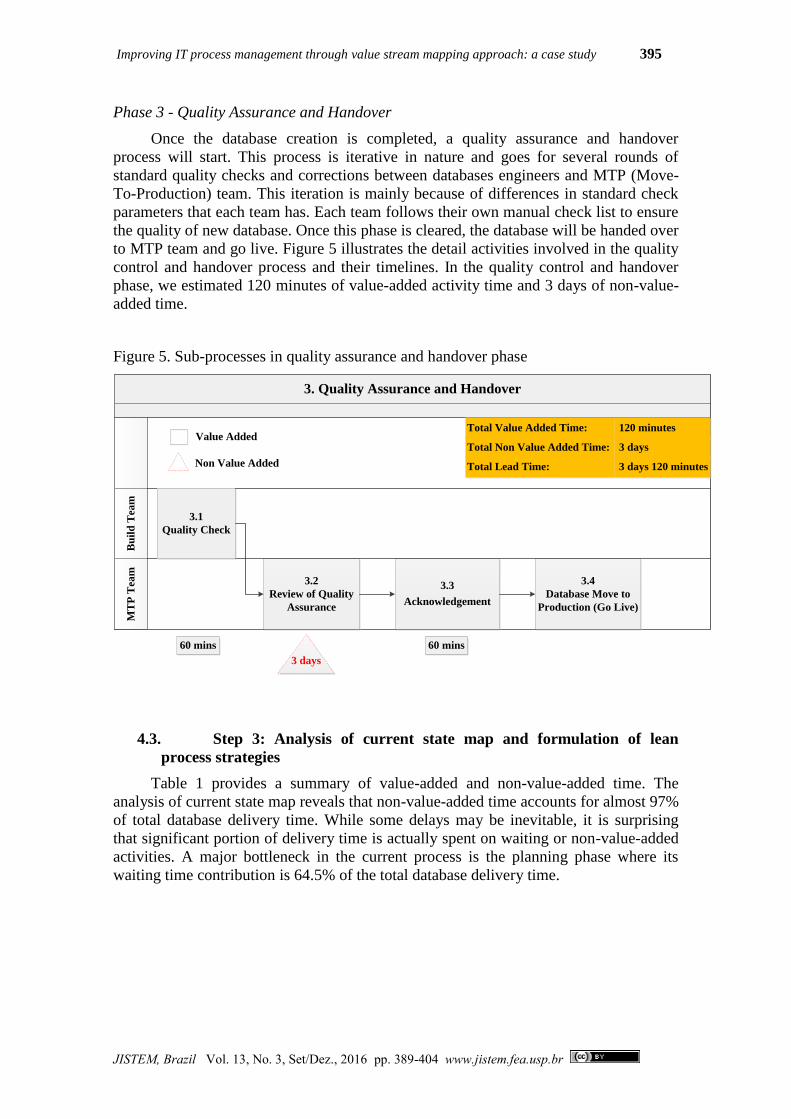
4.3. Step 3: Analysis of current state map and formulation of lean
process strategies
Table 1 provides a summary of value-added and non-value-added time. The
analysis of current state map reveals that non-value-added time accounts for almost 97%
of total database delivery time. While some delays may be inevitable, it is surprising
that significant portion of delivery time is actually spent on waiting or non-value-added
activities. A major bottleneck in the current process is the planning phase where its
waiting time contribution is 64.5% of the total database delivery time.

396 Jeong, Bong Keun, Yoon, Tom E.
JISTEM, Brazil Vol. 13, No. 3, Set/Dez., 2016 pp. 389-404 www.jistem.fea.usp.br
Table 1. Summary of value-added and non-value-added time
Phase Value-Added Time Non-Value-Added Time
Planning 130 minutes 20 days
Execution 505 minutes 8 days
QA & Handover 120 minutes 3 days
Total 755 minutes (12.6 hours) 31 days
There are several problems identified in the planning phase. First of all, the
planning phase is a purely manual process that DDR team manually goes through a set
of pre-defined questionnaires to get requirements. Even after the final requirements are
confirmed, it has to go through the manual RFC approval processes by different
managers which take an average of 20 days. Figure 6 provides the detail work flow and
problems in the planning phase. The problems during the execution phase are that any
changes should have a minimum of 5 days of implementation window after RFC
approval due to RFC process guideline. It means that there are 5 days of turnaround
time before UNIX team can even start configuring a new hardware. We also find that
the database backup configuration is an internal process of Backup team which has a
lead time of 3 days. However, this can be automated and incorporated during the
database build process to improve the current processing time. Lastly, the problem
identified in quality assurance and handover process is that, due to the lack of quality
check standard, each team has its own local checklist and they manually go through the
lists. Another problem is while the build team conducts an initial quality check, MTP
team also runs a separate quality check before the acknowledgement of quality
assurance. This repeat verification and manual re-check process accounts non-value-
added time of 3 days. Table 2 summarizes the non-value-added time in different phases.
We also calculated “TAKT” time. TAKT time is used to synchronize the pace of
production with pace of sales. It is calculated by dividing net time available with total
demand (Buzby et al., 2002; Grewal, 2008). Based on the company’s recent scorecard,
we identified that the annual demand for database is approximately 1,030. And we
calculated the net time available for build per year is 58,800 hours (considering 52
weeks per year * 5 working days per week * 24 hours * 10 engineers).
TAKT time = 58,800 / 1,030 = 57.1 per hour (2.4 days)
This number implies that GDBA team has to produce one completed database in
every 2.4 days to meet the company’s annual database demand. However, with the
current process, it takes almost 32 days to complete one work order which is a
significant problem.

Improving IT process management through value stream mapping approach: a case study 397
JISTEM, Brazil Vol. 13, No. 3, Set/Dez., 2016 pp. 389-404 www.jistem.fea.usp.br
Table 2. Summary of non-value-added time
Phase Activity Non-Value-
Added Time
Problem Identified
Planning Request for change
(RFC) for database
configurations and
allocation 20 days
Planning phase is a purely
manual process
Getting RFC approval from
different stakeholders take a long
time
Execution Unix Storage
Creation
5 days
Due to RFC process guideline,
any change should have minimum
of 5 days of implementation
window after RFC approval
5 days of turnaround time
before Unix team starts
configuring the new hardware
Execution Database Backup
Request &
Configuration 3 days
Backup Team will setup the
backup infrastructure for the
database
Quality
Assurance &
Handover
Acknowledgement of
Quality Assurance 3 days Repeat verification and manual
re-check process
Figure 6. Current work flow and problems identified in planning phase
Are all
requirements
met?
Business Manager (BM)Business Manager (BM)
Request a
meeting with
DDR team for
the demand
review
Send back to
BM and review
the request
once again
Send RFC
documents for
approval
Yes
Manager 1Manager 1
Demand
qualification
met?
Project
interlock?
Standard
verification
met?
Hardware
specification
met?
No No No No
Yes Yes Yes Yes
No
Start manual
review process
Meeting time
scheduled
DDR team and BMDDR team and BM
Send back to
DDR team for
review
Approve?
Send RFC
documents for
approval
YesApprove?
No
Send RFC
documents for
approval
Yes
Manager 2Manager 2All managersAll managers
All RFCs
approved?
Create Move
package ID
Business Manager (BM)Business Manager (BM)
No
No
Yes
Request a
meeting with
build manager
to assign
resources
Schedule a meeting
with DDR team takes
15 days
Each manager goes through
the manual approval process
which takes 20 days
4.4. Step 4: Creation of future state (Lean) map
The analysis of current state map was shared with senior managers to obtain their views
and suggestions. This helps us to identify requirements and finalize an expected (target)
goal. Based on the gap areas identified, several changes were proposed.

398 Jeong, Bong Keun, Yoon, Tom E.
JISTEM, Brazil Vol. 13, No. 3, Set/Dez., 2016 pp. 389-404 www.jistem.fea.usp.br
Automation of the planning phase including RFC approvals to minimize human
resource dependencies (delays)
Create an automated script for backup specification which can be incorporated in
the execution process. This will benefit both teams by reducing the work in
backup engineers and by reducing the waiting time for build team during the
execution process
Design a unified QA standard to streamline the quality check and handover
process. Make the quality check results available on the internal IT website or
SharePoint. At the same time improve the technical build scripts and processes
as per the required standard to get the product right at first time only
Based upon the proposed changes, we prepared a future state (lean) map for each phase.
Phase 1 - Planning
As shown in Figure 7, we propose a new system that automates the entire
planning process. Once the business manager fills out an online request form, the
request notification is sent to DDR team, and the team verifies different demand review
specifications without setting up a meeting. As mentioned earlier, it even takes 15 days
for the business manager to schedule a meeting with DDR team. Another benefit of new
system is that the business manager can submit multiple requests online, and these DDR
requests flow in the system simultaneously.
After the demand specifications are reviewed by DDR team, RFC approval
request mail will be sent to different managers involved. The system automatically
obtains approvals by providing required information in a single mail or documents
attached. This new process reduces the waiting time of planning phase significantly as
“getting RFC approval and follow-up” takes the longest waiting time. Figure 8 illustrate
the automation of planning phase as future state map. While the process itself does not
change in this phase, we expect that the total lead time spent can be reduced from 20.09
days to 2.07 days by replacing the current manual process with the automated system.
Figure 7. Future state map in planning phase
1. Planning
GB
BA
DD
R
Tea
m
1.1
Demand
Qualification
1.2
Project
Interlock
1.3
Standard
Verification
1.4
Hardware
Specification
1.5
RFC for
Database
Configuration
and Allocation
1.6
Demand
Confirmation
and Move
Package
10 mins 10 mins 30 mins 30 mins 5 mins 10 mins
2 days
Total Value Added Time:
Total Non Value Added Time:
95 minutes
2 days
Total Lead Time: 2 days 95 minutes
Value Added
Non Value Added

Improving IT process management through value stream mapping approach: a case study 399
JISTEM, Brazil Vol. 13, No. 3, Set/Dez., 2016 pp. 389-404 www.jistem.fea.usp.br
Figure 8. Future state map – Automation of Planning phase
Are all
requirements
met?
Business Manager (BM)Business Manager (BM)
Fill out web
DDR request
form
Send back to
BM and review
the request
once again
Send an auto
generated mail
to managers for
RFC approval
with vote button
Yes
All RFCs
approved?
Send back to
DDR team for
review No
Update move
package ID?
Send an
reminder mail
to BM
No
Send an mail to
build manager to
assign resources
Yes
Demand
qualification
met?
Project
interlock?
Standard
verification
met?
Hardware
specification
met?
No No No No
Yes Yes Yes Yes
DDR TeamDDR Team
No
Create Move
package ID
BMBM
Start review
process
Yes
RFC approval process is automated so that BM
does not have to wait until all managers
manually evaluate the request and approve
Request can be
submitted online
so that BM does
not have to
schedule a
meeting with
DDR team
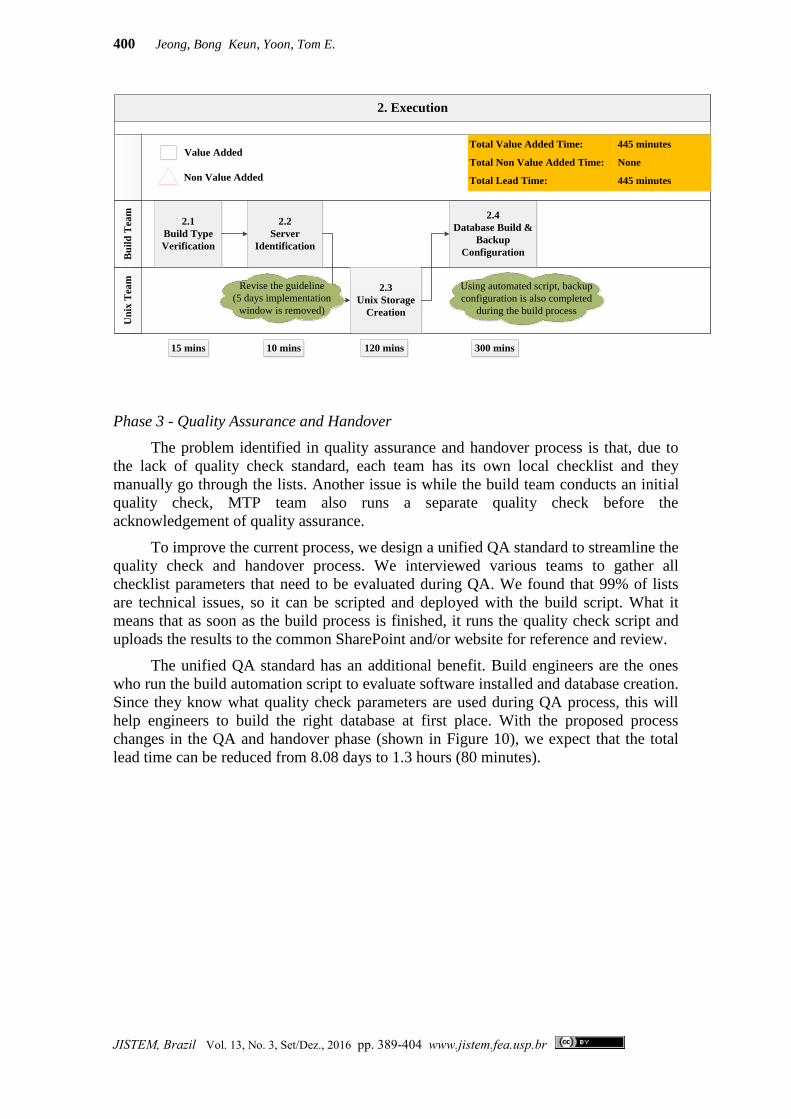
Phase 2 - Execution
During the interview process, we found that, due to RFC process guideline, any
changes should have a minimum of 5 days implementation window after RFC approval.
That’s the reason why Unix team has 5 days of turnaround time before they starts
configuring the new hardware. In the future state map, we reverse the current standard
so that 5 days implementation window can be removed.
Another process change is to create an automated script for backup configuration.
Database backup configuration is an internal process of Backup team which has a lead
time of 3 days. However, this can be automated and incorporated during the database
build process. This not only benefits backup engineers by reducing the workload, but
also helps the build team to avoid the backup team dependency. With the proposed
process changes in the execution phase, we expect that the total lead time can be
reduced from 8.35 days to 7.4 hours (445 minutes).
Figure 9. Future state map in execution phase
400 Jeong, Bong Keun, Yoon, Tom E.
JISTEM, Brazil Vol. 13, No. 3, Set/Dez., 2016 pp. 389-404 www.jistem.fea.usp.br
2. Execution
Un
ix T
eam
Bu
ild
Tea
m
2.1
Build Type
Verification
2.2
Server
Identification
2.3
Unix Storage
Creation
2.4
Database Build &
Backup
Configuration
15 mins 10 mins 120 mins
Total Value Added Time:
Total Non Value Added Time:
445 minutes
None
Total Lead Time: 445 minutes
Value Added
Non Value Added
300 mins
Revise the guideline
(5 days implementation
window is removed)
Using automated script, backup
configuration is also completed
during the build process
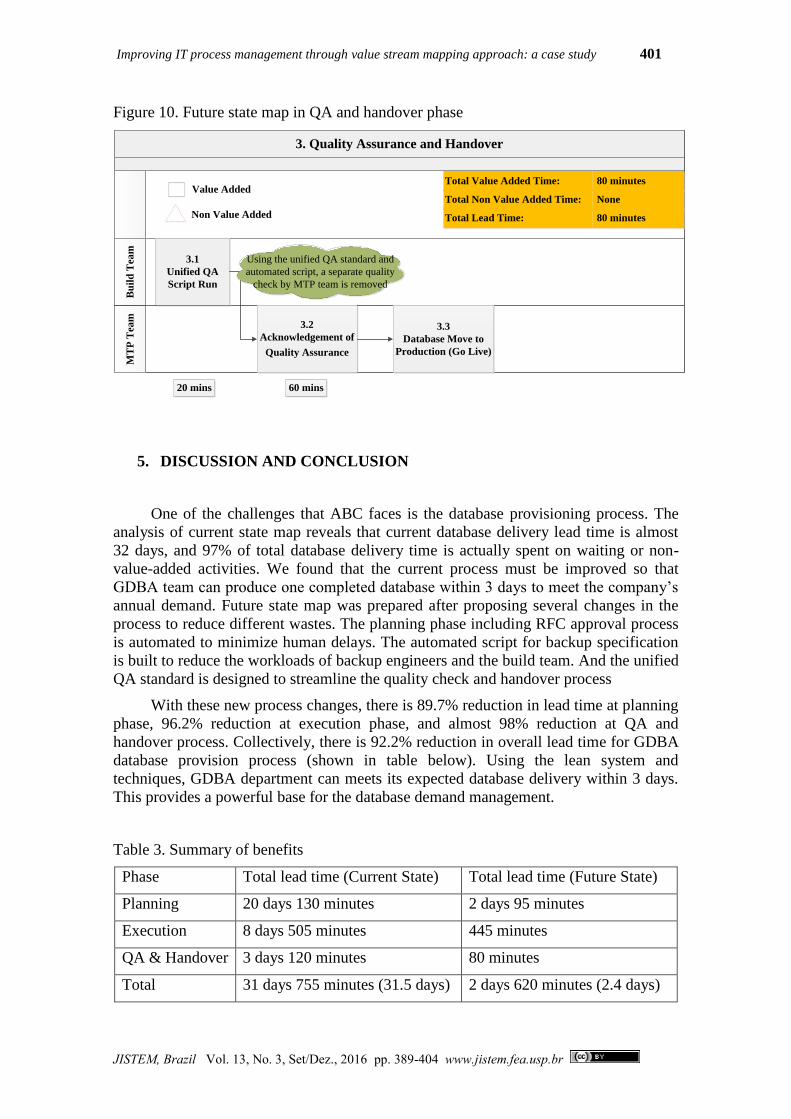
Phase 3 - Quality Assurance and Handover
The problem identified in quality assurance and handover process is that, due to
the lack of quality check standard, each team has its own local checklist and they
manually go through the lists. Another issue is while the build team conducts an initial
quality check, MTP team also runs a separate quality check before the
acknowledgement of quality assurance.
To improve the current process, we design a unified QA standard to streamline the
quality check and handover process. We interviewed various teams to gather all
checklist parameters that need to be evaluated during QA. We found that 99% of lists
are technical issues, so it can be scripted and deployed with the build script. What it
means that as soon as the build process is finished, it runs the quality check script and
uploads the results to the common SharePoint and/or website for reference and review.
The unified QA standard has an additional benefit. Build engineers are the ones
who run the build automation script to evaluate software installed and database creation.
Since they know what quality check parameters are used during QA process, this will
help engineers to build the right database at first place. With the proposed process
changes in the QA and handover phase (shown in Figure 10), we expect that the total
lead time can be reduced from 8.08 days to 1.3 hours (80 minutes).
Improving IT process management through value stream mapping approach: a case study 401
JISTEM, Brazil Vol. 13, No. 3, Set/Dez., 2016 pp. 389-404 www.jistem.fea.usp.br
Figure 10. Future state map in QA and handover phase
3. Quality Assurance and Handover
MT
P T
eam
Bu
ild
Tea
m
20 mins 60 mins
Total Value Added Time:
Total Non Value Added Time:
80 minutes
None
Total Lead Time: 80 minutes
Value Added
Non Value Added
3.1
Unified QA
Script Run
3.2
Acknowledgement of
Quality Assurance
3.3
Database Move to
Production (Go Live)
Using the unified QA standard and
automated script, a separate quality
check by MTP team is removed
5. DISCUSSION AND CONCLUSION
One of the challenges that ABC faces is the database provisioning process. The
analysis of current state map reveals that current database delivery lead time is almost
32 days, and 97% of total database delivery time is actually spent on waiting or non-
value-added activities. We found that the current process must be improved so that
GDBA team can produce one completed database within 3 days to meet the company’s
annual demand. Future state map was prepared after proposing several changes in the
process to reduce different wastes. The planning phase including RFC approval process
is automated to minimize human delays. The automated script for backup specification
is built to reduce the workloads of backup engineers and the build team. And the unified
QA standard is designed to streamline the quality check and handover process
With these new process changes, there is 89.7% reduction in lead time at planning
phase, 96.2% reduction at execution phase, and almost 98% reduction at QA and
handover process. Collectively, there is 92.2% reduction in overall lead time for GDBA
database provision process (shown in table below). Using the lean system and
techniques, GDBA department can meets its expected database delivery within 3 days.
This provides a powerful base for the database demand management.
Table 3. Summary of benefits
Phase Total lead time (Current State) Total lead time (Future State)
Planning 20 days 130 minutes 2 days 95 minutes
Execution 8 days 505 minutes 445 minutes
QA & Handover 3 days 120 minutes 80 minutes
Total 31 days 755 minutes (31.5 days) 2 days 620 minutes (2.4 days)

402 Jeong, Bong Keun, Yoon, Tom E.
JISTEM, Brazil Vol. 13, No. 3, Set/Dez., 2016 pp. 389-404 www.jistem.fea.usp.br
This article presents a case study of IT process re-engineering initiative. The case
study shows that Lean IT can be a useful approach for optimizing IT service
provisioning and IT-enabled business processes by improving quality, eliminating waste,
shortening lead times and reducing cost. In addition, the case study demonstrates that
VSM is a useful lean IT tool to document current process flows in order to identify
bottlenecks for improvement. We applied VSM for improving database provisioning
process to reduce project delivery time. Based on the current flow analysis, we provided
recommendations and presented future state map. Observations and findings from this
study can be useful to practitioners for motivating their efforts to implement VSM and
supporting the continuous improvement of IT processes.
For instance, one interesting observation during the interview process was that
current state process map the build engineers constructed was quite different from the
existing process architecture (determined by senior IT managers). While project demand
and requirements constantly change, the build engineers were not allowed to
modify/skip the existing processes. This, in fact, caused longer delivery time and
required additional resources. The build team was always being in fire-fighting mode
and under the pressure of meeting delivery deadline which also reduces the quality of
project. This finding was presented to senior management, and we recommended that it
does not have to follow the pre-defined process cycle, but needs to customize the
process to achieve the faster delivery of project. This change would enable the build
team to move away from the project-based delivery structure to more appropriate
‘capability’ based structure to collect the requirement and to deliver projects.
Our study has several limitations which creates scope for future research. In this
paper, only one case study is considered in the single IT department. Further validation
is therefore required across both multiple IT departments and also more broadly across
different IT functions before we can fully support the lean approach in these contexts.
This paper provides useful exploratory evidence on lean IT improvement initiative but
further research is needed to support our findings. Furthermore, the interviews and
documents have only involved staff who were actively involved in the process. No
doubt there would be opposite views both from different IT staff and users. To extend
this research and gain a broader view, interviews with a wider range of stakeholders can
be conducted.
REFERENCES
Abuthakeer, S.S., P.V. Mohanram, and G.M. Kumar, 2010. Activity Based Costing
Value Stream Mapping, International Journal of Lean Thinking. 1(2), pp. 51-64.
Ali, Nauman Bin, K. Petersen, and K. Schneider, 2016. FLOW-assisted value stream
mapping in the early phases of large-scale software development. The Journal of
Systems and Software, 111, pp. 213-227.
Attaran, M., 2004. Exploring the relationship between information technology and
business process reengineering. Information & Management, 41(5), pp. 585-596.
Ballard, G., and G. Howell, 1994. Implementing lean construction: Stabilizing Work
Flow, Journal of Production and Inventory management. pp. 37-48.
Bell, S., and M. Orzen, 2010. Lean IT, Enabling and Sustaining Your Lean
Transformation. New York: Productivity Press.
Bonaccorsi, A., G. Carmignani, and F. Zammori, 2011. Service Value Stream
Improving IT process management through value stream mapping approach: a case study 403
JISTEM, Brazil Vol. 13, No. 3, Set/Dez., 2016 pp. 389-404 www.jistem.fea.usp.br
Management (SVSM): Developing Lean Thinking in the Service Industry. Journal of
Service Science and Management, 4, pp. 428-439.
Buzby, C., A. Gerstenfield, L. Voss, and A. Zeng, 2002. Using lean principles to
streamline the quotation process: a case study. Industrial Management & Data Systems,
102(9), pp. 513-520.
Chen, Joseph C., and R. Cox, 2012. Value Stream Management for Lean Office-A Case
Study. American Journal of Industrial and Business Management, 2, pp. 17-29.
Ciarapica, Filippo Emanuele, M. Bevilacqua and G. Mazzuto, 2016. Performance
analysis of new product development projects - An approach based on value stream
mapping. International Journal of Productivity and Performance Management, 65(2), pp.
177-206.
Damelio, R., 1996. The Basics of Process Mapping. New York: Productivity Press.
Emiliani, M.L., and D.J. Stec, 2004. Using value-stream maps to improve leadership.
The Leadership & Organization Development Journal, 25(8), pp. 622-645.
Grewal, C., 2008. An initiative to implement lean manufacturing using value stream
mapping in a small company. International Journal of Manufacturing Technology and
Management, 15(3), pp. 404-417.
Iden, J., 2012. Investigating process management in firms with quality systems: a multi-
case study, Business Process Management Journal. 18(1), pp. 104-121.
Jasti, Naga Vamsi Krishna and A. Sharma, 2014. Lean manufacturing implementation
using value stream mapping as a tool - A case study from auto components industry.
International Journal of Lean Six Sigma, 5(1), pp. 89-116.
Kindler, N.B., V. Krishnakanthan, and R. Tinaikar, 2007. Applying Lean to Application
Development and Maintenance. The McKinsey Quarterly,
http://www.executivesondemand.
net/managementsourcing/images/stories/artigos_pdf/produtividade/Applying_lean_to_a
pplication_development_and_maintenance.pdf.
Kuipera, Alex, R. Hoef, M. Wesseling, B. Lameijer, and R. Does, 2016. Quality
quandaries: Improving a customer value stream at a financial service Provider. Quality
Engineering, 28(1), pp. 155-163.
Machado, V.C., and U. Leitner, 2010. Lean tools and lean transformation process in
health care. International Journal of Management Science and Engineering
Management, 5(5), pp. 383-392.
McCutcheon, D. M., & Meredith, J. R., 1993. Conducting case study research in
operations management. Journal of Operations Management, 11(3), 239-256.
Nepal, B. P., O.P. Yadav, and R. Solanki, 2011. Improving the NPD Process by
Applying Lean Principles: A Case Study. Engineering Management Journal, 23(1), pp.
52-68.
Piercy, N., and N. Rich, 2009. Lean transformation in the pure service environment: the
case of the call service centre. International Journal of Operations & Production
Management, 29(1), pp. 54-76.
Rother, M., and J. Shook, 1998. Learning to See: Value Stream Mapping to Add Value
and Eliminate Muda. Brookline: The Lean Enterprise Institute.

404 Jeong, Bong Keun, Yoon, Tom E.
JISTEM, Brazil Vol. 13, No. 3, Set/Dez., 2016 pp. 389-404 www.jistem.fea.usp.br
Serrano, I., C. Ochoa, and R.D. Castro, 2008. Evaluation of value stream mapping in
manufacturing system redesign. International Journal of Production Research, 46(16),
pp. 4409-4430.
Seth, D., and V. Gupta, 2005. Application of value stream mapping for lean operations
and cycle time reduction: an Indian case study, Production Planning and Control. 16(1),
pp. 44-59.
Snyder, K.D., P. Paulson, and P. McGrath, 2005. Improving processes in a small health-
care network: A value-mapping case study, Business Process Management Journal.
11(1), pp. 87-99.
Tabanli, R. Murat and T. Ertay, 2013. Value stream mapping and benefit–cost analysis
application for value visibility of a pilot project on RFID investment integrated to a
manual production control system-a case study. International Journal of Advanced
Manufacturing Technology, 66, pp. 987-1002.
Tapping, D., and T. Shuker, 2003. Value Stream Management for the Lean Office. New
York: Productivity Press.
Tortorella, Guilherme Luz, F. Fogliatto, M. Anzanello, G. Marodin, M. Garcia and R.
Esteves, 2016. Making the value flow: application of value stream mapping in a
Brazilian public healthcare organization. Total Quality Management & Business
Excellence, pp. 1-15.
Tyagi, Satish, A. Choudhary, X. Cai, and K.Yang, 2015. Value stream mapping to
reduce the lead-time of a product development process. International Journal of
Production Economics, 160, pp. 202-212.
Wang, F.K., and K. Chen, 2010. Applying Lean Six Sigma and TRIZ methodology in
banking services. Total Quality Management, 21(3), pp. 301-315.
Ward, P., and H. Zhou, 2006. Impact of Information Technology Integration and
Lean/Just-In-Time Practices on Lead-Time Performance. Decision Sciences, 37(2), pp.
177-203.
Yin, R. K. 2002. Case Study Research, Design and Methods. 3rd ed. Newbury Park,
CA, Sage Publications.