Improving How WIC Teaches Nutrition...Asian/Pacific Islander 1.9 1,787 Southeast Asian Refugee 0.2...
58
Improving How WIC Teaches Nutrition: Using Stages of Change Criteria and Critical Thinking Skills to Teach About Vegetables FY 2001 WIC Special Project Grant Final Report Iowa WIC Program Iowa Department of Public Health 321 East 12 th Des Moines, Iowa 50319-0075 June 2005
Transcript of Improving How WIC Teaches Nutrition...Asian/Pacific Islander 1.9 1,787 Southeast Asian Refugee 0.2...

Improving How WIC Teaches Nutrition: Using Stages of Change Criteria and
Critical Thinking Skills to Teach About Vegetables
FY 2001 WIC Special Project Grant Final Report
Iowa WIC Program Iowa Department of Public Health
321 East 12th
Des Moines, Iowa 50319-0075
June 2005

Page 2 Iowa WIC Program
Table of Contents Introduction and Background 3 Theoretical Basis 6 Project Implementation: Preparation Phase 7 Project Implementation: Delivery Phase 15 Project Implementation: Evaluation Phase 19 Project Impact: The Results 21 Additional Findings 41 Resources 53 Contact List 54 Other Resources and Materials 54 Recommendations and Tips for Implementation 54 References 55 Acknowledgements 57

Iowa WIC Program Page 3
INTRODUCTION AND BACKGROUND One of the goals of the Healthy People 2010 is to increase the proportion of the population 2 years of age and older who consume at least three daily servings of vegetables (1). The general consumption of vegetables in the United States (US) has declined nearly 14% over the past 10 years; 89% of the girls and 96% of the boys 2-12 years old do not eat 5 servings of vegetables per day (2, 3). This low total intake is accompanied by a limited variety of vegetables. White potatoes and tomatoes are the vegetables consumed most frequently (2). Although data are not available specifically about Iowa children’s intake of vegetables, analysis of the Behavioral Risk Factor Surveillance System (BRFSS) demonstrated that only 17% of Iowa adults ate five servings of fruits and vegetables per day in 2003 (4). This rate was well below the national average of 22.6%. Although Iowan’s fruit and vegetable intake increased from 15% in 1996 to 17% in 2003 as the national average decreased from 23.6% to 22.6% in the same time period, this is far below the Healthy People 2010 targets of 75% of persons aged 2 years and older who consume at least two daily servings fruits and 50% at least three servings of vegetables (1). The reported adult intakes are likely to reflect children’s intake in the household. Lack of knowledge may be only one of many barriers that limits consumption of vegetables. Recent focus group research identified barriers to vegetable consumption for Iowa parents (5). These barriers included inconvenience and time required to prepare vegetables, limited access to a variety and high quality vegetables, lack of knowledge on how to surmount children’s fear of trying new foods, concern about food waste, and confusion over the “5-a-day” social marketing campaign message. Similar findings have been reported recently from studies in Washington (6), Minnesota (7) and other countries such as Canada and the United Kingdom (8, 9). Nutrition education in Special Supplemental Nutrition Program for Women, Infants and Children (WIC) clinics traditionally has been prescriptive to address nutrition problems detected in the screening process. However, to improve vegetable consumption, clients report that they need practical information about choosing, storing, and preparing vegetables (5-9). They also need effective feeding tips to support successful introduction of new foods, particularly vegetables, to their young children. This project developed and implemented an innovative nutrition education delivery model that changed how caregivers were taught about vegetables in selected Iowa WIC clinics. The Stages of Change construct from the Transtheoretical Model was used to identify the readiness of caregivers to offer vegetables to their children. Using concepts of critical thinking, hands-on interactive nutrition education activities were provided to address each parent’s stage of change and their specific barriers to offering vegetables. These activities took place in the WIC clinic environment and, where possible, were provided in collaboration with other community-based nutrition programs including the Iowa Expanded Food and Nutrition Education Program (EFNEP), Family Nutrition Program (FNP), and the Iowa WIC Farmers Market Nutrition Program (FMNP). The nutrition intervention was assessed for its impact on improving caregiver’s knowledge and attitudes about vegetables, increasing the number of offerings and the frequency and variety of vegetables consumed by children 2 to 5 years of age, and increasing redemption rates for FMNP checks. The cost to replicate this nutrition education model was also determined.
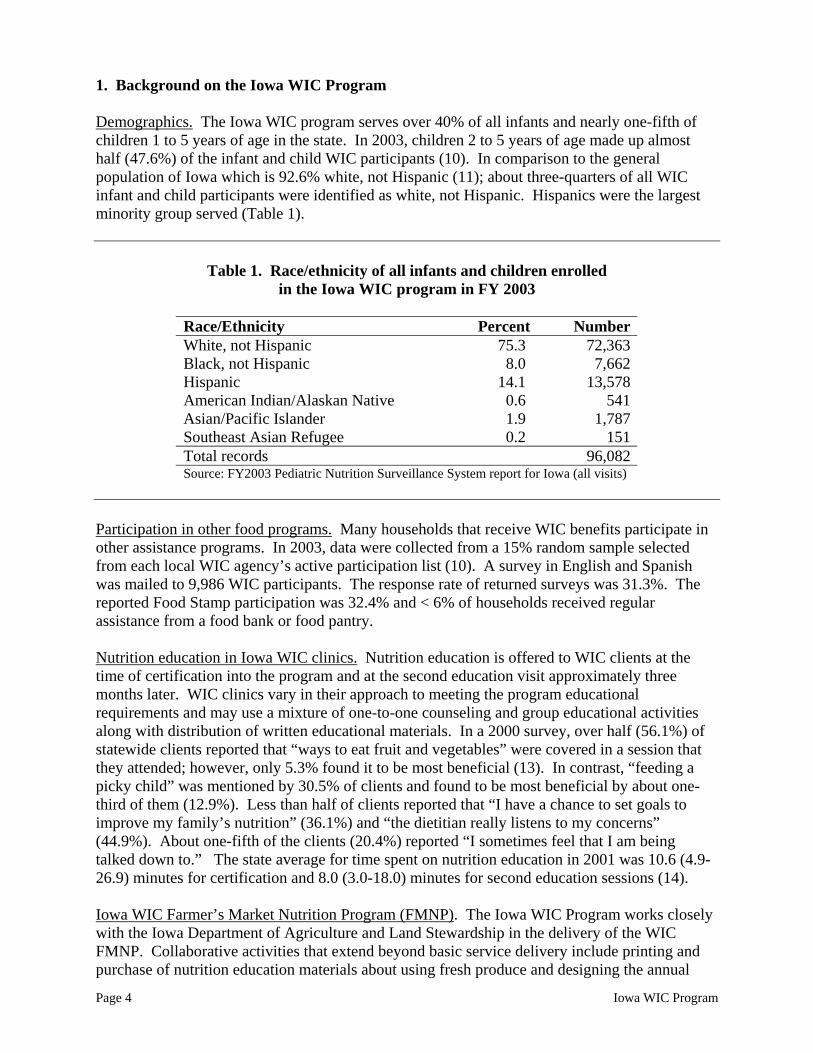
1. Background on the Iowa WIC Program Demographics. The Iowa WIC program serves over 40% of all infants and nearly one-fifth of children 1 to 5 years of age in the state. In 2003, children 2 to 5 years of age made up almost half (47.6%) of the infant and child WIC participants (10). In comparison to the general population of Iowa which is 92.6% white, not Hispanic (11); about three-quarters of all WIC infant and child participants were identified as white, not Hispanic. Hispanics were the largest minority group served (Table 1).
Table 1. Race/ethnicity of all infants and children enrolled
in the Iowa WIC program in FY 2003
Race/Ethnicity Percent Number White, not Hispanic 75.3 72,363 Black, not Hispanic 8.0 7,662 Hispanic 14.1 13,578 American Indian/Alaskan Native 0.6 541 Asian/Pacific Islander 1.9 1,787 Southeast Asian Refugee 0.2 151 Total records 96,082 Source: FY2003 Pediatric Nutrition Surveillance System report for Iowa (all visits)
Participation in other food programs. Many households that receive WIC benefits participate in other assistance programs. In 2003, data were collected from a 15% random sample selected from each local WIC agency’s active participation list (10). A survey in English and Spanish was mailed to 9,986 WIC participants. The response rate of returned surveys was 31.3%. The reported Food Stamp participation was 32.4% and < 6% of households received regular assistance from a food bank or food pantry. Nutrition education in Iowa WIC clinics. Nutrition education is offered to WIC clients at the time of certification into the program and at the second education visit approximately three months later. WIC clinics vary in their approach to meeting the program educational requirements and may use a mixture of one-to-one counseling and group educational activities along with distribution of written educational materials. In a 2000 survey, over half (56.1%) of statewide clients reported that “ways to eat fruit and vegetables” were covered in a session that they attended; however, only 5.3% found it to be most beneficial (13). In contrast, “feeding a picky child” was mentioned by 30.5% of clients and found to be most beneficial by about one-third of them (12.9%). Less than half of clients reported that “I have a chance to set goals to improve my family’s nutrition” (36.1%) and “the dietitian really listens to my concerns” (44.9%). About one-fifth of the clients (20.4%) reported “I sometimes feel that I am being talked down to.” The state average for time spent on nutrition education in 2001 was 10.6 (4.9-26.9) minutes for certification and 8.0 (3.0-18.0) minutes for second education sessions (14). Iowa WIC Farmer’s Market Nutrition Program (FMNP). The Iowa WIC Program works closely with the Iowa Department of Agriculture and Land Stewardship in the delivery of the WIC FMNP. Collaborative activities that extend beyond basic service delivery include printing and purchase of nutrition education materials about using fresh produce and designing the annual
Page 4 Iowa WIC Program

program evaluation completed by WIC participants. Because most of the Iowa-grown produce available at markets is vegetables, partnering with the Iowa FMNP to promote vegetables had the potential to increase the redemption rate of WIC FMNP checks. The redemption rate for Iowa in FFY00 was 57.1% (12). 2. Project objectives The goals and objectives for this project are listed below. The objectives under Goal 1 are process objectives that address the development of educational modules and training for the intervention. Goal 2 includes the impact objectives related to caregiver attitudes and knowledge (2.1-2.3) and outcome objectives that reflect behavior change (2.4-2.7).
Goal 1. Revitalize WIC nutrition education services to be more interactive, client-focused, and provide messages that meet participant needs and wants.
Objective 1.1. Develop a simple screening tool using the stages of change model that will assist staff in staging parents as to their readiness and intentions to increase the use of vegetables with their 2-5 year olds.
Objective 1.2. Develop interactive, hands-on nutrition education modules that use a critical thinking skills approach for the various stages of change.
Objective 1.3. Provide an initial one-day in-service training session for WIC dietitians and EFNEP/FNP program assistants to obtain skills needed to carry out the nutrition education intervention.
Objective 1.4. Provide two-hour follow-up training sessions on a quarterly basis for WIC dietitians and EFNEP/FNP program assistants to further skills needed to carry out the education intervention.
Objective 1.5. Carry out coordination meetings among WIC and other nutrition and education programs (e.g., Head Start and community-based nutrition coalitions) to standardize nutrition messages about vegetables.
Objective 1.6. Carry out joint staff education opportunities to share teaching methodologies with other nutrition and education programs (e.g., Head Start and community-based coalitions).
Iowa WIC Program Page 5

Goal 2. Improve the health and nutritional status of young children 2-5 years of age by increasing both the variety of vegetables consumed and the daily intake of vegetables.
Objective 2.1. Assess all participating parent’s stage of change concerning providing vegetables to their children.
Objective 2.2. Increase the percentage of parents who are knowledgeable about the importance of vegetables for health by 67%.
Objective 2.3. Increase the percentage of parents who have a positive attitude towards preparing vegetables and serving them to young children by 25%.
Objective 2.4. Increase the percentage of parents who prepare and serve vegetables to their children daily by 60%.
Objective 2.5. Increase the percentage of children 2-5 years of age that consume at least three servings of vegetables daily to 33%.
Objective 2.6. Increase the percentage of children 2-5 years of age that consume at least three different vegetables daily to 33%.
Objective 2.7. Increase redemption rates of WIC Farmers’ Market Nutrition Program checks in the intervention counties to 75%.
THEORETICAL BASIS This project was grounded on two constructs that provided the basis for the selection of the content for each nutrition education session. The first construct, Stages of Change, provided guidance as to the type of information or activity that would be most effective at a given time, based on a caregiver’s motivational intentions and dietary behavior. The second construct, critical thinking, provided a methodological approach to teaching nutrition education that relied on interactive activities and thoughtful reflection about decisions that empower parents in making effective changes to improve the diet of their young children. Each of these constructs is described briefly below. Stages of Change. The Transtheoretical Model (TTM) evolved as a means to determine how and why people change addictive behaviors (15-17). The key components of the model are the stages of change and the processes of change. The stages identify when behavior change occurs and the processes identify how people make behavior changes.
Page 6 Iowa WIC Program

Five stages have been identified, including:
Precontemplation: The person does not intend to make a behavior change. Contemplation: The person is seriously considering change within the next six
months but is not yet ready to make a commitment. Preparation: The person has unsuccessfully tried some changes in the past year
and intends to take action in the next month. Action: The individual has successfully modified the behavior within the last six months.
Maintenance: The person is working to continue action and prevent relapse. People weigh the benefits and barriers to making changes, known as a decisional balance. In the pre-action stages, people tend to focus on the barriers of change; as they move forward to action and maintenance they focus more on the benefits. TTM predicts that identifying an individual’s stage of change and tailoring interventions to match the processes to the stage of change will help people achieve success in health-related changes in their behavioral patterns. This project used the stages in a unique way by focusing on caregivers and their readiness to offer vegetables, rather than the child’s readiness to consume vegetables. Critical thinking. Nutrition decisions often involve value-laden choices that are based on conceptually complex information. The process whereby individuals deliberately analyze, synthesize, and evaluate situations before solving everyday problems is known as critical thinking (18,19). Interactive activities using a critical thinking approach help one to clarify and assess personal values, refine reasoning processes, and strengthen the ability to integrate and analyze information. This project focused on assisting clients in making healthy nutrition decisions. PROJECT IMPLEMENTATION: PREPARATION PHASE
1. Institutional Review Board approval The project proposal and data collection tools were submitted to the Iowa State University Institutional Review Board (IRB) for Research with Human Subjects. The project received a full IRB review and was approved on December 13, 2001. This approval was renewed yearly with the final approval obtained on November 15, 2004. The Iowa Department of Public Health (IDPH) and the individual agencies did not require separate ethical clearance in their individual institutions.
2. Selection of agencies and random assignment of intervention
In 2002, WIC services in Iowa were provided by 20 contract agencies. Two agencies shared a dietitian and therefore were considered a single agency for the purpose of this study, making 19 agencies with unique staff. Within an agency, dietitians worked in as many as 10 separate clinics through a monthly rotating schedule. Given the overlap of dietitians across clinics, it was not possible to randomly assign clinics to the intervention. Randomization at the clinic level would have resulted in dietitians carrying out the intervention in some clinics but not in others,
Iowa WIC Program Page 7

creating an ethical dilemma and impractical situation. Therefore, stratification and assignment of the intervention occurred at the agency level. Since Hispanics are the largest minority group served by the Iowa WIC Program, the project also targeted intervention services to this group. Primary language used in the home was used as a proxy measure to categorize the local agencies. Agencies were identified by two characteristics (Table 2):
(1) Percent of all clients who reported speaking Spanish as the primary language in the home (categorized as high Hispanic caseload if greater than 10% and low Hispanic caseload if less than10%)
(2) Presence of EFNEP in the WIC agency service area
Table 2. Stratification of agencies by presence of EFNEP and primary language used in the home
Agencies (#) EFNEP/High Hispanic 3 No EFNEP/High Hispanic 3 EFNEP/Low Hispanic 5 No EFNEP/Low Hispanic 8
After stratifying agencies, one intervention and one control agency were randomly selected from each of the four cells. 3. Selection of participants The participant selection was two-tiered, with selection occurring first at the clinic level and then the individual level. Each agency operated multiple clinics (6 to 21) per month (Table 3). For each selected agency, six clinics were randomly chosen to participate in the study. After the first enrollment wave (December 2002), one agency (E) withdrew from the project because of budget cuts that reduced support personnel. The agency was replaced and six new clinics were chosen. Two of the intervention agencies (EFNEP/Hispanic, No EFNEP/No Hispanic) operated fewer than six clinics because of seasonality of clinic, coordination with other local programs that limited enrollment to only pregnant women, or closing of clinics. In these two agencies, the total number of participants was evenly distributed across their three or four active clinics.
Page 8 Iowa WIC Program

Table 3. Number of clinics available for random selection by agency stratification criteria
Number of clinics in agency Intervention Control EFNEP/Hispanic 6 10/101
No EFNEP/Hispanic 21 8 EFNEP/No Hispanic 12 11 No EFNEP/No Hispanic 6 10
1 One agency withdrew and was replaced after the first enrollment wave.
Participant selection. Finally, 22 mothers and their children were selected per clinic during three 6-month waves of enrollment (June 15, 2002-December 14, 2003). A random selection based on appointment calendars would ignore the walk-ins, who may represent a different type of client. Thus, the strategy used for sampling was a random start based on the appointment calendar with systematic sampling thereafter of all eligible clients (with appointment or walk-ins) until completion. Inclusion criteria included 2-5 year-old WIC participants with no feeding problems (e.g., tube feeding) and whose caregiver agreed to participate. Staff numbered all appointments for the first day of enrollment in each wave (June/December 15) and used a random numbers table to decide on the starting point for each enrollment cycle. All eligible participants who were seen in the clinic after the randomly chosen first participant were invited to participate. If enrollment was not completed in a day, data collection continued in sequential order the next time the clinic was held. Only one child per family was included in the data collection at a time and selection of the included child was based on who was listed first on the appointment schedule. For large clinics, the 22 child quota could be completed in a couple of days. In small clinics, the enrollment process could take all 6 months. The pattern of enrollment was monitored. The smaller clinic sites had difficulty enrolling 22 clients in six months because of infrequent clinic dates (many met only once per month) and small numbers of children 2-5 years of age. When it was unlikely that the clinic would meet the participant quota of 22 by the end of the enrollment wave, the following adjustments were made:
(1) For agencies with other clinics not participating in the study, additional clinic sites were selected according to the original sampling sequence to make up for the enrollment deficiencies of smaller sites. (2) When a newly selected site had a small client base like the original site, enrollment occurred concurrently at both sites until the quota of 22 was reached. If the newly selected site was considerably smaller than the original sites, the remaining enrollments were split evenly across the old and new sites. Random starts were initiated separately for each new clinic.
Iowa WIC Program Page 9

To reduce the data collection burden, staff could count subsequent certification visits towards their enrollment quota during the second and third phases. The final number of clinics that participated in the study was 59 (29 intervention and 30 control clinics). In the WIC clinic, the project was explained by the clerk and eligible caregivers were invited to participate. Those clients who agreed to participate signed a written informed consent form that was available in both English and Spanish. 4. Development of nutrition education modules The topics for the nutrition education modules originated from two sources: previous research and the local WIC and EFNEP personnel. Focus group research on the common barriers to vegetable consumption among Iowan adults (5) as well as the review of published research provided the majority of the themes of the modules. Through brainstorming sessions as well as a contest to solicit educational ideas from WIC and EFNEP staff, the topics were expanded to include serving sizes, vegetable snacks, vegetable variety, and holiday themes, among others. Eleven modules were available at the start of project (June 2002). An additional 31 modules were developed over the two years of the intervention (Table 4). Each module was designed to reflect the information and skill needs of caregivers at different Stages of Change who experienced specific barriers to offering vegetables. To have a manageable number of modules, the pre-action stages of precontemplation and contemplation, and the action stages of action and maintenance were each combined to give three new stages (precontemplation/contemplation, preparation, action/maintenance) for the development of the educational materials. Cognitive strategies such as increasing knowledge, comprehending benefits, and increasing healthy opportunities were incorporated into materials for the pre-action stages of precontemplation/contemplation and preparation stages. Behavioral strategies such as goal setting, enlisting social support, substituting alternatives, and self-monitoring were incorporated into materials for the action/maintenance stage. A variety of materials were reviewed in the development of the module content, including Iowa State University EFNEP vegetable education materials, other on-line materials from university cooperative extension programs, Iowa’s Pick a better snack© social marketing campaign, journal articles, industry nutrition education web sites, WIC Works sharing center, and contest entries from WIC and EFNEP personnel from the intervention agencies. Additionally, materials and information shared in quarterly training sessions via the statewide fiber optics Iowa Communication Network (ICN) provided guidance to the on-going module development. The modules were designed as complete lesson plans that included a lesson guide and, where appropriate, take-home activities for caregivers and children. The module format is shown in Table 5. All modules and materials were translated into Spanish. Module pre-testing. The modules were reviewed by project staff and both the English and Spanish versions of each module were field-tested before distribution to the intervention sites for use. Field tests took place at clinics that were not participating in the study. During the field testing, clients were asked for feedback on clarity and usefulness of the modules. The modules were then revised and reviewed again before distribution to the intervention sites.
Page 10 Iowa WIC Program

Table 4. List of module titles by Stage of Change and barrier
Stages of Change
Barriers Pre-/contemplation Preparation Action/Maintenance Lack of time/inconvenience • Time Savers • Time Savers • Time Savers
• Winter Squash • Winter Squash • Brussels Sprouts and
Cabbage • Brussels Sprouts and
Cabbage • Broccoli and Cauliflower • Broccoli and Cauliflower • Leafy Green Cruciferous
Vegetables • Leafy Green Cruciferous
Vegetables
Don’t know how to prepare
• Summer Vegetables • Summer Vegetables • Health Benefits • Health Benefits Child doesn’t like them • Picky Eaters • Picky Eaters • Child Resistance
Don’t know health benefits for children
• Health Benefits • Health Benefits • Health Benefits
No access to vegetables • Growing vegetables Too expensive • Affordable Veggies • Affordable Veggies • Affordable Veggies Other family members do not like them
• Family Resistance • Family Resistance • Family Resistance
No specific barrier • Serving Sizes • Serving Sizes • Serving Sizes • Vegetable Snacks • Vegetable Snacks • Vegetable Variety (book)
• Color Variety • Vegetable Variety (book) • Vegetable Variety
• Thanksgiving • Thanksgiving • Winter Holiday Season • Winter Holiday Season
(general education)
• Recipe Contest
Iowa WIC Program Page 11

Table 5. Module format
Module Title
Stage Indicates the caregiver’s stage of readiness to offer vegetables to his/her child. The stages include Precontemplation/Contemplation, Preparation, and Action/Maintenance.
Take-home activity
Provides prompts for completing the lesson and may include instructions for any take-home activity associated with the module.
Barrier Indicates the specific barrier addressed by the lesson.
Objective Indicates what the nutrition education message(s) contained in the lesson plan aimed to accomplish.
Materials
• Bulleted list of materials needed to successfully complete the module.
• Take-home materials and activities for the module.
• A materials list is provided if the module requires food or other items.
Introduction and other bolded titles
Provides prompts for “teaching” the lesson. Bullets, dashes, and italicized fonts are used. Their meanings are provided below:
• Bulleted prompts are suggested questions to ask.
− Dashed prompts are suggested information to provide
Italicized text provides directions to the educator.
Page 12 Iowa WIC Program

5. Development of research data collection tools Forms and questionnaires developed for the project are presented in Table 6 (Appendix B). With the exception of the staff questionnaire, clinic observation form, and participant enrollment log, forms were available in both English and Spanish forms. The forms were field-tested as described previously.
Table 6. Research data collection tools
Data tool Information collected Informed consent − Consent to participate in study (participants and staff) Participant enrollment log (WIC)
− List of WIC clients eligible for participation in the project according to sampling procedures and participant selection criteria
− Appointment classification of clients invited to participate (walk-ins, scheduled appointments, cancelled appointment)
− Response of clients to invitation to participate (accept or refuse) − Date of participant recruitment into study
Record of module utilization (EFNEP)
− Module use with EFNEP participants (which module was used, how often, and with what audience)
Screening tool − Caregiver self report on usual number of times a day vegetables are offered to the child
− Caregiver intentions to offer vegetables three times a day − Caregiver “stage” based on intention to offer vegetables − Caregiver barriers to offering vegetables (intervention forms on ly) − Nutrition education module number (intervention forms only)
Additional caregiver questionnaire
− Relationship and caregiver classific ation of person at WIC clinic
− Place of birth of primary caregiver − Number of children under the care of the primary caregiver
Caregivers’ KAP (knowledge, attitudes, practices) questionnaire
− ded servings of Knowledge about offering children vegetables, recommenvegetables for children, and health benefits of vegetables
− Attitudes about vegetables in children’s diets − Practices related to offering child ren vegetables − Household vegetable inventory
WIC/EFNEP/FNP staff questionnaire
− ded servings of vegetables
Knowledge about offering children vegetables, recommenvegetables for children, and health benefits of
− Attitudes about vegetables in children’s diets Attitudes about dif− ferent nutrition education approaches for increasing vegetable intakes
Structured clinic observation form
− e or nutrition or vegetable Clinic environment (e.g., presence or absencrelated visuals, literature or child activities)
− Length of time of certification, and nutrition educ ation contact sessions − Kinds of materials used for education sessions − Level of interaction during the education session
Nutrition education time study (WIC)
− Time spent on nutrition education during certific ation and second
Incentive surveys (WIC) − Type of incentives for nutrition education used − Perception of effectiveness of incentives
Iowa WIC Program Page 13

The screening tool was adapted from a previously validated algorithm for identifying stage of change related to vegetable consumption in young adults (20). Adaptations included using the number of times of offering of vegetables as a way to measure readiness for change in serving vegetable to children (21).
Socioeconomic, demographic, and anthropometric data were also obtained from the Iowa WIC Program electronic database and additional dietary and health information was extracted from client files at the individual agency sites. The data collection is discussed in a later section, Project Implementation: Delivery Phase.
6. Training regimens The staff members in the intervention and control agencies were trained separately. The intervention agency staff participated in a two-day pre-project training session April 16-17, 2002 in Ames, Iowa to learn to use the research tools and the educational materials. Hands-on learning opportunities were provided with the prototype nutrition education modules with time for discussion, questions, and feedback. This initial training session was attended by a total of 41 WIC dietitians, EFNEP program assistants, project steering committee members, and state agency personnel from both programs. Periodic training sessions were provided for staff in the intervention agencies from implementation until the end of the project period (Table 7). These sessions were presented via the ICN and included at least one hour of continuing education on a topic related to the project and provided by local professionals. The second hour of each session was devoted to review of data collection procedures, project updates, introduction of new modules, and feedback activities with discussion and sharing between the distance learning sites. These training sessions were valuable “booster shots” for intervention personnel and helped sustain their enthusiasm and interest in the project. It also helped personnel transfer their knowledge about the theoretical models used in the project to improve their daily counseling skills. The evaluations for each session were positive. The feedback activities successfully generated discussion and sharing between the sites.
Table 7. Follow-up sessions provided for intervention staff
Date Session topic Attendance9/30/02 Brief counseling techniques in nutrition education 37 1/31/03 Using the critical thinking model 44 4/25/03 Cost-effectiveness evaluation strategies 32 9/26/03 Planning successful nutrition demos & tastings 31 2/27/04 Using multi-channel social marketing interventions to reach low
income audiences with nutrition education 29
9/20/04 Using Stages of Change criteria & critical thinking skills to teach about vegetables: Preliminary project data
28
Page 14 Iowa WIC Program

During May, 2002, staff in the control agencies received training on the use of the data collection procedures through a session on the ICN or through a face-to-face training session if the staff were unable to attend the ICN. Follow-up sessions with the control agency staff took place twice (Table 8).
Table 8. Follow-up sessions provided for control staff
Date Session topic Attendance
10/24/03 The Food Guide Pyramid: What’s in the future? 34 9/20/04 Using Stages of Change criteria & critical thinking skills to
teach about vegetables: Preliminary project data 6
7. Other communication strategies
A fact sheet, “FAQs about Participant Selection and Other Issues,” was distributed to control and intervention WIC agencies approximately two weeks before participants were enrolled into the project. This fact sheet provided answers to questions that agency personnel raised about participant enrollment, follow-up, data collection, and other issues. Periodically, a newsletter (Veggie Grant Update) was distributed to control and intervention WIC agencies and local EFNEP/FNP projects as an e-mail attachment. The newsletter was distributed as needed to communicate information about the project and to remind staff about data collection procedures. Five newsletters were sent during the two-year data collection period. E-mail distribution lists were also used to communicate time-sensitive information to the control and intervention WIC agencies. Almost all of these messages addressed data collection issues discovered during data extraction visits to the local WIC agencies. The project steering committee employed several strategies for regular communication, including twice-a-month electronic progress reports, monthly conference calls, quarterly face-to-face meetings, and frequent e-mail and telephone communication.
PROJECT IMPLEMENTATION: DELIVERY PHASE
1. Promotion of a veggie-friendly clinic environment A variety of print and other materials promoting vegetables were purchased and provided to the intervention WIC and EFNEP programs to use in their nutrition education activities and to decorate their clinic space. These materials included posters, food models (paper and three-dimensional models), puzzles, placemats, children’s books, felt board cut-outs, bulletin board supplies, and vegetable stickers. The colorful materials reinforced the nutrition education messages provided in the intervention modules.
Iowa WIC Program Page 15

2. Intervention sequence Each staff member involved in data collection for the project received a step-by-step written protocol for the project tasks for their reference and use. Enrollment. Support staff recorded demographic data for all invited participants on the Participant Enrollment Log. Consenting clients gave informed consent for themselves and their children. All WIC identification folders and WIC records were identified by a vegetable sticker and a unique code was entered in the state electronic data system to identify project participants. Core data collection sequence. Data were collected by the WIC and EFNEP staff as well as directly by ISU staff to document the research outcomes. At each certification visit, WIC support staff completed the Additional Caregiver Questionnaire through an in-person interview, caregivers completed the Caregivers’ Knowledge-Attitude-Practices Questionnaire (with staff assistance as required) and dietitians completed the screening (staging with barrier identification) tool. These three forms were filed in the participant’s agency record and retrieved at the time of data extraction. Staging and barrier identification. The dietitians administered the screening tool to stage the caregiver’s willingness to offer vegetables. Staging began with the question, “How many times a day do you usually offer vegetables to your child?” If the response to this question was 0, 1 or 2, the next question asked was “Do you intend to start offering your child vegetables at least 3 times/day within the next 30 days to six months?” If the response to the first question was 3 or more, the next question asked was “Have you been offering your child vegetables at least 3 times/day for more than 6 months?” The client’s response determined the stage as shown in Table 9.
Table 9. Staging criteria based on caregiver’s present behavior and intentions
If the client … Then the client is staged as… Has no immediate plans to offer vegetables 3+ times/day Precontemplation/contemplation Plans to start offering vegetables 3+ times/day within next 30 days Preparation Already offers vegetables 3+ times/day Action/maintenance
Through dialogue, the dietitian identified and prioritized the barriers to offering vegetables that the caregiver faced, and then chose a module that corresponded to the client’s stage and barrier. Another module was selected for the participant’s scheduled second education contact. The data collection sequence was repeated each time the client returned for certification into the program. Time allocation data. Dietitians completed the standard WIC time allocation form to help estimate the cost of the intervention for the cost-effectiveness analysis. This form was filled out once in 2003. Three of the four intervention agencies and five dietitians (19% response rate) recorded time spent on certification and second education sessions for project and non-project clients. Data were collected on a total of 15 general certifications, 19 intervention
Page 16 Iowa WIC Program

certifications, 5 general second education contacts, and 25 intervention second education contacts. The time allocations were compared to FY 2001 data from the WIC Nutrition Education Time Study. WIC Farmers’ Market Nutrition Program data. WIC Farmers’ Market Nutrition Program (FMNP) check registers from 2003 were matched with the participant identification numbers to identify check numbers issued to project participants. Claimed check numbers were compared to the list of redeemed checks to determine those that had been used to purchase produce at farmers’ markets throughout the state. Supplemental research data. Supplemental information was collected about the staff and the clinic environment. These included the following:
(1) A self-administered questionnaire on knowledge and attitudes about vegetables was completed by WIC and EFNEP nutrition staff pre- and post-intervention. (2) A structured clinic observation form was used to document clinic visits. ISU staff randomly selected from each agency (n=14) clinics to visit before initiating the intervention and (n=15) clinics to visit after the first year. The 2 to 3 hour observation was scheduled with the clinic personnel. During this time, visual cues about vegetables that were displayed in the clinics (e.g., posters, puzzles, informative brochures) and dietitian-client interactions during nutrition education sessions were noted. (3) EFNEP personnel maintained continual records of module use with their clients using the EFNEP module use log form.
3. Data extraction
Data extractions were completed by ISU or local WIC staff members after enrollment quotas were met for each enrollment wave. Completed project questionnaires were recovered from the participants’ agency file. Additional information was extracted from the WIC forms that was not entered in the WIC electronic data base. Extraction protocol. Data extraction forms were developed for recording information from the WIC child diet and health history and household documentation forms. An extraction checklist was prepared for each clinic with enrolled participants. The checklist contained identification information (obtained from the enrollment logs) for each person enrolled and a list of all the forms and information that needed to be obtained from the participant’s records. Labels were also printed with the identification information (family and participant identification number, child’s name, and clinic number) for each participant. The labels were a time saving measure and were affixed to the data extraction forms to avoid having to write out the child’s identification during the extractions. For the three agencies that agreed to do their own record extractions (three agencies for enrollment waves 1 and 2 and one agency for wave 3), a “protocol for extractions” document was developed. Extraction checklists for each clinic and enrollment wave, and the protocol for extractions were sent to the WIC Coordinators. The extractions involved removing project forms from participant files and photocopying relevant sections of the WIC
Iowa WIC Program Page 17

certification form (PATH Input form), child diet and health histories, and household information documentation forms. The forms were bound separately for each site and each wave and mailed to ISU.
4. Incentives for nutrition education Each of the intervention WIC agencies received funds to purchase incentives for project participants. Small items were provided to reinforce the nutrition education message or to reward caregivers and children for returning the take-home activities at the next visit. Recommended purchases were small kitchen utensils used to prepare vegetables including vegetable peelers, cutting boards, steamer baskets, colanders and other items. Incentives were used judiciously in this project and only when directly related to the content of the nutrition education module. Survey on incentive use. Dietitians at control and intervention sites received a survey by mail in which they were asked to list the types of incentives they were currently using and how they were being used (for intervention clinics, this referred to the specific module with which they used the incentive). To measure the perceived effectiveness of each type of incentive, intervention dietitians were asked to rank the incentives for usefulness for reinforcing the educational message and appeal to WIC participants (ranking from poor, average, to excellent). Control site dietitians ranked the client’s receptiveness to the incentive (very receptive, somewhat receptive, indifferent). Thirteen intervention and 12 control agency dietitians responded to the incentive survey (50% and 52% response rate, respectively). There was a wide variety of incentives used by the intervention agencies. These included certificates, chopping boards, colanders, vegetable peelers, steamers, measuring cups and spoons, vegetable-design towels, recipe books and cards, coloring books, stickers, Beanie Babies®, tote bags, and grocery store gift certificates. Although the project emphasized the use of incentives solely to reinforce educational messages of specific modules, the incentives were used more widely. Most dietitians reported that the incentives were used routinely rather than used with a specific module in which the educational activity required an incentive (e.g., reaching a goal). Chopping boards, colanders, vegetable peelers, and food were offered by at least 45% of dietitians. The incentives with the highest appeal to the participants were chopping boards, stickers, and food. Stickers, food, chopping boards, and recipe books were perceived by dietitians to be the most useful for reinforcing the nutrition education messages. Selected comments from the surveys completed by intervention agency dietitians follow:
We have given incentives for enrollment as a "thank you" and at each nutrition education visit (usually Beanie Babies®). We give a choice among the kitchen tools/supplies and the participants like that, we started using them as rewards for clients’ actions, now we are using them to help clients utilize more vegetables. They really like the recipes and the gifts. Anything to help them make preparation easy and enjoyable.
Page 18 Iowa WIC Program
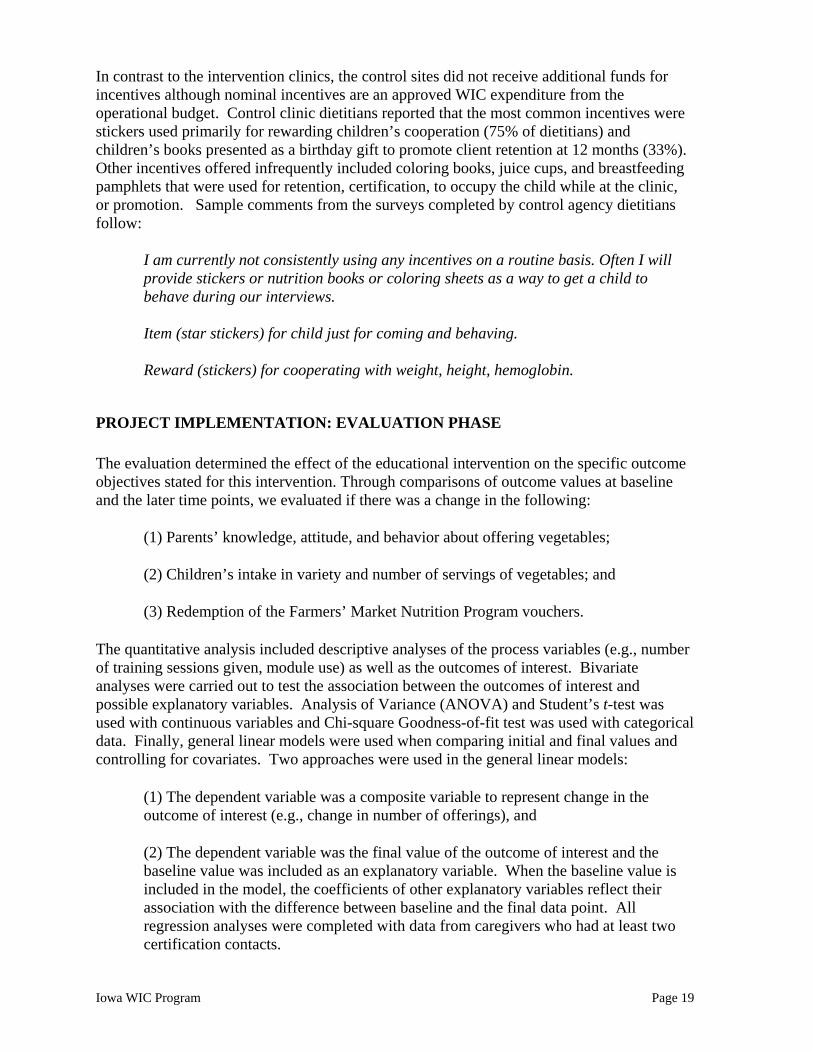
In contrast to the intervention clinics, the control sites did not receive additional funds for incentives although nominal incentives are an approved WIC expenditure from the operational budget. Control clinic dietitians reported that the most common incentives were stickers used primarily for rewarding children’s cooperation (75% of dietitians) and children’s books presented as a birthday gift to promote client retention at 12 months (33%). Other incentives offered infrequently included coloring books, juice cups, and breastfeeding pamphlets that were used for retention, certification, to occupy the child while at the clinic, or promotion. Sample comments from the surveys completed by control agency dietitians follow:
I am currently not consistently using any incentives on a routine basis. Often I will provide stickers or nutrition books or coloring sheets as a way to get a child to behave during our interviews.
Item (star stickers) for child just for coming and behaving. Reward (stickers) for cooperating with weight, height, hemoglobin.
PROJECT IMPLEMENTATION: EVALUATION PHASE The evaluation determined the effect of the educational intervention on the specific outcome objectives stated for this intervention. Through comparisons of outcome values at baseline and the later time points, we evaluated if there was a change in the following: (1) Parents’ knowledge, attitude, and behavior about offering vegetables; (2) Children’s intake in variety and number of servings of vegetables; and (3) Redemption of the Farmers’ Market Nutrition Program vouchers. The quantitative analysis included descriptive analyses of the process variables (e.g., number of training sessions given, module use) as well as the outcomes of interest. Bivariate analyses were carried out to test the association between the outcomes of interest and possible explanatory variables. Analysis of Variance (ANOVA) and Student’s t-test was used with continuous variables and Chi-square Goodness-of-fit test was used with categorical data. Finally, general linear models were used when comparing initial and final values and controlling for covariates. Two approaches were used in the general linear models:
(1) The dependent variable was a composite variable to represent change in the outcome of interest (e.g., change in number of offerings), and (2) The dependent variable was the final value of the outcome of interest and the baseline value was included as an explanatory variable. When the baseline value is included in the model, the coefficients of other explanatory variables reflect their association with the difference between baseline and the final data point. All regression analyses were completed with data from caregivers who had at least two certification contacts.
Iowa WIC Program Page 19
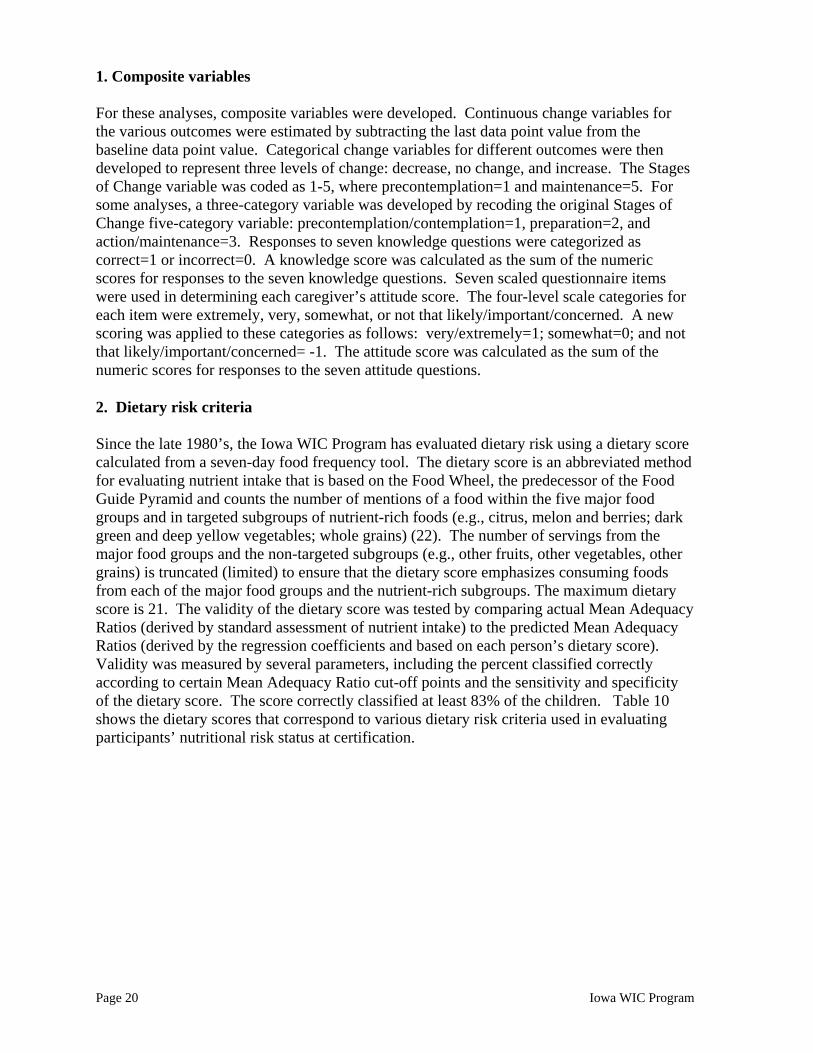
1. Composite variables For these analyses, composite variables were developed. Continuous change variables for the various outcomes were estimated by subtracting the last data point value from the baseline data point value. Categorical change variables for different outcomes were then developed to represent three levels of change: decrease, no change, and increase. The Stages of Change variable was coded as 1-5, where precontemplation=1 and maintenance=5. For some analyses, a three-category variable was developed by recoding the original Stages of Change five-category variable: precontemplation/contemplation=1, preparation=2, and action/maintenance=3. Responses to seven knowledge questions were categorized as correct=1 or incorrect=0. A knowledge score was calculated as the sum of the numeric scores for responses to the seven knowledge questions. Seven scaled questionnaire items were used in determining each caregiver’s attitude score. The four-level scale categories for each item were extremely, very, somewhat, or not that likely/important/concerned. A new scoring was applied to these categories as follows: very/extremely=1; somewhat=0; and not that likely/important/concerned= -1. The attitude score was calculated as the sum of the numeric scores for responses to the seven attitude questions. 2. Dietary risk criteria Since the late 1980’s, the Iowa WIC Program has evaluated dietary risk using a dietary score calculated from a seven-day food frequency tool. The dietary score is an abbreviated method for evaluating nutrient intake that is based on the Food Wheel, the predecessor of the Food Guide Pyramid and counts the number of mentions of a food within the five major food groups and in targeted subgroups of nutrient-rich foods (e.g., citrus, melon and berries; dark green and deep yellow vegetables; whole grains) (22). The number of servings from the major food groups and the non-targeted subgroups (e.g., other fruits, other vegetables, other grains) is truncated (limited) to ensure that the dietary score emphasizes consuming foods from each of the major food groups and the nutrient-rich subgroups. The maximum dietary score is 21. The validity of the dietary score was tested by comparing actual Mean Adequacy Ratios (derived by standard assessment of nutrient intake) to the predicted Mean Adequacy Ratios (derived by the regression coefficients and based on each person’s dietary score). Validity was measured by several parameters, including the percent classified correctly according to certain Mean Adequacy Ratio cut-off points and the sensitivity and specificity of the dietary score. The score correctly classified at least 83% of the children. Table 10 shows the dietary scores that correspond to various dietary risk criteria used in evaluating participants’ nutritional risk status at certification.
Page 20 Iowa WIC Program

Table 10. Dietary risk criteria and associated dietary scores
for children 2-5 years old
Dietary Score Dietary risk criteria 2-3 y olds 4 y olds
≤80% of RDA for sum of 11 nutrients1 ≤8 ≤7 ≤80% of RDA for sum of 5 nutrients2 ≤10 ≤9 <100% of RDA for sum of 11 nutrients1 ≤15 ≤15
1Protein, calcium, iron, magnesium, phosphorus, thiamin, riboflavin, and vitamins A, C, B-6, and B-12 2Calcium, magnesium, iron, and vitamins A and C
PROJECT IMPACT: THE RESULTS 1. Sample Data from the participant enrollment logs are summarized in Figure 1. Walk-ins accounted for only 2% of those clients who were invited to participate. Those classified as ineligible included cases where there was a language barrier (foreign languages other than Spanish), the caregiver did not meet income eligibility for WIC, or the child had feeding problems (not consuming table foods, tube-fed). The overall acceptance rate for participation was approximately 61%, and varied by agency as shown in Table 11. Acceptance rates were significantly higher among the control sites as compared to the intervention sites (p<0.0001).
Table 11. Participation acceptance rates of agencies by stratification criteria
Intervention sites Control sites
Agency Acceptance (%)
Agency Acceptance (%)
EFNEP/High Hispanic A 61.6 E/F1 58.9/84.4 No EFNEP/High Hispanic B 55.7 G 59.3 EFNEP/Low Hispanic C 73.9 H 64.8 No EFNEP/Low Hispanic D 43.2 I 75.8 TOTAL 55.7 68.32
1 Agency E withdrew and was replaced with F after the first enrollment wave. 2 Intervention vs. Control: Chi-square= 58.9; P<0.0001
Iowa WIC Program Page 21

The baseline sample was 2088 (intervention =1083; control =1005) caregiver-child pairs. The “loss to follow-up” included approximately 20% of the children who reached 5 years of age between each data collection time point and were no longer eligible for the WIC program. In addition, one agency withdrew from the study after the first wave of enrollment and 104 of their clients were lost to follow-up. Other reasons for sample loss included failure to return for certification, out-migration from the service area, and participant refusal to continue in study. Data were not available to determine exact proportions for these last categories of losses.
Page 22 Iowa WIC Program

Figure 1. Enrollment and loss to follow-up based on enrollment logs*
No show/cancellations n=1421
(I=959; C=462) Appointments/walk-ins
n=3649 (I=2005; C=1644)
Eligible but not offered n=41
(I=2; C=39) Eligible and offered
n=3569 (I=1968; C=1601)
Refused n=1380
(I=872; C=508)
(I=
2 c
3 c
4 c
Loss to follow-up n=1110
Loss to follow-up n=214
Loss to follow-up n=681
Total logged n=5070
(I=2964; C=2106)
*Does not reflect the number of participants wn = sample size I = intervention C =control
Iowa WIC Program
Accepted n=2189
1096; C=1093)
Unavailable clinic recordsn=101 (I=13: C=88)
(
i
Total baseline Sample n=2088 I=1083; C=1005)
ertification contacts n=978
(I=428; C=550)
ertification contacts n=297
(I=104; C=193)
ertification contacts n=83
(I=20; C=63)
th complete data sets
Ineligible n=39
(I=35; C=4)
Page 23

2. Baseline characteristics of sample Child and household characteristics. The children at baseline were just over 3 years of age; children from control clinics were about 2 months older than those from intervention clinics (P=0.002; Table 12). Although the intervention was targeted for 2-4 year olds, eight children were enrolled prior to their second birthday; the youngest child was 20.6 months old. The intervention clinics had a higher percentage of children from minority backgrounds than control clinics (P<0.001; Table 12). There was no significant difference between intervention and control groups with respect to children’s reported diet. Although household size, language spoken at home, and caregivers’ education were similar, household income was significantly higher among the control group as compared to the intervention group (P<0.05; Table 12). Over 60% of the children’s households participated in income, insurance, and other food assistance programs besides WIC; use was higher among the control group (P<0.01; Table 12). Only one participant was homeless. Caregiver characteristics. Caregivers who attended the WIC clinic with the child were almost always the child’s mother; less than 10% of children were accompanied by their father, another relative, or a non-relative (Table 13). The majority of mothers (85%) indicated that they were the primary caregiver (defined as >50% of child care responsibilities). The mean age of caregivers was just under 30 years old and there were no significant group differences in age. Most of the caregivers were born in the United States; however, there tended to be more intervention than control caregivers who reported being born in a Spanish-speaking country (P<0.10; Table 13). The majority (80%) of all caregivers born in a Spanish-speaking country were from Mexico. Less than one-third of caregivers were WIC participants themselves and more mothers in the control group were WIC participants than mothers in the intervention group (P<0.10; Table 13). In contrast to maternal WIC participation, significantly more intervention than control caregivers (P<0.01; Table 13) were involved with Expanded Food and Nutrition Education Program (EFNEP) or the Family Nutrition Program (FNP); the overall rate was only about 5%. Stage of Change. The majority of caregivers reported offering vegetables to their child twice a day; there was no significant group difference in the frequency with which they offered vegetables. There was a significant difference between control and intervention caregivers’ Stages of Change status with respect to the intention to offer vegetables at least three times a day (P<0.001). More control caregivers were in the precontemplation stage while there were more intervention caregivers in the preparation stage.
Page 24 Iowa WIC Program

Table 12. Baseline demographic and household characteristics of study WIC children1
Characteristics Intervention Control Total P-value2
Child Age (mo) 40.51 ± 0.33 (966)3 42.02± 0.35 (831) 41.20 ± 0.24 (1797) 0.002Sex (%) 0.829 Male 49.10 (474)4 49.58 (412) 49.30 (886) Female 50.90 (492) 50.42 (419) 50.70 (911)Ethnicity (%) <0.001 White 73.50 (710) 84.00 (698) 78.35 (1408) Hispanic 15.01 (145) 10.71 (89) 13.02 (234) Black 8.70 (84) 4.00 (33) 6.51 (117) Other 2.79 (27) 1.29 (11) 2.12 (38)Diet score (0-21) 12.99 ± 0.13 (793) 12.76 ± 0.15 (723) 12.88 ± 0.10 (1516) 0.240
Household Caregiver’s education (y) 11.99 ± 0.08 (871) 11.88 ± 0.08 (812) 11.94 ± 0.06 (1683) 0.325Household size (#) 4.13 ± 0.05 (966) 4.11 ± 0.05 (831) 4.12 ± 0.03 (1797) 0.741Monthly income ($) 1374.9 ± 28.91
(966) 1460.0 ± 30.30
(831)1414.04 ± 20.94
(1797)0.043
Primary language (%) 0.763 English 89.13 (861) 90.61 (753) 89.82 (1614) Spanish 9.73 (94) 8.54 (71) 9.19 (165) Other 1.14 (11) 0.85 (7) 0.99 (18)Used ≥1 assistance program (%) 586 (60.66) 557 (67.03) 1143 (63.61) 0.005 Medicaid 566 (58.59) 508 (61.13) 1074 (59.77) Food Stamps 180( 18.63) 224 (27.00) 404 (22.48) Family Investment Program 122 (12.63) 131 (15.76) 253 (14.08) Head Start 25 (2.59) 43 (5.17) 68 (3.78) Other5 33 (3.42) 64 (7.7) 97 (5.40)
1 Comparison between intervention and control groups using Student’s t-test or Chi-square Goodness-of-Fit 2Available sample for each variable is shown in parentheses. Data extracted from WIC state data recorded on PATH Input Form 3Mean ± SEM (n) 4 % (n) 5Other programs included Child Health (Title V), Family Investment Program (TANF), child health specialty clinics, hawk-i (state child health insurance program), Area Education Agency, other local assistance programs
Iowa WIC Program Page 25

Table 13. Baseline caregivers demographic characteristics and Stages of Change for intentions to offer vegetables three times a day
Caregiver characteristics Intervention Control Total P-value1
Relationship to WIC child (n=1689) Mother 830(92.73)2 720(91.84) 1550(91.77) 0.448 Father 32(3.58) 34(4.34) 66(3.91) Other relative 26(2.91) 30(3.83) 56(3.32) Other non-relative 7(0.78) 10(1.28) 17(1.01)Age (y) (n=1174) 28.49 ± 0.26
(542)328.86 ± 0.25
(632)28.69 ± 0.18
(1174) 0.307
Place of birth (n=1678) 0.150 United States 765(86.15) 705(89.24) 1470(87.60) Spanish-speaking country 96(10.81) 68(8.61) 164(9.77) Other 27(3.04) 17(2.15) 44(2.62)Current WIC participant (n=1678) 226(25.57) 231(29.32) 457(27.23) 0.086EFNEP/FNP participant (n=1661) 53(6.53) 22(2.93) 75(4.52) 0.001Usual number of times/day vegetables offered to child
0.945
0 8(0.89) 6(0.77) 14(0.83) 1 195(21.73) 165(21.37) 360(21.58) 2 474(52.90) 403(52.20) 877(52.57) 3+ 219(24.44) 198(25.64) 417(25.00)Stage of Change <0.001 Precontemplation 127(14.32) 204(26.74) 331(20.06) Contemplation 178(20.07) 182(23.85) 360(21.81) Preparation 365(41.15) 186(24.38) 551(33.39) Action 24(2.71) 10(1.31) 34(2.06) Maintenance 193(21.76) 181(23.72) 374(22.67)1Comparison between intervention and control groups using Student’s t-test or Chi-square Goodness-of-Fit 2 n (%) 3 Mean ± SEM
Children’s meal pattern and vegetable consumption. The children’s meal pattern was three meals and two snacks a day with control children consuming slightly more snacks than children from intervention clinics (Table 14). More than 50% of all children ate at least one meal away from home per week. Significantly more control than intervention children ate at least one meal away from home per week (P<0.001). Among these children, the most common place to eat was the grandparent’s home followed by the babysitter’s home. Intervention children were significantly more likely than controls to eat at childcare settings. Children from control clinics ate vegetables more frequently than those from intervention clinics; but intervention children ate a wider variety of vegetables. There was no group difference in the consumption pattern for vegetable snacks; at least 50% of all caregivers reported offering their children vegetable snacks at least once a day.
Page 26 Iowa WIC Program

Table 14. Children’s baseline meal pattern and consumption of vegetables
as reported by caregivers
Meal characteristic Intervention Control Total P-value1
Meals per day (#) 3.04 ± 0.0222 (898) 3.09 ± 0.02 (785) 3.07 ± 0.01 (1683) 0.045 Snacks per day (#) 2.33 ± 0.03 (881) 2.44 ± 0.03 (764) 2.38 ± 0.02 (1645) 0.013 At least one meal away from home per week
436(51.11) 3 485 (63.15) 921 (56.82) <0.001
Meals away from home (#/wk) 2.4 ± 0.12 (853) 2.75 ± 0.13 (768) 2.56 ± 0.09 (1621) 0.044 Place ate away from home Babysitters 91 (10.68) 137 (18.90) 228 (14.14) 0.0074
Grandparents 161 (26.25) 200 (18.90) 361 (22.37) 0.143 Childcare 95 (11.15) 74 (9.72) 169 (10.48) 0.013 Head start 49 (5.75) 49 (6.44) 98 (6.08) 0.621 Other5 106 (11.73) 100(13.93) 206 (12.76) 0.798 Times vegetables consumed (#/d) 2.06 ± 0.04 (849) 2.18 ± 0.04 (765) 2.11 ± 0.03 (1614) 0.022 Different vegetables consumed (#/wk) 6.91 ± 0.10 (863) 6.61 ± 0.10 (773) 6.77 ± 0.07 (1636) 0.037 Frequency of offering child vegetable snacks
0.629
At least once daily 496 (55.36) 422 (54.03) 918 (54.74) At least 3 times a week 257 (28.68) 238 (30.47) 495 (29.52) Once a week or less 93 (10.38) 86 (11.01) 179 (10.67) Hardly ever 50 (5.58) 35 (4.48) 85 (5.07) 1Comparison between intervention and control groups using Student’s t-test or Chi-square Goodness-of-Fit 2Mean ± SEM (n) 3 % (n) 4Only data from children who ate a meal away from home were included in the intervention-control comparisons 5Other places included restaurants, fast food places, relatives’ homes, school, church and friends’ homes
Caregivers’ barriers by Stages of Change status in the intervention clinics. Over 75% of intervention caregivers reported at least one barrier to offering vegetables (Table 15). Caregivers in the action/maintenance (AM) stage were the least likely to report having barriers to offering vegetables. The most common barrier to offering vegetables across the three stages was “the child doesn’t like vegetables” and the least common barrier was “don’t have a way to get vegetables.” In general, caregivers in the preparation stage reported fewer barriers than those in the precontemplation/contemplation stage. Similarly, caregivers in the action/maintenance stage reported fewer barriers than those in the preparation stage.
Iowa WIC Program Page 27

Table 15. Intervention caregivers’ barriers to offering vegetables by their Stage of Change at baseline
Stage1
Barrier PC(n=691) P (n=551) AM (408) Total (n=1650) P-value2
No barrier 60(8.68)3 169(30.67) 141(34.56) 370(22.42) <0.001
Lack of time 38(5.50) 15(2.17) 7(1.72) 60(3.64) 0.002
Inconvenience 21(3.04) 7(1.01) 5(1.23) 33(2.00) 0.038
Lack of preparation knowledge 30(4.34) 23(3.33) 5(1.23) 58(3.52) 0.015
Child doesn’t like vegetables 130(18.81) 108(15.63) 40(9.80) 278(16.85) <0.001
Don’t know about child benefits 44(6.37) 24(3.47) 9(2.21) 77(4.67) 0.006
Don’t have a way to get vegetables
9(1.30) 7(1.01) 5(1.23) 21(1.27) 0.994
Too expensive 24(3.47) 36(5.21) 11(2.70) 81(4.91) 0.006
Other family members don’t like vegetables
18(2.60) 16(2.32) 6(1.47) 40(2.42) 0.333
Other2 50(7.24) 24(3.47) 12(2.94) 86(5.21) 0.0051 PC=precontemplation/contemplation ; P=preparation; AM=action/maintenance 2 Comparison between intervention and control groups using Chi-square Goodness-of-Fit 3 n (%)
Attitudes about offering vegetables to children. Intervention caregivers tended to have a higher (more positive) attitude score than control caregivers (P=0.05; Table 16). Individual attitude items were similar for the two groups with the exception of intervention caregivers reporting more often that they were likely to offer their children a new vegetable within the next 6 months. While most caregivers indicated that it would be very or extremely important to offer vegetables to children at meal times and for their friends to find ways to offer children vegetables, they were less inclined to think that their friends would choose to buy vegetables if money for groceries was limited.
Page 28 Iowa WIC Program

Table 16. Intervention and control caregivers’ attitudes about offering vegetables to 2- to 5-y-old children at baseline
Attitude Intervention Control Total P-value1
Importance of finding ways to offer children vegetables:
0.902
Very-extremely important 784(89.09) 2 693(89.08) 1477(89.08) Somewhat important 90(10.23) 81(10.41) 171(10.31) Not that important 6(0.68) 4(0.51) 10(0.60)Likelihood of buying vegetables when money is limited:
0.480
Very-extremely likely 403(47.52) 328(44.93) 731(46.32) Somewhat likely 293(34.55) 273(37.40) 566(35.87) Not that likely 152(17.93) 129(17.67) 281(17.81)Importance of offering children vegetables at meal times:
0.585
Very-extremely important 857(95.33) 757(96.07) 1614(95.67) Somewhat important 39(4.34) 30(3.81) 69(4.09) Not that important 3(0.33) 1(0.13) 4(0.24)Concern about children not eating vegetables offered at meal times:
0.653
Very-extremely concerned 560(62.43) 486(62.15) 1046(62.30) Somewhat concerned 318(35.45) 274(35.04) 592(35.26) Not that concerned 19(2.12) 22(2.81) 41(2.44)Importance of children trying different types of vegetables:
0.135
Very-extremely important 626(70.66) 520(66.84) 1146(68.87) Somewhat important 251(28.33) 244(31.36) 495(29.75) Not that important 9(1.02) 14(1.80) 23(1.38)Likelihood of offering child a new vegetable within the next month:
0.336
Very-extremely likely 360(52.27) 438(48.58) 798(50.54) Somewhat likely 310(38.54) 323(41.84) 633(40.09) Not that likely 7(9.19) 77(9.58) 148(9.37)Likelihood of offering child a new vegetable within the next 6 months:
0.054
Very-extremely likely 504(60.94) 405(55.33) 909(58.31) Somewhat likely 287(35.70) 283(38.66) 570(36.56) Not that likely 36(4.35) 44(6.01) 80(5.13)Attitude score 3,4 4.49 ± 0.07 (745) 4.28 ± 0.08 (656) 4.40 ± 0.06 (1401) 0.0561 Comparison between intervention and control groups using Chi-square Goodness-of-Fit or Student’s t-test 2 n (%) 3 Mean ± SEM 4 A numeric score was applied to each of the seven attitude questions: 1=very/extremely important; 0=somewhat important; -1=not that important. The attitude score was calculated as the sum of the numeric scores for caregivers’ responses to the seven attitude questions; range was -5 to 7.
Iowa WIC Program Page 29

Caregivers’ knowledge about vegetables. Less than 50% of caregivers knew the recommended number of vegetable servings per day for children (Table 17). Even fewer knew that children need multiple exposures to a new food before they will accept it; however, more intervention than control caregivers responded correctly to this question (P=0.001). The majority of caregivers indicated that the best response to a child who refused to eat vegetables at meals would be to model the behavior by eating some of the vegetables themselves and coaxing the child to try a little. Caregivers were generally knowledgeable about the health benefits of vegetables and correctly answered a mean of four out of five knowledge questions related to the health benefits of vegetables.
Table 17. Intervention and control caregivers’ vegetable related knowledge at baseline
Was knowledgeable about… Intervention Control Total P-value1
Recommended number of vegetable servings for children
387(43.43)2 320(41.03) 707(42.31) 0.320
Repeated offerings needed for new food 225(25.37) 151(19.33) 376(22.54) 0.001Best response to a child who refuses to eat vegetables at a meal
0.126
Hold back dessert 121(13.92) 105(13.71) 226(13.82) Child should remain at the table until vegetables are consumed
16(1.84) 31(4.05) 47(2.88)
Model desired behavior for the child 645(74.22) 555(72.45) 1200(73.39) Spoon feed child with the vegetables 27(3.11) 25(3.26) 52(3.18) Other 60(6.90) 50(6.53) 110(6.73)Health benefits of vegetables score3 4.23 ± 0.044 (852) 4.16 ± 0.04(759) 4.19 ± 0.03(1611) 0.2241 Comparison between intervention and control groups using Chi-square Goodness-of-Fit or Student’s t-test 2 % (n)3Based on five knowledge questions about nutrients contained in vegetables, range 0-5 4Mean ± SEM (n)
Caregivers’ use of vegetables. Caregivers reported having about 13 different vegetable preparations (fresh, frozen, or canned) currently available in the home at the time they were recruited into the study. Intervention caregivers tended to report having a wider variety of vegetables at home than did control caregivers; the difference reached significance for fresh vegetables (P<0.05).
Page 30 Iowa WIC Program

Table 18. Availability of vegetables in the home of intervention and control homes at baseline
Intervention Control Total P-value1
Different vegetables currently available in the home (#)2
13.97 ± 0.18 (862)
13.51 ± 0.19 (749)
13.75 ± 0.13 (1611)
0.078
Fresh (#) 6.44 ±0.13 (877)
6.00 ±0.12 (773)
6.23 ±0.09 (1640)
0.011
Frozen (#) 2.03 ±0.08 (880)
1.96 ±0.09 (762)
2.00 ±0.06 (1649)
0.557
Canned (#) 5.48 ±0.10 (870)
5.56 ±0.11 (762)
5.52 ±0.08 (1632)
0.622
1 Comparison between intervention and control groups using Student’s t-test 2 Fresh, frozen or canned
Caregivers’ interpretations of the nutrition education message, “increase the number of vegetable servings per day,” were also assessed. Caregivers were asked to select a response to the following question, “What would it mean to you if you were asked to offer a child an extra ‘serving’ of vegetables a day?” About one third (34%) of all caregivers (36% intervention; 32% control) selected the response, “to offer a vegetable an extra time each day;” another 38% of caregivers (38% intervention; 39% control) chose the response, “to offer an extra helping of vegetables each day;” and about 27% of caregivers (26% intervention; 29% control) marked the response, “to offer a different kind of vegetable each day.” 3. Intervention results: Bivariate analyses Change in WIC caregivers’ Stages of Change status. There were significant changes in caregivers’ Stages of Change from baseline to the last data point in both the intervention and control groups (P<.001 for each; Table 19). About one-fifth of the intervention caregivers and one-third of control caregivers were in the precontemplation/contemplation stage at both baseline and their last data point. When analyzed in three categories, about one-quarter of both the intervention and the control caregivers increased their stage and about 27% of control but only 21% of intervention caregivers decreased in their stage status.
Iowa WIC Program Page 31

Table 19. Baseline vs. endpoint Stages of Change for intervention and control caregivers
Stage at last visit1 Intervention (n=244) Control (n=341)
Baseline Stage
PC2 P AM PC P AM PC 47(19.3) 3 28(11.5) 16(6.6) 101(29.6) 32(9.4) 33(9.7)P 31(12.7) 54(22.1) 17(7.0) 41(12.0) 25(7.3) 20(5.9)AM 4(1.6) 16(6.6) 31(12.7) 37(10.9) 14(4.1) 3811.1)1Comparison within intervention and control groups using Chi-square Goodness-of-Fit, P<0.001 2 PC=precontemplation/contemplation; P=preparation; AM=action/maintenance 3 n (% of entire sample) When the stage was analyzed using the five stages, almost one-third of all caregivers moved in a positive direction along the Stages of Change continuum (i.e., they had more immediate intentions to offer vegetables three times/day) (Table 20). There was a tendency for caregivers in the intervention group to move in a positive direction (i.e., moved towards the maintenance stage) as compared to those in the control group (P=0.08). The proportion of caregivers who moved in the opposite direction (i.e., they no longer had immediate plans to offer vegetables three times/day) was about 30% higher in the control as compared to the intervention group. A similar proportion of both groups of caregivers were at the same stage at the endpoint and baseline.
Table 20. Direction of movement in Stages of Change
of intervention and control caregivers
Intervention Control Total Direction of change1 N=244 N=341 N=585
Positive 76(31.15) 99(29.03) 175(29.92) Unchanged 109(44.67) 131(38.42) 240(41.03) Negative 59(24.18) 111(32.55) 170(29.06)
1Endpoint – baseline; Chi-square analysis of intervention effect, P=0.08
4. Intervention results: General linear model analyses
Stage of change status. The predictor variables for the final caregiver Stage of Change were examined among those with at least two certification contacts. Caregivers’ baseline Stage of Change, the intervention, and the number of certification contacts all were positively associated with the caregiver’s Stage of Change at their last data collection point (Table 21). Sociodemographic characteristics of the caregiver (age, years of education, income, Hispanic ethnicity, knowledge about health benefits of vegetables) and the child (age, BMI-for-age) were not significantly associated with the endpoint Stage of Change of the caregiver. To determine the consistency of the effect of intervention across the different intervention agencies, the treatment variable was replaced with dummy variables corresponding to the individual agencies. The effect of one of the intervention agencies was particularly strong
Page 32 Iowa WIC Program

and remained a significant determinant of the outcome, greater than the overall effect of the intervention.
Table 21. Determinants of caregiver’s endpoint
Stage of Change status (n=703, R2=0.118)
Variable Estimate SE P-value
Intercept 0.857 0.223 <0.001
Baseline stage 0.336 0.037 <0.001
Intervention (yes=1) 0.256 0.110 0.020
Certification contacts (#) 0.165 0.080 0.040
Caregivers’ knowledge about the health benefits of vegetables and offering children vegetables. In both intervention and control groups, there was a significant difference in distribution of the baseline and endpoint caregivers’ responses to the questions about the recommended number of vegetable servings and repeated offerings (P<0.001; Table 22). By the last visit, about half of all caregivers had correct knowledge about the need for repeated offerings of vegetables to children; in contrast, only 27% of the intervention and 19% of the control caregivers knew about the need to repeatedly offer new foods to overcome young children’s neophobia. After controlling for caregivers’ baseline knowledge, there were no significant group differences in caregivers’ end point knowledge about the recommended number of vegetable servings for children. However, intervention caregivers with an incorrect baseline response to the question on repeated offerings were significantly more likely to have chosen the correct response at their endpoint than control caregivers (13% vs. 9%; P=0.02).
Iowa WIC Program Page 33

Table 22. Caregivers’ baseline versus endpoint responses to questions related to the recommended of number of vegetable servings for children and repeated offerings
Endpoint responses
Intervention Control Questions/baseline responses
Correct Incorrect Correct Incorrect How many servings of vegetables a day are recommended for children 2-5 years of age?1
Correct 82(26.54)2 39(12.62) 100(31.75) 68(14.26) Incorrect 68(22.01) 120(38.84) 132(20.96) 177(37.11)How many times should a parent offer a new vegetable to his/her 2-5 years old child before giving up and deciding that the child doesn’t like the vegetable?1, 3
Correct 44(14.24) 40(12.62) 132(9.22) 39(8.18) Incorrect 40(12.95) 186(60.19) 45(9.43) 359(73.17)1Within both intervention and control groups, there was a significant difference between baseline and last end point, P<0.001. 2n (%) 3Within both caregivers with correct and with incorrect baseline answers, intervention caregivers were more likely to have the correct answer at end point (P<0.001 and P=0.02, respectively). Summative knowledge scores did not differ between the intervention and control caregivers at the two data time points (Table 23). There was also no significant group difference in change in knowledge scores between initial and final time points.
Table 23. Intervention and control caregivers’ knowledge scores1 and change in
knowledge score between baseline and end point
Intervention Control P-value Baseline 4.18 ± 0.072 (294) 4.09 ± 0.06 (455) 0.285 Endpoint 4.39 ± 0.07 (276) 4.33 ± 0.05 (456) 0.280 Change (endpoint – baseline) 0.21 ± 0.08 (265) 0.24 ± 0.07 (434) 0.748 1Based on responses to five questionnaire items about the nutritional benefits of vegetables for children. Includes only children with at least 2 data points. 2Mean ± SEM (n) There were no differences between groups in the proportion of caregivers who increased their knowledge score between baseline and the endpoint (Table 24). Approximately half of caregivers’ knowledge scores remained unchanged pre- and post-test with about 30% scoring higher and 20% scoring lower than their baseline scores at their last data point.
Page 34 Iowa WIC Program

Table 24. Caregivers’ change in knowledge scores between baseline and end point
Direction of change1 Intervention Control
Increased 73 (27.55)2 147 (33.87) Unchanged 145 (54.72) 213 (49.08) Decreased 47 (17.74) 74 (17.05) 1Endpoint – baseline 2n (%); comparison between intervention and control, P=0.206
Although the intervention was not associated with change in knowledge scores, exposure to WIC was. Controlling for baseline score in a linear regression analysis, the number of certification contacts tended to have a significant positive effect on caregivers’ endpoint knowledge scores. Hispanic ethnicity and child age were inversely associated with change in caregivers’ endpoint knowledge scores (Table 25).
Table 25. Variables associated with caregivers’ end point knowledge score (n= 596; R2=0.131)
Variable Estimate (β) P-value Intercept 3.136 <0.001 Baseline score 0.315 <0.001 Hispanic (1=yes) -0.329 0.016 Certification contacts (#) 0.114 0.075 Child age (mo) -0.008 0.083
Similar results were noted in the logistic analysis where a higher baseline knowledge score and being Hispanic had an inverse effect on an increase in knowledge from baseline to the end point (Table 26). Those caregivers with more certification contacts had a 42% greater likelihood of a positive change (increase) in knowledge scores from baseline to their last data point.
Table 26. Factors associated with an increase in caregivers’ knowledge scores
Variable Odds ratio Confidence intervals P-value Baseline knowledge score 0.252 0.202 - 0.314 <0.001 Hispanic (1=yes) 0.310 0.124 – 0.776 0.012 Certification contacts (#) 1.420 1.064 – 1.895 0.017
Iowa WIC Program Page 35

Caregivers’ attitudes towards vegetables and offering children vegetables. Intervention caregivers tended to have significantly higher mean attitude scores than control caregivers at both baseline and the last data point (Table 27). There was no significant difference between groups in mean change in attitude score between the measurement time points.
Table 27. Intervention and control caregivers’ attitude score
at baseline and end point
Intervention Control P-value Baseline attitude score1 4.50 ± 0.12 (262)2 4.21 ± 0.11 (385) 0.060 Endpoint attitude score 4.59 ± 0.13 (258) 4.16 ± 0.1 (412) 0.011 Change (endpoint-baseline) 0.12 ± 0.15 (220) -0.06 ± 0.12 (342) 0.342 1A numeric score was applied to each of the seven attitude questions: 1=very/extremely important; 0=somewhat important; -1=not that important. The attitude score was calculated as the sum of the numeric scores for caregivers’ responses to the seven attitude questions; range was -5 to 7. 2Mean ± SEM (n) There were no significant differences between intervention and control groups in the distribution of caregivers with increased, unchanged or decreased attitude score between baseline and endpoint (Table 28). Attitude scores improved for about 40% of both intervention and control caregivers; however, the mean scores did not increase because an almost equal percent of caregivers decreased in their attitude score.
Table 28. Proportion of intervention and control caregivers
with increased, unchanged, and decreased attitude scores from baseline to end point
Direction of change Intervention Control
Increased 92 (41.82) 122 (35.67) Unchanged 50 (22.73) 88 (25.73) Decreased 78 (35.46) 132 (38.60) Comparison between intervention and control; Chi-square =2.2; P=0.337
Intervention caregivers tended to have a higher attitude score than control caregivers at their last data point (Table 29). There was a significant and positive association of baseline attitude score and being Hispanic with caregivers’ endpoint attitude scores. A higher knowledge score tended to be associated with a more positive attitude.
Page 36 Iowa WIC Program

Table 29. Variables significantly associated with caregiver’s end point attitude score (n=540; R2=0.198)
Variable Estimate (β) SEM P-value Intercept 1.673 0.385 <0.001 Baseline attitude score 0.410 0.043 <0.001 Intervention 0.252 0.170 0.140 Hispanic ethnicity 0.974 0.327 0.003 Knowledge score 0.159 0.082 0.055
In contrast to the above linear regression model, the logistic regression analysis estimated the likelihood of have a positive attitude change. The intervention effect was almost significant, with a 38% increase in likelihood of an increase in attitude score (Table 30). Being Hispanic and knowledge score were not significant predictors of an increase in this analysis.
Table 30. Factors associated with increase in caregiver’s attitude scores
from baseline to end point (n=647; Pseudo R2=0.118)
Variable Odds ratio
Confidence interval
P-value
Baseline attitude score 0.619 0.564 – 0.679 <0.0001 Intervention 1.376 0.991 – 1.910 0.0564 Hispanic ethnicity 2.192 1.322 – 3.634 0.0023
Offerings of vegetables to children. There were no significant differences between control and intervention groups in the distribution of caregivers whose reported vegetable offerings increased, remained unchanged, or decreased from baseline to their last data point (Table 31). Approximately 25% of intervention and control caregivers reported an increase in vegetable offerings during the study period.
Table 31. Distribution of caregivers’ change in offering of
vegetables to children from baseline to end point
Direction of change1
Intervention Control2 Total
Increased 27.15 (82) 23.92 (111) 25.20 (193) Unchanged 53.31(161) 53.23 (247) 53.26 (408) Decreased 19.54 (59) 22.85 (106) 21.54 (165) 1 For caregivers who reported offering three vegetables at baseline and at endpoint, change in offerings was categorized as positive 2 Chi-square=1.687; P=0.403
Iowa WIC Program Page 37

Higher vegetable offerings at the endpoint were associated with higher vegetable offerings at baseline, and caregiver’s attitude score, education and knowledge about vegetables (Table 32). The intervention itself was not associated with this outcome.
Table 32. Factors associated with number of times per day caregivers
reported offering vegetables at the end point (n=506; R2=0.177)
Variable Estimate (β) SEM P-value Intercept 0.412 0.202 0.041 Reported vegetable offerings at baseline 0.328 0.042 <0.001 Attitude score at end point 0.035 0.013 0.010 Maternal education 0.038 0.013 0.004 Knowledge score 0.092 0.028 0.001
<Bookmark(112)> The logistic analysis was similar to the linear regression in that reported offerings at baseline and baseline knowledge score were associated with the dependent variable (Table 33). However, those caregivers with a higher frequency of offering vegetables were less likely to be among those who increased their vegetable offerings. This probably reflects an upper limit of how frequently caregivers would be expected to offer vegetables to children.
Table 33. Factors associated with an increase in caregivers reported vegetable
offerings from baseline to end point
Variable Odds ratio Confidence interval
P-value
Reported vegetable offerings at baseline 0.176 0.128 – 0.224 <0.001 Baseline knowledge score 1.313 1.110 – 1.552 0.001 Children’s consumption of vegetables. In both the intervention and control groups, over two-thirds of the children (69.98 and 67.55%, respectively) consumed vegetables <3 times per day at both baseline. The proportion of children who ate vegetables at least 3 times a day at both baseline and the last data point was about 22% in the control group compared to 17% in the intervention group (P<0.001, Table 34).
Table 34. Baseline versus end point distribution of intervention and control
children consuming vegetables at least three times a day
Endpoint frequency Intervention Control
Baseline frequency
<3 ≥3 <3 ≥3 <3 54.72 (145) 1 14.72 (39) 49.76 (207) 18.03 (75) ≥3 13.96 (37) 16.60 (44) 10.58 (44) 21.64 (90)
1n (%), Mantel-Haenszel Chi-square test, P<0.001
Page 38 Iowa WIC Program

Children from control sites consumed vegetables significantly more frequently than children from the intervention sites at both baseline and endpoint (Table 35). However, frequency of vegetable consumption did not change between and within the groups.
Table 35. Intervention and control children’s baseline and end point
mean frequency of vegetable consumption
Intervention Control P-value Baseline 2.18 ± 0.06 (289)1 2.18 ± 0.05 (453) 0.424 Endpoint 2.16 ± 0.06 (283) 2.31 ± 0.06 (433) 0.068 Change (endpoint-baseline) 0.01 ±0.07 (265) 0.14 ± 0.06 (416) 0.150 1Mean ± SEM (n) <Bookmark(175)> When baseline frequency of vegetable consumption was in the linear model, the estimates of other determinants reflected their association with the change in frequency between baseline and the end point. Caregivers’ baseline knowledge about the health benefits of vegetables, and baseline caregivers’ reported frequency of vegetable offerings, and duration of study participation were positively associated with the number of times children consumed vegetables at the end point (Table 36). Baseline number of snacks consumed by children demonstrated a negative association. No factors were significant predictors for the likelihood to increase.
Table 36. Factors associated with children’s final frequency of vegetable consumption (n=593, R2=0.249)
Variable Estimate (β) SEM P-value Intercept 0.585 0.245 0.017 Baseline frequency (#) 0.397 0.043 <0.001 Caregivers’ baseline knowledge score 0.081 0.034 0.018 Snacks consumed per day at endpoint (#) -0.139 0.049 0.005 Caregivers’ frequency of vegetable offering at endpoint (#) 0.259 0.069 <0.001 Duration of participation (d) 0.001 0.000 0.027 Children’s consumption of different vegetables. The mean number of different vegetables consumed did not differ by group (Table 37). However, the slightly lower variation at baseline and slightly higher variation at the end point among the control children contributed to a significant difference in the change across time (P=0.03).
Iowa WIC Program Page 39

Table 37. Number of different vegetables consumed in the last week by intervention and control children at baseline and the end point
Intervention Control P-value Baseline 6.98 ± 0.18 (290) 6.66 ± 0.13 (460) 0.159 Endpoint 6.86 ± 0.17 (283) 7.06 ± 0.15 (440) 0.378 Change (endpoint-baseline) -0.09 ± 0.19 (267) 0.42 ± 0.14 (426) 0.030 Three variables were significantly associated with the variety of vegetables consumed by children (Table 38). The daily frequency of consuming vegetables had the strongest effect on children’s consumption.
Table 38. Factors associated with children’s endpoint variety in vegetable consumption
(n=481, R2=0.520)
Variable Estimate (β) SEM P-valueIntercept 0.747 0.496 0.133 Different vegetables consumed at baseline (#) 0.352 0.036 <0.001 Children’s endpoint frequency of consuming vegetables (#) 1.301 0.087 <0.001 Age of caregiver (y) 0.032 0.015 0.038
In the logistic analysis, children’s endpoint frequency of vegetable consumption had a significant positive effect on the likelihood of increasing variety of vegetables consumed. A one unit (one vegetable per day) increase in vegetables at the endpoint increased the likelihood of an increase in variety of vegetables by three-fold. There was no apparent effect of the intervention on the variety of vegetables that children consumed.
Table 39. Factors associated with change in number of different vegetables the children
consumed from baseline to their last data point
Variable Odds ratio
Confidence interval
P-value
Number of different vegetables consumed at baseline 0.58 0.53 – 0.64 <0.001 Children’s endpoint frequency of consuming vegetables 3.03 2.45 – 3.76 <0.001
5. Intervention results: Redemption of WIC FMNP checks County-wide farmers’ market redemption rates for the year 2002 and 2003 are shown in Table 40. The mean individual rate for intervention and control counties increased about 1.3% in the control agencies and about 0.2% in the intervention agencies.
Page 40 Iowa WIC Program

Table 40. County-wide and participant 2002-2003 redemption rates for WIC Nutrition Farmer’s Market Program vouchers
Redemption rate (%) County-wide Participant 2002 2003 20031 Intervention 55.9 ± 9.82
(37.30, 72.72) 56.1 ± 9.5 (38.58, 71.14)
63.4 ± 1.9
Control 53.5 ± 9.3 (39.87, 70.85)
54.8 ± 6.8 (42.68, 65.06)
57.8 ± 2.1
1Comparison of intervention and control for participants only, P<0.05 2Mean ± SEM (minimum, maximum)
Farmers’ market redemption data for 2003 were available for 894 (intervention = 474 and control =420) caregivers (Table 40). Approximately 75% of the caregivers used at least one of their checks; significantly more intervention than control caregivers with issued checks used them (78.1% vs. 72.1%; P=0.0407). The overall mean check redemption rate was 60.77% ± 1.41% and the rate was about 5.5 percentage points higher for the intervention caregivers than for control caregivers (63.38% ± 1.87% vs. 57.82% ± 2.12%; P=0.049). These group rate differences among participants were about four times that seen between the control and intervention counties (5.5 percentage points vs. 1.3 percentage points). In addition, the participants’ mean redemption rate was 7.3 percentage points higher than the mean redemption rate in their counties; in the control clinics, the difference between the participants and the overall county redemption rates was half that, only 3.0 percentage points. ADDITIONAL FINDINGS 1. Observations of clinic environment to promote vegetable consumption The onsite observations conducted in a random selection of clinics of each participating agency provided information on the environment in which the project nutrition education occurred at the WIC clinics. The visual cues about vegetables, the social environment of the clinic and staff-client interactions are reported in Table 41. Data were collected twice, prior to initiating the intervention (June 2002) and after one year of the program (June 2003). Many of the clinics completed data collection for their clients prior to program end date, therefore a third observation visit was not carried out in June 2004. Given the small number of visits, there are no statistical differences between time points or intervention and control groups. However, the data are informative. Clinics were observed to be orderly, offer an inviting atmosphere to the client, and be managed by friendly staff. Visual cues about vegetables for the WIC clientele, including items on bulletin boards and posters, were rarely used. Only one-third of intervention clinics had such items during the intervention, even though items were provided by the project. Pamphlets that could be handed out were twice as common. Most of the observed nutrition education sessions were for certification (first visit) of clients who were not participants in this study. In these sessions, most (67 to 100%) of the sessions used only the WIC food frequency questionnaire
Iowa WIC Program Page 41

as a tool for nutrition education. In addition, very few of the sessions were rated to be focused on the client for the content or delivery, as promoted by the critical thinking model used for the intervention modules.
Table 41. Environment in intervention and control clinics
Clinics visited
Intervention Control Pre
(n=7) During (n=8)
Pre (n=7)
During (n=6)
Visual cues with focus on vegetables, n (%) present
Bulletin boards 4 (57) 3 (38) 2 (29) 0 Posters 5 (71) 3 (38) 3 (43) 1 (17) Pamphlets 4 (57) 5 (63) 5 (71) 2 (33) Books 3 (43) 0 4 (57) 0 Toys 0 1 (13) 0 0 Social environment, n (%) somewhat/very
Inviting atmosphere 6 (86) 8 (100) 6 (86) 6 (100) Health/nutrition focus visible 5 (71) 5 (63) 1 (14) 1 (17) Organization orderly 6 (86) 8 (100) 6 (86) 6 (100) Vegetable education visible 5 (71) 5 (63) 2 (29) 0 Staff friendly 5 (71) 8 (100) 7 (100) 6 (100)
Observations completed Intervention Control Pre
(n=18) During (n=10)
Pre (n=17)
During (n=12)
Certification ed session, n (%) Food frequency form used only 14 (78) 10 (100) 16 (94) 8 (67) Client-focused content1 0 0 0 1 (8) Client-focused delivery1 3 (17) 3 (30) 1 (6) 2 (17)
1On a scale -3 to +3, includes +1 to +3 2. Staff knowledge and attitude questionnaires Nutrition staff from nine WIC agencies completed the staff knowledge and attitudes questionnaire (Appendix B). From these agencies, a total of 91 surveys were completed (54 pre-surveys [26 intervention and 28 control] and 37 post-surveys [19 intervention and 18 control]). Staff from four EFNEP counties contributing 24 completed surveys (13 pre-surveys and 11 post-surveys). The mean age of the 90 WIC nutritionists was 41.1 ± 11.8 years; almost all (97.8%) of them were women (n=86). The majority of the respondents were registered or licensed dietitians (81.1%). Some of the WIC dietitians who completed the survey had graduate degrees
Page 42 Iowa WIC Program

(25.9% pre and 22.9% post, respectively) and most were a parent (72.2% pre and 80.0% post, respectively). Pre-survey comparison of WIC intervention and control groups. When compared to the control group, the staff in the intervention group were less likely to advise caregivers to purchase vegetables when they had a limited amount of money to spend on groceries (80.8% vs. 100.0%; P=0.05). The intervention staff thought more favorably of taste testing and goal setting as effective educational approaches for encouraging caregivers to offer more vegetables to their children (Table 42). Post-survey comparison of WIC intervention and control groups. During the post-survey, almost one-half (44.4%) of WIC control staff felt that caregivers should be somewhat or not concerned about their 2-5 year old children not eating vegetables offered at meal times. The WIC intervention dietitians tended to be less concerned (21.5%; P=0.056). The WIC intervention, in comparison to the control, staff also tended to be more concerned about offering vegetables as snacks (78.9% vs., 55.5%, respectively; P=0.10). Compared to control staff, the WIC intervention staff thought taste testing and food demonstrations were more effective and group discussions less effective (Table 42). Comparison of pre- and post-survey responses. There were several differences noted in the responses between pre- and post-surveys. The control group from WIC clinics had a significant decrease in their attitude on how realistic it was to change their vegetable offering habits after an education session (89.3% vs. 58.8%; P=0.02). Among both the control and intervention groups, there was an improved attitude about the effectiveness of FMNP vouchers (Table 42).
Table 42. Attitudes of WIC staff about educational approaches
pre- and post-intervention
Intervention Control Pre Post Pre Post Effectiveness (%)1 Recipe cards 50.0 63.1 42.8 61.0 Taste testing 88.4 94.7 64.23 77.74 Story telling 60.6 31.5 10.7 16.7 Group discussions 38.4 21.0 28.5 50.04 1-on-1 counseling 26.8 94.6 39.2 99.9 Contests 46.1 84.2 24.9 66.6 Goal setting 42.2 42.0 25.03 41.0 FMNP vouchers 84.5 94.62 54.9 94.42 Food demonstrations 79.5 94.6 74.9 66.63 1% reporting extremely or very effective 2Pre- vs. post-comparison, P<0.10 3Intervention vs. control comparison, P<0.1 4Intervention vs. control comparison, P<0.05
Iowa WIC Program Page 43

3. Program cost The project included a program development phase and an operational phase. When combined, they covered 24 months over a three year period. Four agencies participated in the intervention. The data reported for the program cost analysis were provided by staff from the Department of Food Science and Human Nutrition at Iowa State University (ISU), Iowa Department of Public Health (IDPH), and the Expanded Food and Nutrition Education Program (EFNEP) at ISU. The primary outcome of the nutrition education intervention was a web-based toolkit designed to provide the capability to transfer the intervention to other WIC and EFNEP programs, as well as other nutrition and education programs throughout the US. This toolkit contains the screening tools and all written materials developed for the intervention, detailed instructions on the use of the materials, and suggestions on carrying out the different activities. In the last section of this report we present the costs involved in replicating the nutrition education program using the materials posted on the web. Table 43 presents the program development and program operation costs for the in-person training option (base case). The combined costs are the costs incurred to develop and implement the program in Iowa. The program operation costs measure the costs of carrying out the program once developed and include training costs. The cost data are summarized for the duration of the project. A. In-person Training Option (Base Case) Program Development Costs ISU worked with staff from the IDPH to develop interactive, hands-on nutrition education modules designed to improve children’s acceptance of vegetables. Therefore, the program development costs are those costs incurred by both ISU and the IDPH during the initial phase of the project to develop the project modules. The costs related to the research component are not included in this assessment.. ISU incurred costs for the development of modules during the first, second, and third year of $2,717, $4,839, and $1,925 respectively, for a total of $9,481. These costs include costs for staff time (salary and benefits) of those involved in the development of the modules and directly attributable to the program development. There were also transportation costs to field testing sites ($372). The IDPH contributed time for the program development during each of the three years ($19,506). These costs include salary and benefits of the State of Iowa staff. In sum, the total program development costs were $29,359 for the three-year development period. Program Operation Costs The program operation costs consist of the following cost components: (1) initial in-service training session for WIC dietitians and EFNEP/FNP nutrition education personnel, (2) ongoing (administrative) activities to keep the intervention program running, and (3) intervention counseling sessions.
Page 44 Iowa WIC Program

(1) An initial in-service training session was required for WIC dietitians and EFNEP/FNP program assistants to obtain the skills needed to carry out the nutrition education intervention. This training occurred during the first year of the project and was incorporated into the on-going nutrition education training of the WIC and EFNEP/FNP staff. One-fifth of the time (salaries and benefits) of the trainers involved in the nutrition education training was assigned to the intervention program. This included time for preparation and for the lecture presentations. For the trainees, it was estimated that 35% of the time spent in training was spent on intervention training, based on the number of hours of training they attended. In addition, 20% of the costs of materials and other equipment were assigned to the intervention training costs. In total, the initial training session costs were $5,284 ($2,537+ $2747). The estimated cost per trainee was $165.12 ($5,284/32). The additional costs of facilities for training and transportation and lodging were small, and therefore were not included in the estimates.
(2) The costs of ongoing administrative activities are reported for the each of the three years of the program operation. These costs were estimated by multiplying the time per month dedicated to ongoing administrative activities by the hourly salary and benefits of the WIC Nutrition Services Coordinator. This estimated monthly amount was multiplied by the number of months of program operation in each year (3.5 months during the first year, 12 months during the second year, and 8.5 months during the third year) for a total of $9,000 for the three-year period.
(3) The intervention counseling session costs include both the staff time costs of the intervention counseling sessions and the costs of materials used in those sessions.
The staff time required per session was estimated by using information from an in-clinic time study. The estimated time for an intervention counseling session was similar to that for a non-intervention session (about 6.2-6.4 minutes based on time studies completed by three intervention agencies and the FFY01 Nutrition Education Time Study Summary). An additional 2 minutes was added to the intervention for preparation. The cost per intervention counseling session was estimated by multiplying the average salary and benefits (per minute) of the WIC dietitians ($21.15/60) by the additional time necessary to conduct an intervention counseling session (2 additional minutes). The resulting estimated counseling session time cost was $0.71 per session.
To estimate the intervention counseling costs per year, the cost per intervention counseling session ($0.71) was multiplied by the total number of children participating in the intervention sessions. The total number of children includes the children that received initial intervention contacts in that year and those that received follow-up intervention counseling sessions during that year. The number of WIC children receiving initial intervention contacts during the three years was 995; the number of EFNEP children receiving initial intervention contacts was 85. The number of WIC and EFNEP children receiving follow-up intervention contacts during the three years was 649 and 67 respectively. The total number of intervention counseling contacts for both programs was 1,796. The three-year intervention counseling sessions cost for both programs was $1,266 ($1159 + $107).
Iowa WIC Program Page 45

The cost of materials used in the intervention has three components: non-consumables and consumables, printing, and purchasing. All intervention WIC agencies received the same amount of funding over the course of the project to buy food, paper supplies and other materials needed for vegetable preparation demonstrations and samples. Printing costs were $6,229 and $6,566 for the first two years and estimated to be $5,000 for the third year. The printing costs include intervention materials for EFNEP and WIC. Each local nutrition staff member received his/her own hanging file box with all of the intervention and research materials in it. A total of 48 file boxes were distributed with 30 to local WIC agencies and 18 to local EFNEP units. The printing costs were apportioned accordingly. Purchasing costs are actual reported costs for the first and second year and projected costs for the last year of the project. These materials were distributed in the same manner as the file boxes, therefore, costs were apportioned the same way. (It should be noted that printing costs are an overestimate of materials actually used. Each file box contained at least 25 copies of the materials for each nutrition education module to ensure that staff had easy access to all materials. The quantity of unused materials at the end of the project was not determined.)
The intervention counseling session costs were $68,393 in total. The three-year intervention counseling session cost per child was $38.08, a cost estimated by dividing the total intervention counseling sessions costs ($68,393) by the total number of children (1,796). The counseling session cost (intervention counseling sessions plus materials) per WIC child was $34.78 ($57,174/ 1,644). The monthly rent and utilities paid by the clinics are not included in this analysis because veggies counseling is one of several services provided by the clinics, therefore, these costs are considered small.
Cost Summary for In-person Training Option Based on the information collected, the three-year cost for program operations for both WIC and EFNEP was estimated to be $82,677. Of the program operation costs, the WIC program incurred $68,711 in costs. Therefore, the estimated cost for WIC for the three-year intervention nutrition education program was $42 per child. When the operation costs incurred by EFNEP and the number of EFNEP children attending sessions are included, the cost per child increases to $46 per child. B. Web-Based Toolkit Option A final output of this project is a web-based tool kit offering guidance and resources for other WIC and nutrition education programs. To evaluate the cost of carrying out the project using the materials available in the tool kit, program costs were estimated by using the original costs of program operation and excluding those costs not required such as salaries and benefits of trainers. The estimated costs for implementing the nutrition education program using the web-based materials are shown in Table 44.
Page 46 Iowa WIC Program

Program Operation Costs The program operation costs for the web-based toolkit option include time for nutrition education personnel to read about how to use the materials and to become familiar with them, ongoing administrative and clerical activities to keep the intervention program running, and intervention counseling costs. It was assumed that the duration of a program implemented in this manner would be the same as the current project (3.5 months during the first year, 12 months during the second year, and 8.5 months during the third year). This assumption facilitates the comparison between the costs of the two options. The estimates were based on data from the WIC intervention — the number of WIC dietitians, average hourly salary of WIC dietitians, and number of children assisted by WIC.
(1) The initial “training session” costs were for reading about the intervention and becoming familiar with the materials by accessing the web-based toolkit. Salaries and benefits for trainers were therefore excluded. Cost estimates for trainees’ salaries and benefits were based on the following assumptions: 1) trainees required two hours to review the materials, 2) the number of trainees would be the same as the number of dietitians in the project intervention agencies (n=16), and 3) the average hourly salary and benefits per trainee is equal to $21.15 (the same as the project intervention dietitians). The training costs were obtained by multiplying the number of trainees by the average hourly salary and benefits per trainee, and then multiplying the cost per trainee by the number of hours required for the initial training. The estimate was $677. The estimated cost of materials and other equipment for this activity was $50 (for printing materials, accessing the Internet, etc.). Therefore, the initial training session cost was estimated as $727 or $45.44 per trainee.
(2) The costs of ongoing activities to keep the program running include administrative activities and clerical activities. These costs were estimated by assuming 20 hours of administrative activities per year on the part of the local WIC Coordinator and 48 hours per year to download and print the nutrition education materials from the Internet on the part of the program assistant or support staff. To estimate the cost of administrative activities, the number of hours dedicated to administrative activities per month was multiplied by the number of months in the year that these activities are performed and then multiplied this result by the hourly salary and benefits of the local WIC Coordinator.
To estimate the cost of clerical activities, the number of hours dedicated to download and print materials per month was multiplied by the number of months in the year these activities would be performed. This result was multiplied by the hourly salary and benefits of the program assistant performing this task. The sum of administrative costs and the clerical costs yields the cost of ongoing activities to keep the program running per year. The costs were estimated as $2,968. (3) The intervention counseling sessions costs are estimated to be the same as the WIC base case intervention counseling sessions costs or $57,174 for the three-year period. Thus, the total program operation costs under a web-based training option would be $60,868.
Iowa WIC Program Page 47

Cost Summary for Web-Based Toolkit Option The program operation costs using the web-based toolkit represent 89% of the WIC base case project operation costs. The cost per child using this option is $37 compared to $42 for the WIC base case.
Page 48 Iowa WIC Program

Table 43. Intervention cost summary: In-person training option
Type of cost 3 year total Program development cost 1) Iowa State University (ISU) Faculty and staff time for module development1 $9,481 Transportation cost to field testing sites $372 2) State of Iowa (IDPH) WIC state employee time2 $19,506
Total program development costs $29,359 Program operation costs 1) Initial training session WIC: Salaries and benefits for trainers3 $500 Salaries and benefits for trainees4 $1,987 Materials and other equipment5 $50 Total WIC training sessions costs $2,537 EFNEP: Salaries and benefits for trainers3 $500 Salaries and benefits for trainees4 $2,197 Materials and other equipment5 $50 Total EFNEP training sessions costs $2,747
Total training session costs $5,284 2) Administrative activities to maintain intervention WIC state employee time6 $9,000
Total administrative activities costs $9,000 3) Intervention counseling sessions WIC: Additional staff time for counseling sessions 7 $1,159 Non-consumables and consumables8 $32,400 Printing $12,101 Purchasing $11,514
Total WIC intervention counseling sessions costs $57,174 EFNEP: Intervention counseling sessions 7 $107 Non-consumables and consumables8 --- Printing $5,694 Purchasing $5,418
Total EFNEP intervention counseling costs $11,219 Total (WIC + EFNEP) intervention counseling costs $68,393
WIC program operation costs $68,711 WIC + EFNEP program operation costs $82,677
TOTAL COSTS $112,036
Iowa WIC Program Page 49

Table 43. Intervention cost summary: In-person training option
Number of children receiving intervention contacts 3 year total
Children receiving initial intervention contacts WIC 995 EFNEP 85 Total number of initial contacts 1,080
Children receiving follow-up intervention contacts WIC 649 EFNEP 67 Total number of follow-up contacts9 716
Total number of children (initial + follow-up) 1,796 Cost per child for intervention program (WIC)10 $42
Cost per child for intervention program (WIC +EFNEP)11 $46 1Includes all ISU faculty and staff (including EFNEP Coordinator) who helped develop the modules. 2Of the total IDPH time cost ($19,506), 50% was allocated to the first year, 33% to the second year and 17% to the third year of the program. 3Since only a portion of the time for nutrition education training was dedicated to the intervention, approximately 1/5 of the trainers’ salaries and benefits was assigned to intervention cost estimates. This portion of time includes the trainer’s time to prepare their presentations. The resulting salaries and benefits for trainers were divided by 2 (16 dietitians from WIC and 16 program assistants from EFNEP attended the
ing). train 4Salaries and benefits for trainees were reported by WIC and EFNEP and multiplied by the proportion of time the trainees attended the veggies nutrition education training (35%); the remaining time was dedicated to the
h component of the project. researc 5Approximately 20% of the costs reported for materials and other equipment was assigned to intervention
osts. training c 6It was assumed that ongoing activities were performed 3.5 months during the first year, 12 months during the
nd year and 8.5 in the third year. seco
7It was assumed that salaries and benefits were paid for 3.5 months during the first year, 12 months during the second year and 8.5 months in the third year. The average time of an intervention counseling session is 8.24 minutes of which 2 minutes were for preparation. The cost per session is $2.9046. The total number of initial intervention contacts during the three-year period is 1080, the total number of follow-up intervention contacts
6. is 71 8EFNEP did not receive any funds for consumable and non-consumable materials and supplies. 9To obtain the number of children for children receiving intervention contacts from EFNEP program staff, the following assumptions were made: In Black Hawk County, EFNEP children were 25% of the children and the remaining 25% were WIC children; in Woodbury County, EFNEP children were 5% of the children and the remaining 95% were WIC children. During the first year of the project (which included only 3.5 months of intervention), there were very few children receiving follow-up intervention contacts since those were typically scheduled three months after the initial contact. Therefore, all follow-up intervention contacts in the first year
f implementation were assumed to be all WIC children. o 10Based on total number of children receiving intervention contacts from WIC. 11Based on total number of children receiving initial and follow-up contacts from WIC and EFNEP.
Page 50 Iowa WIC Program

Table 44. Intervention cost summary: Web-based toolkit option Type of cost 3 year total Program operation costs 1)Initial training Salaries and benefits for trainees1 $677 Materials and other equipment $50
Total training costs $727
2) Ongoing activities to maintain intervention Salaries and benefits: Administrative activities $1,240 Clerical activities $1,728
Total ongoing activities costs $2,968
3) Intervention counseling sessions $1,159 Non-consumables and consumables $32,400 Printing $12,101 Purchasing $11,514
Total intervention counseling costs $57,174
Total program operation cost (includes only WIC ) $60,868
Number of children receiving intervention contacts (WIC) Children receiving initial intervention contacts 995 Children receiving follow-up intervention contacts 649
Total number of WIC children 1,644 Cost per child for intervention program 3 $37
1Trainee costs were based on the average salaries and benefits of WIC dietitians ($21.15/hour) and multiplied
y 16 (the number of WIC dietitians in the intervention project training session. b 2Salaries and benefits were based on the assumption that WIC dietitians were paid for 3.5 months during the first year, 12 months during the second and 8.5 months during the third year. The average time of an intervention counseling session is 8.24 minutes of which 2 are for preparation resulting in a cost per counseling ession of $2.9046. s
3Based on total number of WIC children in the intervention project.
4. Examples of agency collaboration activities
Interactions between local WIC and EFNEP/FNP staff provided the opportunity to exchange experiences, share educational techniques, improve coordination for clients, and provide consistent nutrition messages. To overcome WIC’s staff, resource, and space limitations and take advantage of the full repertoire of modules available some of the WIC clinics partnered with other groups or organizations in using the modules with their clients. Partnerships were established with EFNEP, local food banks, and community garden groups. In some clinics EFNEP personnel were available on-site provide nutrition education to low-risk clients including those participating in the intervention project:
We have the cooperative effort with EFNEP in the main office, not the outreach clinics. The EFNEP staff person teaches a lesson using the module as a guide. If the client is
Iowa WIC Program Page 51
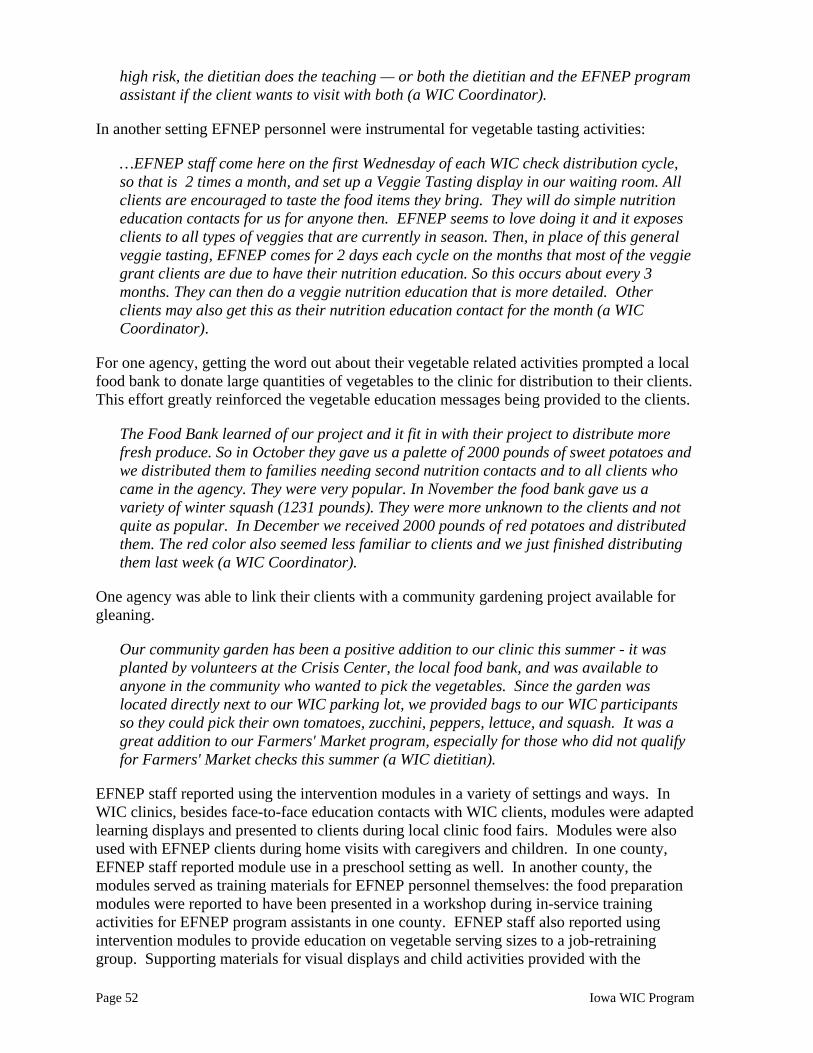
high risk, the dietitian does the teaching — or both the dietitian and the EFNEP program assistant if the client wants to visit with both (a WIC Coordinator).
In another setting EFNEP personnel were instrumental for vegetable tasting activities:
…EFNEP staff come here on the first Wednesday of each WIC check distribution cycle, so that is 2 times a month, and set up a Veggie Tasting display in our waiting room. All clients are encouraged to taste the food items they bring. They will do simple nutrition education contacts for us for anyone then. EFNEP seems to love doing it and it exposes clients to all types of veggies that are currently in season. Then, in place of this general veggie tasting, EFNEP comes for 2 days each cycle on the months that most of the veggie grant clients are due to have their nutrition education. So this occurs about every 3 months. They can then do a veggie nutrition education that is more detailed. Other clients may also get this as their nutrition education contact for the month (a WIC Coordinator).
For one agency, getting the word out about their vegetable related activities prompted a local food bank to donate large quantities of vegetables to the clinic for distribution to their clients. This effort greatly reinforced the vegetable education messages being provided to the clients.
The Food Bank learned of our project and it fit in with their project to distribute more fresh produce. So in October they gave us a palette of 2000 pounds of sweet potatoes and we distributed them to families needing second nutrition contacts and to all clients who came in the agency. They were very popular. In November the food bank gave us a variety of winter squash (1231 pounds). They were more unknown to the clients and not quite as popular. In December we received 2000 pounds of red potatoes and distributed them. The red color also seemed less familiar to clients and we just finished distributing them last week (a WIC Coordinator).
One agency was able to link their clients with a community gardening project available for gleaning.
Our community garden has been a positive addition to our clinic this summer - it was planted by volunteers at the Crisis Center, the local food bank, and was available to anyone in the community who wanted to pick the vegetables. Since the garden was located directly next to our WIC parking lot, we provided bags to our WIC participants so they could pick their own tomatoes, zucchini, peppers, lettuce, and squash. It was a great addition to our Farmers' Market program, especially for those who did not qualify for Farmers' Market checks this summer (a WIC dietitian).
EFNEP staff reported using the intervention modules in a variety of settings and ways. In WIC clinics, besides face-to-face education contacts with WIC clients, modules were adapted learning displays and presented to clients during local clinic food fairs. Modules were also used with EFNEP clients during home visits with caregivers and children. In one county, EFNEP staff reported module use in a preschool setting as well. In another county, the modules served as training materials for EFNEP personnel themselves: the food preparation modules were reported to have been presented in a workshop during in-service training activities for EFNEP program assistants in one county. EFNEP staff also reported using intervention modules to provide education on vegetable serving sizes to a job-retraining group. Supporting materials for visual displays and child activities provided with the
Page 52 Iowa WIC Program

modules were also reported to be very helpful with EFNEP clients. One of these supporting materials was a packaged lesson plan about carrots that was frequently used in one county.
We used the carrot lesson 40 times in April 2002 and 6 times in April 2003. Used with EFNEP families; parents and children. Used approximately with 50 children and 40 adults in April 2002 (EFNEP program assistant).
In their comments about their experiences using the modules, EFNEP staff reported that their clients enjoyed the goal setting activities, that the modules were well received, and that children particularly enjoyed the storybook lessons. The staff also indicated they enjoyed using the modules in general because they were visual and interactive. Conclusions This nutrition education delivery model can be applied in a wide variety of settings, including federally funded nutrition programs like WIC and EFNEP and other state and community-based nutrition education initiatives involving parents of young children. The two theoretical approaches have widespread application and can be used to impact knowledge, attitude, and practices. In this project, caregivers reported a wider variety of vegetables currently available in the home than was consumed in the past week. Caregivers advanced in stage with longer WIC program duration. Caregivers in precontemplation/contemplation stage at baseline were more likely than those in preparation stage to advance; more intervention than control caregivers in precontemplation/contemplation advanced. After controlling for initial stage, intervention and duration of program participation were associated with stage advancement; however, this did not translate to increased children’s vegetable intakes. Participation in the WIC program positively influenced caregiver feeding intentions. Nutrition education on vegetables should consider variability in caregivers’ readiness to offer vegetables and associated barriers. Targeted education using these two theoretical approaches can impact knowledge and attitude about vegetables which may eventually lead to changes in consumption practices. RESOURCES The web-based toolkit can be accessed at http://www.idph.state.ia.us/hpcdp/vg_home.asp.
Iowa WIC Program Page 53

CONTACT LIST The primary contacts for more information about this project are listed in the table below: Name, title and affiliation Role in project Telephone Brenda Dobson WIC Nutrition Services Coordinator Iowa Department of Public Health
Project coordinator 515/ 281-7769
Grace Marquis Assistant Professor Department of Food Science and Human Nutrition Iowa State University
Principal investigator 515/ 294-9231
Mary Jane Oakland Associate Professor Department of Food Science and Human Nutrition Iowa State University
Co-investigator 515/ 294-2536
Helen Jensen Professor Department of Economics Iowa State University
Cost analysis 515/ 294-6253
OTHER RESOURCES AND MATERIALS All resources and materials have been described in other sections of this report. RECOMMENDATIONS AND TIPS FOR IMPLEMENTATION Intervention materials were stored in a large plastic file storage container in hanging files. The containers were easy to transport and kept the materials organized and within easy reach. A color code scheme was also used to make it easier for personnel to file and retrieve materials. Colors were used on the hanging files and print materials to represent the three stages as follows: red or pink for precontemplation/contemplation, yellow for preparation, and green for action/maintenance. These same colors were used on the screening tool for consistency in identifying materials. Red hanging files were used in the storage container while print materials were produced on pink paper. Print materials on red paper proved to be difficult to read. Each hanging file was labeled with the name of the nutrition education module. The stages could also be abbreviated and listed on the label, however the color of the hanging file indicated the stage for that module. The hanging files contained all of the materials needed to use the module. The lesson plans were printed on the appropriate color of cardstock to withstand repeated use. Take-home materials were printed on the appropriate color of paper. In a few modules, the same take-home title was used across two or more stages. In these cases, the materials were printed on white paper with color graphics and filed the appropriate lesson plans. Additional print materials were also stored in the hanging files including items such as children’s books,
Page 54 Iowa WIC Program

recipes, bookmarks and other print materials from the Pick a better snack©, labels from cans and other packages of vegetables. Materials were printed front-to-back English/Spanish to reduce the number of titles in the inventory and on the order form, and for ease of use. During the research project, a separate screening tool was used for each client. Practitioners could laminate a copy of the tool for repeated use and mark the client’s responses with a dry erase or other erasable marker. REFERENCES 1. United States Department of Health and Human Services. Healthy People 2010. US
Government Printing Office. Washington, DC. 2000.
2. Produce for Better Health Foundation. New “State of the Plate” Research Shows Americans Need More Fruits and Vegetables. Available at: http://www.5aday.com/html/press/pressrelease.php?recordid=57. Accessed June 17, 2005.
3. Produce for Better Health Foundation. Consumption Statistics: Fruit and Vegetable Intake in the U.S. Available at: http://www.5aday.com/html/research/consumptionstats.php#data. Accessed June 17, 2005.
4. Centers for Disease Control and Prevention. Behavioral Risk Factor Surveillance System. Available at: http://apps.nccd.cdc.gov/brfss/page.asp?cat=FV&yr=2003&state=All#FV. Accessed June 17, 2005.
5. Schafer E, Nelson D. Iowa Nutrition Education Network Social Marketing Research Report: Recommendations for Delivering Nutrition and Physical Activity Messages to Low-Income Parents of Children Aged 2-12 years. Ames, Iowa: Iowa State University Extension Service,1999.
6. Birmingham B, Shultz JA, Edlefsen M. Evaluation of a Five-A-Day recipe booklet for enhancing the use of fruits and vegetables in low-income households. Journal of Community Health. 2004;29(1):45-62.
7. Eikenberry N, Smith C. Healthful eating: Perceptions, motivations, barriers, and promoters in low-income Minnesota communities. Journal of the American Dietetic Association. 2004;104(7):1158-61.
8. Maclellan DL, Gottschall-Pass K, Larsen R. Fruit and vegetable consumption: Benefits and barriers. Canadian Journal of Dietetic Practice and Research. 2004;65(3):101-5.
Iowa WIC Program Page 55

9. John JH, Ziebland S. Reported barriers to eating more fruit and vegetables before and after participation in a randomized controlled trial: a qualitative study. Health Education Research. 2004;19(2):165-174.
10. Iowa WIC Program. 2003 Iowa Food Security Survey Executive Summary. Des Moines, Iowa: Iowa Department of Public Health, August 2004.
11. US Census Bureau. Iowa Quick Facts. Available at: http://quickfacts.census.gov/qfd/states/19000.html. Accessed June 17, 2005.
12. Iowa Department of Agriculture and Land Stewardship. WIC Farmers’ Market Nutrition Program County Redemption Rates (data reports), 2004.
13. Iowa WIC Program. 2000 Iowa WIC Survey. Des Moines, Iowa: Iowa Department of Public Health, August 2001.
14. Dobson B, Personal communication (WIC Nutrition Services Coordinator, Iowa WIC Program, Des Moines, Iowa).
15. Prochaska JO, DiClemente CC. The Transtheoretical Approach: Crossing the Traditional Boundaries of Therapy. Homewood, IL: Irwin; 1984.
16. Prochaska JO, Velicer WF. The Transtheoretical Model of health behavior change. American Journal of Health Promotion. 1997;12:38-48.
17. Velicer WF, Prochaska JO, Fava JL, Laforge RG, Rossi JS. Interactive versus non-interactive interventions and dose-response relationships for stage matched smoking cessation programs in a managed care setting. Unpublished manuscript, 1997.
18. Lipman M. Critical thinking: What can it be? Educational Leadership. 1988;46(1):38-43.
19. Paul RW. Critical thinking and the critical person. Educational Leadership. 1984;42:4-14.
20. Nitzke S, Kritsch K, Lohse B, Horacek T, White A, Greene G, Georgiou C, Betts N, Boeckner L. Extension and research professionals join forces to address a critical nutrition issue. Journal of Extension 42(5). October 2004 http://www.joe.org/.
21. Greene G, Personal communication (Professor, University of Rhode Island, Kingston, Rhode Island).
22. Krebs-Smith S, Clark LD. Validation of a nutrient adequacy score for use with women and children. Journal of the American Dietetic Association. 1989;89(6):775-783.
Page 56 Iowa WIC Program

ACKNOWLEDGEMENTS This project benefited from the input and participation of many individuals who embraced the project enthusiastically and worked diligently to complete tasks. The study coordinator for this project, Esi Colecraft, kept the project on task and on deadline. She was employed by Iowa State University for the duration of this project. The steering committee provided valuable insight and oversight to the project. Members of this group included those listed on page 52 and these individuals: • Judy Solberg, Bureau Chief and WIC Director, Iowa Department of Public Health • Connie Betterley, EFNEP Coordinator, Iowa State University (until late 2002) • Peggy Martin, EFNEP Coordinator, Iowa State University (2003-present) The project could not have been completed without the willing participation of the following local WIC agencies and the participants they serve: • Broadlawns WIC Program, Des Moines • Community Action of Southeast Iowa, Burlington • Community Opportunities, Carroll • Hillcrest Family Services, Dubuque • Johnson County Health Department, Iowa City • Mid-Iowa Community Action, Marshalltown • Operation Threshold, Waterloo • Siouxland WIC Program, Sioux City • West Central Development Corporation, Harlan The collaboration and support from the following local EFNEP/FNP program units was also vital to the success of the project: • Black Hawk County, Waterloo • Johnson County, Iowa City • Story County, Ames • Woodbury County, Sioux City
Data sharing between the Iowa Department of Public Health and Iowa State University was capably managed by department employees, Emily Roepsch, Jenni Rowley and Jeff Hoyem. Margaret Long from the Iowa Department of Agriculture and Land Stewardship provided data to allow analysis of redemption rates of WIC Farmers Market Nutrition Program checks.
Iowa WIC Program Page 57

Key data entry and analysis tasks were completed by several individuals at Iowa State University including the following: • Carmen Alvarez, Research Assistant, Department of Food Science and Human Nutrition • S. Patricia Batres-Marquez, Assistant Scientist, Center for Agricultural and Rural
Development • Lizmelia Ortiz, undergraduate student in dietetics • Christine Page Poska, undergraduate student in nutritional science State WIC office staff provided encouraging words, helped assemble training and intervention materials, provided positive reinforcement to participating local agencies, and delivered materials to local WIC and EFNEP offices. Special thanks go to these individuals: • Angie Tagtow • Don Gourley • Holly Szcodronski • Jan Steffen • Jewell Chapman • Ken Kane • Marilyn Jones • Susan Pohl
Page 58 Iowa WIC Program