
Improving Food Access for Poor Households in Indonesia ... · BLSM Bantuan Langsung Sementara...
58
Mabel Josune Gabriel Fernández Second Year Policy Analysis Advisor: Jay Rosengard Section Leader: Rema Hanna March 2015 Client: Coordinating Minister for the People’s Welfare Written in fulfillment of the requirements for the degree of Master in Public Administration in International Development at the John F. Kennedy School of Government, Harvard University IMPROVING FOOD ACCESS FOR POOR HOUSEHOLDS IN INDONESIA: CASH TRANSFERS AND THE RASKIN PROGRAM REFORM
Transcript of Improving Food Access for Poor Households in Indonesia ... · BLSM Bantuan Langsung Sementara...

Mabel Josune Gabriel Fernández
Second Year Policy Analysis
Advisor: Jay Rosengard Section Leader: Rema Hanna
March 2015
Client: Coordinating Minister for the
People’s Welfare
DPI-820 MC, Spring 2015
Written in fulfillment of the requirements for the degree of
Master in Public Administration in International Development
at the John F. Kennedy School of Government,
Harvard University
IMPROVING FOOD ACCESS FOR POOR HOUSEHOLDS IN INDONESIA: CASH TRANSFERS AND THE RASKIN PROGRAM REFORM
2 MABEL JOSUNE GABRIEL FERNÁNDEZ | SECOND YEAR POLICY ANALYSIS
ACKNOWLEDGEMENTS
I would like to thank first and foremost to Jay Rosengard and Hanna for their thoughtful guidance
and advice throughout the year; without your support this analysis would not have been possible.
Likewise, I am sincerely thankful with my SYPA section classmates for their helpful insights. Special
thanks to Jurist Tan.
Moreover, this report would not have been possible without the funding provided by the Ash
Center for Democratic Governance and Innovation as well as the Degree Programs Student Affairs
to travel to Indonesia, enabling research and personal interviews that were invaluable in the writing of
this analysis.
During my time in Indonesia many people contributed with thoughtful comments to inform
the present analysis. I am particularly thankful with those in the World Bank, TNP2K, SMERU, and
J-PAL. Special thanks to Nurzanty for her help to coordinate some of the interviews and to Thalia for
helping as my translator and being my companion during the field work.
I would also like to thank Carol Finney for her support, trust, and motivation throughout this
process. And foremost, I want to thank Hori, my friends, and my family for their love, patience, and
encouragement.
Cover Page Images Sources: (Kepri Update, 2015), (Charity Science, 2015), (Mr.Cheap Justice's Blog)

3 IMPROVING FOOD ACCESS FOR POOR HOUSEHOLDS IN INDONESIA: CASH TRANSFERS AND THE RASKIN PROGRAM REFORM
CONTENTS
ACKNOWLEDGEMENTS ............................................................................................................................. 2
EXECUTIVE SUMMARY................................................................................................................................ 6
1. INTRODUCTION ..................................................................................................................................... 7
2. CONTEXT ................................................................................................................................................ 11
2.1. FOOD SECURITY AND POLICY IN INDONESIA ............................................................................... 11 2.1.1. RASKIN (RICE FOR THE POOR) .................................................................................................. 12
2.1.2. OBJECTIVE ................................................................................................................................. 12 2.1.3. ELIGIBILITY ............................................................................................................................... 12 2.1.4. DISTRIBUTION MECHANISM .................................................................................................... 12
3. THE PROBLEM: RASKIN AS A COSTLY AND LOW EFFECTIVE PROGRAM ................ 13
3.1. RASKIN COSTS .................................................................................................................................... 13 3.2. RASKIN EFFICIENCY ......................................................................................................................... 16
3.2.1. IMPACT ON FOOD CONSUMPTION ............................................................................................ 16 3.2.2. COVERAGE, QUANTITY, AND PRICE ........................................................................................ 16
4. POLICY RECOMMENDATIONS TO IMPROVE POOR HOUSEHOLDS ACCESS TO FOOD ................................................................................................................................................................. 18
4.1. RECOMMENDATION 1. REPLACE IN-KIND TRANSFERS (RASKIN, RICE FOR THE POOR) FOR CASH TRANSFERS: REDUCING COSTS AND IMPROVING EFFECTIVENESS ..................................... 19
4.1.1. TECHNICAL CORRECTNESS ........................................................................................................ 19 4.1.2. COST-EFFECTIVENESS ................................................................................................................ 23 4.1.3. POLITICAL SUPPORTABILITY ...................................................................................................... 24 4.1.4. ADMINISTRATIVE FEASIBILITY .................................................................................................. 28 4.1.5. IMPLEMENTATION STRATEGY AND NEXT STEPS ................................................................... 28
4.2. RECOMMENDATION 2. REVIEW, REDESIGN, AND KEEP RASKIN IN HIGHLY FOOD
INSECURE AND REMOTE AREAS: IMPROVING EFFICIENCY .................................................................... 34 4.2.1. IMPLEMENTATION STRATEGY AND NEXT STEPS ................................................................... 34
5. FOOD VOUCHERS: WHY NOT? ...................................................................................................... 37
5.1. TECHNICAL CORRECTNESS .............................................................................................................. 38 5.2. COST-EFFECTIVENESS ...................................................................................................................... 38 5.3. POLITICAL SUPPORTABILITY ............................................................................................................ 39 5.4. ADMINISTRATIVE FEASIBILITY ........................................................................................................ 39
6. CONCLUSION ........................................................................................................................................ 40
APPENDIX 1. CASE STUDIES AND IMPACT EVALUATIONS SUMMARY .............................. 41
APPENDIX 2. POLICY ALTERNATIVES, EVALUATION METHODOLOGY, AND CRITERIA .......................................................................................................................................................... 43
APPENDIX 3. THEORETICAL FRAMEWORK .................................................................................... 47
APPENDIX 4. STAKEHOLDERS MAPPING ......................................................................................... 49
APPENDIX 5. ASSESSMENT OF LOCAL MARKETS AND FOOD SUPPLY. MECHANISM 1: SUGGESTED FOOD INSECURITY INDEX ......................................................................................... 50
4 MABEL JOSUNE GABRIEL FERNÁNDEZ | SECOND YEAR POLICY ANALYSIS
APPENDIX 6. ADMINISTRATIVE FEASIBILITY EVALUATION ............................................... 52
REFERENCES.................................................................................................................................................. 53
List of Figures
Figure 1 Raskin Procurement and Delivery Process .................................................................................... 13 Figure 2 Social Assistance Program Expenditure Shares, 2010 .................................................................. 14 Figure 3 Raskin Spending Efficiency Indicators, 2005-2009 ....................................................................... 15 Figure 4 Raskin Operational Costs in the Bojonegoro Subregional Division, July 2007 ........................ 15 Figure 5 Raskin Coverage by Subgroup and Decile ..................................................................................... 17 Figure 6 Raskin Purchases and Price .............................................................................................................. 18 Figure 7 Why Did you Buy Less than 15 kg?................................................................................................. 18 Figure 8 Economics of Cash and Food Transfers ........................................................................................ 20 Figure 9 Summary of Differences in Impacts by Transfer Modality and Indicator ................................ 22 Figure 10 Costs (USD) per Transfer and Transfer Ratios ........................................................................... 23 Figure 11 Beneficiary Time and Transportation Costs to Obtain Transfers ............................................ 23 Figure 12 Cost (USD) of increasing a given indicator by 15 percent in Ecuador .................................... 24 Figure 13 Stakeholders Map ............................................................................................................................. 25 Figure 14 Policy Alternatives Ranked by Beneficiaries ................................................................................ 27 Figure 15 Composite Food Security Index .................................................................................................... 30 Figure 16. Distribution Systems Comparison ................................................................................................ 32 Figure 17 Mobile Money Penetration ............................................................................................................. 33 Figure 18 Mobile Telephone and Bank Penetration ..................................................................................... 33 Figure 19 Suggested Measures to Redesign Raskin Processes .................................................................... 36 Figure 20 Summary of Impact Evaluations Description ............................................................................. 41 Figure 21 Summary of Impact Evaluations on Food Consumption and Calorie In-take ....................... 42 Figure 22 Summary of Impact Evaluations on Diet Diversity .................................................................. 42 Figure 23 Policy Alternatives ........................................................................................................................... 45 Figure 24 Methodology and Criteria for Policy Selection ............................................................................ 45 Figure 25 Policy Alternatives Evaluation Summary ..................................................................................... 46 Figure 26 Microeconomic Effects of Cash and In-kind Transfers ............................................................ 47 Figure 27 Effect of Cash and In-kind Transfers on Prices .......................................................................... 48 Figure 28 Stakeholder-issue Interrelationship diagram ................................................................................ 49 Figure 29 Map of Ratio of Per Capita Consumption to Cereal Production ............................................. 50 Figure 30 Map of Villages Not Accessible by Four Wheel Vehicle ........................................................... 50 Figure 31 Map of Underweight Children (<5 years) .................................................................................... 51 Figure 32 Administrative Feasibility Evaluation ........................................................................................... 52 List of Boxes Box 1. Case Studies Analyzed .......................................................................................................................... 10 Box 2 News Quotes .......................................................................................................................................... 26 Box 3. Mobile Money ........................................................................................................................................ 33
5 IMPROVING FOOD ACCESS FOR POOR HOUSEHOLDS IN INDONESIA: CASH TRANSFERS AND THE RASKIN PROGRAM REFORM
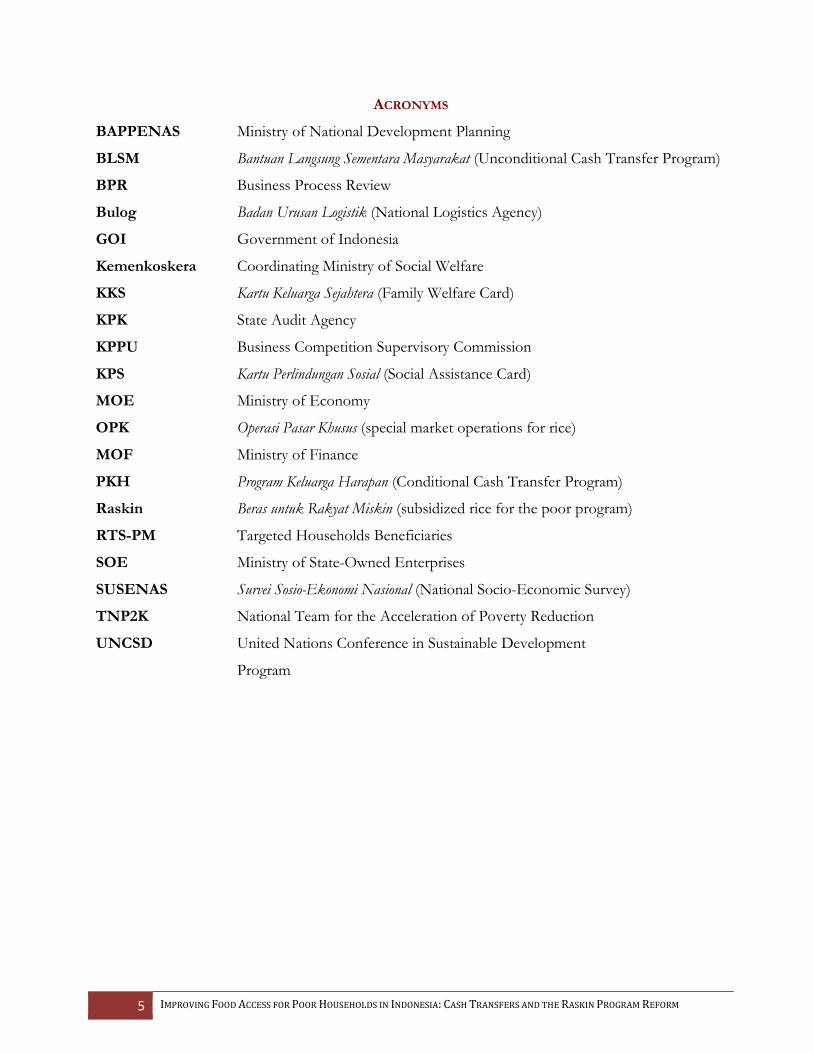
ACRONYMS
BAPPENAS Ministry of National Development Planning
BLSM Bantuan Langsung Sementara Masyarakat (Unconditional Cash Transfer Program)
BPR Business Process Review
Bulog Badan Urusan Logistik (National Logistics Agency)
GOI Government of Indonesia
Kemenkoskera Coordinating Ministry of Social Welfare
KKS Kartu Keluarga Sejahtera (Family Welfare Card)
KPK State Audit Agency
KPPU Business Competition Supervisory Commission
KPS Kartu Perlindungan Sosial (Social Assistance Card)
MOE Ministry of Economy
OPK Operasi Pasar Khusus (special market operations for rice)
MOF Ministry of Finance
PKH Program Keluarga Harapan (Conditional Cash Transfer Program)
Raskin Beras untuk Rakyat Miskin (subsidized rice for the poor program)
RTS-PM Targeted Households Beneficiaries
SOE Ministry of State-Owned Enterprises
SUSENAS Survei Sosio-Ekonomi Nasional (National Socio-Economic Survey)
TNP2K National Team for the Acceleration of Poverty Reduction
UNCSD United Nations Conference in Sustainable Development
Program
6 MABEL JOSUNE GABRIEL FERNÁNDEZ | SECOND YEAR POLICY ANALYSIS
EXECUTIVE SUMMARY
Although Indonesia has more than enough resources to ensure food availability for all its population,
many Indonesians still do not have enough to eat, ranking 73th out of 109 countries in food
affordability. Moreover, the current government program to guarantee food access for the poor
(Raskin, Rice for the Poor) is costly and low effective. Raskin represents 53 percent of all household-
targeted social assistance spending (2.15 billion USD in 2013) and is quite poorly targeted so that the
benefits which accrue to the poor are minimal (17% of the total costs) and most of the subsidy goes
into the National Logistics Agency (Bulog) operating costs1.
Policy Recommendations
1. Replace in-kind transfers (Raskin) for cash transfers. Reducing costs and improving
effectiveness. Cash transfers have a greater impact on beneficiaries’ diet diversity, lower
administrative and operational costs, and prevent discretional misallocation of benefits. Being
politically feasible and strongly supported by the central government it would be effortlessly
implemented by using the current system of the unconditional cash transfers program currently
distributed in Indonesia.
2. Review, redesign, and keep Raskin in highly food insecure and remote areas: Improving
effectiveness. Raskin in-kind transfers are better fitted for remote areas where food supply is
scarce, markets are not well developed and distribution costs are high. Narrowing in-kind transfers
to food insecure regions would diminish logistics costs. Moreover, improvements in oversight and
evaluation could avoid misallocation of rice, low quality, and price manipulations, increasing the
program’s cost-effectiveness.
An implementation strategy for each of these recommendations is also provided. Some of the
steps required to be followed are: i) assessment of market conditions; ii) improve the targeting
mechanism; iii) estimate the cash transfer amount; iv) evaluate distribution systems; and, v) implement
a Business Process Review (BPR), among others.
It is in the interest of the Government of Indonesia (GOI) to move from a very costly and
low effective in-kind transfers program to one that will bring significant savings for the government
budget while the poor will get the full amount of the intended benefit.
1 (The World Bank, BLT Temporary Unconditional Cash Transfer Social Assistance Program and Public Expenditure Review 2, 2012)

7 IMPROVING FOOD ACCESS FOR POOR HOUSEHOLDS IN INDONESIA: CASH TRANSFERS AND THE RASKIN PROGRAM REFORM
1. INTRODUCTION
To achieve Indonesia’s food security, food should be available, accessible, and properly utilized by
people at all times. On this regard, Indonesia’s main challenge is not to produce enough food for the
whole country population but rather to provide the poor with economic access to the available food.
Food security in Indonesia depends strongly on rice as it is the most important commodity
for Indonesian households, particularly for the poorest who spend about a quarter of their average
monthly expenditures in purchasing rice2. Based on this, the GOI currently implements the Raskin
program, to ensure continued access among the poor to affordable rice, the basic staple food for the
majority of Indonesians. Raskin is one of the few programs with national scope, getting to around
80% of the targeted households.
Raskin, which aims to provide food security to poor households, is the largest social assistance
program in Indonesia, representing almost 53 percent of all targeted social assistance expenditures3.
However, several studies have pointed out that this program has some weaknesses. In practice,
eligible households receive only one-third (~5 kg) of the amount of rice they are eligible to receive
(~15 kg) and at a cost that is 25 percent higher (2,000 Rupiah) than their entitled subsidy (1,600
Rupiah). Regarding leakages, nearly 70 percent of households that purchase subsidized rice are non-
poor. Although it should be mentioned this is due to village and community decisions.
Given the importance of rice for poor Indonesian households, and the costs and
ineffectiveness of the Raskin program, there is an increasing pressure for the government to improve
the efficiency of the current policy or implement better designed mechanisms for Indonesia’s context.
Efforts to improve the Raskin program are under way, mainly led by the Vice President’s National
Team for the Acceleration of Poverty Reduction (TNP2K), the State Ministry of National
Development Planning (BAPPENAS) and the World Bank. Given that the government is opening an
opportunity to make a huge impact on Indonesia’s food security policy and willing to contribute to
this journey, this document presents an analysis of different feasible policy alternatives that could
improve food access for the poor in Indonesia.
Based on the literature review, there seem to be three major policy interventions. The first
interventions influence food availability through changes in domestic production, production
subsidies, imports, or exports. The second intervention is reducing prices to consumers (some or all)
2 (Timmer P. , 2004) 3 (The World Bank, Raskin Subsidized Rice Delivery. Social Assistance Program and Public Expenditure Review 3, 2012)
8 MABEL JOSUNE GABRIEL FERNÁNDEZ | SECOND YEAR POLICY ANALYSIS
without altering prices to producer (i.e. consumption subsidies). Third, increasing income by different
means other than reducing prices, e.g. cash and in-kind transfers.
Particularly for the third category of interventions, it is possible to find a large number of
studies for different countries although only a few for Indonesia. Most of these studies are based on
experimental and quasi-experimental techniques conducted in different contexts such as natural
disasters, emergencies, social protection systems etc. For instance, Cunha (2014) uses the
experimental Programa de Apoyo Alimentario (PAL) in Mexico data to estimate the impacts between the
cash and food transfers finding that food transfer had a higher impact in calorie intake compared to
cash transfers. Another example is a randomized study comparing impact and cost-effectiveness of
cash, vouchers, and food aid for Colombian refugees in Ecuador which found that impact of food on
per capita caloric intake is significantly larger than that of a cash transfer (Hidrobo, 2014).
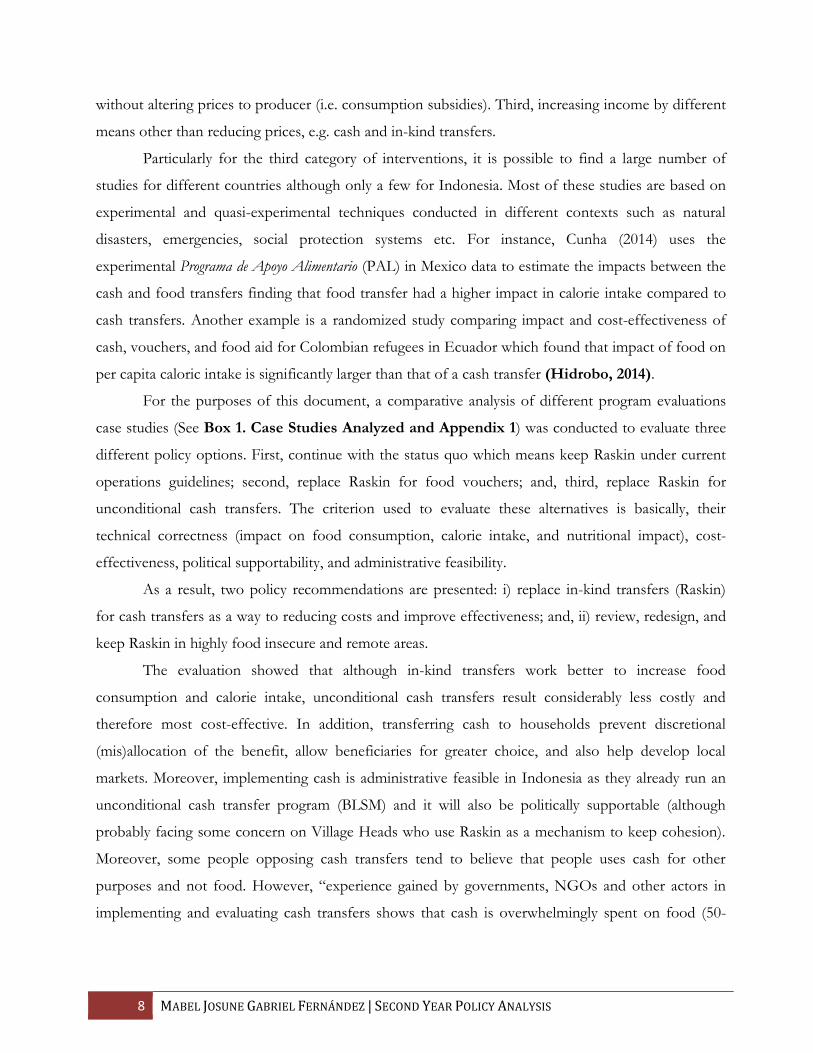
For the purposes of this document, a comparative analysis of different program evaluations
case studies (See Box 1. Case Studies Analyzed and Appendix 1) was conducted to evaluate three
different policy options. First, continue with the status quo which means keep Raskin under current
operations guidelines; second, replace Raskin for food vouchers; and, third, replace Raskin for
unconditional cash transfers. The criterion used to evaluate these alternatives is basically, their
technical correctness (impact on food consumption, calorie intake, and nutritional impact), cost-
effectiveness, political supportability, and administrative feasibility.
As a result, two policy recommendations are presented: i) replace in-kind transfers (Raskin)
for cash transfers as a way to reducing costs and improve effectiveness; and, ii) review, redesign, and
keep Raskin in highly food insecure and remote areas.
The evaluation showed that although in-kind transfers work better to increase food
consumption and calorie intake, unconditional cash transfers result considerably less costly and
therefore most cost-effective. In addition, transferring cash to households prevent discretional
(mis)allocation of the benefit, allow beneficiaries for greater choice, and also help develop local
markets. Moreover, implementing cash is administrative feasible in Indonesia as they already run an
unconditional cash transfer program (BLSM) and it will also be politically supportable (although
probably facing some concern on Village Heads who use Raskin as a mechanism to keep cohesion).
Moreover, some people opposing cash transfers tend to believe that people uses cash for other
purposes and not food. However, “experience gained by governments, NGOs and other actors in
implementing and evaluating cash transfers shows that cash is overwhelmingly spent on food (50-
9 IMPROVING FOOD ACCESS FOR POOR HOUSEHOLDS IN INDONESIA: CASH TRANSFERS AND THE RASKIN PROGRAM REFORM
60%), basic essentials, agricultural inputs and loan repayment. There are few anecdotes on cash
diverted to undesirable uses”4.
Furthermore, the analysis presented shows that cash transfers are not well fitted for highly
food insecure areas where food supply is scarce, markets do not work well, and private sector
participation is low due to difficulty on accessing and high distribution costs. On these cases, in-kind
transfers such as the Raskin program would be better suited, conditional to an increase of oversight
and evaluation to increase Raskin effectiveness.
It is in the interest of the GOI to focus its efforts and resources on implementing the policy
changes suggested as this will actively contribute to move from a very costly and low effective
program to one that will bring significant savings for the government budget while the poor will get
the full amount of the intended benefit for them. Moreover, savings coming from the lower
operational and administrative costs of cash transfers (relative to Raskin) could be allocated to new or
existing program that would bring a larger benefit for Indonesian households and for the country as a
whole.
The remainder of the document proceeds as follows. Section 2 provides background on food
security and policy in Indonesia as well as details on the Raskin program operations; Section 3
describes the problems that motivated the analysis; Section 4 presents the primary policy
recommendations and implementation strategy; Section 5 explains why the other policy alternatives
analyzed were not appropriate; and Section 6 concludes.
4 (World Food Programme, 2006)
10 MABEL JOSUNE GABRIEL FERNÁNDEZ | SECOND YEAR POLICY ANALYSIS
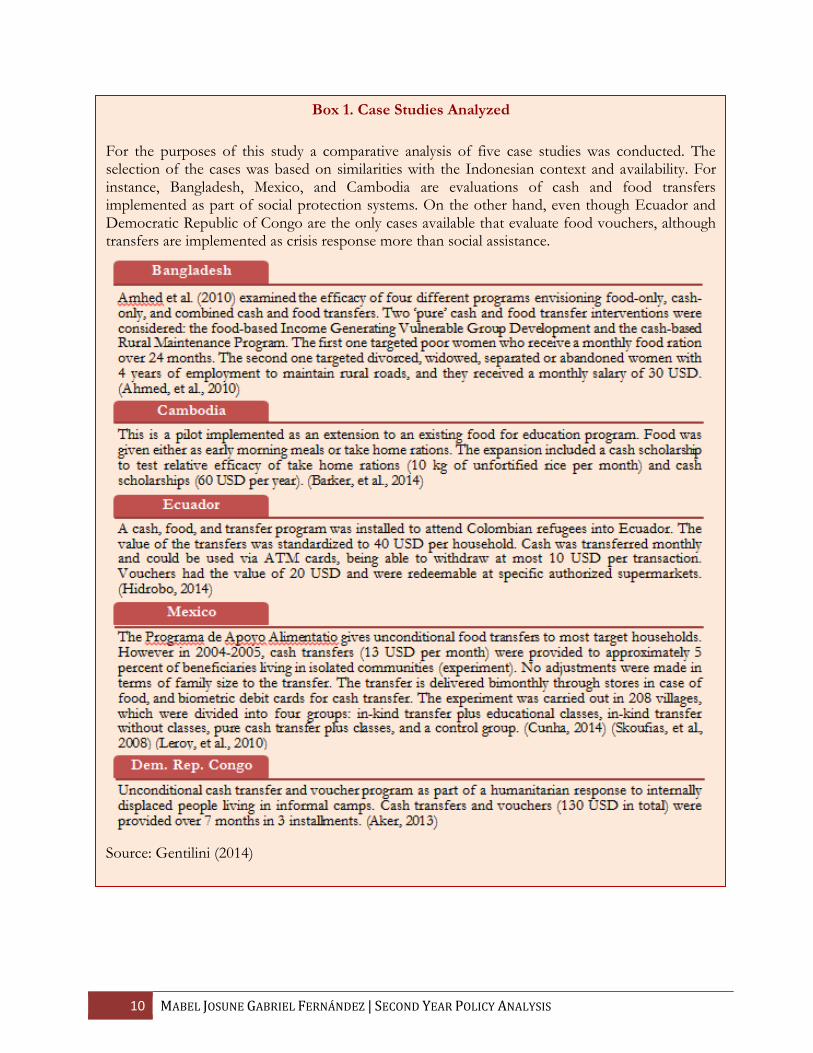
Box 1. Case Studies Analyzed
For the purposes of this study a comparative analysis of five case studies was conducted. The selection of the cases was based on similarities with the Indonesian context and availability. For instance, Bangladesh, Mexico, and Cambodia are evaluations of cash and food transfers implemented as part of social protection systems. On the other hand, even though Ecuador and Democratic Republic of Congo are the only cases available that evaluate food vouchers, although transfers are implemented as crisis response more than social assistance.
Source: Gentilini (2014)

2. CONTEXT
2.1. FOOD SECURITY AND POLICY IN INDONESIA
Food security as defined by the United Nations Conference in Sustainable Development
Program Secretariat, “exists when all people, at all times, have physical, social and economic access
to sufficient, safe and nutritious food to meet their dietary needs and food preferences for an active
and healthy life5”. Based on this definition, the literature identifies three pillars of food security:
availability, access, and utilization”6.
Food availability is the physical presence of food in the area through all forms of domestic
production, imports, and food aid. Food access is a household’s ability to acquire adequate amounts
and diversity of food, through own production, stocks, purchases, gifts, borrowing and food aid7.
Finally, food utilization refers to appropriate nutrition and hygiene8.
Although Indonesia has more than enough resources to ensure food availability for all its
population, over 9.1 percent of the population is currently undernourished while around 20 percent
of children under 5 years were underweight in 20109. As a result, Indonesia ranks 63th out of 109
countries based on the food availability index and drops 10 places (73th) when talking about food
affordability. Likewise, when comparing Indonesia to similar countries in the Asia and Pacific region
in food security, it is ranked 15th out of 22nd 10.
Indonesia’s food security depends strongly on rice as it is the most important commodity for
Indonesian households, particularly for the poorest. A representative Indonesian household gets
nearly half of its food energy from rice and spends 10 percent of its income procuring it. On the
other hand, poor households allocate 20 - 25 percent of their total expenditures to rice11.
As a result, the GOI has implemented several programs looking to secure access to rice for
the poor, either by stabilizing rice prices in the market or providing in-kind rice transfers to the
poor. Trade policy, government procurement, reserves stock, and direct market operations such as
Operasi Pasar Khusus (OPK) are some of the policies intended to stabilize market prices, while there is
only one program targeted for low-income households which aims to reduce the economic burden
of rice prices volatility by providing in-kind transfers at a subsidized price: Raskin (Rice for the
Poor).
5 (Rio 2012 Issues Brief, 2011) 6 (World Summit on Food Security, 2009) 7 (World Food Programme, 2009) 8 (Warr, 2014) 9 (Global Food Security Index, 2015) 10 (Global Food Security Index, 2015) 11 (Timmer P. , 2004)
12 MABEL JOSUNE GABRIEL FERNÁNDEZ | SECOND YEAR POLICY ANALYSIS
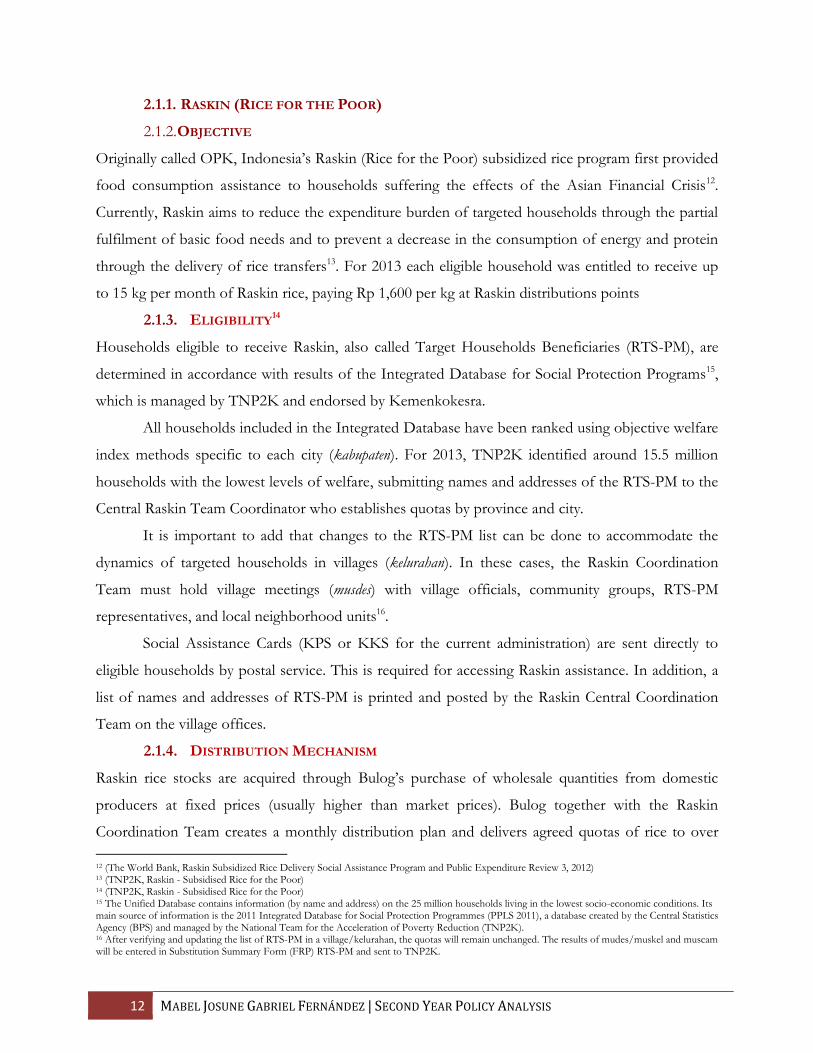
2.1.1. RASKIN (RICE FOR THE POOR)
2.1.2. OBJECTIVE
Originally called OPK, Indonesia’s Raskin (Rice for the Poor) subsidized rice program first provided
food consumption assistance to households suffering the effects of the Asian Financial Crisis12.
Currently, Raskin aims to reduce the expenditure burden of targeted households through the partial
fulfilment of basic food needs and to prevent a decrease in the consumption of energy and protein
through the delivery of rice transfers13. For 2013 each eligible household was entitled to receive up
to 15 kg per month of Raskin rice, paying Rp 1,600 per kg at Raskin distributions points
2.1.3. ELIGIBILITY14
Households eligible to receive Raskin, also called Target Households Beneficiaries (RTS-PM), are
determined in accordance with results of the Integrated Database for Social Protection Programs15,
which is managed by TNP2K and endorsed by Kemenkokesra.
All households included in the Integrated Database have been ranked using objective welfare
index methods specific to each city (kabupaten). For 2013, TNP2K identified around 15.5 million
households with the lowest levels of welfare, submitting names and addresses of the RTS-PM to the
Central Raskin Team Coordinator who establishes quotas by province and city.
It is important to add that changes to the RTS-PM list can be done to accommodate the
dynamics of targeted households in villages (kelurahan). In these cases, the Raskin Coordination
Team must hold village meetings (musdes) with village officials, community groups, RTS-PM
representatives, and local neighborhood units16.
Social Assistance Cards (KPS or KKS for the current administration) are sent directly to
eligible households by postal service. This is required for accessing Raskin assistance. In addition, a
list of names and addresses of RTS-PM is printed and posted by the Raskin Central Coordination
Team on the village offices.
2.1.4. DISTRIBUTION MECHANISM
Raskin rice stocks are acquired through Bulog’s purchase of wholesale quantities from domestic
producers at fixed prices (usually higher than market prices). Bulog together with the Raskin
Coordination Team creates a monthly distribution plan and delivers agreed quotas of rice to over
12 (The World Bank, Raskin Subsidized Rice Delivery Social Assistance Program and Public Expenditure Review 3, 2012) 13 (TNP2K, Raskin - Subsidised Rice for the Poor) 14 (TNP2K, Raskin - Subsidised Rice for the Poor) 15 The Unified Database contains information (by name and address) on the 25 million households living in the lowest socio-economic conditions. Its main source of information is the 2011 Integrated Database for Social Protection Programmes (PPLS 2011), a database created by the Central Statistics Agency (BPS) and managed by the National Team for the Acceleration of Poverty Reduction (TNP2K). 16 After verifying and updating the list of RTS-PM in a village/kelurahan, the quotas will remain unchanged. The results of mudes/muskel and muscam will be entered in Substitution Summary Form (FRP) RTS-PM and sent to TNP2K.
13 IMPROVING FOOD ACCESS FOR POOR HOUSEHOLDS IN INDONESIA: CASH TRANSFERS AND THE RASKIN PROGRAM REFORM
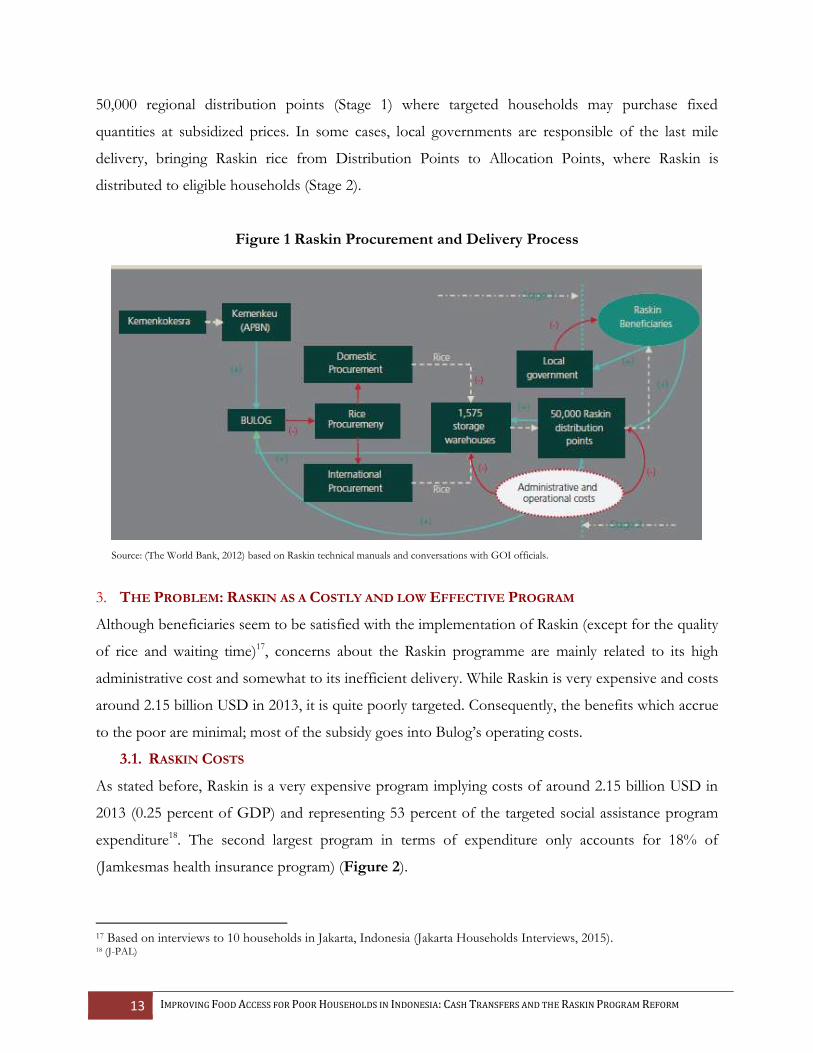
50,000 regional distribution points (Stage 1) where targeted households may purchase fixed
quantities at subsidized prices. In some cases, local governments are responsible of the last mile
delivery, bringing Raskin rice from Distribution Points to Allocation Points, where Raskin is
distributed to eligible households (Stage 2).
Figure 1 Raskin Procurement and Delivery Process
Source: (The World Bank, 2012) based on Raskin technical manuals and conversations with GOI officials.
3. THE PROBLEM: RASKIN AS A COSTLY AND LOW EFFECTIVE PROGRAM
Although beneficiaries seem to be satisfied with the implementation of Raskin (except for the quality
of rice and waiting time)17, concerns about the Raskin programme are mainly related to its high
administrative cost and somewhat to its inefficient delivery. While Raskin is very expensive and costs
around 2.15 billion USD in 2013, it is quite poorly targeted. Consequently, the benefits which accrue
to the poor are minimal; most of the subsidy goes into Bulog’s operating costs.
3.1. RASKIN COSTS
As stated before, Raskin is a very expensive program implying costs of around 2.15 billion USD in
2013 (0.25 percent of GDP) and representing 53 percent of the targeted social assistance program
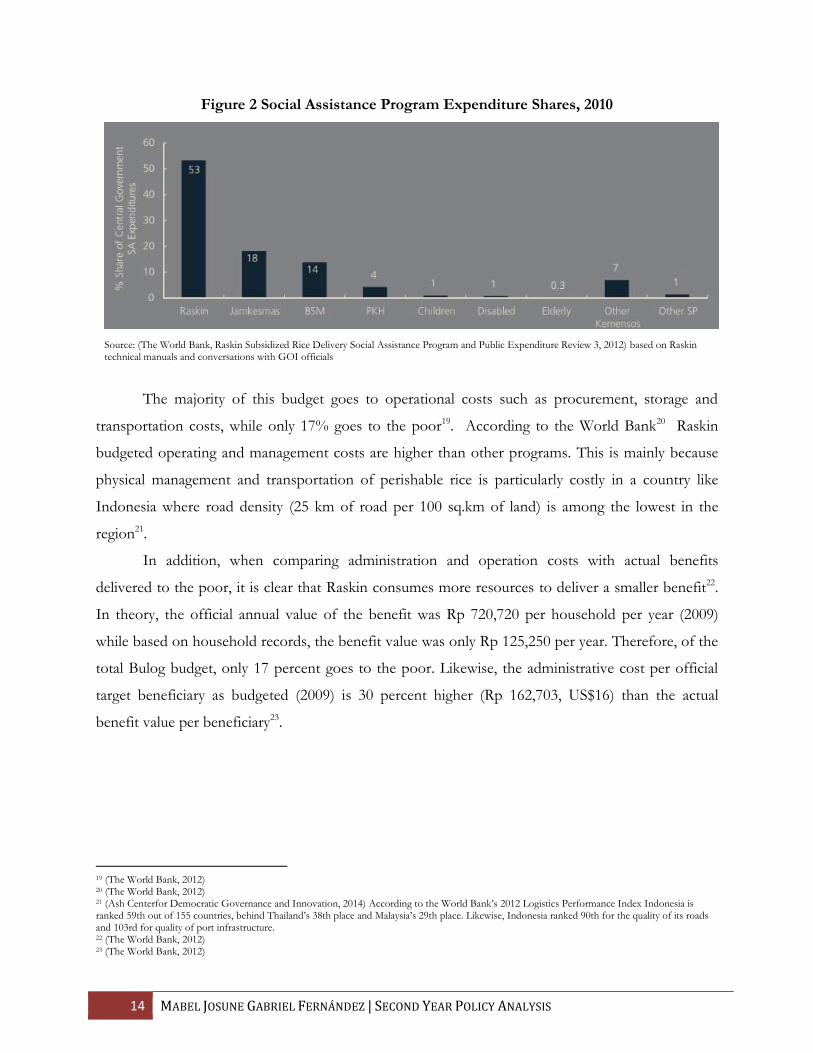
expenditure18. The second largest program in terms of expenditure only accounts for 18% of
(Jamkesmas health insurance program) (Figure 2).
17 Based on interviews to 10 households in Jakarta, Indonesia (Jakarta Households Interviews, 2015). 18 (J-PAL)
14 MABEL JOSUNE GABRIEL FERNÁNDEZ | SECOND YEAR POLICY ANALYSIS
Figure 2 Social Assistance Program Expenditure Shares, 2010
Source: (The World Bank, Raskin Subsidized Rice Delivery Social Assistance Program and Public Expenditure Review 3, 2012) based on Raskin technical manuals and conversations with GOI officials
The majority of this budget goes to operational costs such as procurement, storage and
transportation costs, while only 17% goes to the poor19. According to the World Bank20 Raskin
budgeted operating and management costs are higher than other programs. This is mainly because
physical management and transportation of perishable rice is particularly costly in a country like
Indonesia where road density (25 km of road per 100 sq.km of land) is among the lowest in the
region21.
In addition, when comparing administration and operation costs with actual benefits
delivered to the poor, it is clear that Raskin consumes more resources to deliver a smaller benefit22.
In theory, the official annual value of the benefit was Rp 720,720 per household per year (2009)
while based on household records, the benefit value was only Rp 125,250 per year. Therefore, of the
total Bulog budget, only 17 percent goes to the poor. Likewise, the administrative cost per official
target beneficiary as budgeted (2009) is 30 percent higher (Rp 162,703, US$16) than the actual
benefit value per beneficiary23.
19 (The World Bank, 2012) 20 (The World Bank, 2012) 21 (Ash Centerfor Democratic Governance and Innovation, 2014) According to the World Bank’s 2012 Logistics Performance Index Indonesia is ranked 59th out of 155 countries, behind Thailand’s 38th place and Malaysia’s 29th place. Likewise, Indonesia ranked 90th for the quality of its roads and 103rd for quality of port infrastructure. 22 (The World Bank, 2012) 23 (The World Bank, 2012)

15 IMPROVING FOOD ACCESS FOR POOR HOUSEHOLDS IN INDONESIA: CASH TRANSFERS AND THE RASKIN PROGRAM REFORM
Figure 3 Raskin Spending Efficiency Indicators, 2005-2009
Source: (The World Bank, 2012)
As a particular example to illustrate excessive operational costs of the Raslkin program, in
July 2007, in the Bojonegoro subregional division in East Java, the total Raskin operation costs
reached Rp 280.8 million (to distribute 2,456 tons of rice to 1,232 distribution points) and 43
percent of this amount was allocated only to transportation while other costs at the distribution
point accounted for 25 percent. (Figure 4).
Figure 4 Raskin Operational Costs in the Bojonegoro Subregional Division, July 2007
Source: (Hastuti, 2008)
16 MABEL JOSUNE GABRIEL FERNÁNDEZ | SECOND YEAR POLICY ANALYSIS
3.2. RASKIN EFFICIENCY
Several studies in recent years have highlighted some weaknesses of Raskin in terms of coverage,
quantity, quality, and price of rice allocated. However, only a few have actually focused on the
impact of Raskin in food consumption. Nevertheless, it should be mentioned that Raskin is actually
getting to around 80% of the targeted households24 and that even though the amount of rice
allocated to each households is less than the intended, this is a result of a community decision.
Moreover, Raskin is one of the few programs with national scope and its organizational
infrastructure plays an important role in cases of extreme food insecurity were in-kind transfers
perform better.
3.2.1. IMPACT ON FOOD CONSUMPTION
The evidence of impact of Raskin in food consumption is mixed. On one hand, Sumarto, Suryahadi
and Widiyanti (2005)25 reported that participation in Raskin increased household consumption by 4.4
per cent and that recipient households are 3.8 per cent less likely to be poor compared to their
counterparts. On the other hand, Pangaribowo (2012) found that the program has no impact on
both ‘total’ food and non-food consumption and consumption change, but it indeed helps the
program recipients in smoothing within food consumption, particularly for them to afford meat, fish
and dairy products26.
3.2.2. COVERAGE, QUANTITY, AND PRICE
Raskin is intended for poor and near-poor households but it has been extended to non-poor
households based on community decisions. As rice is distributed to more households, eligible
households receive only one-third of the amount intended and pay 25 percent more than the official
subsidized price; this is mostly to pay for delivery costs from distribution points to villages, not
funded by central government.
As explained before, selecting beneficiaries is a two-stage process that includes village-level
consultation while the current Raskin manuals do not mandate that the list of poor households
should be used in the village meetings and does not state that beneficiaries must in fact be poor27.
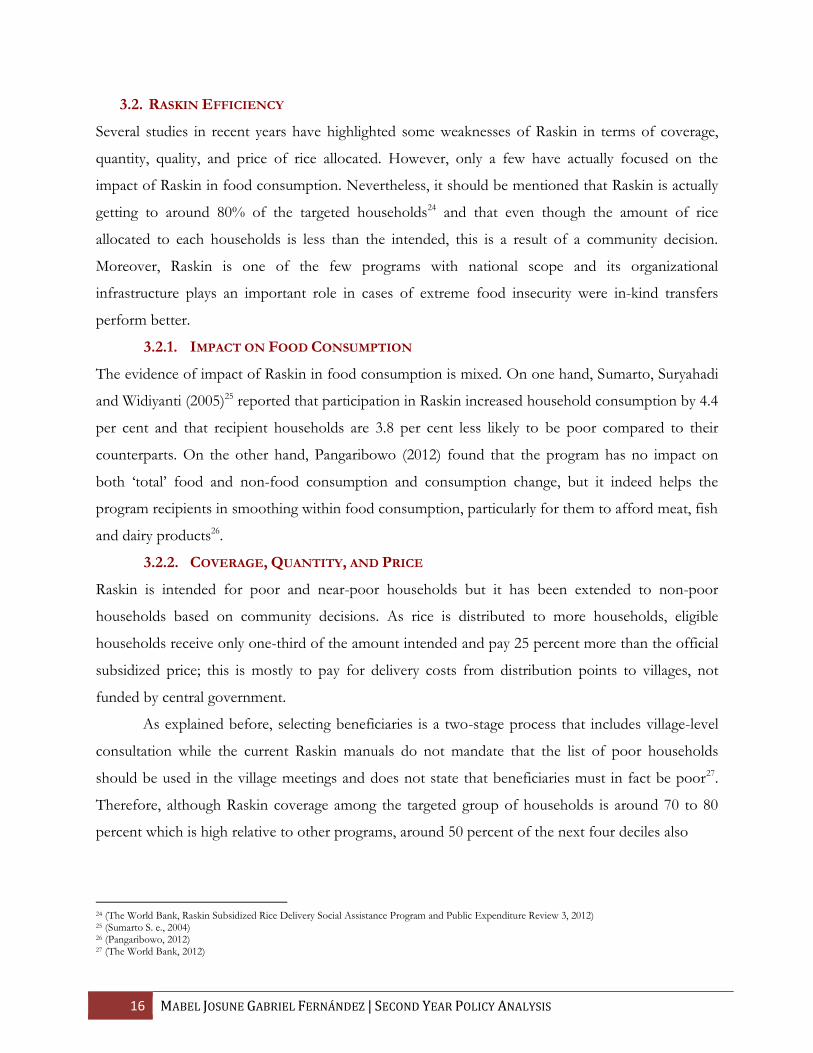
Therefore, although Raskin coverage among the targeted group of households is around 70 to 80
percent which is high relative to other programs, around 50 percent of the next four deciles also
24 (The World Bank, Raskin Subsidized Rice Delivery Social Assistance Program and Public Expenditure Review 3, 2012) 25 (Sumarto S. e., 2004) 26 (Pangaribowo, 2012) 27 (The World Bank, 2012)
17 IMPROVING FOOD ACCESS FOR POOR HOUSEHOLDS IN INDONESIA: CASH TRANSFERS AND THE RASKIN PROGRAM REFORM
participate, and even 23
percent of the second richest
decile, leading to nearly 70
percent of all beneficiaries
being non-poor and getting
over half of all program
benefits 28 (Figure 5).
In practice, eligible
households receive only one-
third (around 5 kg) of the
amount of rice they are
eligible to receive (15 kg) and
at a cost that is 25 percent
higher (around 2,000
Rupiah/Kg) than their entitled
subsidy (1,600 Rupiah/Kg)29.
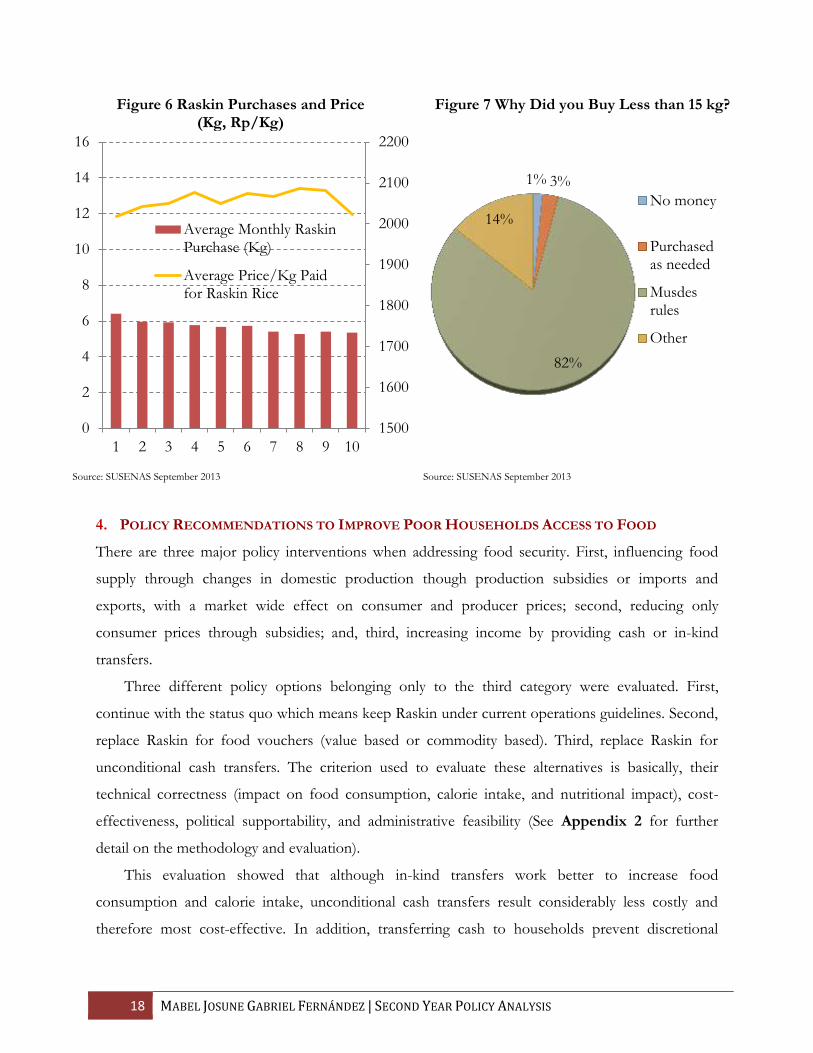
The main reason for people getting less than 15 kg of rice are the decisions made at village meetings
or musdes to split the rice equally (Figure 7). On the other hand, Raskin General Guidelines
encourage the community to contribute towards the cost of distributing the rice from the
distribution points to beneficiaries30 given that Bulog vehicles cannot intern in certain villages. This
is realized in the form of payments for the rice that are higher than the official price at the
distribution points (Figure 6).
28 (The World Bank, 2012), (Widianto, 2013), and SUSENAS September 2013 data. 29 (J-PAL) 30 (Hastuti, 2008)
Figure 5 Raskin Coverage by Subgroup and Decile Compared to that of =ther Programs
Source: (Widianto, 2013)
Households Expenditure Decile
Perc
en
tag
eo
f R
ecip
ien
ts
18 MABEL JOSUNE GABRIEL FERNÁNDEZ | SECOND YEAR POLICY ANALYSIS
Figure 6 Raskin Purchases and Price (Kg, Rp/Kg)
Figure 7 Why Did you Buy Less than 15 kg?
Source: SUSENAS September 2013 Source: SUSENAS September 2013
4. POLICY RECOMMENDATIONS TO IMPROVE POOR HOUSEHOLDS ACCESS TO FOOD
There are three major policy interventions when addressing food security. First, influencing food
supply through changes in domestic production though production subsidies or imports and
exports, with a market wide effect on consumer and producer prices; second, reducing only
consumer prices through subsidies; and, third, increasing income by providing cash or in-kind
transfers.
Three different policy options belonging only to the third category were evaluated. First,
continue with the status quo which means keep Raskin under current operations guidelines. Second,
replace Raskin for food vouchers (value based or commodity based). Third, replace Raskin for
unconditional cash transfers. The criterion used to evaluate these alternatives is basically, their
technical correctness (impact on food consumption, calorie intake, and nutritional impact), cost-
effectiveness, political supportability, and administrative feasibility (See Appendix 2 for further
detail on the methodology and evaluation).
This evaluation showed that although in-kind transfers work better to increase food
consumption and calorie intake, unconditional cash transfers result considerably less costly and
therefore most cost-effective. In addition, transferring cash to households prevent discretional
1500
1600
1700
1800
1900
2000
2100
2200
0
2
4
6
8
10
12
14
16
1 2 3 4 5 6 7 8 9 10
Average Monthly RaskinPurchase (Kg)
Average Price/Kg Paidfor Raskin Rice
1% 3%
82%
14%
No money
Purchasedas needed
Musdesrules
Other

19 IMPROVING FOOD ACCESS FOR POOR HOUSEHOLDS IN INDONESIA: CASH TRANSFERS AND THE RASKIN PROGRAM REFORM
(mis)allocation of the benefit, allow beneficiaries for greater choice, and also help develop local
markets. Moreover, implementing cash is administrative feasible in Indonesia as they already run an
unconditional cash transfer program (BLSM) and it will also be politically supportable (although
probably facing some concern on Village Heads who use Raskin as a mechanism to keep cohesion).
Furthermore, the analysis showed that cash transfers are not well fitted for highly food insecure
areas where food supply is scarce, markets do not work well, and private sector participation is low
due to difficulty on accessing and high distribution costs. On these cases, in-kind transfers such as
the Raskin program would be better suited, conditional to an increase of oversight and evaluation to
increase Raskin effectiveness.
4.1. RECOMMENDATION 1. REPLACE IN-KIND TRANSFERS (RASKIN, RICE FOR THE
POOR) FOR CASH TRANSFERS: REDUCING COSTS AND IMPROVING EFFECTIVENESS
Replacing Raskin for the provision of unconditional cash transfers will result on a more cost-
effective mechanism to guarantee food access for the poor under particular conditions. Although it
is not clear that cash will increase beneficiaries’ food consumption more than in-kind transfers, they
they will contribute to diversify diets, and lower administrative and operational costs, were food
supply is enough, and well developed markets. Moreover, this policy would be politically supported
by the President and central government, while administratively; it would be effortlessly
implemented by using the current system of the unconditional cash transfers program (BLSM).
4.1.1. TECHNICAL CORRECTNESS
In order to evaluate the technical correctness of the policy proposed, both the theoretical framework
and empirical evidence are considered. The economic theory as well as necessary conditions for the
implementation of cash is reviewed, while for the empirical analysis, technical correctness is
measured based on the impact of each policy alternative on two food access indicators: food
consumption and calorie intake of beneficiaries.
Definitions and Theoretical Framework
An unconditional cash transfer consists on the provision of assistance in the form of cash to the
poor or to those vulnerable to become poor in the absence of that transfer. Advocates of cash
transfers argue that if the program is well designed and implemented, cash transfers can improve
beneficiary satisfaction and reduce program costs, contributing to general economic development31.
According to the literature and economic theory, if the amount of rice provided is smaller
than the amount consumed by beneficiaries (inframarginal) then in-kind transfers and a cash
31 (Magen M., 2009)

20 MABEL JOSUNE GABRIEL FERNÁNDEZ | SECOND YEAR POLICY ANALYSIS
transfers of equal value would have the same effect in bolstering household food consumption.
However, if in-kind transfers exceed the amount consumed (extramarginal), then, food consumption
out of in-kind transfers would be larger than for an equal cash transfer due to the price effect32 (see
Appendix 3 for a more detailed explanation). However, as stated by Gentilitni (2004), the empirical
evidence usually rejects the model’s predictions and shows that even for inframarginal in-kind
transfers, these would increase food consumption more than cash transfers. The existence of this
cash-out puzzle is an accepted empirical fact, although the reasons behind remains unclear.
Figure 8 Economics of Cash and Food Transfers
Source: (Gentilini H. , 2007)
Context for Cash Transfer Use
According to (Magen M., 2009), for cash transfers to be appropriate and successful as a response to
food insecurity, the following preconditions should be met:
a) Supply of food is enough and the main problem is households ability to purchase food;
b) Markets functioning well and are able to meet an increased demand for food with sufficient
supply to avoid inflation;
c) Cash is useful to obtain food;
d) Administrative and financial systems function well enough to prevent fraud; and
e) Households are safe from theft and violence if they receive transfers.
Impact on Food Consumption
One of the most used indicators when looking at the empirical evidence on evaluations of food
access policies is food consumption, measured in terms of the value of food consumed during a
period of time or the money spent on food. Based on the case studies considered for this study (See
Box 1. Case Studies Analyzed), it seems that the evidence is not conclusive about which
mechanism (cash or in-kind) has a higher impact on food consumption.
32 (Gentilini H. , 2014)
21 IMPROVING FOOD ACCESS FOR POOR HOUSEHOLDS IN INDONESIA: CASH TRANSFERS AND THE RASKIN PROGRAM REFORM
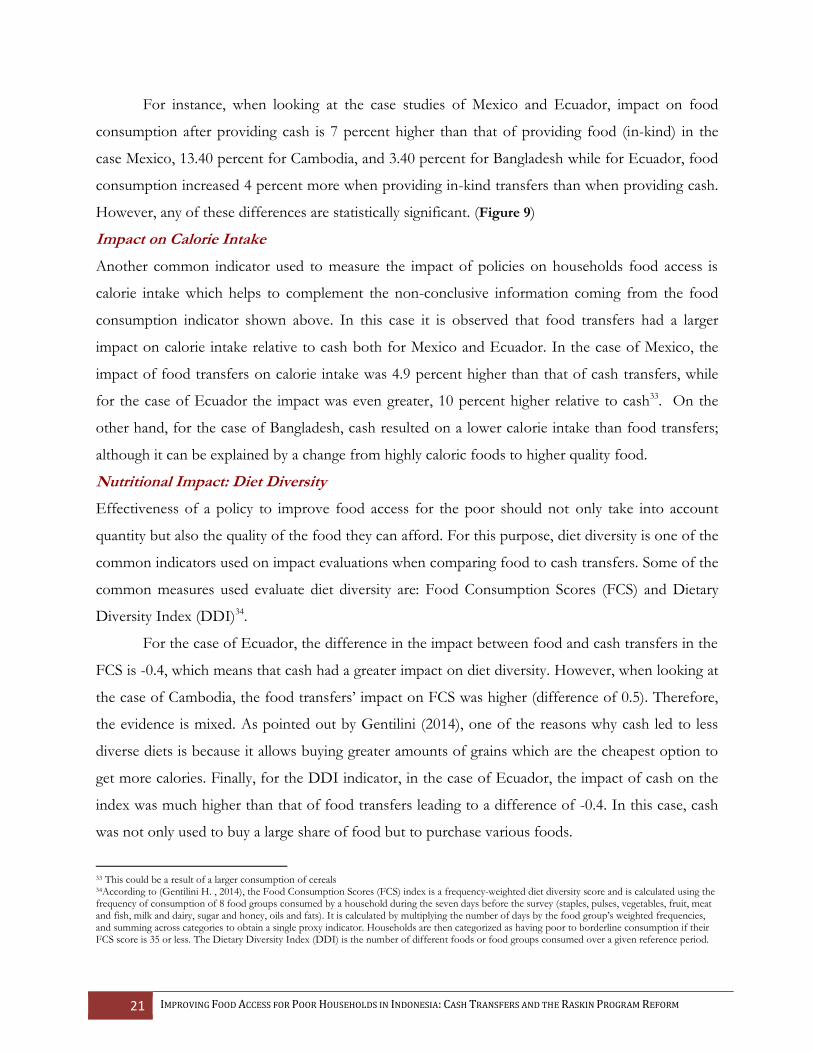
For instance, when looking at the case studies of Mexico and Ecuador, impact on food
consumption after providing cash is 7 percent higher than that of providing food (in-kind) in the
case Mexico, 13.40 percent for Cambodia, and 3.40 percent for Bangladesh while for Ecuador, food
consumption increased 4 percent more when providing in-kind transfers than when providing cash.
However, any of these differences are statistically significant. (Figure 9)
Impact on Calorie Intake
Another common indicator used to measure the impact of policies on households food access is
calorie intake which helps to complement the non-conclusive information coming from the food
consumption indicator shown above. In this case it is observed that food transfers had a larger
impact on calorie intake relative to cash both for Mexico and Ecuador. In the case of Mexico, the
impact of food transfers on calorie intake was 4.9 percent higher than that of cash transfers, while
for the case of Ecuador the impact was even greater, 10 percent higher relative to cash33. On the
other hand, for the case of Bangladesh, cash resulted on a lower calorie intake than food transfers;
although it can be explained by a change from highly caloric foods to higher quality food.
Nutritional Impact: Diet Diversity
Effectiveness of a policy to improve food access for the poor should not only take into account
quantity but also the quality of the food they can afford. For this purpose, diet diversity is one of the
common indicators used on impact evaluations when comparing food to cash transfers. Some of the
common measures used evaluate diet diversity are: Food Consumption Scores (FCS) and Dietary
Diversity Index (DDI)34.
For the case of Ecuador, the difference in the impact between food and cash transfers in the
FCS is -0.4, which means that cash had a greater impact on diet diversity. However, when looking at
the case of Cambodia, the food transfers’ impact on FCS was higher (difference of 0.5). Therefore,
the evidence is mixed. As pointed out by Gentilini (2014), one of the reasons why cash led to less
diverse diets is because it allows buying greater amounts of grains which are the cheapest option to
get more calories. Finally, for the DDI indicator, in the case of Ecuador, the impact of cash on the
index was much higher than that of food transfers leading to a difference of -0.4. In this case, cash
was not only used to buy a large share of food but to purchase various foods.
33 This could be a result of a larger consumption of cereals 34According to (Gentilini H. , 2014), the Food Consumption Scores (FCS) index is a frequency-weighted diet diversity score and is calculated using the frequency of consumption of 8 food groups consumed by a household during the seven days before the survey (staples, pulses, vegetables, fruit, meat and fish, milk and dairy, sugar and honey, oils and fats). It is calculated by multiplying the number of days by the food group’s weighted frequencies, and summing across categories to obtain a single proxy indicator. Households are then categorized as having poor to borderline consumption if their FCS score is 35 or less. The Dietary Diversity Index (DDI) is the number of different foods or food groups consumed over a given reference period.
22 MABEL JOSUNE GABRIEL FERNÁNDEZ | SECOND YEAR POLICY ANALYSIS
Figure 9 Summary of Differences in Impacts by Transfer Modality and Indicator
Note: Level of significance in differences is indicated by the asterisks (* at 90 percent level, ** at 95 percent level, *** at 99 percent level). Source: (Gentilini H. , 2014) with data from (Cunha J. , 2014), (Skoufias, Unar, & Gonzalez-Cossio, 2008), (Leroy, Gadsden, Rodriguez-Ramirez, & Gonzales de Cossio, 2010), (Hidrobo, 2014), (Barker, Filmer, & Rigolini, 2014), (Ahmed, Quisumbing, Nasreen, Hoddinott, & Bryan, 2010) 1/ Difference in impact between food and cash transfers on food consumption (food impact minus cash impact, percentage points) 2/ Difference in impact between food and cash transfers on per capita calorie in-take (food impact minus cash impact, percentage points) 3/ Difference in impact between food and cash transfers on Food Consumption Scores (food impact minus cash impact, indicator values) 4/ Difference in impact between food and cash transfers on the Dietary Diversity Index (food impact minus cash impact, indicator values)
Effectiveness: Coverage, Quantity, Quality, and Price
Direct distribution of cash transfers to beneficiaries would prevent local officials’ discretional
misallocation of the benefit to the non-poor, minimizing leakage and therefore, improving the
effectiveness of the program in terms of coverage, quantity, quality, and “price” (as beneficiaries get
the full amount of the benefit). BLSM, the current unconditional cash transfers program in
Indonesia represents empirical evidence of this increase in effectiveness given that over 90 percent
of households receive full entitlements of cash35 and beneficiaries report being highly satisfied36.
Additional advantages of cash transfers are the fact that beneficiaries get a larger opportunity to
exercise choice and access their preferred rice type and quality level, while cash also helps to
stimulate local markets due to a higher demand.
35 (Sumarto S. , 2012) 36
(Jakarta Households Interviews, 2015) 10 out of 10 households reported being highly satisfied about allocation of cash
-0.7
4.9 4.0
10.0
-0.4 -0.4
-13.4
0.5
-3.4 -4.9
-15
-10
-5
0
5
10
15
Food Consumption1/
Calorie in-take 2/ Food ConsumptionScore 3/
Dietary DiversityIndex 4/
Mexico Ecuador Cambodia BangladeshF
oo
d T
ran
sfer
(In
-kin
d)
Cash
T
ran
sfer *
***
*
23 IMPROVING FOOD ACCESS FOR POOR HOUSEHOLDS IN INDONESIA: CASH TRANSFERS AND THE RASKIN PROGRAM REFORM
4.1.2. COST-EFFECTIVENESS
As described before in Section 3.1, Raskin is a very expensive program implying costs of around
2.15 billion USD in 2013 (0.25 percent of GDP). Consuming around 53 percent of the social
assistance budget, only 17 percent of it makes it to the poor. In contrast, running a program of
unconditional cash transfers is considerably less costly as it does not require incurring in costs to
procure, store, and physically distribute millions of tons of rice, while in addition, beneficiaries’
waiting and transportation costs to get the benefit are also lower.
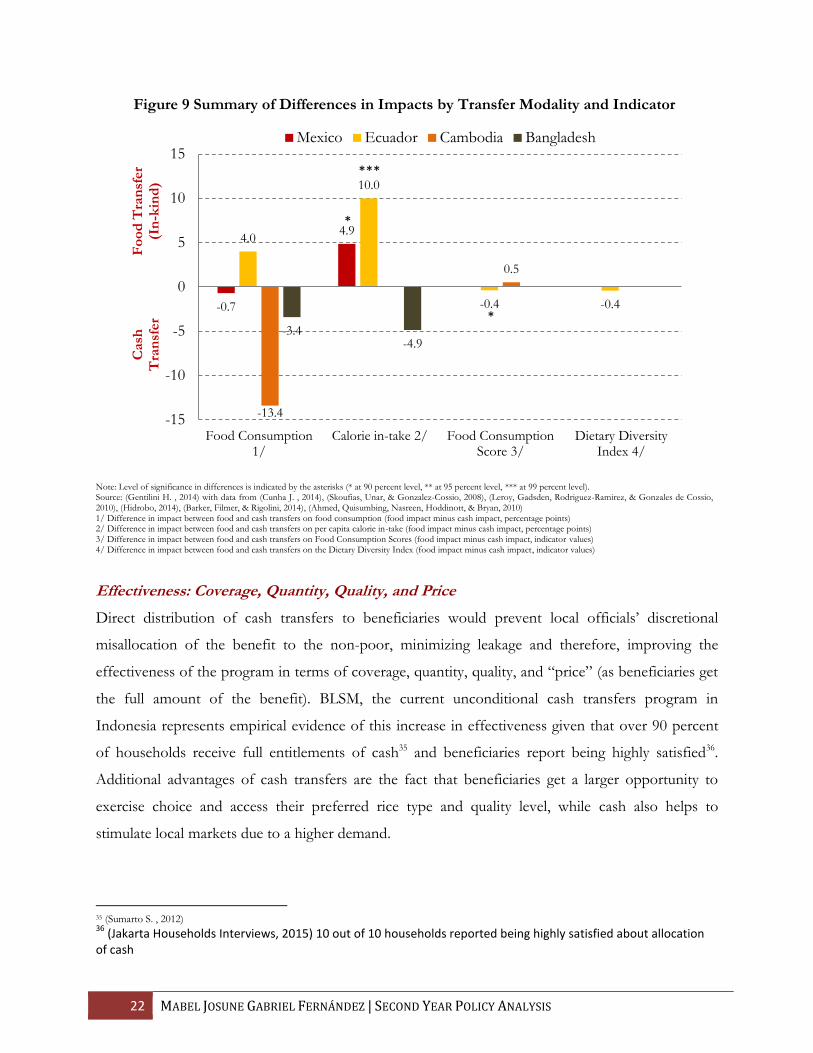
The administrative cost per cash transfer ranges between 0.31-2.99 USD37 with food-cash
ratios ranging from 3.8 to 7.338 (Figure 10). Particularly for the case of Mexico, Cunha (2012)
estimated that providing food transfers is around 7.3 times more costly than providing cash
transfers, while in the case of Ecuador providing food is about 3.8 times more costly than providing
cash. For the case of food transfers, the highest administrative costs comes from expenditures on
logistics such as storage, transportation, etc. which account for 30 percent of the total administrative
cost in Ecuador39. On the other hand, for the case of cash transfers, transactions fees represent only
around 3 percent of the total administrative cost40.
Figure 10 Costs (USD) per Transfer and Transfer Ratios
Source: (Gentilini H. , 2014) based on (Cunha J. , 2014), (Margolies, 2014), and (Aker, 2013).
Additionally, there are other costs such as
beneficiaries’ waiting time and transportation
costs that should be taken into account when
evaluating the cost effectiveness of food
transfers versus cash transfers. On this regard,
for the particular case of Ecuador, the time for
travel and waiting to get food transfers was
37 (Gentilini H. , 2014) 38 The numbers do not include the actual value of transfers. 39 (Hidrobo, 2014) 40 (Margolies, 2014)
Figure 11 Beneficiary Time and Transportation Costs to Obtain Transfers
Source: (Gentilini H. , 2014) based on (Margolies, 2014)

24 MABEL JOSUNE GABRIEL FERNÁNDEZ | SECOND YEAR POLICY ANALYSIS
around 2.2 hours while that for cash transfers was almost half (1.2 hours). Likewise, when looking at
beneficiaries’ transportation costs, those for food transfers, these costs were 5.3 percent of the
transfer value, while in the case of cash transfers they represented only 3.7 percent (Figure 11).
Finally and the most informative information is a cost-effectiveness measure which
compares relative costs to outcomes. However, this indicator is only evaluated for the case of
Ecuador (Figure 12) showing that improving an indicator by 15 percent costs, on average, around
twice for food transfers relative to cash transfers41. Particularly, the cost of increasing food
consumption by 15 percent through food transfers is almost 3 times than the cost of increasing the
same 15% through cash transfers (10.78 USD and 3.79 USD, respectively). When talking about
increasing calorie intake in 15%, the cost of food transfers is around 1.5 times the cost of cash.
Additionally, in order to increase diet diversification by the same 15%, the gap in costs is even larger;
increasing the DDI costs almost 5 times more through food than by cash transfers. In summary,
based on the previous evidence, cash transfers result as a more cost-effective alternative.
Figure 12 Cost (USD) of increasing a given indicator by 15 percent in Ecuador
Source: (Gentilini H. , 2014) based on (Hidrobo, 2014)
4.1.3. POLITICAL SUPPORTABILITY
A policy recommendation must be politically feasible and should go accompanied by a political
strategy to overcome the opposition of any stakeholder involved. The alternative of replacing Raskin
for cash transfers would be politically feasible and strongly supported by the central government,
and other agencies such as the State Audit Agency (KPK), although it is probable that local
governments would express concerns about conflicts within the communities as Raskin helps to
keep cohesion42. Moreover, even though some studies have mentioned that given the high level of
politicization of Raskin it would be difficult to change the program without some kind of popular
41 (Hidrobo et. al 2014 42 (J-PAL)

25 IMPROVING FOOD ACCESS FOR POOR HOUSEHOLDS IN INDONESIA: CASH TRANSFERS AND THE RASKIN PROGRAM REFORM
protest43, it is clear by looking at beneficiaries’ preference for cash that the policy proposal will
gather enough political support to make it happen. For this purpose communications and campaigns
should be targeted effectively.
In order to determine the political feasibility of the proposal of replacing Raskin for cash transfers,
the interested parties were first identified (Figure 13), and personal interviews were conducted to
understand their interactions, preferences, and constraints (See Appendix 4).
The stakeholders involved are mainly Kemenkoskera (determines Raskin policy guidelines), Bulog
(state-owned and revenue-generating company in charge of Raskin’s stage 1) and supervisd by SOE,
farmers (providers of Raskin rice receiving payment above the market price), MOF (channels central
government’s Raskin budget to Bulog after agreement with Kemenkoskera); Viillage Heads (in
charge of implementing and funding last mile Raskin delivery, Raskin stage 2 as well as coordinating
village meetings and rice allocation decisions), KPK (monitors transparency), poor households
(beneficiaries), non-poor households (some getting Raskin due to village decisions), and finally local
retail rice traders (also affected by any change on rice supply or market prices).
Pivotal stakeholders who can affect adoption of policies are the President, Kemenkokesra,
MOF, and SOE while those affecting implementation of the policy are mainly Bulog and local
43 (Banerjee, A. et. al., 2014)
Figure 13 Stakeholders Map
Source: Author’s elaboration.
Local
Government
Village Level
State Audit Agency
Village
Heads
Non-poor
Farmers
Perum Bulog
Ministry of State
Owned
Enterprises (SOE)
Ministry of
Finance (MOF)
Coordinating Ministry of People’s Welfare
(Kemenkokesra)
TPN2K
Poor
NGOs
World Bank
Important Interaction (Formal or Informal)
Pivotal stakeholders for adopting and implementing
Citizens/Clients
Providers
External Stakeholders
Private
Traders
Indonesia’s President
Provincial Level
Poverty Cluster
Economist
Country Director
Specialists/
Analysts
District Level
Central Government
Employees at Distribution Points
Bulog Board
26 MABEL JOSUNE GABRIEL FERNÁNDEZ | SECOND YEAR POLICY ANALYSIS
government officials. NGOs and citizens are also important to mobilize social support and ensure
compliance, legitimacy and enforcement of new policies44
Based on the review of previous studies, documents, news, and interviews it is possible to
conclude that the policy alternative of
moving from Raskin to cash transfers would
be mildly politically supportable. The
proposal would be backed up by the central
government and beneficiaries, Bulog seems
to not represent and opposition, while there
would be probably some unrest or concern
of rice farmers, local rice traders, and a few
Village Heads.
According to recent quotes in the
news, the central government (President,
Kemenkoskera, MOE, SOE) is willing to
replace Raskin with cash transfers while
Bulog is waiting for the government
instruction to stop Raskin (See Box 2 News
Quotes).
Beneficiaries which are another
important part of the political support, are
expected to be enthusiastic about receiving
cash instead of rice. In general, as the poor suffer from more significant cash constraints, most poor
groups tend to express preferences for cash. In the case of Indonesia, a short survey of 10
households in Jakarta showed that households prefer cash over Raskin, although some mentioned
their preference would depend on the amount of the cash transfer45 (Figure 14).
44 (The World Bank, 2012) 45 (Jakarta Households Survey, 2015)
Box 2 News Quotes “Raskin will be replaced with money; the system will be improved so that it is targeting those who has the right to receive it. No more commodity-based subsidy”
Sofyan Djalil, the Coordinating Minister for Economy1
Bulog is still waiting for the technical guidelines for that elimination plan.
Regional head of Bulog, South& West Sulawesi2
“This year we have been distributing rice for Raskin. Moving forward, the people will not receive rice, but e-money on their account […] With the e-money, people can decide the quality of rice that they want to consume […] The President would like to see social assistance targets those who really need them, with good utilization, not for consumptive purpose but to be optimum and productive”
Rini Soemarno, Minister of SOE3
1/ (Liputan6, 2014) 2/ (Koran Tempo, 2014) 3/ (Fajar, 2014)

27 IMPROVING FOOD ACCESS FOR POOR HOUSEHOLDS IN INDONESIA: CASH TRANSFERS AND THE RASKIN PROGRAM REFORM
Figure 14 Policy Alternatives Ranked by Beneficiaries
Source: (Jakarta Households Interviews, 2015) Participants were asked to rank the following options from more preferred to less preferred (1….4): Raskin as it is now; Card that allows you to get same 15 kg of rice/month but directly in the closest market; Card with a fixed amount of money per month (eg. 130,000 Rp., equivalent to current price of 15 kg of rice) that you can only spend in rice and other types of food; and cash to be spent freely (eg. 130,000 Rp., equivalent to current price of 15 kg of rice).
On the other hand, when looking for potential discontent, if Olken (2006)46 argument about
Village Heads being involved in intercepting rice from warehouses to villages and reselling it secretly
on the private market is true, then t some unrest coming from these Village Heads as well as local
rice traders would be expected. However, Olken (2006) acknowledges that 60 percent of the missing
rice came from just 10 percent of the villages. Therefore, resistance would be minor. Also, it has
been said that Raskin equal distribution has kept cohesion on communities47. Therefore, there is
chance that removing Raskin some unrest would emerge in some of the communities. In this sense,
targeted communication should be focus on addressing the particular interests of villagers as well as
to reframe problems and objectives in a way that facilitates support from the parties involved.
Finally, some of the people opposing cash transfers tend to believe that people uses cash for
other purposes and not food. However, “experience gained by governments, NGOs and other
actors in implementing and evaluating cash transfers shows that cash is overwhelmingly spent on
46 (Olken B. , 2005) 47 (Banerjee A. , 2014)
0
1
2
3
4
5
6
7
8
9
1° 2° 3° 4°
Raskin
Voucher for 15kg of rice
Voucher with fixed amount money
Cash
28 MABEL JOSUNE GABRIEL FERNÁNDEZ | SECOND YEAR POLICY ANALYSIS
food (50-60%), basic essentials, agricultural inputs and loan repayment. There are few anecdotes on
cash diverted to undesirable uses”4849.
4.1.4. ADMINISTRATIVE FEASIBILITY
The last criterion that supports our policy recommendation of replacing Raskin with unconditional
cash transfers is the fact that the GOI possess the administrative capacity in terms of monetary,
material, and human resources to implement the change. However, highly food insecure and remote
areas do not meet the necessary conditions for making cash a successful mechanism (See Section
4.1.1, Context for Cash Transfer Use). Therefore, in these areas, Raskin should be continued after going
through a deep business process review and reform.
Regarding monetary sources, it is clear from Section 4.1.2 that cash transfers’
implementation would require much less monetary resources than the Raskin program. Savings
derived from lower operational costs would be available to fund any additional cost that could
emerge to make the new program feasible and succesful, such as communication campaign,
socialization, or any other related expenditure.
Moreover, as the GOI already successfully implements both an unconditional (BLSM) and
conditional cash transfers programs (PKH), the initial arrangements, physical infrastructure, and
know-how to run a cash transfers program are already in place. Currently, cash transfers are
distributed mostly through postal offices, although the government started to pilot digital financial
services in 19 cities a couple of months ago. Therefore, the proposed policy change would
technically only represent an increase in the current amount of cash received by BLSM beneficiaries
(19 million households50) who are also eligible for Raskin. For those that do not receive BLSM, it
will be needed to add them to the system but getting the Raskin cash transfer amount.
4.1.5. IMPLEMENTATION STRATEGY AND NEXT STEPS
The successful implementation of the proposed policy change, requires some steps to be followed: i)
assess the market conditions at a district level to identify areas where cash transfers would be
effective; ii) complement this first stage of geographical targeting with the current Raskin targeting
mechanism subject to improvement; iii) estimate the cash transfer amount; iv) evaluate different
distribution systems; and, v) design communication and socialization campaigns, among others.
48 (World Food Programme, 2006, pág. 5) 49 In Mexico, more than half of the cash transfer was spent on food, out of which a quarter was devoted to nutritious food items such as fruits and vegetables. (Gentilini H. , 2014) 50 (Humanitarian News and Analysis, 2015)

29 IMPROVING FOOD ACCESS FOR POOR HOUSEHOLDS IN INDONESIA: CASH TRANSFERS AND THE RASKIN PROGRAM REFORM
i) Assess local markets conditions and food supply
As mentioned before, a critical requirement for cash transfers to be successful is to effectively
identify whether markets work well and the current supply meets the required quantity and quality of
commodities and services demanded. On the other hand, in-kind transfers are better suited for those
highly food insecure and remote areas where food intake is prioritized, prices are excessively high,
markets are distant or do not function well, goods are not available and cannot be brought from
distant markets because of conflicts or difficult access, as well as areas subject to natural disasters.
All these cases where supply cannot meet increased demand and where it may be appropriate to
maintain the provision of food transfers motivate our second policy recommendation explained in
more detail in Section 4.2.
Although there are guides such as Emergency Market Mapping and Analysis tool kit51 and the
Market Information and Food Insecurity Response Analysis52 intended to provide directions on how to
proceed with markets assessment, it will be very costly in terms of time and budget to conduct this
assessment in each of the 500 districts in Indonesia. Therefore, the strategy proposed is to identify
first those districts were cash would not be appropriate (i.e. highly insecure and remote areas) and
provide cash elsewhere.
Two different mechanisms are presented based in the rich information provided by the Food
Security and Vulnerability Atlas of Indonesia 200953 for 346 districts in rural areas to determine which are
the most highly food insecure and remote districts in Indonesia. This Atlas has proved to be an
important tool for implementing geographical targeting as it presents information on per capita
consumption to cereal availability ratio, people below the poverty line, underweight rate of under 5
children, and villages with inadequate roads connectivity, among other indicators54.
Mechanism 1: The Atlas’ Composite Food Security index
The Atlas uses its own Composite Food Security Index to classify and map districts in 6 categories,
going from Priority 1 to Priority 6. Based on this classification, there are 100 districts ranked as
higher priority that would not be appropriate for a cash transfer program and that would justify the
continuation of Raskin: 30 districts of Priority 1 (located in Papua, NTT, Papua Barat, and other 5
51 (EMMA, 2015) 52 (Barrett, 2009) 53 (World Food Programme, 2009) 54 Based on the Atlas information we found that that those districts found in deficit in cereal production are mainly located in Papua Riau, Kepulauan Riau, Jambi, Kalimantan Tengah, Maluku and Maluku Utara provinces. Regarding nutrition, 45 out of 346 districts had a very high prevalence of underweight (>30percent) mainly in NTT, Maluku, Kalimantan Selatan, NAD, Sulawesi Barat and Gorontalo provinces. Likewise, 65 districts had more than 30percent of people living below the national poverty line and more than 12percent of all Indonesian villages do not have access to roads connected by four wheeled vehicles as in Jambi, Riau, Sumatera Selatan , Kalimantan Barat, Kalimantan Tengah, Selatan and Timur, Papua and most of Papua Barat, parts of NTT and Maluku.
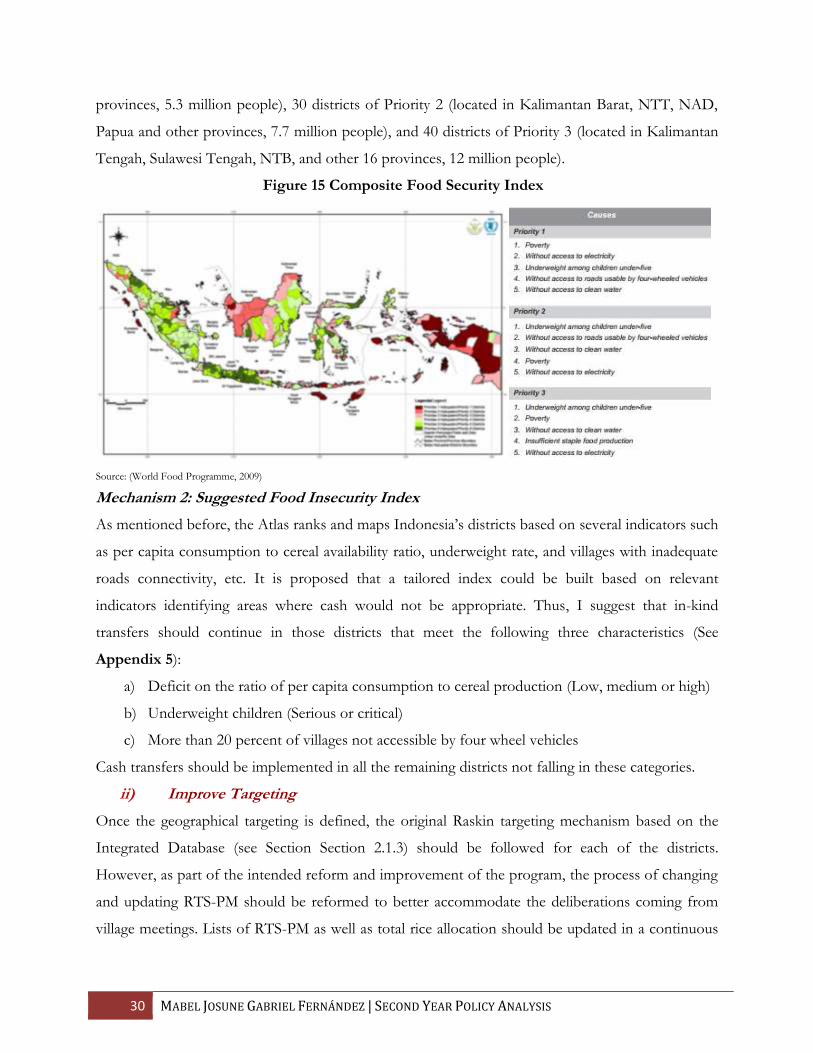
30 MABEL JOSUNE GABRIEL FERNÁNDEZ | SECOND YEAR POLICY ANALYSIS
provinces, 5.3 million people), 30 districts of Priority 2 (located in Kalimantan Barat, NTT, NAD,
Papua and other provinces, 7.7 million people), and 40 districts of Priority 3 (located in Kalimantan
Tengah, Sulawesi Tengah, NTB, and other 16 provinces, 12 million people).
Figure 15 Composite Food Security Index
Source: (World Food Programme, 2009)
Mechanism 2: Suggested Food Insecurity Index
As mentioned before, the Atlas ranks and maps Indonesia’s districts based on several indicators such
as per capita consumption to cereal availability ratio, underweight rate, and villages with inadequate
roads connectivity, etc. It is proposed that a tailored index could be built based on relevant
indicators identifying areas where cash would not be appropriate. Thus, I suggest that in-kind
transfers should continue in those districts that meet the following three characteristics (See
Appendix 5):
a) Deficit on the ratio of per capita consumption to cereal production (Low, medium or high)
b) Underweight children (Serious or critical)
c) More than 20 percent of villages not accessible by four wheel vehicles
Cash transfers should be implemented in all the remaining districts not falling in these categories.
ii) Improve Targeting
Once the geographical targeting is defined, the original Raskin targeting mechanism based on the
Integrated Database (see Section Section 2.1.3) should be followed for each of the districts.
However, as part of the intended reform and improvement of the program, the process of changing
and updating RTS-PM should be reformed to better accommodate the deliberations coming from
village meetings. Lists of RTS-PM as well as total rice allocation should be updated in a continuous

31 IMPROVING FOOD ACCESS FOR POOR HOUSEHOLDS IN INDONESIA: CASH TRANSFERS AND THE RASKIN PROGRAM REFORM
basis based on the village deliberations, helping to better target the actual poor (reducing leakage)
and to guarantee adequate rice quotas.
iii) Estimate Cash Transfer Amount
The actual subsidy that households receive form the Raskin program is the difference between the
rice subsidized price (1,600 Rp/Kg for the recent years) and the market price (10,600 Rp, average of
2012-201355) which is ~9,000 Rp/kg, meaning an intended subsidy of ~135,000
Rp/month/household (based on 15 kg allocation). The easiest estimation of the monthly cash
transfer amount is this amount (135,000 Rp) adjusted accordingly to local retail rice inflation.
iv) Evaluate Alternative Cash Distribution Systems
The appropriateness of each distribution system depends on opportunities and constraints in each
context: beneficiary preference, risks of exclusion (ie. child-headed households), existing financial
infrastructure, access to financial infrastructure, security, connectivity, literacy, regulation, cost-
effectiveness, available technology, corruption, intra-household roles, etc.
For the case of Indonesia, the government currently distributes cash transfers for the BLSM
and PKH programs through postal offices while it is piloting digital financial services (SIM Cards) in
19 cities (1 million people). It is recommended that in the short run, the replacements of Raskin for
cash transfers is done through the current mechanism (postal offices and eventually SIM cards).
Alternative systems such as SIM cards (plastic cards with a chip in them used to verify the
beneficiaries’ identities and the money balance) will become possible in the medium term if the
GOI’s piloting works well. Cards can be used with Point-of-Sale (PoS) devices to withdraw money,
purchase commodities directly, or both. PoS devices may be fixed (e.g. bank machines) or may be
portable (battery-operated or solar charged), making card accessible even in remote areas56.
Although not possible in the short run given certain constraints57, mobile money should be
also evaluated as the gap between those with telecommunications access and those with formal
financial services is increasing rapidly the potential of mobile money is huge (Box 3. Mobile
Money).
55 (J-PAL, 2014) 56 This mechanism requires some preconditions that seem to be there as the government already decided to migrate from “giro pos” to smart cards., “such as a local card delivery provider/account provider (a bank or another financial service) beneficiaries an infrastructure that can read and authenticate the card, and can debit/credit payments from/to the card (ATMs, Point-of-Sale devices within merchants, etc.); Point-of-Sale (PoS) devices or ATMs in place in locations or shops accessible to beneficiaries; some connectivity (to telephone or internet) is usually required, although there are exceptions; depending on the card provider and the system established, formal identification may be required. 57 (USAID, 2011, pág. 14)
32 MABEL JOSUNE GABRIEL FERNÁNDEZ | SECOND YEAR POLICY ANALYSIS
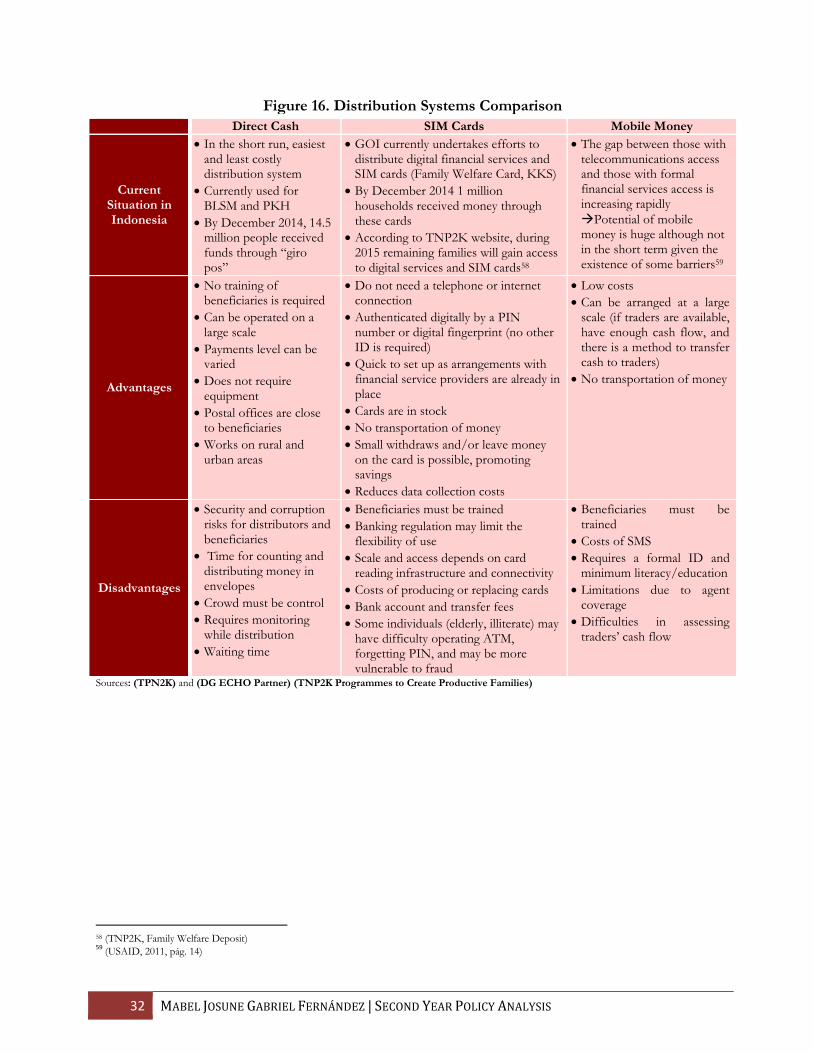
Figure 16. Distribution Systems Comparison
Direct Cash SIM Cards Mobile Money
Current Situation in Indonesia
In the short run, easiest and least costly distribution system
Currently used for BLSM and PKH
By December 2014, 14.5 million people received funds through “giro pos”
GOI currently undertakes efforts to distribute digital financial services and SIM cards (Family Welfare Card, KKS)
By December 2014 1 million households received money through these cards
According to TNP2K website, during 2015 remaining families will gain access to digital services and SIM cards58
The gap between those with telecommunications access and those with formal financial services access is increasing rapidly
Potential of mobile money is huge although not in the short term given the existence of some barriers59
Advantages
No training of beneficiaries is required
Can be operated on a large scale
Payments level can be varied
Does not require equipment
Postal offices are close to beneficiaries
Works on rural and urban areas
Do not need a telephone or internet connection
Authenticated digitally by a PIN number or digital fingerprint (no other ID is required)
Quick to set up as arrangements with financial service providers are already in place
Cards are in stock
No transportation of money
Small withdraws and/or leave money on the card is possible, promoting savings
Reduces data collection costs
Low costs
Can be arranged at a large scale (if traders are available, have enough cash flow, and there is a method to transfer cash to traders)
No transportation of money
Disadvantages
Security and corruption risks for distributors and beneficiaries
Time for counting and distributing money in envelopes
Crowd must be control
Requires monitoring while distribution
Waiting time
Beneficiaries must be trained
Banking regulation may limit the flexibility of use
Scale and access depends on card reading infrastructure and connectivity
Costs of producing or replacing cards
Bank account and transfer fees
Some individuals (elderly, illiterate) may have difficulty operating ATM, forgetting PIN, and may be more vulnerable to fraud
Beneficiaries must be trained
Costs of SMS
Requires a formal ID and minimum literacy/education
Limitations due to agent coverage
Difficulties in assessing traders’ cash flow
Sources: (TPN2K) and (DG ECHO Partner) (TNP2K Programmes to Create Productive Families)
58 (TNP2K, Family Welfare Deposit) 59 (USAID, 2011, pág. 14)

33 IMPROVING FOOD ACCESS FOR POOR HOUSEHOLDS IN INDONESIA: CASH TRANSFERS AND THE RASKIN PROGRAM REFORM
v) Monitoring, evaluation, and measuring success
Frequent, rapid, and efficient monitoring is important to verify that the new cash transfers program
and the distribution system selected is appropriate, to understand how cash is being used, and to
enable adjustments to the operational design. A results-based management approach should be
followed, collecting information and data during monitoring to judge outcomes and results.
Thus, based on the objectives of the policy proposed, the suggested outcome indicators to
measure its success are mainly, food consumption, calorie intake, dietary diversity, and
administrative costs in order to better track the cost-effectiveness of the program. Moreover, there
are other factors that in the case of cash transfers should be monitored, such as prices and supply of
Box 3. Mobile Money
Mobile money is an innovative modality to transfer cash based on SMS codes sent to the beneficiary
mobile phone that can be cashed out at particular shops. In the case of Indonesia, mobile money
penetration is very low (~15% of mobile subscribers) compared to countries in Africa and even lower than
in Thailand or Philippines (Figure 17). However, although not possible in the short run, the potential of
developing this modality is huge as the gap between those with telecommunications access and those with
formal financial services access is increasing rapidly (Figure 18). Given that only 21 percent of poor
households in Indonesia have access to formal financial services (40 percent have access to informal
services and 39 percent are underserved)1/, mobile money access could result a modality with a larger
scope than other means such as deposits in bank accounts.
Figure 17 Mobile Money Penetration (mobile money suscribersas percentage of mobile
suscribers)
Figure 18 Mobile Telephone and Bank Penetration
Source: (USAID, 2011) Source: (USAID, 2011)
1/Source: (USAID, Accelerating Mobile Money in Idnoensia, 2011)
34 MABEL JOSUNE GABRIEL FERNÁNDEZ | SECOND YEAR POLICY ANALYSIS
all basic goods on the market. Price increases above an acceptable threshold or lack of supply may
be used to trigger remedial actions such as OPK60.
vi) Political Implementation Strategy: Authorizers
A crucial step in the implementation strategy is to obtain the authorization to intervene in the
abovementioned areas. For this purpose, multiple parties should be involved besides Kemenkoskera:
Council of Food Security (chaired by the President), Ministry of Home Affairs (mandate village
councils), SOE (supervises BULOG), BAPPENAS, TPN2K, and Bulog’s Director. Engaging broad
sets of actors is important to ensure that reforms are viable, legitimate and relevant (politically
supportable and practically implementable)61.
4.2. RECOMMENDATION 2. REVIEW, REDESIGN, AND KEEP RASKIN IN HIGHLY FOOD
INSECURE AND REMOTE AREAS: IMPROVING EFFICIENCY
Our second recommendation is to review, redesign, and keep Raskin in those areas where cash
transfers are not recommended. Raskin in-kind transfers are better fitted for remote areas where
food supply is scarce and the private sector participation in the supply is very low due to high
distribution costs. In Indonesia, 13 percent of all districts are food insecure62 and not able to
consistently produce enough calories for their populations. Narrowing in-kind transfers to food
insecure regions would diminish total costs as in-kind transfers would be required only in a reduced
number of districts. Moreover, improvements in oversight and evaluation will make local
administrators face adequate incentives to avoid misallocation and low quality of rice, as well as
quantity and price manipulations. Although keeping Raskin as it is now would not reduce
administrative costs significantly, the review and redesign of its procedures would improve the
program efficiency, and consequently, its cost-effectiveness as whole.
4.2.1. IMPLEMENTATION STRATEGY AND NEXT STEPS
i) Assess local markets conditions and food supply
As mentioned previously, in-kind transfers are better suited for highly food insecure and remote
areas where food intake is prioritized, prices are excessively high, markets are distant or do not
function well, goods are not available and cannot be brought from distant markets because of
conflicts or difficult access, as well as areas subject to natural disasters. For all the districts where
supply cannot meet increased demand, Raskin rice transfers should be provided. The mechanisms
60 (DG ECHO Partners, 2015a) 61 (Andrews, 2012) 62 (The World Bank, 2012, p. 9)
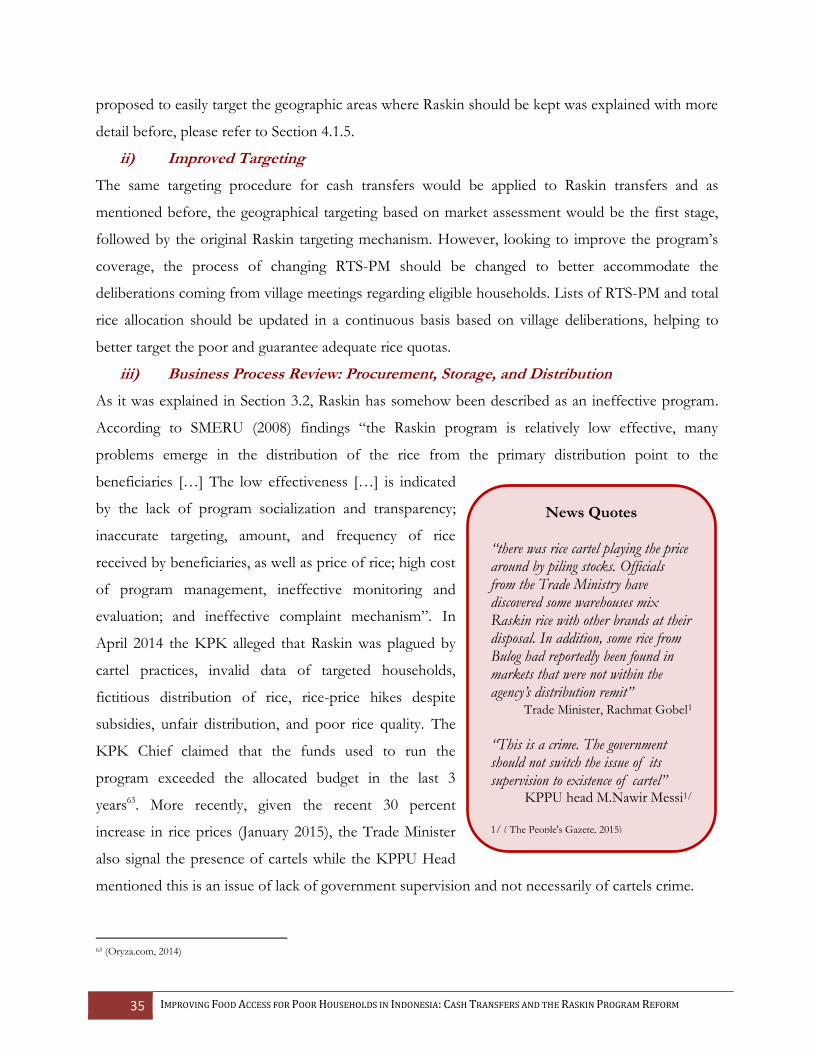
35 IMPROVING FOOD ACCESS FOR POOR HOUSEHOLDS IN INDONESIA: CASH TRANSFERS AND THE RASKIN PROGRAM REFORM
proposed to easily target the geographic areas where Raskin should be kept was explained with more
detail before, please refer to Section 4.1.5.
ii) Improved Targeting
The same targeting procedure for cash transfers would be applied to Raskin transfers and as
mentioned before, the geographical targeting based on market assessment would be the first stage,
followed by the original Raskin targeting mechanism. However, looking to improve the program’s
coverage, the process of changing RTS-PM should be changed to better accommodate the
deliberations coming from village meetings regarding eligible households. Lists of RTS-PM and total
rice allocation should be updated in a continuous basis based on village deliberations, helping to
better target the poor and guarantee adequate rice quotas.
iii) Business Process Review: Procurement, Storage, and Distribution
As it was explained in Section 3.2, Raskin has somehow been described as an ineffective program.
According to SMERU (2008) findings “the Raskin program is relatively low effective, many
problems emerge in the distribution of the rice from the primary distribution point to the
beneficiaries […] The low effectiveness […] is indicated
by the lack of program socialization and transparency;
inaccurate targeting, amount, and frequency of rice
received by beneficiaries, as well as price of rice; high cost
of program management, ineffective monitoring and
evaluation; and ineffective complaint mechanism”. In
April 2014 the KPK alleged that Raskin was plagued by
cartel practices, invalid data of targeted households,
fictitious distribution of rice, rice-price hikes despite
subsidies, unfair distribution, and poor rice quality. The
KPK Chief claimed that the funds used to run the
program exceeded the allocated budget in the last 3
years63. More recently, given the recent 30 percent
increase in rice prices (January 2015), the Trade Minister
also signal the presence of cartels while the KPPU Head
mentioned this is an issue of lack of government supervision and not necessarily of cartels crime.
63 (Oryza.com, 2014)
News Quotes “there was rice cartel playing the price around by piling stocks. Officials from the Trade Ministry have discovered some warehouses mix Raskin rice with other brands at their disposal. In addition, some rice from Bulog had reportedly been found in markets that were not within the agency’s distribution remit”
Trade Minister, Rachmat Gobel1
“This is a crime. The government should not switch the issue of its supervision to existence of cartel”
KPPU head M.Nawir Messi1/
1/ ( The People's Gazete, 2015)

36 MABEL JOSUNE GABRIEL FERNÁNDEZ | SECOND YEAR POLICY ANALYSIS
Based on the above, a year ago in April 2014, the government committed to come up with
an action plan to start a redesign of the Raskin64 and several reforms and pilot projects have recently
been initiated by TPN2K and BAPPENAS partnered with the World Bank and Poverty Action Lab
to evaluate different policy alternatives such as introducing identification cards and allowing
outsiders to bid at the village for the right to distribute Raskin65.
However, there is a prevailing need to perform a thorough review of Raskin program’s
processes and operations in Stage 1 (procurement, storage, packaging, transportation, and
distribution to Distribution Points) and Stage 2 (local governments distribution from Distribution
Points to Allocation Points in villages) in order to identified further opportunities for
improvement66. The redesign of the program will come out from the findings of this BPR.
However, some general recommendations must be implemented in each of the stages as suggested
in Figure 19:
Figure 19 Suggested Measures to Redesign Raskin Processes
Source: Author’s own elaboration.
64 (Asia News Network) 65 (Sumarto S. , 2014) The ID cards have been scaled up and distributed to 15.5 million poor households nationally as the pilot shows that cards increased monthly purchases of Raskin rice by 1.20 kg and decreased price mark-ups by Rp. 60/kg (increasing the monthly subsidy received by eligible beneficiaries by Rp 7,136, 25 percent). On the other hand, allowing for bidding did not result on large impacts on distribution given that only certain types of individuals could bid. 66 As far as is known, a recent review of the Raskin program was conducted by Deloitte Jakarta. However, it was not possible to interview the Head of the project about the results due to confidential constraints. (Timmer & Dethloff, 2015)
Budgeting Procurement Storage Distribution
1. Include in budget those
resources needed for
the last mile distribution
of rice in hands of
Village Heads.to ensure
beneficiaries do not pay
more than the official
subsidized price.
2. Funds saved from
change to cash transfers
in several regions
should be allocated to
improve Raskin
operations in remote
areas.
1. Assign an independent
agency (not Bulog) to
correctly estimate the
country rice stock needs
(currently Bulog stocks
are considerably higher
than those needed ).
2. Modify regulations to
ensure Raskin rice is
procured from small
and big farmers
avoiding corruption
and cartels.
3. Contracts conditions
with farmers procuring
rice should be audited.
4. Farmers rice delivery to
Bulog warehouses
should be monitored.
1. Estimate the proper
amount of stocks in
order to mitigate
storage costs, and
overstock/understock
risks.
2. Improve storage
conditions to keep rice
quality as high as
possible.
3. Improve inventory
systems to avoid
keeping rice stored for
long periods.
1. Stablish systems to
monitor and track rice
amounts and quality at
every stage in the
delivery process.
2. Explore, pilot ,and test
alternative delivery
mechanisms and
contracts with different
private providers to
establish measures of
costs to compare with
Bulog’s costs.

37 IMPROVING FOOD ACCESS FOR POOR HOUSEHOLDS IN INDONESIA: CASH TRANSFERS AND THE RASKIN PROGRAM REFORM
iv) Monitoring, evaluation, and measuring success
As mentioned before, lack of transparency combined with poorly publicized changes in the program
rules have provided substantial opportunity for corruption67. Therefore, monitoring and evaluation
performed by independent and credible external institutions will help to guarantee the appropriate
implementation of Raskin. Based on (Hastuti, 2008), suggested actions are;
i. Enforce process guidelines and regulations by an external auditing agency.
ii. Introduce an incentive and penalty system to ensure that the program is implemented in
accordance with the guidelines (i.e, awards, media announcements, demotion of officials).
iii. Monitoring results must be presented to various parties including the public and used for the
improvement of the program’s implementation.
iv. Require Bulog to publicly present a yearly business plan and quarterly financial statements.
v. Make regular inspections to procurement points, warehouses, distribution and allocation
points, as well as to transportation vehicles. Regular analysis of rout optimization.
vi. Computerized mechanisms to monitor and inspect rice distribution must be stablished to
keep track of amounts and quality of rice leaving warehouses, arriving to distribution points,
to allocation points, and finally to households. These mechanisms should provide regularly
with data and metrics to evaluate performance.
5. FOOD VOUCHERS: WHY NOT?
Also known as food stamps or near-cash transfers, food vouchers represent an intermediate policy
between in-kind and cash transfers. There are different modalities of vouchers: i) commodity-based
vouchers, which give access to a pre-defined quantity of food (e.g. 15 kg of medium quality rice). It
can be only one staple or a food basket; and, ii) value-based vouchers, which provide access to food
for a given monetary amount (130,000 Rp). It can be used to buy only one staple or a food basket
and can be provided as paper vouchers or mobile vouchers (similar to mobile money)68.
Although food vouchers represent lower administrative costs compared to those of the
Raskin program, its superiority over cash in terms of effectiveness and administrative feasibility is
not clear based on the available empirical evidence.
67 (Olken B. , 2005) 68 Fair vouchers are also possible, which mean papers or coupons that can be exchanged for goods from approved sellers only during a fair. However, this would increase costs as beneficiaries and suppliers will need to get to the fairs and transport the commodities which make this option not a cost-effective one.
38 MABEL JOSUNE GABRIEL FERNÁNDEZ | SECOND YEAR POLICY ANALYSIS
5.1. TECHNICAL CORRECTNESS
As in previous sections, when evaluating the technical correctness of food vouchers, the relative
impact of vouchers on beneficiaries’ food consumption, calorie intake, and nutritional impact is
analyzed. However, given that there are few case studies that evaluate vouchers relative to cash and
food transfers (Ecuador and the Democratic Republic of Congo) results are not conclusive.
For the case of Ecuador, when looking at the impact on food consumption of in-kind
transfers, it was three percentage points larger than that of vouchers, although not statistically
significant. Regarding per capita calorie in-take, it is found that providing in-kind transfers had an
impact 6 percentage points larger than that of providing food vouchers. However, this larger effect
from food was mainly due to larger increases in consumption of cereals69.
Regarding nutritional impact, vouchers resulted more effective than in-kind transfers
improving the Food Consumption Score and the Dietary Diversity Index of beneficiaries. However,
when looking at Household Dietary Diversity Scores, although results show that vouchers had a
higher impact than cash for both Ecuador and DRC, none of the results is statistically significant.
Therefore, vouchers impact on food consumption or calorie intake seems to be lower than that
of in-kind transfers, while regarding diet diversity, results differ depending on the indicator used.
5.2. COST-EFFECTIVENESS
Costs relative to effectiveness were also analyzed finding that the cost (USD) per transfer of food
vouchers relative to in-kind is lower, but not as low as the cost of cash transfers. In the case of
Ecuador, while the cost per transfers through vouchers was 3.27 USD, it was only 2.99 USD for
cash transfers. Moreover, beneficiaries that received vouchers spend more time traveling and
waiting, and money on transportation to obtain the benefit than those receiving cash. Likewise, in
the case of DRC, vouchers are 1.2 times more expensive than cash (14.4 USD, and 11.3 USD
respectively).
To end, when talking about cost-effectiveness it seems that increasing food consumption in
15 percent by providing vouchers costs 3.81 USD while the same increase costs only 3.79 USD
when providing cash in the case of Ecuador. On the other hand, improving calories and diet
diversity seemed to be cheaper through voucher than through cash.
69
(Gentilini H. , 2014)
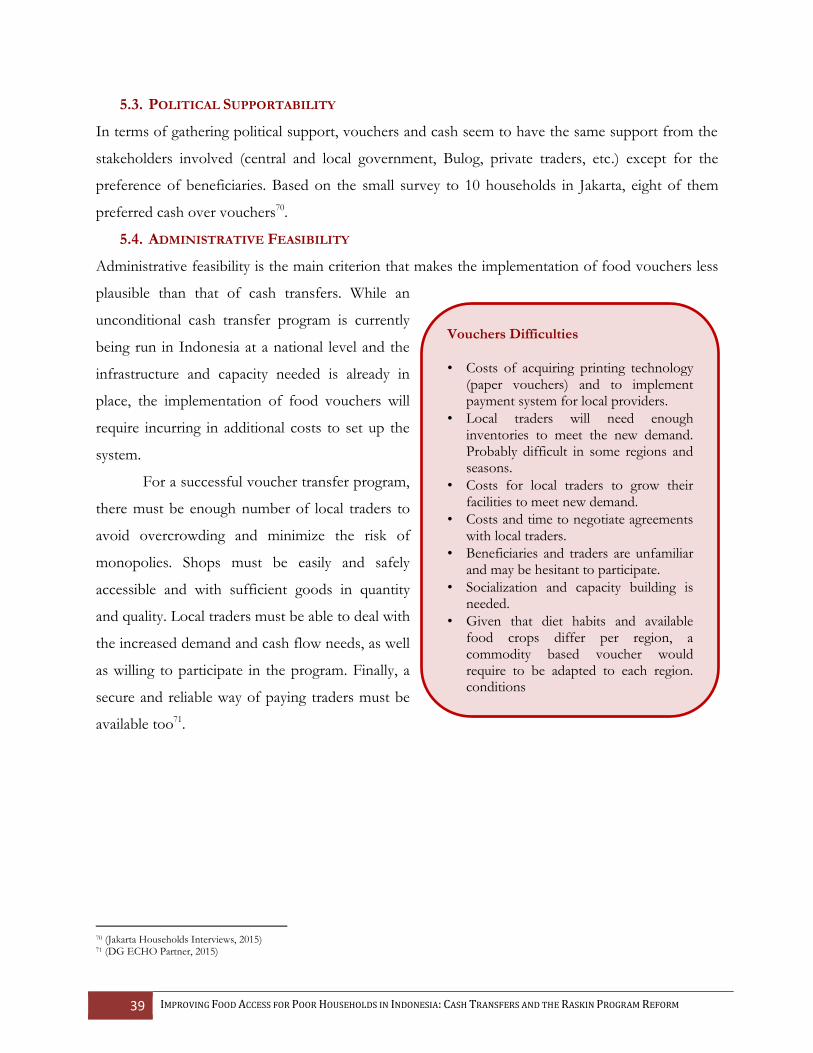
39 IMPROVING FOOD ACCESS FOR POOR HOUSEHOLDS IN INDONESIA: CASH TRANSFERS AND THE RASKIN PROGRAM REFORM
5.3. POLITICAL SUPPORTABILITY
In terms of gathering political support, vouchers and cash seem to have the same support from the
stakeholders involved (central and local government, Bulog, private traders, etc.) except for the
preference of beneficiaries. Based on the small survey to 10 households in Jakarta, eight of them
preferred cash over vouchers70.
5.4. ADMINISTRATIVE FEASIBILITY
Administrative feasibility is the main criterion that makes the implementation of food vouchers less
plausible than that of cash transfers. While an
unconditional cash transfer program is currently
being run in Indonesia at a national level and the
infrastructure and capacity needed is already in
place, the implementation of food vouchers will
require incurring in additional costs to set up the
system.
For a successful voucher transfer program,
there must be enough number of local traders to
avoid overcrowding and minimize the risk of
monopolies. Shops must be easily and safely
accessible and with sufficient goods in quantity
and quality. Local traders must be able to deal with
the increased demand and cash flow needs, as well
as willing to participate in the program. Finally, a
secure and reliable way of paying traders must be
available too71.
70 (Jakarta Households Interviews, 2015) 71 (DG ECHO Partner, 2015)
Vouchers Difficulties
• Costs of acquiring printing technology (paper vouchers) and to implement payment system for local providers.
• Local traders will need enough inventories to meet the new demand. Probably difficult in some regions and seasons.
• Costs for local traders to grow their facilities to meet new demand.
• Costs and time to negotiate agreements with local traders.
• Beneficiaries and traders are unfamiliar and may be hesitant to participate.
• Socialization and capacity building is needed.
• Given that diet habits and available food crops differ per region, a commodity based voucher would require to be adapted to each region. conditions
40 MABEL JOSUNE GABRIEL FERNÁNDEZ | SECOND YEAR POLICY ANALYSIS
6. CONCLUSION
In this study, three different policy options were evaluated based on the empirical evidence coming
from different case studies and program evaluations. The first option, keep Raskin under current
operations guidelines. Second, replace Raskin for food vouchers. Third, replace Raskin for
unconditional cash transfers. As a result, two policy recommendations are suggested: i) replace in-
kind transfers (Raskin) for cash transfers to reduce costs and improve effectiveness; and, ii) review,
redesign, and keep Raskin in highly food insecure and remote areas where cash is not appropriate.
The evidence available shows that although in-kind transfers work better to increase food
consumption and calorie intake, unconditional cash transfers result considerably most cost-effective
by reducing operational costs, preventing discretional allocation of the benefit, allow beneficiaries
for greater choice, and also help develop local markets. Administratively, implementing cash
transfers is feasible by using the available infrastructure for running the current unconditional cash
transfer program (BLSM). Moreover, cash transfers are also politically supported by the central
government, although probably Village Heads could express some concern given that Raskin is used
as a mechanism to keep cohesion in communities.
However, , the study showed that cash transfers are not well fitted for highly food insecure
areas where food supply is scarce and markets do not work well. For these cases, Raskin should
continue conditional to an increase of oversight and evaluation to raise its effectiveness.
These policy recommendations are also accompanied by an implementation strategy that
includes next steps such as assessment of the market conditions, estimation of the monetary transfer
amount; and, evaluation of different distribution systems, among others. For the suggestion of
reforming Raskin, a deep business process review should be implemented.
Moreover, there are still some questions that should be answered to complement the current
analysis. If possible, an experimental study comparing Raskin, food vouchers, and cash should be
piloted in Indonesia to validate the empirical evidence presented here. Also, it is necessary to
estimate the impact of eliminating Raskin on households food security and retail prices. Finally, what
would be Bulog’s role after the reform should also be considered.
It is in the interest of the GOI to focus its efforts and resources on implementing the policy
changes suggested as this will actively contribute to generate significant savings for the government
budget while the poor will get the full amount of the intended benefit. Moreover, savings coming
from the lower administrative costs of cash transfers could be allocated to new or existing programs
that would bring a larger benefit for Indonesian households and for the country as a whole.
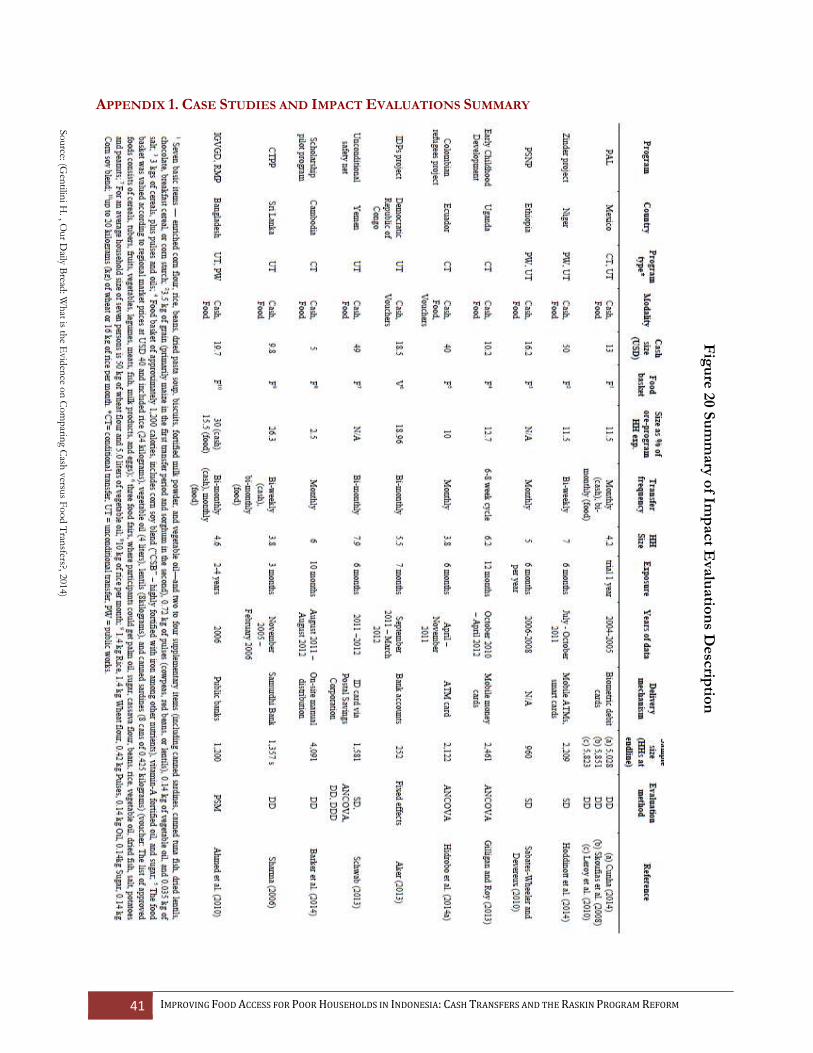
41 IMPROVING FOOD ACCESS FOR POOR HOUSEHOLDS IN INDONESIA: CASH TRANSFERS AND THE RASKIN PROGRAM REFORM
APPENDIX 1. CASE STUDIES AND IMPACT EVALUATIONS SUMMARY
So
urce: (G
entilin
i H. , O
ur D
aily Bread
: Wh
at is the E
vid
ence o
n C
om
parin
g Cash
versu
s Fo
od T
ransfers?, 2
014)
Fig
ure
20 S
um
mary
of Im
pact E
valu
atio
ns D
esc
riptio
n

42 MABEL JOSUNE GABRIEL FERNÁNDEZ | SECOND YEAR POLICY ANALYSIS
Figure 21 Summary of Impact Evaluations on Food Consumption and Calorie In-take
Source: (Gentilini H. , Our Daily Bread: What is the Evidence on Comparing Cash versus Food Transfers?, 2014)
Figure 22 Summary of Impact Evaluations on Diet Diversity
Source: (Gentilini H. , Our Daily Bread: What is the Evidence on Comparing Cash versus Food Transfers?, 2014)
43 IMPROVING FOOD ACCESS FOR POOR HOUSEHOLDS IN INDONESIA: CASH TRANSFERS AND THE RASKIN PROGRAM REFORM
APPENDIX 2. POLICY ALTERNATIVES, EVALUATION METHODOLOGY, AND CRITERIA
Policy Alternatives
From the literature review it was found that food security interventions could be categorized in:
those that influence food supply (reduce producer’s and therefore consumer’s prices), those that
reduce prices only to consumers, and those that increase income. This way, this analysis will only
focus on interventions that could help to improve the affordability of poor households by increasing
household’s income. Therefore, the policy alternatives evaluated are:
1. Food Vouchers: Also known as food stamps or near-cash transfers, food vouchers could be an
intermediate policy between in-kind and cash transfers that can be distributed to poor targeted
households. These stamps could be restricted to one particular food staple or a basket of food
items. However, this mechanism is efficient when markets exist and have a reliable source of
supplies (Kramer, 1990). Two types of vouchers were considered:
Commodity-based vouchers. Giving access to a pre-defined quantity of given foods.
Value-based vouchers. Providing access to rice for a given monetary amount.
2. Cash Transfers: Accordingly to the World Bank72, cash transfers consist on the provision of
assistance in the form of cash to the poor or to those vulnerable to become poor in the absence
of the transfer. The main objective of this mechanism is to increase poor and vulnerable
households' real income. One of the advantages of cash transfer programs is the amount of
choice given to beneficiaries in using this cash compared to other transfers and also stimulates
local markets. In addition, cash transfers imply lower operating costs. However, the challenge is
to define the appropriate level and to avoid elite capture and inefficient use of the funds.
Methodology and Evaluation Criteria
Since the purpose of the current research is exploratory, descriptive, and analytical, both qualitative
and quantitative analysis was performed in order to evaluate the convenience of the different policy
alternatives described before.
Based on the literature review, most of the policy evaluations of in-kind versus food
vouchers, versus cash transfers conducted for other countries are based on experimental
methodologies such as randomization control trials. However, given the time and budget limitations,
this strategy is not feasible for this study. Therefore, the evaluation methodology used was mainly
based on documents review, comparative case studies, and personal interviews.
72 (The World Bank, Cash Transfers, 2015)

44 MABEL JOSUNE GABRIEL FERNÁNDEZ | SECOND YEAR POLICY ANALYSIS
Document Review: A broad range of documents such as laws, program guidelines, news,
program’s performance evaluations and other research papers were reviewed to better understand
the current conditions of food security and policy in Indonesia as well as the political and
administrative context.
Comparative Case Studies: Based on the literature review, there are several studies available for
countries like Mexico, Ecuador, Bangladesh, Cambodia, Congo, etc. in which the authors evaluate
in-kind transfers and vouchers relative to cash transfers. The results of those with the most similar
context to that of Indonesia (where the policy was implemented as a social protection system) are
used as reference and compared to the benchmark which is the Raskin Program as currently
implemented.
Interviews: During a field trip to Indonesia (January 2015), a series of structured and unstructured
interviews were conducted in order to capture the perceptions of local stakeholders such as central
government officials, research centers, government policy advisors, Raskin and cash transfers’
beneficiaries, as well as food security experts. Although intended, it was not possible to interview
members of the local government, ministers, Bulog staff and private consultants conducting Raskin
Business Process Review. By this approach, their perspectives on issues related to the effectiveness
and convenience of either in-kind, vouchers or cash were examined.
Field Visits: In depth observation of the distribution of Raskin rice as well as cash transfers was not
possible given that during the field trip, neither Raskin nor cash were distributed (indeed, Raskin
distribution was delayed for a month). Moreover, based on personal communications it seems there
is no way to know when Raskin distribution will occur73.
Based on the information obtained from these sources, the assessment of the different policy
alternatives will take into account five different criteria: technical correctness, cost-effectiveness,
political supportability, and administrative feasibility.
73 ( Khadijah, 2015).

45 IMPROVING FOOD ACCESS FOR POOR HOUSEHOLDS IN INDONESIA: CASH TRANSFERS AND THE RASKIN PROGRAM REFORM
Figure 24 Methodology and Criteria for Policy Selection
Source: Author’s elaboration.
Evaluation MethodologyEvaluated
Criteria
Qualita
tive a
nd
Quan
tita
tive
Analy
sis
Documents Review:
• Research Indonesia’s political context and administrative capabilities, etc. through
the study of documents such as laws, guidelines, news, performance evaluations, etc.
Comparative Case Studies:
• Analyze different impact evaluations of policy alternatives proposed for different
countries and for different staples with a similar context as Indonesia.
Interviews (structured and unstructured):
• Intended to capture perceptions of local stakeholders.
• Central government: TNP2K
• Research centers/Policy Advisor: JPAL, SMERU, World Bank
• Beneficiaries: Raskin and unconditional cash transfers urban beneficiaries
• Food security experts
Technical
Correctness
(Food
Consumption,
Calorie Intake,
Nutritional
Impact)
+
Cost
Effectiveness
+
Political
Feasibility
+
Administrative
Feasibility
INTENDED BUT NOT POSSIBLE
Field visits
• In depth observation of the implementation of Raskin and cash transfers.
Interviews (unstructured)
• Local government
• Central government ministries involved (Social Affairs, State Owned Enterprises)
• Bulog Staff
• Private consultants (Business Process Review)
Figure 23 Policy Alternatives
Source: Author’s elaboration.
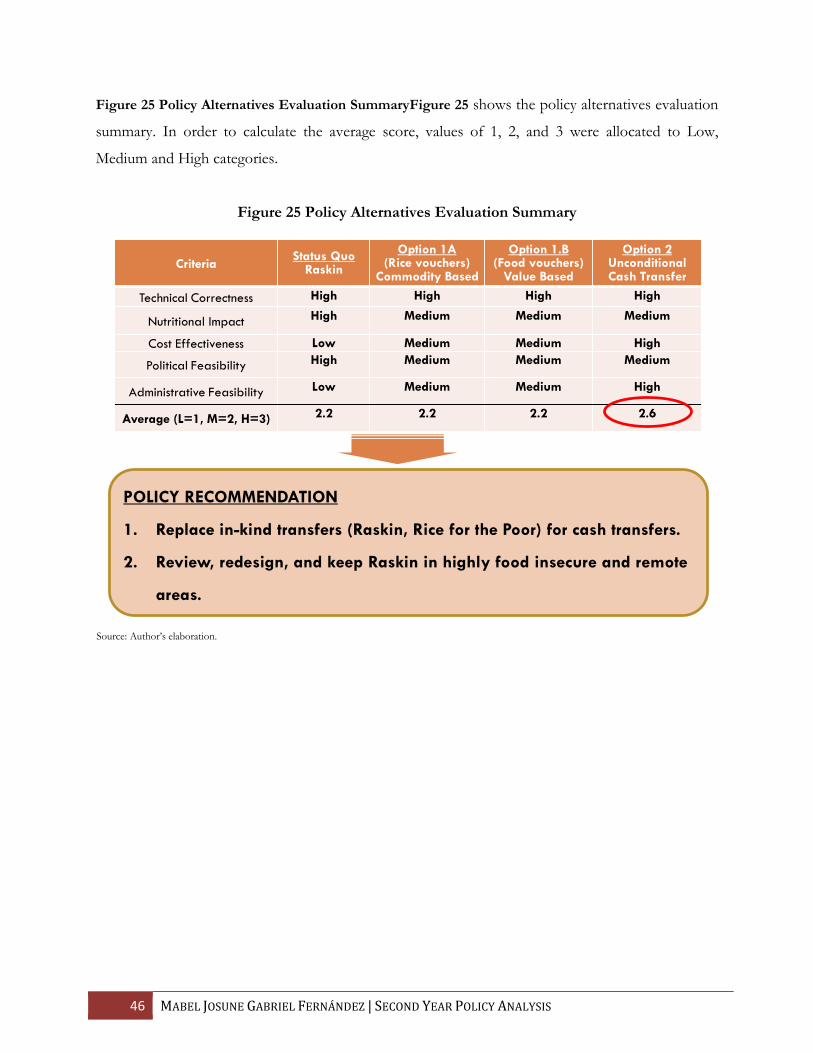
46 MABEL JOSUNE GABRIEL FERNÁNDEZ | SECOND YEAR POLICY ANALYSIS
Figure 25 Policy Alternatives Evaluation SummaryFigure 25 shows the policy alternatives evaluation
summary. In order to calculate the average score, values of 1, 2, and 3 were allocated to Low,
Medium and High categories.
Figure 25 Policy Alternatives Evaluation Summary
Source: Author’s elaboration.
Policy Alternatives Evaluation Summary
CriteriaStatus Quo
Raskin
Option 1A (Rice vouchers)
Commodity Based
Option 1.B (Food vouchers)
Value Based
Option 2Unconditional Cash Transfer
Technical Correctness High High High High
Nutritional Impact High Medium Medium Medium
Cost Effectiveness Low Medium Medium High
Political Feasibility High Medium Medium Medium
Administrative Feasibility Low Medium Medium High
Average (L=1, M=2, H=3) 2.2 2.2 2.2 2.6
POLICY RECOMMENDATION
1. Replace in-kind transfers (Raskin, Rice for the Poor) for cash transfers.
2. Review, redesign, and keep Raskin in highly food insecure and remote
areas.
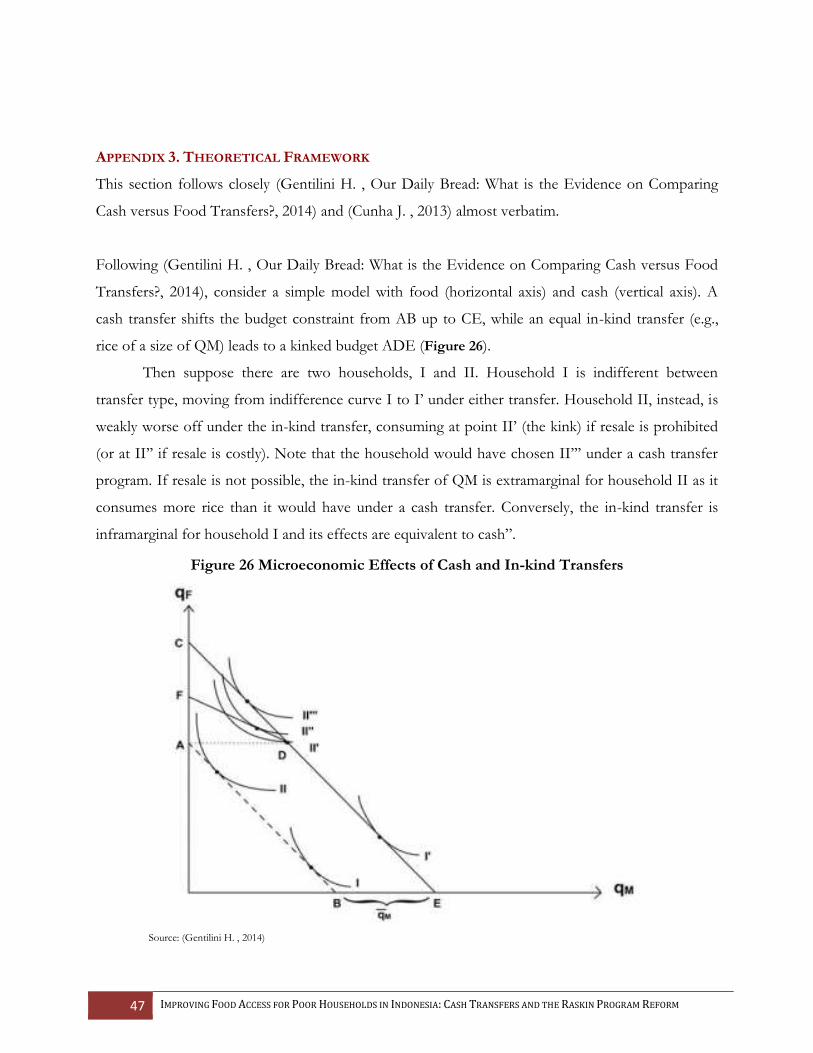
47 IMPROVING FOOD ACCESS FOR POOR HOUSEHOLDS IN INDONESIA: CASH TRANSFERS AND THE RASKIN PROGRAM REFORM
APPENDIX 3. THEORETICAL FRAMEWORK
This section follows closely (Gentilini H. , Our Daily Bread: What is the Evidence on Comparing
Cash versus Food Transfers?, 2014) and (Cunha J. , 2013) almost verbatim.
Following (Gentilini H. , Our Daily Bread: What is the Evidence on Comparing Cash versus Food
Transfers?, 2014), consider a simple model with food (horizontal axis) and cash (vertical axis). A
cash transfer shifts the budget constraint from AB up to CE, while an equal in-kind transfer (e.g.,
rice of a size of QM) leads to a kinked budget ADE (Figure 26).
Then suppose there are two households, I and II. Household I is indifferent between
transfer type, moving from indifference curve I to I’ under either transfer. Household II, instead, is
weakly worse off under the in-kind transfer, consuming at point II’ (the kink) if resale is prohibited
(or at II’’ if resale is costly). Note that the household would have chosen II’’’ under a cash transfer
program. If resale is not possible, the in-kind transfer of QM is extramarginal for household II as it
consumes more rice than it would have under a cash transfer. Conversely, the in-kind transfer is
inframarginal for household I and its effects are equivalent to cash”.
Figure 26 Microeconomic Effects of Cash and In-kind Transfers
Source: (Gentilini H. , 2014)

48 MABEL JOSUNE GABRIEL FERNÁNDEZ | SECOND YEAR POLICY ANALYSIS
If we also want to think on the effect on prices, we can follow Cunha (2013) framework.
What they do is that they depict the market of a normal good (we can think rice as a normal good)
(Figure 27Figure 26). The demand curve represents the aggregate demand faced by local suppliers.
The Figure shows the following:
Cash transfer effect: The demand curve shifts to the right via an income effect, and the
equilibrium price, p, increases. Denoting the amount of money transferred in cash by XCash, our
first prediction is that a cash transfer will cause prices to rise.
In-kind transfer effect: In-kind transfers also generate an income effect, so demand will
again shift to the right. We define the in-kind transfer amount XInKind in terms of its equivalent
cash value. Thus the demand shift caused by a transfer amount X is by definition the same for either
form of transfer. With an in-kind transfer, however, some of consumers’ demand is now provided to
them for free by the government so the residual demand facing local suppliers shifts to the left by
the amount provided in-kind.
Figure 27 Effect of Cash and In-kind Transfers on Prices
Source: (Cunha J. , 2013)

49 IMPROVING FOOD ACCESS FOR POOR HOUSEHOLDS IN INDONESIA: CASH TRANSFERS AND THE RASKIN PROGRAM REFORM
APPENDIX 4. STAKEHOLDERS MAPPING
Figure 28 Stakeholder-issue Interrelationship diagram
Source: Author’s elaboration based on documents review and interviews.
WB Poverty
Economist
NGOs
Poor
Non-poor
Village
Heads
Perum
BulogMOF
Ministry
of SOE
Kemenkokesra
TPN2K
State
Audit
Agency
Farmers
Private
Traders
Large
budget
Gain
Votes/Political
Support
Community
Cohesion
Mismanagement
of resourcesSmaller
amount, higher
price and bad
quality of
Raskin rice for
beneficiaries
Rice
Leakage
Food access
for the poor
High
Rice
Market
Price
Issue # Issues
Stakeholder has an interest
in the issue
Indonesia’s
President

50 MABEL JOSUNE GABRIEL FERNÁNDEZ | SECOND YEAR POLICY ANALYSIS
APPENDIX 5. Assessment of local markets and food supply. Mechanism 1: Suggested Food
Insecurity Index
Figure 29 Map of Ratio of Per Capita Consumption to Cereal Production
Source: (World Summit on Food Security, 2009)
Figure 30 Map of Villages Not Accessible by Four Wheel Vehicle
Source: (World Summit on Food Security, 2009)

51 IMPROVING FOOD ACCESS FOR POOR HOUSEHOLDS IN INDONESIA: CASH TRANSFERS AND THE RASKIN PROGRAM REFORM
Figure 31 Map of Underweight Children (<5 years)
Source: (World Summit on Food Security, 2009)
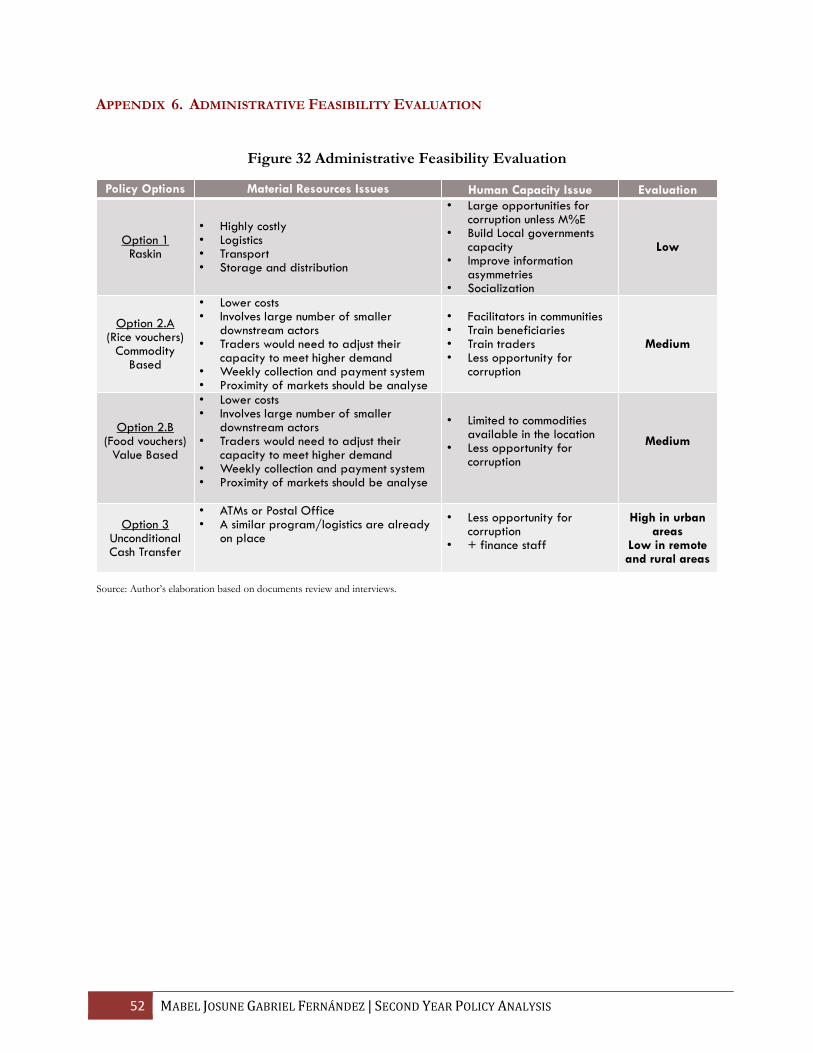
52 MABEL JOSUNE GABRIEL FERNÁNDEZ | SECOND YEAR POLICY ANALYSIS
APPENDIX 6. ADMINISTRATIVE FEASIBILITY EVALUATION
Figure 32 Administrative Feasibility Evaluation
Source: Author’s elaboration based on documents review and interviews.
Policy Options Material Resources Issues Human Capacity Issue Evaluation
Option 1Raskin
• Highly costly• Logistics• Transport• Storage and distribution
• Large opportunities for corruption unless M%E
• Build Local governments capacity
• Improve information asymmetries
• Socialization
Low
Option 2.A (Rice vouchers)
Commodity Based
• Lower costs• Involves large number of smaller
downstream actors• Traders would need to adjust their
capacity to meet higher demand• Weekly collection and payment system• Proximity of markets should be analyse
• Facilitators in communities• Train beneficiaries• Train traders• Less opportunity for
corruption
Medium
Option 2.B(Food vouchers)
Value Based
• Lower costs• Involves large number of smaller
downstream actors• Traders would need to adjust their
capacity to meet higher demand• Weekly collection and payment system• Proximity of markets should be analyse
• Limited to commodities available in the location
• Less opportunity for corruption
Medium
Option 3Unconditional Cash Transfer
• ATMs or Postal Office• A similar program/logistics are already
on place
• Less opportunity for corruption
• + finance staff
High in urban areas
Low in remoteand rural areas
53 IMPROVING FOOD ACCESS FOR POOR HOUSEHOLDS IN INDONESIA: CASH TRANSFERS AND THE RASKIN PROGRAM REFORM
REFERENCES
Ahmed, A., Quisumbing, A., Nasreen, M., Hoddinott, J., & Bryan, E. (2010). Comparing Food and Cash Transfers to the Ultra Poor in Bangladesh. Retrieved from IFPRI, Research Monograph 163.
Aker, J. (2013). Cash or Coupons? Testing the Impacts of Cash versus Vouchers in the Democratic Republic of Congo. Retrieved from CGD, Working Paper 320.
Andrews, M. e. (2012). Escaping Capability Traps through Problem-Driven Iterative Adaptation (PDIA). Retrieved from Center for Global Development: http://www.cgdev.org/sites/default/files/1426292_file_Andrews_Pritchett_Woolcock_traps_FINAL_0.pdf
Arifin, B. (2008). From Remarkable Success Stories to Troubling Present: The Case of BULOG in Indonesia, From Parastatals to Private Trade. The Case of BULOG in Indonesia. Retrieved from International Food Policy Reseacrh Institute: http://www.researchgate.net/publication/259045218_From_Remarkable_Success_Stories_to_Troubling_Present_The_Case_of_BULOG_in_Indonesia
Ariyanti, F. (2014). Electronic Money Will Substitute Rice from Raskin. Retrieved from Liputan6: http://bisnis.liputan6.com/read/2153981/uang-elektronik-bakal-jadi-pengganti-beras-raskin
Ash Centerfor Democratic Governance and Innovation. (2014). The Sum is Greater than the Parts: Doubling Shared Prosperity in Indonesia. Retrieved from http://www.ash.harvard.edu/extension/ash/docs/indonesia2013.pdf
Asia News Network. (n.d.). Indonesia government redesigns rice program. Retrieved from http://www.asianewsnet.net/Indonesian-govt-redesigns-rice-program-59529.html
Banerjee, A. (2014). Improving the transparency and Delivery of a Subsidized Rice Program in Indonesia. Retrieved from Poverty Action Lab: http://www.povertyactionlab.org/evaluation/improving-transparency-and-delivery-subsidized-rice-program-indonesia
Banerjee, A. e. (2014). Information is Power: Identification Cards and Food Subsidy Programs in Indonesia. Retrieved from Working Paper, MIT: http://www.povertyactionlab.org/publication/information-power-identification-cards-and-food-subsidy-programs-indonesia
Barker, M., Filmer, D., & Rigolini, J. (2014). Evaluating Food versus Cash Assistance in Rural Cambodia. Retrieved from World Bank.
Barrett, C. e. (2009). Market information and food insecurity response analysis. Retrieved from Springer Link: http://link.springer.com/article/10.1007/s12571-009-0021-3
Charity Science. (2015). Charity Science-Scientifically backed causes. Retrieved from http://www.charityscience.com/proven-charities-outdated-page.html
Coordinating Ministry for People's Welfare. (n.d.). Retrieved from Portal Nasional Republic Indonesia: http://www.indonesia.go.id/en/ministries/minister-of-coordinator/coordinating-minister-

54 MABEL JOSUNE GABRIEL FERNÁNDEZ | SECOND YEAR POLICY ANALYSIS
for-people-welfare/1636-profile/2491-kementerian-koordinator-bidang-pembangunan-manusia-dan-kebudayaan
Cunha, J. (2013). The Price Effects of Cash Versus In-Kind Transfers. Retrieved from Northwestern University: http://faculty.wcas.northwestern.edu/~sjv340/pal.pdf
Cunha, J. (2014). Testing Paternalism: Cash versus In-kind Transfers. Retrieved from American Economic Journal.
D. E. (n.d.). Cash and vouchers distribution through the project cycle. Retrieved from DG Echo Partners' Helpdesk: http://fpa2008.dgecho-partners-helpdesk.eu/implementing_an_action/cash_and_vouchers/cv_project_cycle
DG ECHO Partner. (2015). Vouchers Transfers. Retrieved from http://fpa2008.dgecho-partners-helpdesk.eu/implementing_an_action/cash_and_vouchers/voucher_transfer
DG ECHO Partner. (n.d.). DG ECHO. Retrieved 2015, from http://fpa2008.dgecho-partners-helpdesk.eu/implementing_an_action/cash_and_vouchers/voucher_transfer/voucher_type
DG ECHO Partners. (2015a). Cash and vouchers distribution through the project cycle. Retrieved from http://fpa2008.dgecho-partners-helpdesk.eu/implementing_an_action/cash_and_vouchers/cv_project_cycle
DG Echo Partners' Helpdesk. (n.d.). Cash transfer modalities. Retrieved from DG Echo Partners' Helpdesk: http://fpa2008.dgecho-partners-helpdesk.eu/implementing_an_action/cash_and_vouchers/cash_transfer/modalities#cards
Dodge, E. e. (2012). Food Security and Rice Price Stabilization in Indonesia: Analysis of Policy Responses. Retrieved from Second Year Policy Analysis. Harvard Kennedy School. Harvard University: http://www.hks.harvard.edu/var/ezp_site/storage/fckeditor/file/pdfs/degree-programs/mpaid/SYPA_Dodge_Gemessa_2012.pdf
EMMA. (2015). Emergency Market Mapping and Analysis Toolkit. Retrieved from http://emma-toolkit.org/practice/pre-crisis-market-mapping-and-analysis/
Fajar. (2014). Retrieved from http://fajar.co.id/2014/11/03/2015-raskin-disalurkan-lewat-e-money.html
Gentilini, H. (2007). Cash and Food Transfers: A Primer. Retrieved from http://www.wfp.org/sites/default/files/OP18_Cash_and_Food_Transfers_Eng%2007.pdf
Gentilini, H. (2008). Cash transfers, vouchers and food transfers: an overview of key issues. Retrieved from World Food Programme – WFP. Rome, Italy: http://www.rural21.com/uploads/media/R21_Cash_transfers__vouchers_and_food_transfers_0508.pdf
Gentilini, H. (2014). Our Daily Bread: What is the Evidence on Comparing Cash versus Food Transfers? Retrieved from World Bank Group. Social Protection and Labor: FALTAAAAAA
Global Food Security Index. (2015). Global Food Security Index. Retrieved from The Economist Intelligence Unit: http://foodsecurityindex.eiu.com/Country/Details#Indonesia
55 IMPROVING FOOD ACCESS FOR POOR HOUSEHOLDS IN INDONESIA: CASH TRANSFERS AND THE RASKIN PROGRAM REFORM
Hastuti. (2008). The Effectiveness of the Raskin Program. Retrieved from The SMERU Research Institute: http://www.smeru.or.id/report/research/raskin2007/raskin2007_eng.pdf
Hidrobo, e. a. (2014). Cash, Food, or Vouchers? Evidence from a Randomized Experiment in Northern Ecuador. Retrieved from Journal of Development Economics 107: FALTA?
Humanitarian News and Analysis. (2015). Analysis: Indonesia's Social Targeting Challenge. Retrieved from http://www.irinnews.org/printreport.aspx?reportid=99074
Indonesia Government Amends "Rice for the Poor" Program. (2014, June 3). Retrieved from Oryza: http://www.oryza.com/news/rice-news/indonesia-government-amends-rice-poor-program
Indonesia's rice-for-poor scheme to test new president. (2014). Retrieved from Reuters: http://www.reuters.com/article/2014/08/28/indonesia-food-idUSL4N0QQ2IU20140828
Jakarta Households Interviews. (2015, January 16). Personal communication.
J-PAL. (2014). Central Bureau Statistics, Indonesia. Retrieved from Market Information and Food Insecurity Response Analysis
J-PAL. (n.d.). Raskin: Improving Targeting and Distribution of Subsidized Rice. Retrieved 2015, from http://www.povertyactionlab.org/scale-ups/raskin-improving-targeting-and-distribution-subsidized-rice
Kementerian Coordinator. (n.d.). Retrieved from Kemenkoskera: http://www.kemenkopmk.go.id/kedudukan-tugas-dan-fungsi
Kepri Update. (2015, April 14). Kepri Update- Cartel Infiltrated Raskin. Retrieved from http://www.kepriupdate.com/raskin-infiltrated-cartel/
Khadijah, N. (2015, January). Personal communications.
Khera, R. e. (2014). Cash vs. in-kind transfers: Indian data meets theory. Food Policy Journal.
Koran Tempo. (2014). Retrieved from http://koran.tempo.co/konten/2014/12/10/359230/Bulog-Tunggu-Petunjuk-Teknis-Penghapusan-Raskin
Kramer, C. (1990). Targeting Food Subsidies. Retrieved from Social Sector Policy Analysis Project Operated by the Academy for Educational Development: http://pdf.usaid.gov/pdf_docs/PNABH084.pdf
Leroy, J., Gadsden, P., Rodriguez-Ramirez, S., & Gonzales de Cossio, T. (2010). Cash and In-kind Transfers in Poor Rural Communities and Mexico Increase Household Fruit, Vegetable and Micronutrient Consumption but also Lead to Excess Energy Consumption. Retrieved from Journal of Nutrition.
Liputan6. (2014). Electronic Money Will Substitute Rice from Raskin.
Magen M., e. a. (2009). Can Cash Transfers Promote Food Security in the Context of Volatile Commodity Prices? A Review of Empirical Evidence. Retrieved from Department of Economics. Michigan State University: http://fsg.afre.msu.edu/papers/idwp96.pdf
56 MABEL JOSUNE GABRIEL FERNÁNDEZ | SECOND YEAR POLICY ANALYSIS
Margolies, e. a. (2014). Costing alternative transfer modalities. Retrieved from International Food Policy Research Institute.
Matta, N. e. (2001). Local Empowerment Through Rapid Results. Retrieved from Stanford Social Innovation Review. Leland Stanford Jr. University: http://rapidresultsinstitute.info/wp-content/uploads/2012/02/Local-Empowerment-Through-Rapid-Results.pdf
Mr.Cheap Justice's Blog. (n.d.). Mr. cheap justice's blog-Why There Are A Lot Of Poor People In The Philippines. Retrieved from https://mrcheapjustice.wordpress.com/2014/08/06/why-there-are-a-lot-of-poor-people-in-the-philippines/
Olken, B. (2005). Corruption and the costs of redistribution: Micro evidence from Indonesia. Retrieved from http://projects.iq.harvard.edu/gov2126/files/olken_indonesia_0.pdf
Oryza.com. (2014). Indonesi'as government Ammends Rice for the Poor Program. Retrieved from http://www.oryza.com/news/rice-news/indonesia-government-amends-rice-poor-program
Pangaribowo, E. H. (2012). The Impact of ‘Rice for the Poor’ on Household Consumption. Retrieved from Department of Economic and Technological Change. Center for Development Research. University of Bonn: http://ageconsearch.umn.edu/bitstream/124358/2/2012ACpercent20Pangaribowopercent20CP.pdf
Policy Direction Ministry of SOES. (2015). Retrieved from Ministry of State Owned Enterprises: http://bumn.go.id/halaman/132/Arah.Kebijakan
Poverty and Hunger Issues and Options for Food Security in Developing Countries. (1986). Retrieved from The World Bank: http://www-wds.worldbank.org/external/default/WDSContentServer/WDSP/IB/1999/09/17/000178830_98101901455676/Rendered/PDF/multi_page.pdf
Pre-Crisis Market Mapping and Analysis. (n.d.). Retrieved from Emergency Market Mapping Analysis Toolkit: http://emma-toolkit.org/practice/pre-crisis-market-mapping-and-analysis/
Rio 2012 Issues Brief. (2011). Retrieved from United Nations Conference on Sustainable Development: https://sustainabledevelopment.un.org/content/documents/316brief9.pdf
Skoufias, E., Unar, M., & Gonzalez-Cossio. (2008). The Impacts of Cash and In-Kind Transfers on Consumption and Labor Supply: Experimental Evidence from Rural Mexico. Retrieved from World Bank, Policy Working Paper 4778.
Sumarto, S. (2011). Social Protection in Indonesia: Past Experiences and Lessons for the Future. Retrieved from Annual Bank Conference on Development Opportunities: http://siteresources.worldbank.org/EXTABCDE/Resources/7455676-1292528456380/7626791-1303141641402/7878676-1306270833789/ABCDE-Submission-Sumarto_and_Bazzi.pdf
Sumarto, S. (2012). Reducing leakages: Key lessons and challenges from policy-making in Indonesia challenges from policy-making in Indonesia.

57 IMPROVING FOOD ACCESS FOR POOR HOUSEHOLDS IN INDONESIA: CASH TRANSFERS AND THE RASKIN PROGRAM REFORM
Sumarto, S. (2014). Improving Targeting and Distribution of the Raskin Program in Indonesia. Retrieved from Workshop on Impact Evaluation: Theory, Practice and Decision-making. 3ie/ADB Conference: Making Impact Evaluation Matter: http://www.3ieimpact.org/media/filer_public/2014/09/16/22_impact_evaluation_theory_practice_and_decision_making_sumarto.pdf
Sumarto, S. e. (2004). Assessing the Impact of Indonesian Social Safety Net Programs on Household Welfare and Poverty Dynamics. Retrieved from The SUMERU Research Institute: http://www.smeru.or.id/report/workpaper/assessing/Assessingindososimpaceng.pdf?origin=publication_detail
The People's Gazete. (2015). Govt Lacks of Supervision over Bulog Rice Distribution. Retrieved from https://peoplesgazette.wordpress.com/2015/03/02/govt-slow-rice-distribution-leads-to-price-hike/
The World Bank. (2012). BLT Temporary Unconditional Cash Transfer Social Assistance Program and Public Expenditure Review 2. Retrieved from The World Bank: http://www-wds.worldbank.org/external/default/WDSContentServer/WDSP/IB/2012/03/06/000333037_20120306001405/Rendered/PDF/673240WP0BLT0T00Box367866B00PUBLIC0.pdf
The World Bank. (2012). Raskin Subsidized Rice Delivery Social Assistance Program and Public Expenditure Review 3. Retrieved from The World Bank: http://www-wds.worldbank.org/external/default/WDSContentServer/WDSP/IB/2012/03/06/000333038_20120306005448/Rendered/PDF/673080WP00PUBL0Background0Paper0030.pdf
The World Bank. (2012). Raskin Subsidized Rice Delivery. Social Assistance Program and Public Expenditure Review 3. Retrieved from The World Bank: http://www-wds.worldbank.org/external/default/WDSContentServer/WDSP/IB/2012/03/06/000333038_20120306005448/Rendered/PDF/673080WP00PUBL0Background0Paper0030.pdf
The World Bank. (2015). Cash Transfers. Retrieved from The World Bank: http://go.worldbank.org/SLVVVWMW50
Timmer, P. (2004). Food Security in Indonesia: Current Challenges and the Long-Run Outlook. Retrieved from Center for Global Development. Working Paper N. 48.
Timmer, P., & Dethloff, D. (2015, January). Personal communications. (M. Gabriel, Interviewer)
TNP2K. (n.d.). Family Welfare Deposit. Retrieved from The National Team for the Acceleration of Poverty Reduction: http://www.tnp2k.go.id/en/programmes/programmes-to-create-productive-families/family-welfare-deposit/
TNP2K Programmes to Create Productive Families. (n.d.). Programmes to Create Productive Families. Retrieved from http://www.tnp2k.go.id/en/programmes/programmes-to-create-productive-families/realisasi-penyaluran-simpanan-keluarga-sejahtera-2015/
TNP2K. (n.d.). Raskin - Subsidised Rice for the Poor. Retrieved 2015, from http://www.tnp2k.go.id/en/frequently-asked-questions-faqs/cluster-i-2/subsidised-rice-for-the-poor-programme-raskin/
58 MABEL JOSUNE GABRIEL FERNÁNDEZ | SECOND YEAR POLICY ANALYSIS
TPN2K. (n.d.). About the Social Protection Card. Retrieved from The National Team for the Acceleration of Poverty Reduction: http://www.tnp2k.go.id/en/programmes/social-protection-card-kps/about-the-social-protection-card/
USAID. (2011). Accelerating Mobile Money in Idnoensia. Retrieved from https://egateg.usaid.gov/sites/default/files/D1.%20FS%20Share_Opportunity_Assessment_Final.pdf
USAID. (2011). Accelerating Mobile Money in Indonesia. Opportunity Assessment. Retrieved from USAID: http://egateg.usaid.gov/sites/default/files/D1.%20FS%20Share_Opportunity_Assessment_Final.pdf
Warr, P. (2014). Food Insecurity and its Determinants. Retrieved from http://papers.ssrn.com/sol3/papers.cfm?abstract_id=2512996
Widianto, B. (2013). Program Raskin 2013. Retrieved from TNP2K.
World Food Programme. (2006). Cash and Food Transfers for Food Security and Nutrition. Emerging Insights and Knowledge Gaps. 5.
World Food Programme. (2009). A Food Security Security and Vulnerability Vulnerability Atlas of Indonesia Indonesia. Retrieved from http://documents.wfp.org/stellent/groups/public/documents/ena/wfp236710.pdf
World Summit on Food Security. (2009). Declaration of the World Summit on Food Security. Retrieved from World Summit on Food Security: http://www.fao.org/fileadmin/templates/wsfs/Summit/Docs/Final_Declaration/WSFS09_Declaration.pdf
Yonekura, H. (2005). Institutional Reform in Indonesia’s Food Security Sector: The Transformation of BULOG into a Public Corporation. Retrieved from The Developing Economies. XLIII-I: http://www.ide.go.jp/English/Publish/Periodicals/De/pdf/05_01_06.pdf


![ASIAN DEVELOPMENT BANK · 2014. 9. 29. · BAPPENAS - Badan Perencanaan Pembangunan Nasional [National Development Planning Agency] BULOG - Badan Urusan Logistik [Food Logistics Agency]](https://static.fdocuments.in/doc/165x107/6099558250f9bd5c79283617/asian-development-bank-2014-9-29-bappenas-badan-perencanaan-pembangunan-nasional.jpg)


