Improving Flash Write Performance by Using Update Frequency
12
Improving Flash Write Performance by Using Update Frequency Radu Stoica École Polytechnique Fédérale de Lausanne radu.stoica@epfl.ch Anastasia Ailamaki École Polytechnique Fédérale de Lausanne anastasia.ailamaki@epfl.ch ABSTRACT Solid-state drives (SSDs) are quickly becoming the de- fault storage medium as the cost of NAND flash memory continues to drop. However, flash memory introduces new challenges, as data cannot be efficiently updated in-place. To overcome the technology’s limitations, SSDs incorpo- rate a software Flash Translation Layer (FTL) that imple- ments out-of-place updates, typically by storing data in a log-structured fashion. Despite a large number of existing FTL algorithms, SSD performance, predictability, and life- time remain an issue, especially for the write-intensive work- loads specific to database applications. In this paper, we show how to design FTLs that are more efficient by using the I/O write skew to guide data place- ment on flash memory. We model the relationship between data placement and write performance for basic I/O write patterns and detail the most important concepts of writing to flash memory: i) the trade-off between the extra capac- ity available and write overhead, ii) the benefit of adapt- ing data placement to write skew, iii) the impact of the cleaning policy, and iv) how to estimate the best achievable write performance for a given I/O workload. Based on the findings of the theoretical model, we propose a new prin- cipled data placement algorithm that can be incorporated into existing FTLs. We show the benefits of our data place- ment algorithm when running micro-benchmarks and real database I/O traces: our data placement algorithm reduces write overhead by 20% - 75% when compared to state-of-art techniques. 1 Introduction Solid State Drives (SSD) are becoming the default stor- age medium in enterprise applications such as for database workloads. However, the write behavior of the underlying NAND flash technology is problematic. Flash memory can- not be written directly (updated in-place) but needs an erase operation prior to a program operation (erase-then-write). While flash pages can be read and programmed individually, erasures are particularly time consuming (Table 1) and af- fect large blocks of pages (Table 2). In addition, due to the Permission to make digital or hard copies of all or part of this work for personal or classroom use is granted without fee provided that copies are not made or distributed for profit or commercial advantage and that copies bear this notice and the full citation on the first page. To copy otherwise, to republish, to post on servers or to redistribute to lists, requires prior specific permission and/or a fee. Articles from this volume were invited to present their results at The 39th International Conference on Very Large Data Bases, August 26th - 30th 2013, Riva del Garda, Trento, Italy. Proceedings of the VLDB Endowment, Vol. 6, No. 9 Copyright 2013 VLDB Endowment 2150-8097/13/07... $ 10.00. NAND Flash Table 1: Raw operations Page Read 80μs Page Program 200μs Block Erase 1.5ms Max. Erasures 5 × 10 3 -10 5 Table 2: Organization Page size 512B – 16kB Block size 32kB – 512kB Pages per block 64 – 128 elevated voltage required by an erase, a block can withstand only a limited number of erase cycles before the accumu- lated physical damage renders it unusable. The slow pro- gram and erase operations result in low NAND flash write performance alongside with limited device lifetime. To make things worse, the hardware trends are discouraging [8]: write and erase latencies of future NAND chips are expected to increase, while erase endurance is expected to decrease. The alternative to performing in-place updates is to use an extra indirection layer, known in the literature, as the Flash Translation Layer (FTL) that performs out-of-place writes and deals transparently with the technology’s constraints. The FTL redirects incoming writes to unoccupied and al- ready erased locations, while old data versions are logically marked invalid and cleaned later, i.e. garbage collected. The key challenge in implementing an efficient FTL is to control data placement so that invalid pages can be re- claimed in bulk. At one extreme, if a block contains only invalid data, it can be erased immediately and the erase la- tency is amortized over n future page writes. At the other extreme, if a block contains a single invalid page, we need to read out n - 1 valid pages, write them back to a different location, and finally perform the erase – all to allow for a single page write. Thus, write performance and device wear can fluctuate by two orders of magnitude as a function of the data placement and the cleaning policy. Unfortunately, due to the large size of an erase block, valid and invalid data often end up collocated resulting in expen- sive data moves needed to reclaim space. Experience shows that an FTL is notoriously difficult to “get right” because of to the complex dependency of flash cleaning overhead on: i) I/O workload, and ii) a multitude of FTL design choices such as the amount of space over-provisioning, data place- ment algorithm, and cleaning policy. In spite of a large body of existing research work, the end result is a low and unpre- dictable SSD write performance [2]. This stands especially for database I/O intensive workloads that generate small scattered writes. In this paper, we give a principled answer the question: How much can we reduce the writing overhead of an FTL by leveraging write skew to guide data placement? We model the cleaning overhead analytically for a set of basic I/O 733
Transcript of Improving Flash Write Performance by Using Update Frequency

Improving Flash Write Performance by Using UpdateFrequency
Radu StoicaÉcole Polytechnique Fédérale de Lausanne
Anastasia AilamakiÉcole Polytechnique Fédérale de Lausanne
ABSTRACTSolid-state drives (SSDs) are quickly becoming the de-
fault storage medium as the cost of NAND flash memorycontinues to drop. However, flash memory introduces newchallenges, as data cannot be efficiently updated in-place.To overcome the technology’s limitations, SSDs incorpo-rate a software Flash Translation Layer (FTL) that imple-ments out-of-place updates, typically by storing data in alog-structured fashion. Despite a large number of existingFTL algorithms, SSD performance, predictability, and life-time remain an issue, especially for the write-intensive work-loads specific to database applications.
In this paper, we show how to design FTLs that are moreefficient by using the I/O write skew to guide data place-ment on flash memory. We model the relationship betweendata placement and write performance for basic I/O writepatterns and detail the most important concepts of writingto flash memory: i) the trade-off between the extra capac-ity available and write overhead, ii) the benefit of adapt-ing data placement to write skew, iii) the impact of thecleaning policy, and iv) how to estimate the best achievablewrite performance for a given I/O workload. Based on thefindings of the theoretical model, we propose a new prin-cipled data placement algorithm that can be incorporatedinto existing FTLs. We show the benefits of our data place-ment algorithm when running micro-benchmarks and realdatabase I/O traces: our data placement algorithm reduceswrite overhead by 20% - 75% when compared to state-of-arttechniques.
1 IntroductionSolid State Drives (SSD) are becoming the default stor-
age medium in enterprise applications such as for databaseworkloads. However, the write behavior of the underlyingNAND flash technology is problematic. Flash memory can-not be written directly (updated in-place) but needs an eraseoperation prior to a program operation (erase-then-write).While flash pages can be read and programmed individually,erasures are particularly time consuming (Table 1) and af-fect large blocks of pages (Table 2). In addition, due to the
Permission to make digital or hard copies of all or part of this work forpersonal or classroom use is granted without fee provided that copies arenot made or distributed for profit or commercial advantage and that copiesbear this notice and the full citation on the first page. To copy otherwise, torepublish, to post on servers or to redistribute to lists, requires prior specificpermission and/or a fee. Articles from this volume were invited to presenttheir results at The 39th International Conference on Very Large Data Bases,August 26th - 30th 2013, Riva del Garda, Trento, Italy.Proceedings of the VLDB Endowment, Vol. 6, No. 9Copyright 2013 VLDB Endowment 2150-8097/13/07... $ 10.00.
NAND Flash
Table 1: Raw operationsPage Read 80µs
Page Program 200µs
Block Erase 1.5ms
Max. Erasures 5 × 10³-105
Table 2: OrganizationPage size 512B – 16kB
Block size 32kB – 512kB
Pages per block 64 – 128
elevated voltage required by an erase, a block can withstandonly a limited number of erase cycles before the accumu-lated physical damage renders it unusable. The slow pro-gram and erase operations result in low NAND flash writeperformance alongside with limited device lifetime. To makethings worse, the hardware trends are discouraging [8]: writeand erase latencies of future NAND chips are expected toincrease, while erase endurance is expected to decrease.
The alternative to performing in-place updates is to use anextra indirection layer, known in the literature, as the FlashTranslation Layer (FTL) that performs out-of-place writesand deals transparently with the technology’s constraints.The FTL redirects incoming writes to unoccupied and al-ready erased locations, while old data versions are logicallymarked invalid and cleaned later, i.e. garbage collected.
The key challenge in implementing an efficient FTL isto control data placement so that invalid pages can be re-claimed in bulk. At one extreme, if a block contains onlyinvalid data, it can be erased immediately and the erase la-tency is amortized over n future page writes. At the otherextreme, if a block contains a single invalid page, we needto read out n− 1 valid pages, write them back to a differentlocation, and finally perform the erase – all to allow for asingle page write. Thus, write performance and device wearcan fluctuate by two orders of magnitude as a function ofthe data placement and the cleaning policy.
Unfortunately, due to the large size of an erase block, validand invalid data often end up collocated resulting in expen-sive data moves needed to reclaim space. Experience showsthat an FTL is notoriously difficult to “get right” becauseof to the complex dependency of flash cleaning overhead on:i) I/O workload, and ii) a multitude of FTL design choicessuch as the amount of space over-provisioning, data place-ment algorithm, and cleaning policy. In spite of a large bodyof existing research work, the end result is a low and unpre-dictable SSD write performance [2]. This stands especiallyfor database I/O intensive workloads that generate smallscattered writes.
In this paper, we give a principled answer the question:How much can we reduce the writing overhead of an FTL byleveraging write skew to guide data placement? We modelthe cleaning overhead analytically for a set of basic I/O
733

write patterns (k-modal update distributions), data place-ment policies, and cleaning strategies. Based on the analyt-ical results, we propose a new data placement algorithm thatutilizes update frequency to reduce FTL cleaning overhead,and thus improves write performance and device lifetime.
This paper makes the following contributions:1. We model the impact of space over-provisioning, writefrequency, data placement policy, and garbage collectionstrategy on FTL cleaning overhead. The model is usefulfor validating and guiding the design of FTL data place-ment algorithms. We verify the analytical results throughdetailed simulation.2. We approximate the minimum cleaning overhead achiev-able for any given I/O workload within an error margin,which allows us to quantify the headroom for reducing thecleaning overhead of any FTL.3. Based on the modeling results, we propose a data place-ment algorithm that exploits update frequency in a princi-pled way and is capable to adapt dynamically to the I/Owrite pattern, without relying on workload-specific parame-ters. The new data placement algorithm can be integratedinto existing hybrid or page-level mapping FTLs (as wediscuss in Section 2.4). Experimental results show thatour algorithm reduces cleaning overhead by 20%-75% com-pared to state-of-art techniques across a variety of micro-benchmarks and I/O traces collected from standard DBMSbenchmarks such as TPC-C [24] or TATP [19].
The paper is organized as follows: In Section 2 we presentthe challenges of storing data on flash and existing state-of-art data placement algorithms. In Section 3 we explain theFTL concepts and notations used throughout the paper. InSection 4 we model analytically the cleaning overhead fork-modal update distributions and highlight the importantlessons found. In Section 5, based on the analytical results,we propose a new data placement algorithm and in Section 6compare our proposal with existing state-of-art algorithms.Finally, we conclude in Section 7.
2 Related WorkIn this section, we highlight the evolution of data place-
ment algorithms for out-of-place updates and give insighton why a novel approach can lower FTL cleaning overhead.
2.1 State-of-art Data Placement AlgorithmsThe concept of out-of-place updates on NAND flash mem-
ory is simple at heart: instead of performing the costly erase-then-write cycle on a large erase block, introduce an extraindirection layer between the logical address written andthe physical location (erase block and page number) wherethe user data is stored. At an update request, the FTLcan redirect the write to an unoccupied and already erasedlocation; the old version of the data is logically marked in-valid and garbage-collected later. No in-place updates areneeded, and, in the most favorable scenario, only one eraseis required for writing a full block worth of new data.
The overhead of reclaiming space, i.e. the number of pagesin a block we need to move before an erase, dictates theefficiency of out-of-place writes. It is obvious that a gooddata placement algorithm groups together pages with similarupdate frequencies. Otherwise, if cold and hot data arecollocated, the hot pages are invalidated quickly, while thecold pages are left behind acting as dead-weight and need tobe relocated when the block is cleaned. Virtually all FTL
data placement proposals try to group data based on itsupdate frequency.
Rosenblum and Ousterhout first encountered the data place-ment question for out-of-place writes in the context of theLFS log-structured file-system [23]. In LFS, small scatteredwrites are stored sequentially on magnetic disks, resulting ina high write throughput, while creating the need to reclaimthe invalid data left behind. The authors first noticed thatstoring together data with similar update frequencies is keyto minimizing cleaning overhead and introduced a cleaningalgorithm that tries to categorize data as hot/cold and bal-ance the amount of free space reclaimed and data age.
The initial ideas of LFS were refined over time and adaptedto flash-based systems. Kawaguchi et al. [14] tuned the LFScost-benefit heuristic to match NAND flash behavior, andeNVy [26], the first FTL-like proposal, further improved onthe LFS data placement concepts. eNVy splits space intofix-sized partitions (log structures in reality) composed ofsegments (erase blocks), while pages migrate between parti-tions in a way that encourages locality of reference. eNVyaims to equalize the cleaning cost of partitions, defined asthe product of the update frequency and the overhead ofcleaning a partition.
Chiang et al. proposed Dynamic Age Clustering (DAC)[5], which, similarly to eNVy, shares the overall design ofpartitioning to space in regions but, unlike eNVy, uses dif-ferent page migration policies between regions. Pages arepromoted to a colder region when garbage collected, and toa hotter region when updated and if their age (measured inseconds) is smaller than a workload dependent threshold.
More recently, Hu et al. proposed ContainerMarking [12],a data placement technique with an overall design similar toeNVy and DAC. Space is partitioned in more fine-grainedregions (also behaving as log structures) and data migratesbetween neighboring regions to encourage separation basedon update frequency. Pages are promoted to a hotter par-tition at every update, and demoted to a colder partitionat garbage collection based on a statistical model. The keydifference over previous approaches is to take into accountthe occupancy of the log structures and decreases demotionrate when occupancy is high.
2.2 Data Placement ChallengeThere are two main challenges when moving data between
two regions. Firstly, there is a highly non-linear relationshipbetween the occupancy of a region and its cleaning cost.For example, in Section 4.1, we show that the cleaning costincreases faster than exponentially with occupancy for ran-dom updates. Secondly, the increase/decrease in the clean-ing cost of the regions cannot be assessed immediately but isexperienced at a much later time. When pages migrate be-tween two regions, the valid page counts of the oldest blocks– the blocks first in line to be cleaned – remain the sameand thus the cleaning cost appear initially unaffected by thedata movement. The full effect of the data movement isnoticed only after writing all the blocks of a region once.
For example, consider two partitions, the first one with adisproportionately high occupancy and cleaning cost com-pared to the second. It is clear we need to move some datafrom the first partition to the second one; however, it is notclear how much or which data to move. A static data pro-motion policy (e.g. trying to equalize cleaning cost between
734
the two partitions or a simple always promote/demote strat-egy) results in data movement swings triggered by changesin region occupancy rather than changes in the workloadskew. Pages initially move in one direction from the firstpartition to the second with a lower cost cleaning cost. Atsome point, the cleaning frequency and/or cleaning costsbecome comparable and the page migration stops. Unfor-tunately, by this time, too many pages have been alreadymoved and the cleaning cost of the second partition contin-ues to increases. Finally, the migration process reverts inthe opposite direction.
In this paper, we address the limitations of the previ-ous data placement approaches through a principled under-standing of the relationship between the cleaning cost anddata placement decisions. We model the cleaning cost ana-lytically for sufficiently general update distributions that al-lows us to reason about the fundamental cleaning overheadof any given I/O workload. Based on the findings of the ana-lytical model, we then propose a principled data placementalgorithm that is close to optimal within a margin of er-ror. Our data placement algorithm distinguishes itself fromprevious proposals in the following ways:
• No tunable parameters. Previous proposals rely on vari-able parameters that are workload specific. Examples in-clude the number of regions [12, 5, 26], the time thresholdto migrate data from one region to the next [5], the empir-ical probabilistic model of [12].
• No mismatch between region size and the page updatefrequency. Previous approaches suggest fixed sized regionsthat possible lead to collocating pages with very differentupdate frequencies; our data proposal determines the opti-mal number of regions (i.e. log structures) and their opti-mal size at runtime.
• Accurate page promotion/demotion. A strawman strat-egy that always promotes pages to a hotter region whenupdated and demotes them to a colder region when cleanedis known to result in suboptimal performance [12]. Whencleaning, we can differentiate if a page is cleaned due tothe region occupancy or because it truly has a lower up-date frequency. When updating, we can identify the precisethreshold when page is hot enough to justify promoting itto a hotter region.
These keys differences enable our data placement algo-rithm to achieve a much lower cleaning overhead than thestate-of-art techniques. We show in Section 6 our dataplacement proposal reduces cleaning overhead by 20-75%for DBMS I/O traces of TPC-C and TATP workloads.
2.3 Other Modeling ApproachesHu et al.[11] introduce a write performance model for ran-
dom updates and consider various cleaning policies suchas LRU (FIFO), Greedy, and Window-Greedy. However,as the analytic model has certain weaknesses at low over-provisioning values, a second empirical model is fitted di-rectly from simulation results. We propose a different mod-eling approach for understanding cleaning performance withan almost perfect accordance with experimental results. Mostimportantly, our model is capable of representing much moregeneral update distributions (k-modal update distributions).
Bux and Iliadis [3] modeled the performance of the Greedygarbage collection policy for random updates. The authorspropose two different techniques: a precise Markov chain
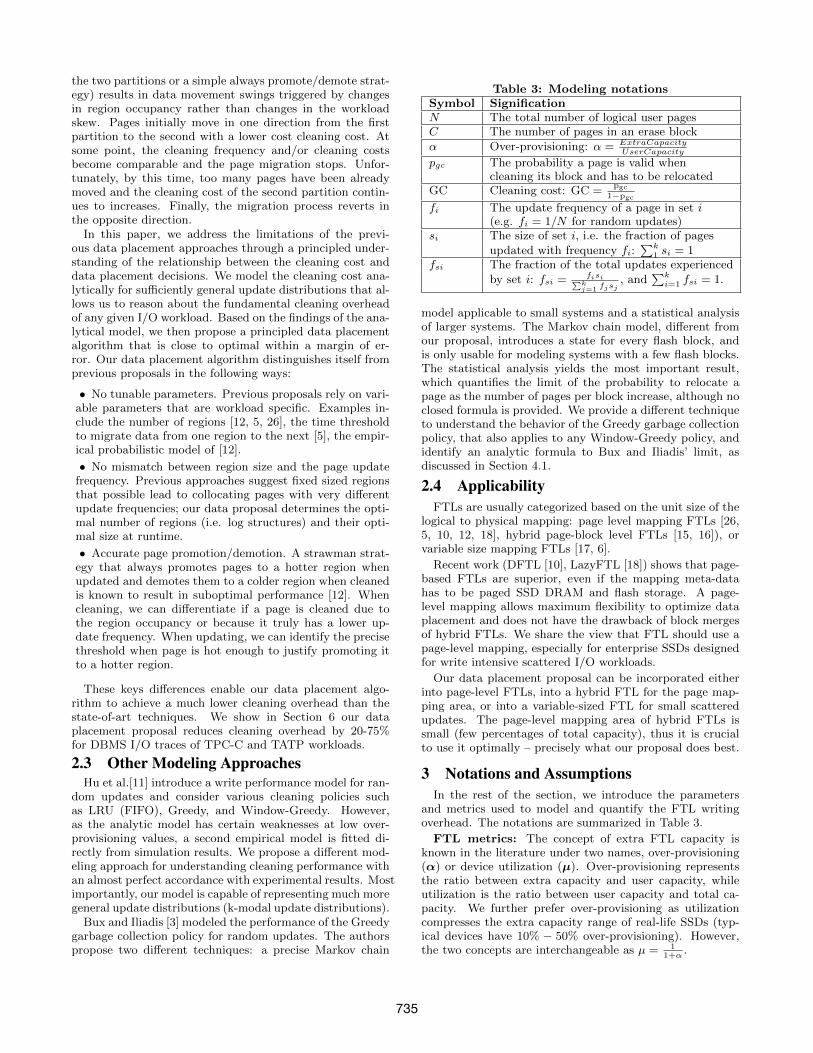
Table 3: Modeling notationsSymbol SignificationN The total number of logical user pagesC The number of pages in an erase blockα Over-provisioning: α = ExtraCapacity
UserCapacity
pgc The probability a page is valid whencleaning its block and has to be relocated
GC Cleaning cost: GC =pgc
1−pgc
fi The update frequency of a page in set i(e.g. fi = 1/N for random updates)
si The size of set i, i.e. the fraction of pagesupdated with frequency fi:
∑k1 si = 1
fsi The fraction of the total updates experiencedby set i: fsi = fisi∑k
j=1 fjsj, and
∑ki=1 fsi = 1.
model applicable to small systems and a statistical analysisof larger systems. The Markov chain model, different fromour proposal, introduces a state for every flash block, andis only usable for modeling systems with a few flash blocks.The statistical analysis yields the most important result,which quantifies the limit of the probability to relocate apage as the number of pages per block increase, although noclosed formula is provided. We provide a different techniqueto understand the behavior of the Greedy garbage collectionpolicy, that also applies to any Window-Greedy policy, andidentify an analytic formula to Bux and Iliadis’ limit, asdiscussed in Section 4.1.
2.4 ApplicabilityFTLs are usually categorized based on the unit size of the
logical to physical mapping: page level mapping FTLs [26,5, 10, 12, 18], hybrid page-block level FTLs [15, 16]), orvariable size mapping FTLs [17, 6].
Recent work (DFTL [10], LazyFTL [18]) shows that page-based FTLs are superior, even if the mapping meta-datahas to be paged SSD DRAM and flash storage. A page-level mapping allows maximum flexibility to optimize dataplacement and does not have the drawback of block mergesof hybrid FTLs. We share the view that FTL should use apage-level mapping, especially for enterprise SSDs designedfor write intensive scattered I/O workloads.
Our data placement proposal can be incorporated eitherinto page-level FTLs, into a hybrid FTL for the page map-ping area, or into a variable-sized FTL for small scatteredupdates. The page-level mapping area of hybrid FTLs issmall (few percentages of total capacity), thus it is crucialto use it optimally – precisely what our proposal does best.
3 Notations and AssumptionsIn the rest of the section, we introduce the parameters
and metrics used to model and quantify the FTL writingoverhead. The notations are summarized in Table 3.
FTL metrics: The concept of extra FTL capacity isknown in the literature under two names, over-provisioning(α) or device utilization (µ). Over-provisioning representsthe ratio between extra capacity and user capacity, whileutilization is the ratio between user capacity and total ca-pacity. We further prefer over-provisioning as utilizationcompresses the extra capacity range of real-life SSDs (typ-ical devices have 10% − 50% over-provisioning). However,the two concepts are interchangeable as µ = 1
1+α.
735
The overhead of cleaning a block (a.k.a. garbage collect-ing) is given by the fraction of pages that are valid and needto be relocated before erasing the block. This fraction, de-noted as pgc, can be interpreted either as a percentage oras a probability.
The benefit resulting from the erase operation, the amountof free space reclaimed, is the capacity of the block minusthe space consumed by the page relocations. Thus, we candefine the concept of Write Amplification as the number ofextra physical writes the FTL makes for every user write:
WA = 1 +pgc
1− pgc︸ ︷︷ ︸Cleaning overhead (GC)
(1)
The “1” term denotes the physical write needed to storethe newly written user data and can only be avoided throughcompression or deduplication. The second term representsthe actual cleaning overhead due to out-of-place writes. Wefurther omit the physical write and model only the cleaningoverhead for simplicity.
Both pgc and GC concepts are useful to characterize flashwrite performance. From a modeling and reasoning perspec-tive, pgc is easier to estimate and to reason about. On theother hand, GC represents the end-to-end cleaning overhead.Minimizing GC results both in better write performance andin a longer device lifetime. The frequency of block erasuresis directly proportional to the write amplification and GCshows how much faster an SSD ages at every user write.
I/O workloads: Throughout the paper we model vari-ants of k-modal I/O workloads. A k-modal I/O work-load represents an update distribution where the update fre-quency of any given page can have only k possible discreetvalues (fi, ..., fk). We call all pages with a given update fre-quency an update set. Each update set has an associated sizedefined as a fraction of the total user data si and receives afraction fsi of the overall updates. A k-modal workload hastwo important advantages: a) it is simple enough to modelanalytically; b) it is sufficiently general to approximate a realI/O workload. A general I/O workload can be abstractedthrough a k-modal workload by “binning” together pageswith a similar update frequency. As we will see, pages canbe safely grouped in bins with an exponentially increasingupdate frequency.
3.1 Modeling AssumptionsWe make the following assumptions when modeling the
cleaning overhead:
1. We exclude sequential writes. Exploiting sequential writepatterns is an orthogonal topic and is relatively easy to im-plement, e.g. by detecting sequential writes patterns andstoring updates in the same erase block [15]. If the samepages are written again sequentially, the block is fully in-validated and can be erased without any data moves. Ourmodel supports, however, any skewed I/O workloads.
2. We model only the long-term FTL cleaning overhead. Anewly formatted SSD has no immediate cleaning overhead,as all flash blocks are erased and available for writing; thisresults in good but transient write performance.
4 FTL Cleaning OverheadIn this section, we model the cleaning overhead (GC) as
a function of over-provisioning, data placement, and clean-ing policy for various update distributions. We first model
the cleaning overhead for random updates (a 1-modal work-load), then introduce update skew by considering a 2-modalupdate distribution, and we finally generalize the resultsfor arbitrary skewed update distributions represented by k-modal workloads.
4.1 Random Updates (1-Modal Distribution)We assume a random update workload composed of single
page updates. All pages have the same update probability,therefore data placement does not matter, i.e. there is nobenefit in storing any pages together, and the cleaning costonly depends on the block selection policy.
Consider two block cleaning policies introduced initiallyin LFS [23]: i) a Least Recently Used (LRU) policy wherethe oldest written block is cleaned first, and ii) a Greedypolicy that selects the block with the lowest number of validpages. As all pages have the same update frequency and asupdates are uncorrelated, the Greedy policy is optimal (fora more detailed discussion please see [23] [11]).
We first model GC for the LRU cleaning policy, then showthat the additional benefits of the Greedy policy are negligi-ble. By viewing the LRU policy as the “worst case” and theGreedy policy as the “best case” we are bounding the ben-efits of any intermediary cleaning policy such as Window-Greedy [11]. Showing that the LRU cleaning policy is closeto optimal is of practical importance. It is the simplestpolicy to implement, has the lowest memory and CPU over-head, and has a perfect wear leveling behavior (blocks areerased at the same rate). Comparatively, the Greedy policyis more expensive as it requires a data structure that sortsflash blocks on the number of valid pages contained.
LRU cleaning policy. The flash device can be consid-ered a circular log-structure where updates are appended tothe tail and cleaning always starts at the log head with theoldest block written, whenever space is needed. If a pagehas to be relocated for cleaning, we read the page from thelog head and write it to the tail followed by advancing bothhead and tail pointers.
Over a full log wrap-around, writes are caused either bypage relocations or by actual user updates. At every user up-date, the probability that a given page escapes invalidationis 1 − 1
N, while the cleaning process produces no invalida-
tions (a block is immediately erased once its valid pages arerelocated). Thus, the probability that a given page remainsvalid over a log wrap-around is the probability to escapeinvalidation at one update at the power of the total num-ber of user updates accommodated over a log wrap-around.Assuming there are (1 + α) · N total physical pages, a pgc
fraction are “wasted” due to relocations from the cleaningprocess, while (1 − pgc) physical pages actually store newuser data. We can therefore deduce pgc from the limit ofthe equation:
pgc = (1− 1
N)N(1+α)(1−pgc)
We apply Euler’s limit as N is sufficiently large (there are217 − 218 pages per GB of NAND flash):
pgc = e−(1+α)(1−pgc) (2)
which accepts the analytic solution:
pgc = −W (−(1 + α)e−(1+α))
1 + α(3)
736
10−2 10−1 100 1010
0.2
0.4
0.6
0.8
1
Over-provisioning (α)
Page
clean
ingpr
obab
ility
(p
)gc
(a)
10−2 10−1 100 101
0
20
40
60
Over-provisioning (α)
Cle
anin
gov
erhe
ad(G
C)
ModelApproximationSimulationApproximation error
(b)
0 1 2 3 4 50
0.5
1
1.5
2
2.5
Over−provisioning (α)
Pro
babi
lity
diffe
renc
e(%
) 10−2%10−1%
1%10%100%
(c)
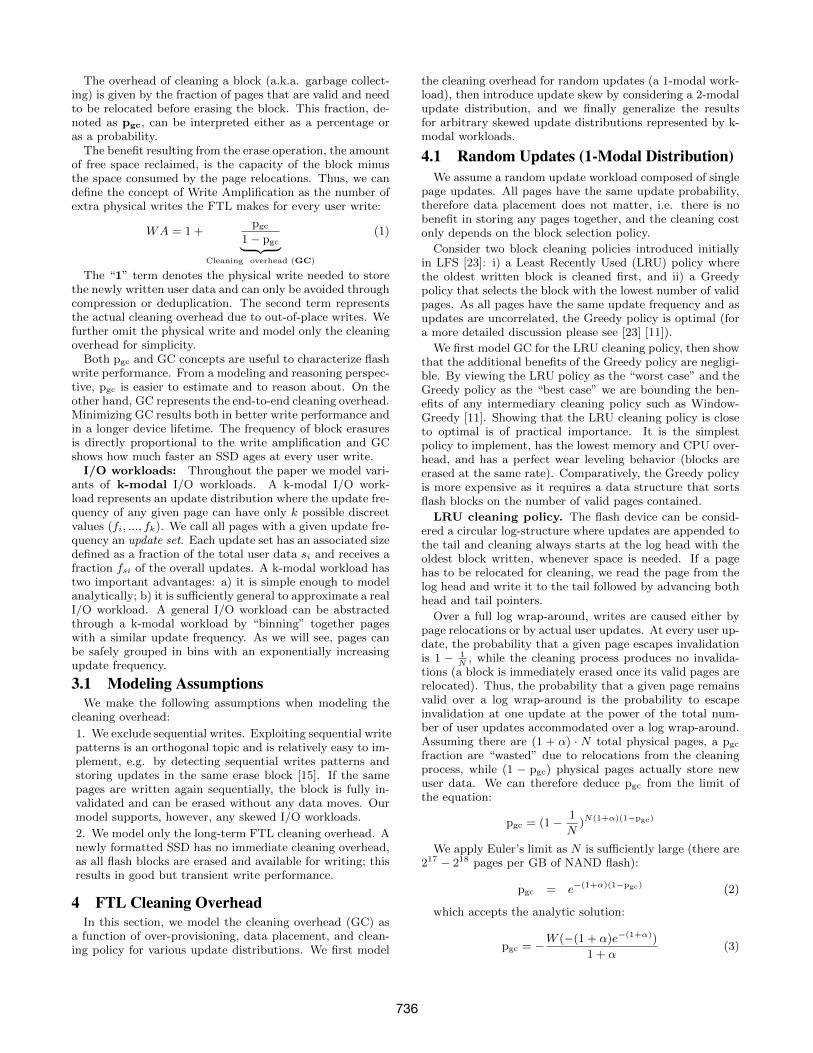
Figure 1: (a) Analytical form, algebraic approximation, and simulation of page cleaning probability pgc; (b)the associated cleaning overhead GC; (c) the reduction in page cleaning probability for multiple Window-Greedy policies compared to a LRU policy as a function of over-provisioning and window size (window sizeexpressed as a fraction of the total capacity).
W is the Lambert-W function [7], the solution to the equa-
tion z = W (z)eW (z). W cannot be expressed as a compo-sition of algebraic functions. However, W can be computednumerically (e.g. through a Taylor expansion), although thisis rather cumbersome from a practical perspective.
To overcome such limitations we propose a simplified ap-proximation. We note that −(1+α)e−(1+α) ⊂ (−e−1, 0) forany α ∈ R+. Thus, we need to approximate W for a rathersmall interval. We plot (1 +α)e−α, −W (−(1 +α)e−α), andpgc(α) and observe that the three functions converge to zerofor α > 1 and are all similar in shape to a negative expo-nential. We fit the W (..) component of Equation (3) to theec1α+c2 family of exponentials and obtain the algebraic ap-proximation:
pgc ≈e−0.9α
1 + α(4)
Equation (4) gives us a quantitative trade-off between al-locating extra capacity and cleaning performance – it showsthat pgc decreases slightly faster than exponentially as over-provisioning increases. We show in the Section 4.2.1 thata similar dependency exists even if we collocate pages withdistinct update frequencies.
We validate the model experimentally. In Figure 1(a) weshow how the analytic predictions from Equations 3, and 4compare against each other and against the pgc found bysimulation (the simulation setup is described in Section 5).The difference between any of the three methods is virtuallyzero for any over-provisioning value (TotalError representsthe difference between Equation 4 and the simulation re-sults). Figure 1(b) shows the associated cleaning overhead.
Greedy cleaning policy. To quantify the benefit of aGreedy cleaning policy we need to consider more than theaverage pgc value as given by Equation 4: we also need tomodel the distribution of valid pages across the erase blocks.
Consider a generalization of the LRU and Greedy policies:whenever we need to reclaim space, we pick the block withthe lowest number of valid pages in the oldest written Bblocks. When B = 1 the cleaning policy becomes LRU;when B = (1 + α)N/C it becomes Greedy. We furtherexplain how to model: i) the pgc probability distributionfunction (PDF) as a function of α, ii) the PDF change as afunction of the block’s position in the cleaning window, andiii) how to compute the benefit obtained by increasing theB window.
i)PDF. The number of valid pages in a block follows adiscreet binomial distribution – any two pages in a block
have an equal and uncorrelated pgc probability to be valid.Thus, the probability a block has exactly k valid pages is:
p(k) =
(C
k
)· pgc
k · (1− pgc)C−k (5)
Please note that pgc(α) is given by Equation 4 and theprobability distribution function PDF (pgc) is a vector:
PDF (pgc) = [p(C) p(C − 1) · · · p(1) p(0)]
and has the associated standard deviation:
stddev =√C · pgc · (1− pgc)
ii)PDF variation over the cleaning window. The easiestway of modeling the pgc PDF at a specific location in thelog structure is by using a Markov chain model. The processof invalidating pages can be represented with the followingMarkov chain transition matrix:
M =
N−CN
CN
· · · 00 N−C−1
NC−1N
· · ·...
.... . .1N
C−1N
0 0 0 1
M(i, i) represents the probability that all pages of a block
escape invalidation at an update and the block stays in thesame state with C− i valid pages. M(i, i+ i) represents theprobability of migrating to the next state defined by havingC − i − 1 valid pages. The PDF change after n updates issimply PDFnew = PDFold ·Mn. The number of updatesn is in turn determined by the position of the block in thecleaning window.
iii)Greedy benefit. We could not deduce an analytic for-mula to give a concise relationship between pgc and windowsize B, however, the pgc decrease can be computed as:
Benefit =
B∑i=2
(PDFold − PDFi) · [C C − 1 · · · 1 0]′
Benefit represents the average number of valid pagessaved from relocation by making the cleaning window ofsize B. Please note all terms are vectors and the last ele-ment represents the number of valid pages for the states ofthe Markov chain model.
The overall findings are that the Window-Greedy policyadds little benefit, as noticed experimentally also by pre-vious work [23] [26] [11]. The gist of why this happens
737

.01 .1 .5 1 2 10 1000.55
0.6
0.65
0.7
0.75
Relative update frequency (f )r
Ave
rage
clea
ning
prob
abili
ty (p
)
avg
(a)
.01 .1 .5 1 2 10 1001
1.5
2
2.5
3
Relative update frequency (f )r
Clea
ning
overhe
ad(G
C)
(b)
.01 .1 .5 1 2 10 1000
1
2
3
4
5
6
7
r
Incr
ease
incl
eani
ngov
erhe
ad 0.050.100.250.500.750.900.95
Set size (fraction of user data)
Relative update frequency (f )(c)
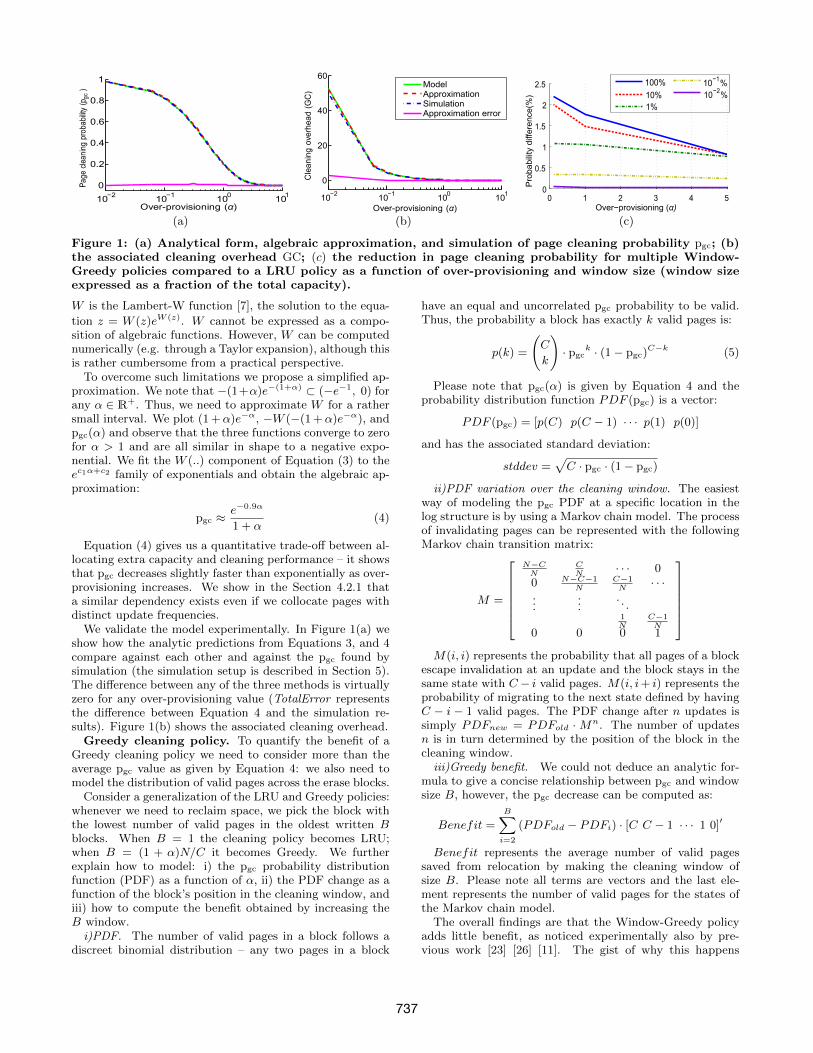
Figure 2: (a) The average page cleaning probability pgc; (b) The corresponding cleaning overhead GC; (c) Rel-ative increase of cleaning overhead due to random placement compared to the minimum overhead possible.
is twofold. First, pgc increases exponentially as we movethrough the window B from the oldest written blocks to-ward the youngest, as can be noticed from Equation 4 whenα is decreased. In other words, the window where we canfind a block with a lower number of valid pages than in theLRU block is narrow. Second, PDF (pgc) does not have ahigh variance, meaning that even when blocks with a lowernumber of valid pages are present, the difference is small.
We also note that Bux and Iliadis’ page cleaning proba-bility limit [3] accepts an analytic solution, also in terms ofthe Lambert-W function, and is precisely Equation 3. Thisprovides additional evidence that the performance of theGreedy policy is equivalent to a LRU policy.
We finally validate the findings by simulation and showin Figure 1(c) the pgc decrease as we vary over-provisioningand the window size. Overall, pgc decreases by at most 2%;we therefore conclude that the Greedy or Window-Greedypolicies are unnecessary for random updates.
4.2 2-modal DistributionIn this section, we model the cleaning overhead of a 2-
modal workload (pages are either hot or cold) in two differ-ent scenarios: a) when pages are randomly collocated, andb) when pages are stored separately based on their updatefrequency.
4.2.1 Random Data PlacementUsing the notations from Table 3, the update frequency
of a page is either f1 or f2, the sizes of the two sets ares1 and s2, and let fr = f1/f2 be the relative page updatefrequency between the two update sets. We assume pagesare randomly collocated and blocks are cleaned using a LRUpolicy, i.e. a log-structured data placement.
Let pgc1, pgc2 be the probabilities that pages of update set1 and update set 2 respectively are valid at garbage collec-tion and let pavg be the probability that a page selected atrandom is valid. pgc1, pgc2 can be expressed using a similarlogic as in Section 4.1:
pgc1 = (1− 1
s1N)N·fs1·(1+α)·(1−pavg) (6)
pgc2 = (1− 1
s2N)N·fs2·(1+α)·(1−pavg) (7)
After some manipulations (substituting fsi, using Euler’slimit, applying the logarithm, and dividing the two equa-
tions), we finally obtain:
log (pgc1)
log (pgc2)= fr ⇔ pgc1 = pfrgc2 (8)
Equation 8 summarizes the relationship between the validpage probabilities of the two sets and shows that the proba-bility of having to relocate colder pages at garbage collectiongrows towards 1 with the fr-th root. For example, if set 2is “cold” then fr > 1 and thus pgc2 = fr
√pgc1.
The relationship between pavg and pgc1, pgc2 is deducedfrom the condition that the total cleaning overhead equalsthe sum of the partial cleaning overheads associated witheach update set. It can be showed that:
pavg = 1− (1− pgc1)(1− pgc2)
fs1(1− pgc2) + fs2(1− pgc1)(9)
Equations 6, 7, 9 do not accept a solution in terms ofthe Lambert-W function as Equation 2 does. However, theprobabilities can be determined numerically using an itera-tive algorithm (e.g. by choosing any initial value for pgci andrepeatedly substituting until Equations 6, 7, 9 converge).We validate the analytic predictions through simulation andfind a good match: the difference between the numericallycomputed pavg and simulated pavg is virtually zero for anysi, fr, and α ∈ (0, 1).
Analytic approximation. To ease understanding of thecleaning overhead, we also propose a closed formula approx-imation for pavg, pgc1, pgc2. The approximation is based oncounting the number of pages belonging to each update set.If we take a ”snapshot” of all the pages in the log-structure,a s1+s2
1+αfraction of the log contains the valid user pages of
set 1 and 2. The rest of the pages in the log, representing theα
1+αover-provisioned capacity, contain invalid pages. The
rate of creating invalid pages for a set is dictated by its to-tal update frequency. Thus, the over-provisioned capacitycan be thought as to be split between the two update setsaccording to the fsi set update frequencies and the pagecleaning probabilities can estimated using Equation 3:
pgci = −W (−(1 + αi)e−(1+αi))
1 + αi; αi =
fsi · αsi
pavg = pgc1 ·s1 + fs1α
1 + α+ pgc2 ·
s2 + fs2α
1 + α
The analytic approximation tends to slightly underesti-mate the cleaning overhead; however, it is within 5% theactual cleaning overhead measured by simulation.
738

Practical implications. In order to interpret the impli-cations of the analytic results, Figure 2(a) shows pavg as afunction of the update frequency ratio fr and set size si foran over-provisioning value α = 0.3 (middle range for today’sSSDs). For example, at value 10 on the x-axis, the page up-date frequency of the first set is 10 times higher than theupdate frequency of the second set; a legend value of 0.1means that the first set contains 10% of the total user data.
As expected, the probability of having to relocate a pagewhen collocating data with different update frequencies isminimized when both update sets have the same updatefrequency (fr = 1) and then grows to either left or right de-pending on which update set is dominant (is larger). Whatis not expected is the large fr interval where pavg is closeto minimum – the update frequencies can differ by ∼2×with little penalty. The practical implications are twofold:Firstly, pages should be grouped in “bins” with an exponen-tially increasing update frequency. Secondly, the frequencyrange of each “bin” is relatively large as page update fre-quencies can vary by up to ±50%.
We show in Figure 2(b) the corresponding cleaning over-head. The GC shape is similar to pavg, except that theregion of minimum penalty tends to be slightly wider. Fi-nally, Figure 2(c) shows the relative GC increase comparedto an optimal data placement (as discussed in the next sec-tion) and represents the benefit of skew-aware data place-ment. The relative GC shows how many times the cleaningoverhead increases if data is naively collocated comparedto separating pages based on update frequency. Overall,pavg, GC, and the relative GC increase are all minimizedfor fr ∈ (0.5, 2).
4.2.2 Frequency-Based Data PlacementIntuitively, the cleaning overhead can be reduced by sep-
arating pages based on their update frequency, as was alsoobserved by previous work [22], [23], [26], [12]. In Section4.2.1 we identified the point where the relative difference be-tween the hot and cold data justifies separating pages basedon their update frequency. We show next how to optimallyseparate data and calculate the minimum cleaning overhead.
Assume the same 2-modal update distribution as in Sec-tion 4.2.1, and following the same notations. The only dif-ference in this scenario is that the two update sets are storedin two distinct regions cleaned using a LRU cleaning policy.We assume to have perfect knowledge of the update fre-quency of each page, and therefore no pages are misplaced.
Let β · N (β < α) be the number of over-provisionedpages allocated to the first log structure. The second logstructure receives the rest of the capacity budget of (α−β)·Npages. The new pgc1, pgc2 page cleaning probabilities can becalculated using Equation (4) as pages have a single updatefrequency inside each log. The global cleaning overhead,GCavg, is the sum of the individual cleaning overhead foreach region weighted by the update frequency of the regions:
GCtot = fs1pgc1
1− pgc1+ fs2
pgc21− pgc2
(10)
As pgc1, pgc2 depend on the allocation of extra capacity,the remaining challenge is how to optimally distribute theextra capacity budget to each update set, i.e. how to selectβ in order to minimize GCtot.
By differentiating Equation 10 we find β where GC(β) hasthe global minimum (GC(β) is a convex function). Aftersubstituting Equation 3 in 10, we express the derivative as:
∂GCtot
∂β=
fs1W1
s1(W1 + 1)(W1 + z1)−
fs2W2
s2(W2 + 1)(W2 + z2)(11)
using the simplifying notations:
z1 = 1 +β
s1; z2 = 1 +
α− βs2
; Wi = W (−zie−zi)
The optimal β is the point where the derivative is null(i.e. ∂GCtot
∂β= 0), which holds when:
frW1
(W1 + 1)(W1 + z1)=
W2
(W2 + 1)(W2 + z2)(12)
Equation 12 has no analytic solution but we can, however,solve it numerically and deduce its practical implications.Three parameters influence the optimal β value: the amountof over-provisioning (α), the relative update frequency ratio(fr), and the sizes of the two update sets (si).
Figure 3(a) shows the optimal space allocation as a func-tion of s1 (s1 determines s2) and fr for an over-provisioningvalue of 0.3. The optimal space allocation is strongly corre-lated with si, while fr has a smaller influence on the optimalover-provisioning value. Figure 3(a) suggests a logarithmic-like contribution of fr to the optimal β value.
In Figure 3(b) we see the corresponding cleaning overhead.The shape of GCtot is mirrored by a plane passing throughfr = 1 and parallel to the z-axis – the notations of thetwo update sets can be interchanged (i.e. by “renaming”update set 1 to set 2 and vice-versa). GCtot varies by anorder of magnitude with both si and fr and has a maximumwhen fr = 1. This implies that random updates impose thelargest writing overhead once pages are separated accordingto update skew. The lowest cleaning overhead is seen closeto the points (0.05, 1), (100, 0.05), where a small fraction ofpages sees a large number of the total updates (heavy skew).
Finally, Figure 3(c) shows the ratio between the clean-ing overhead associated to randomly collocating pages andthe cleaning overhead achieved by separating pages basedon update frequency – i.e. it shows how many times GCis reduced. The decrease in GC is also symmetric, simi-lar to the inverted surface in Figure 3(b) but with higherpeaks. The highest benefit of separating data is, as ex-pected, in case of heavy skew. As skew increases, i.e. asfr grows for fixed α, si values, the cleaning overhead of ran-dom collocation increases approximately with the logarithmof fr, while the cleaning overhead achieved by separatingpages decreases also approximately with the logarithm offr. This two trends explain the position and height of thepeaks shown in Figure 3(c). Fortunately, database work-loads exhibit a significant amount of skew, as can be seenalso in the I/O traces presented in Section 6.
Practical space allocation. As mentioned, solving Equa-tion 12 numerically requires an iterative optimization algo-rithm (e.g. Newton’s method) to find β, while each itera-tion of the optimization algorithm computes the Lambert-W function in multiple points. Such a process might betoo computational intensive to be used online in a FTL. Inpractice we want to find the solution to Equation 12 usinga small bounded number of elementary operations.
We propose to avoid solving Equation 12 and use instead
an approximation of the solution β ' βopt. We computednumerically βopt and tried to fit the results to various fam-ilies of three dimensional functions such as combinations of
739

Relative frequency (fr)
Opt
imal
spa
ce a
lloca
tion
(β)
Set size (si)
(a)Relative frequency (fr) Set size (si)
Min
imum
cle
anin
g ov
erhe
ad (G
C)
(b)Relative frequency (fr) Set size (si)
Cle
anin
g ov
erhe
ad re
duct
ion
(c)
Figure 3: (a) The optimal allocation of over-provisioned capacity β; (b) The associated cleaning overheadGC; (c) The reduction in cleaning overhead possible when separating pages according to update frequency(i.e. GC random placement/GC frequency-based placement).
polynomials, logarithms, exponentials, etc. We could notfind a satisfactory fit, therefore we decided to reduce thenumber of dimensions to two, si and α, and consider fr con-stant. As mentioned, fr can be approximated as constant ifpages are grouped in exponential decreasing frequency bins(e.g. fr = 2, 4, ..., 2n). Moreover, if the fr ratio between twosets of pages is constant, a single approximation for a fixedfr value suffices.
Once the number of dimensions is reduced, βopt can be ap-proximated using a polynomial function that is both feasibleto compute at run-time and also offers a good fit (error lessthan 0.1% and root mean square error of 0.001 for any valuesof α, si). To balance complexity and precision, we suggest a1-degree polynomial for the α dimension and 3-degree poly-nomial for the si dimension, although higher degrees reducefurther the approximation error:
β(si, α) = c00 + c10α+ c01si + c11αsi + c02s2i + c12αs
2i + c03s
3i
Optimal cleaning policy. Equation 11 can also be usedto implement an efficient cleaning policy. Whenever we needto select a victim block for cleaning and have a choice be-tween two sets of pages, it is sufficient to know whetherthe derivative of GCtot is positive or negative. For exam-ple, if the right-hand side of Equation 12 is smaller thanthe left-hand side, then we select a block from the first logstructure and vice versa. Such a policy converges to the op-timal allocation of space and minimizes cleaning overhead.Equally important, the policy does not depend on monitor-ing past cleaning overhead; rather, the analytic equationspredict and minimize future page relocations. Please notethat the Lambert-W values from Equation 12 can be approx-imated as in Section 4.1 by using −W (−ze−z) ' e−0.9(z−1).
4.3 k-modal DistributionIn this section, we first show how to extend the modeling
results from a 2-modal to a k-modal update distribution,then explain how to approximate a general I/O workloadthrough a k-modal distribution and analytically computethe minimum cleaning overhead achievable. We assume thesame type of workload and notations as in Section 4.2, theonly difference being that the number of update sets in-creases to k.
4.3.1 Random Data PlacementConsider the case where pages are randomly collocated
irrespective of their update frequency and cleaned using a
LRU policy. Using the same logic as in Section 4.2.1, we canexpress the relation between the page cleaning probabilitiesof the k update sets as:
p1/f1gc1 = p
1/f2gc2 = ... = p
1/fkgck
Thus, the point where the difference between update fre-quencies justifies separating pages remains the same as forthe 2-modal workload: pages should be grouped in bins withupdate frequency increasing exponentially, while the rangeof frequencies in a bin can vary by ∼2×. All the results fromSection 4.2.1 can be straightforwardly extended to k updatesets.
4.3.2 Frequency-Based Data PlacementSimilarly to Section 4.2.2, assume now that the k update
sets are stored separately. The total cleaning overhead isthus:
GCtot = fs1pgc1
1− pgc1+ · · ·+ fsk
pgck1− pgck
(13)
When the over-provisioned space is optimally allocated,GCtot is minimized and all the partial derivatives of GCtotwith respect to all the β1..k dimensions are zero. The partialderivative with respect to a βi dimension is:
∂GCkmod∂βi
=∂GC1
∂βi+ ...+
∂GCi∂βi
+ ...+∂GCk∂βi
There are k − 1 degrees of freedom for partitioning spacebetween the k logs, therefore only two components of thepartial derivative depend on βi. Considering βj to be dic-tated by the other space allocation values (βj = α−
∑i 6=j βi),
the βi derivative becomes:
∂GCkmod∂βi
=∂GCi∂βi
+∂GCj∂βi
Thus, every partial derivative has the same form as thederivative of the cleaning overhead for a 2-modal update dis-tribution, while the overall optimal space allocation is thesolution to a system of k− 1 such equations. Equation 12 issufficient for deciding space allocation also for this updateworkload and can be interpreted as a way of partitioning alocal space budget between any two update sets. More im-portantly, the same practical methods for distributing spaceand cleaning the log-structures, as described as in Section4.2, also holds for k-modal update distributions.
740

Algorithm 1 Analytical Estimation of Write Overhead
1: Group pages in bins with ±50% update frequency2: Set number of logs := number of bins3: Set β1, · · · , βk := s1, · · · , sk4: // Iterative space allocation5: repeat6: for i=1:k do7: re-distribute space between log i and (i+ 1) mod k8: end for9: until no βi change
10: Calculate GCtot
4.3.3 Estimate Cleaning OverheadIn practice we want to leverage the modeling results ob-
tained so far to estimate the cleaning overhead of a realworkload. Computing the minimum achievable cleaning over-head is useful both for validating new data placement algo-rithms and for computing the headroom for improving ex-isting FTL implementations.
We present Algorithm 1 as a method for estimating thelowest achievable cleaning overhead of a workload. The al-gorithm first bins together pages based on update frequency(Line 1). Binning can rely on either I/O traces, a statisticaldescription of the workload, or high-level access statisticsfrom the DBMS buffer pool replacement policy. Next, thenumber of logs is initialized to the number of non-emptybins (Line 2), and the initial βi values are set to the sizesi of each log (Line 3). As mentioned, si has the biggestinfluence on βi and βi = si is a good starting point thatallows the algorithm to converge faster. Next, we iteratethrough all the logs and use Equation 11 to set the optimalβi values (Lines 5-9). We repeat until all βi converge and,finally, compute GCtot using Equation 13.
5 Frequency-based Data PlacementIn this section, we show how to apply in practice the
theoretical results found so far. We propose a new dataplacement algorithm, rather than a full FTL implementa-tion, that can be used by any page-level FTL or hybridmapping FTL for the page level mapping area.
The data placement algorithm is depicted in Figure 4.The high-level idea is to split pages in update sets based onupdate frequency. Each set is stored as a log structure, thelog number and log size being determined dynamically. Theupdate sets hold pages with update frequencies decreasingin powers of two (Section 4.2.1). The update set with thehottest data is logically represented on top, while the coldestis at the bottom. If a page becomes cold it “sinks” accord-ing to its update frequency, while if it becomes hotter is“rises”. The design is intuitive, however, it raises a numberof questions that we address in the rest of the section:
1. How to estimate update frequency?
2. How to migrate data between logs?
3. What cleaning policy to use?
4. How to determine the optimal log number and their size?
5.1 Estimating Update FrequencyWe do not make any assumptions about the algorithm
used to estimate update frequency, and our data placementproposal works with any existing algorithms, either generalpurpose or especially designed for flash memory [20, 21].
Update frequency
Hottest
Coldest
⁞
f
f/2
f/2n
Data
dem
otion w
hen G
C
Data
pro
motion w
hen
writing
⁞ ⁞
Figure 4: MultiLog data placement
When measuring update frequency, there is a trade-off be-tween higher accuracy (requiring finer grained access statis-tics) and CPU and memory overhead. As discussed, we cantolerate a high degree of uncertainty when estimating up-date frequency, ±50% from the real value, and it is an openproblem if existing algorithms can be further tuned for theaccuracy we are interested in.
We use two methods to measure the page update fre-quency in our experiments. The first algorithm is a LRU-1metric that estimates update frequency based on the dis-tance between two consecutive writes to the same page (fre-quency is the inverse of the update distance). This algorithmis simple enough to implement in any FTL as it does not re-quire storing additional access statistics and has a low CPUoverhead. No additional meta-data is required as the logicalto physical FTL mapping associates anyway a logical pageID with its last up-to-date physical location (erase blockand page offset), while each erase block has an associatedversion number (write sequence number) for recovery andconsistency reasons. Comparing the current version number(write sequence number) with the previous value estimatesthe update distance, the inverse of the update frequency.We expect more complex frequency estimation methods tobe more accurate.
The second algorithm is an “Oracle” that gives us the ex-act update frequency. Combined, the two algorithms boundthe impact of the update frequency estimation algorithmon the data placement proposal and show the improvementheadroom over the basic LRU method. The Oracle works byanalyzing the workload in advance, both for micro-benchmarksand DBMS I/O traces, and by computing the exact updatefrequency of each page. For example, in a random updateworkload, pages have an equal theoretical update probabil-ity, but when sampling from the uniform distribution, thenumber of updates per page are not exactly equal (they fol-low a Gaussian distribution). Thus, the Oracle measuresperfectly the update frequency.
5.2 Page MigrationPage migration raises two questions: i) when to perform
page migration, and ii) what pages to move.Page promotion. We “promote” pages, i.e. move a page
to a hotter log when the page is updated. This is desirableas we incur no additional writes – when updating a page,we need to write a new page version and have the liberty toredirect the write to any location on flash. The decision tomigrate pages, however, is not based on a simple heuristicsuch as “promote” any page when updated, or “demote”any page when relocated. Such a strategy is known to failto separate data according with update frequency [12].
Given a log structure of s ·N pages, a page is invalidatedon average after s ·N/2 logical updates to that log. Out of
741
0.0625
0.125
0.25
0.5
1
2
4
8
16
0.1 0.3 0.5 0.7 0.9
Over-provisioning (α)
LRU Greedy
0.0625
0.125
0.25
0.5
1
2
4
8
16
0.1 0.3 0.5 0.7 0.9
Cle
an
ing
ove
rhe
ad
(G
C)
Over-provisioning (α)
eNVy CostBased ContainerMarking
0.1 0.3 0.5 0.7 0.9
Over-provisioning (α)
MultiLog MultiLog-Oracle
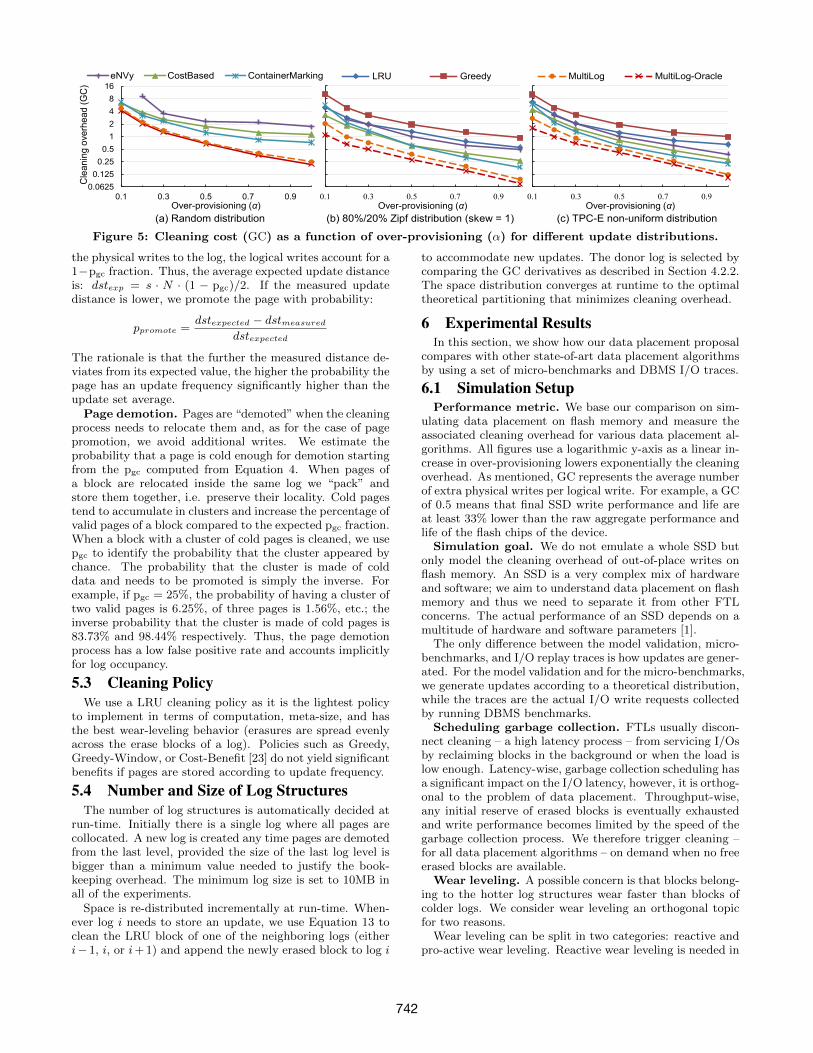
(a) Random distribution (c) TPC-E non-uniform distribution (b) 80%/20% Zipf distribution (skew = 1)
Figure 5: Cleaning cost (GC) as a function of over-provisioning (α) for different update distributions.
the physical writes to the log, the logical writes account for a1−pgc fraction. Thus, the average expected update distanceis: dstexp = s · N · (1 − pgc)/2. If the measured updatedistance is lower, we promote the page with probability:
ppromote =dstexpected − dstmeasured
dstexpected
The rationale is that the further the measured distance de-viates from its expected value, the higher the probability thepage has an update frequency significantly higher than theupdate set average.
Page demotion. Pages are “demoted” when the cleaningprocess needs to relocate them and, as for the case of pagepromotion, we avoid additional writes. We estimate theprobability that a page is cold enough for demotion startingfrom the pgc computed from Equation 4. When pages ofa block are relocated inside the same log we “pack” andstore them together, i.e. preserve their locality. Cold pagestend to accumulate in clusters and increase the percentage ofvalid pages of a block compared to the expected pgc fraction.When a block with a cluster of cold pages is cleaned, we usepgc to identify the probability that the cluster appeared bychance. The probability that the cluster is made of colddata and needs to be promoted is simply the inverse. Forexample, if pgc = 25%, the probability of having a cluster oftwo valid pages is 6.25%, of three pages is 1.56%, etc.; theinverse probability that the cluster is made of cold pages is83.73% and 98.44% respectively. Thus, the page demotionprocess has a low false positive rate and accounts implicitlyfor log occupancy.
5.3 Cleaning PolicyWe use a LRU cleaning policy as it is the lightest policy
to implement in terms of computation, meta-size, and hasthe best wear-leveling behavior (erasures are spread evenlyacross the erase blocks of a log). Policies such as Greedy,Greedy-Window, or Cost-Benefit [23] do not yield significantbenefits if pages are stored according to update frequency.
5.4 Number and Size of Log StructuresThe number of log structures is automatically decided at
run-time. Initially there is a single log where all pages arecollocated. A new log is created any time pages are demotedfrom the last level, provided the size of the last log level isbigger than a minimum value needed to justify the book-keeping overhead. The minimum log size is set to 10MB inall of the experiments.
Space is re-distributed incrementally at run-time. When-ever log i needs to store an update, we use Equation 13 toclean the LRU block of one of the neighboring logs (eitheri− 1, i, or i+ 1) and append the newly erased block to log i
to accommodate new updates. The donor log is selected bycomparing the GC derivatives as described in Section 4.2.2.The space distribution converges at runtime to the optimaltheoretical partitioning that minimizes cleaning overhead.
6 Experimental ResultsIn this section, we show how our data placement proposal
compares with other state-of-art data placement algorithmsby using a set of micro-benchmarks and DBMS I/O traces.
6.1 Simulation SetupPerformance metric. We base our comparison on sim-
ulating data placement on flash memory and measure theassociated cleaning overhead for various data placement al-gorithms. All figures use a logarithmic y-axis as a linear in-crease in over-provisioning lowers exponentially the cleaningoverhead. As mentioned, GC represents the average numberof extra physical writes per logical write. For example, a GCof 0.5 means that final SSD write performance and life areat least 33% lower than the raw aggregate performance andlife of the flash chips of the device.
Simulation goal. We do not emulate a whole SSD butonly model the cleaning overhead of out-of-place writes onflash memory. An SSD is a very complex mix of hardwareand software; we aim to understand data placement on flashmemory and thus we need to separate it from other FTLconcerns. The actual performance of an SSD depends on amultitude of hardware and software parameters [1].
The only difference between the model validation, micro-benchmarks, and I/O replay traces is how updates are gener-ated. For the model validation and for the micro-benchmarks,we generate updates according to a theoretical distribution,while the traces are the actual I/O write requests collectedby running DBMS benchmarks.
Scheduling garbage collection. FTLs usually discon-nect cleaning – a high latency process – from servicing I/Osby reclaiming blocks in the background or when the load islow enough. Latency-wise, garbage collection scheduling hasa significant impact on the I/O latency, however, it is orthog-onal to the problem of data placement. Throughput-wise,any initial reserve of erased blocks is eventually exhaustedand write performance becomes limited by the speed of thegarbage collection process. We therefore trigger cleaning –for all data placement algorithms – on demand when no freeerased blocks are available.
Wear leveling. A possible concern is that blocks belong-ing to the hotter log structures wear faster than blocks ofcolder logs. We consider wear leveling an orthogonal topicfor two reasons.
Wear leveling can be split in two categories: reactive andpro-active wear leveling. Reactive wear leveling is needed in
742

TPCC TATPScale Factor 100 1000Initial size 13GB 12GBGrowing Yes NoPage size 8kB 8kB
Page No.(106) 2.85 1.51Updates (106) 59 220
.10 .25 .5 .75 10
0.2
0.4
0.6
0.8
1
CD
F
Fraction of pages
TPCCTATP
Figure 6: I/O trace statistics
case there is write cold data. If a block sees no updates, it isnever cleaned, and therefore it does not age. The content ofyoung cold blocks needs to be swapped periodically with thecontent of older hot blocks to prevent uneven wearing. Suchan activity is needed in all FTLs, no matter their implemen-tation. Pro-active wear leveling happens at writing whenupdates to hot logical pages are re-directed to young blocksin the hope of evening out future erasures. A straightfor-ward implementation of such wear leveling for our MultiLogproposal, considering that each log structure has a reserveof a few erased blocks, is to simply logically swap hot logblocks with cold log blocks after cleaning. Such an approachresults in no extra cleaning overhead.
Also, optimal wear leveling is hardware-specific as the fail-ure patterns of NAND flash chip vary form one generationfrom the next [9] and also depend on the type of flash mem-ory type (e.g. SLC, MLC, TLC) [4]. Spreading writes uni-formly across all erase blocks is beneficial but not sufficientfor maximizing device life.
Data placement algorithms. We compare the Multi-Log data placement proposal with the LRU and the Greedycleaning policies, with the Cost-Based policy proposed inFFS [14], with the eNVy proposal (the Hybrid data place-ment algorithm) [26], and an optimized version of the Con-tainerMarking [12] scheme with the wear-leveling overheadremoved for a fair comparison.
We compare with the Greedy cleaning policy as it repre-sents the most straightforward way to clean flash memory(i.e. pick the block with the lowest number of valid pages forcleaning). DFTL assumes a Greedy cleaning policy, there-fore DFTL’s cleaning overhead is strictly higher than of theGreedy cleaning policy as DFTL incurs extra overhead forpaging data between RAM and flash memory.
We compare with the hybrid eNVy data placement pro-posal as it offers a practical heuristic for separating dataaccording to access frequency. We could not run all eNVyexperiments at lower over-provisioning values (< 0.2) aseNVy’s cost-metric that guides cleaning and page migrationcan create situations when the cleaning collection process isunable to find additional space.
Simulation parameters. For all experiments we usea page size of 4kB and erase blocks of 64 pages and thesize of the flash memory was set to 100GB for the micro-benchmarks plus the varying over-provisioning (the actualsize of the flash memory has no influence on the final results).For the I/O traces, the size of flash memory was set to themaximum database size plus over-provisioning.
I/O traces. The I/O traces were collected by running theTPC-C [24] and the Nokia TATP [19] standard benchmarkson the Shore-MT[13] DBMS storage engine. The buffer poolsize was set at 10% of initial database size.
6.2 Micro-benchmarksThe micro-benchmark results are presented in Figure 5.
We use three access distributions: a uniform distribution(random updates), a Zipf distribution with skew factor 1(80% of accesses target 20% of pages), and the TPC-E [25]non-uniform distribution.
Random updates (Figure 5(a)). For random updates,the MultiLog-Optimal data placement algorithm is equiva-lent to the LRU cleaning policy as there is no update skewto justify separating data. At the same time, the LRU pol-icy has a cleaning overhead virtually indistinguishable fromthe Greedy policy. We thus omit both LRU and MultiLog-Optimal for clarity. The MultiLog cleaning cost followsclosely the one of the Greedy policy, and is significantlylower (up to 50%) compared to the other data placementproposals. Please note that the Greedy cleaning policy isoptimal [11].
Zipf accesses (Figure 5(b)). The importance of dataplacement grows as update skew increases. Compared toFigure 5(a), all skew-aware data placement algorithms achievea lower cleaning overhead. For both ContainerMarking andeNVy, the cleaning cost tends to increase sharply at lowover-provisioning values and the Cost-Based policy, althoughtheoretically inferior, achieves initially a lower cleaning over-head. We note that eNVy is especially unstable compared tothe ContainerMarking and Cost-Based policies. Finally, theLRU and Greedy cleaning policies have the worst behavioras no attention is paid to update skew. It is interesting tonote that for the Greedy policy, pgc is determined by deviceoccupancy: All blocks tend to accumulate the same amountof hot and cold data and are cleaned around the same pgc
value. As update skew is high and as most updates targeta low number of pages, the cold data is spread relativelyevenly over all blocks acting as dead-weight when cleaning.
TPC-E accesses (Figure 5(c)). The TPC-E distribu-tion skew can be thought of as an in-between case betweenthe random distribution and the Zipf distribution. Thus,the cleaning overhead of MultiLog increases compared tothe Zipf micro-benchmark as there is less skew to exploit.However, MultiLog significantly outperforms the other dataplacement techniques. eNVy and ContainerMarking have amore robust performance than expected; they achieve a sim-ilar or lower cleaning cost compared to the Zipf experimentalthough update skew decreases.
6.3 DBMS I/O Trace ReplayWe show in Figure 6 the high-level statistics of the TPC-
C and TATP I/O traces. The high update skew is perhapssurprising as updates in the two workloads are logically uni-form at the table level; however, this does not translate inuniformly distributed writes over all the pages. When twoobjects of different sizes are cached, updates to the smallerobject cause a lower number of I/Os as more of the smallerobject can be buffered. The same arguments extend to B-Trees where we see the compounded effect of updates beingnaturally skewed due to the logarithmic nature of the data-structure.
The cleaning overhead is presented in Figure 7(a) for theTPC-C I/O trace, and in Figure 7(b) for the TATP trace.The overall trends are similar to the micro-benchmark andwe point out the important differences. The TPC-C work-load has a partially shifting working set, as hot newly cre-ated data becomes cold over time (mostly due to inserts
743

0.1 0.3 0.5 0.7 0.9
Over-provisioning (α)
ContainerMarking MultiLog MultiLog-Oracle
0.0625
0.125
0.25
0.5
1
2
4
8
16
0.1 0.3 0.5 0.7 0.9
Over-provisioning (α)
LRU Greedy eNVy CostBasedC
lea
nin
g o
ve
rhe
ad
(G
C)
Figure 7: Cleaning cost as a function of over-provisioning for the TPC-C (a) and TATP (b) I/O traces.
to the OrderLine table). The shifting hot set poses themost problems to eNVy, even at high over-provisioning val-ues. Comparatively, ContainerMarking performs much bet-ter. Multi-Log achieves on average a 30% GC cleaning over-head reduction compared to ContainerMarking. The reduc-tion is especially significant in the practical 0.1-0.5 over-provisioning range.
The TATP I/O trace is more skewed than the TPC-Ctrace: around 10% of the pages see 80% of the updates,while updates in the 10% hot set are relatively uniform andconstant over time. MultiLog performs comparatively betterto the TPC-C traces as it can efficiently exploit the higherupdate skew. All other data placement algorithms performequal or worst to the TPC-C workload. For TATP, the keyto a low cleaning cost is to be able to fully separate the hotset from the rest of the cold data.
Overall, MultiLog achieves consistently a lower cleaningoverhead and reduces garbage collection overhead by 20%−75% at all over-provisioning values for both I/O traces.
7 ConclusionsThis paper demonstrates how to reduce FTL cleaning
overhead and improve SSD life by using the write skew ofI/O workloads to guide data placement. We developed ananalytical model that explains the important trade-offs in-volved when updating data out-of-place on flash memory.Based on the modeling results, we then proposed a princi-pled data placement algorithm that exploits write skew closeto optimally and reduces cleaning overhead by 20%-75% forboth synthetic workloads and real DBMS I/O traces.
8 References[1] N. Agrawal et al. Design tradeoffs for SSD performance. In
USENIX, pages 57–70, 2008.
[2] L. Bouganim, B. Jonsson, and P. Bonnet. uFLIP:Understanding Flash IO Patterns. In CIDR, pages 1–12,2009.
[3] W. Bux and I. Iliadis. Performance of greedy garbagecollection in flash-based solid-state drives. PerformanceEvaluation, 67(11):1172–1186, 2010.
[4] Y. Cai et al. Error patterns in MLC NAND Flash memory:Measurement, characterization, and analysis. In DATE,pages 521–526, 2012.
[5] M.-L. Chiang et al. Using data clustering to improvecleaning performance for flash memory. Software Practiceand Experience, 29(3):267–290, 1999.
[6] H. Choi, S. Lim, and K. Park. JFTL: a flash translationlayer based on a journal remapping for flash memory. ACMTransactions on Storage, 4(4):14, 2009.
[7] R. Corless et al. On the LambertW function. Advances inComputational Mathematics, 1(5):329–359, 1996.
[8] L. Grupp, J. Davis, and S. Swanson. The Bleak Future ofNAND Flash Memory. In FAST, pages 2–2, 2012.
[9] L. Grupp et al. Characterizing flash memory: anomalies,observations, and applications. In MICRO, pages 24–33,2009.
[10] A. Gupta et al. DFTL: a flash translation layer employingdemand-based selective caching of page-level addressmappings. In ASPLOS, volume 44, pages 229–240, 2009.
[11] R. Haas and X. Hu. The fundamental limit of flash randomwrite performance: Understanding, analysis andperformance modelling. TR IBM Research, 2010.
[12] X. Hu et al. Container Marking: Combining DataPlacement, Garbage Collection and Wear Levelling forFlash. In MASCOTS, pages 237–247, 2011.
[13] R. Johnson et al. Shore-MT: a scalable storage manager forthe multicore era. In EDBT, pages 24–35, 2009.
[14] A. Kawaguchi et al. A Flash-Memory Based File System.In USENIX, pages 155–164, 1995.
[15] S. Lee et al. LAST: locality-aware sector translation forNAND flash memory-based storage systems. ACM SIGOPSOperating Systems Review, 42(6):36–42, 2008.
[16] S.-W. Lee et al. A log buffer-based flash translation layerusing fully-associative sector translation. Transactions onEmbedded Computing Systems, 6(3):18, 2007.
[17] Y. Lee et al. µ-FTL: a memory-efficient flash translationlayer supporting multiple mapping granularities. InInternational Conference on Embedded Software, pages21–30, 2008.
[18] D. Ma, J. Feng, and G. Li. LazyFTL: A Page-level FlashTranslation Layer Optimized for NAND Flash Memory. InSIGMOD, volume 48, pages 366–375, 2011.
[19] Nokia. Network Database Benchmark. Available:hoslab.cs.helsinki.fi/homepages/ndbbenchmark.
[20] D. Park and D. Du. Hot Data Identification for Flash-basedStorage Systems Using Multiple Bloom Filters. In MSST,pages 1–11, 2011.
[21] D. Park et al. HotDataTrap: A Sampling-based Hot DataIdentification Scheme for Flash Memory. In SAC, pages1610–1617, 2012.
[22] M. Rosenblum and J. Ousterhout. The Design andImplemention of a Log-Structured File-System. In SOSP,pages 1–15, 1991.
[23] M. Rosenblum and J. Ousterhout. The Design andImplementation of a Log-Structured File-System. In ACMTransactions on Computer Systems, volume 10, pages26–52, 1992.
[24] Transaction Processing Council. TPC-C StandardSpecification. Available: www.tpc.org/tpcc.
[25] Transaction Processing Council. TPC-E StandardSpecification. Available: http://www.tpc.org/tpce .
[26] M. Wu and W. Zwaenepoel. eNVy: A Non-Volatile, MainMemory Storage System. In ASPLOS, volume 29, pages86–97, 1994.
744