Improving Fatigue Strength of Polymer Concrete using ... · Improving Fatigue Strength of Polymer...
67
Improving Fatigue Strength of Polymer Concrete using Nanomaterials MAHMOUD REDA TAHA, Ph.D. RAFI TAREFDER, Ph.D. SPTC14.1-66-F Southern Plains Transportation Center 201 Stephenson Parkway, Suite 4200 The University of Oklahoma Norman, Oklahoma 73019
Transcript of Improving Fatigue Strength of Polymer Concrete using ... · Improving Fatigue Strength of Polymer...

Improving Fatigue Strength of Polymer Concrete using Nanomaterials
MAHMOUD REDA TAHA, Ph.D.
RAFI TAREFDER, Ph.D.
SPTC14.1-66-F
Southern Plains Transportation Center 201 Stephenson Parkway, Suite 4200 The University of Oklahoma Norman, Oklahoma 73019

i
DISCLAIMER
The contents of this report reflect the views of the authors, who are responsible for the
facts and accuracy of the information presented herein. This document is disseminated
under the sponsorship of the Department of Transportation University Transportation
Centers Program, in the interest of information exchange. The U.S. Government
assumes no liability for the contents or use thereof.

ii
Technical Report Documentation Sheet
1. REPORT NO. SPTC 14.1-66
2. GOVERNMENT ACCESSION NO.
3. RECIPIENTS CATALOG NO.
4. TITLE AND SUBTITLE Improving fatigue strength of polymer concrete using nanomaterials
5. REPORT DATE
Nov. 30, 2016 6. PERFORMING ORGANIZATION CODE
7. AUTHOR(S)
Mahmoud Reda Taha and Rafi Tarefder 8. PERFORMING ORGANIZATION REPORT University of New Mexico
9. PERFORMING ORGANIZATION NAME AND ADDRESS School of Civil Engineering University of New Mexico 210 University Blvd NE MSC01 1070, room 3020 Albuquerque, NM 87131-0001
10. WORK UNIT NO.
11. CONTRACT OR GRANT NO. 2014-30
12. SPONSORING AGENCY NAME AND ADDRESS Southern Plains Transportation Center 201 Stephenson Pkwy, Suite 4200 The University of Oklahoma Norman, OK 73019
13. TYPE OF REPORT AND PERIOD COVERED Final April 2015 – November 2016 14. SPONSORING AGENCY CODE
15. SUPPLEMENTARY NOTES
Matching fund provided by New Mexico Department of Transportation (NMDOT) and Industrial Partners (Transpo Industries and Epoxy Chemicals Inc.)
16. ABSTRACT
Polymer concrete (PC) is that type of concrete where the cement binder is replaced with polymer. PC is often used to improve friction and protect structural substrates in reinforced concrete and orthotropic steel bridges. However, its low fatigue performance, limited fracture toughness and tendency to debond pose expensive maintenance challenges for highway bridges. This research investigated the use of nanomaterials such as multi-walled carbon nanotubes (MWCNTs) and alumina nanoparticles (ANPs) to produce PC with superior bond strength, fracture toughness and fatigue strength. A total of 20 different PC mixes were containing up to 3.0 wt.% content of nanomaterial were developed and examined. Mechanical characterization methods including compressive, flexural, bond and tensile strengths, ductility (strain at failure), toughness, fracture toughness and fatigue were conducted. Finite element modeling was also utilized to understand the shear stresses in PC-steel interface. Microstructural analysis revealed the chemical effects of incorporating nanomaterials in PC. The results show improvements in all mechanical performances of PC reaching 170% in fracture toughness, 1200% in fatigue life, 135% in ductility with a decrease in tensile and compressive strengths by about 15%. Microstructural analysis proved the ability of ANPs and pristine MWCNTs to alter the chemical reaction of epoxy and reduce PC crosslinking density while carboxyl MWCNTs increase PC crosslinking density. Pristine MWCNTs also showed the ability to self-monitor PC under static and cyclic loads. 17. KEY WORDS Nanomaterials, polymer concrete, fatigue
18. DISTRIBUTION STATEMENT No restrictions. This publication is available at www.sptc.org and from the NTIS.
19. SECURITY CLASSIF. (OF THIS REPORT)
Unclassified
20. SECURITY CLASSIF. (OF THIS PAGE)
Unclassified
21. NO. OF PAGES
66 + cover
22. PRICE

iii
SI* (MODERN METRIC) CONVERSION FACTORS APPROXIMATE CONVERSIONS TO SI UNITS
SYMBOL WHEN YOU KNOW MULTIPLY BY TO FIND SYMBOL
LENGTH in inches 25.4 millimeters mm ft feet 0.305 meters m yd yards 0.914 meters m mi miles 1.61 kilometers km
AREA in
2 square inches 645.2 square millimeters mm
2
ft2 square feet 0.093 square meters m2
yd2 square yard 0.836 square meters m2
ac acres 0.405 hectares ha mi
2 square miles 2.59 square kilometers km
2
fl oz gal
ft3
yd3
VOLUME fluid ounces 29.57 milliliters gallons 3.785 liters cubic feet 0.028 cubic meters
cubic yards 0.765 cubic meters NOTE: volumes greater than 1000 L shall be shown in m
3
mL L
m3
m3
MASS oz ounces 28.35 grams g lb pounds 0.454 kilograms kg T short tons (2000 lb) 0.907 megagrams (or "metric ton") Mg (or "t")
oF
TEMPERATURE (exact degrees) Fahrenheit 5 (F-32)/9 Celsius
or (F-32)/1.8
oC
ILLUMINATION fc foot-candles 10.76 lux lx
fl foot-Lamberts 3.426 candela/m2 cd/m
2
FORCE and PRESSURE or STRESS lbf poundforce 4.45 newtons N lbf/in
2 poundforce per square inch 6.89 kilopascals kPa
*SI is the symbol for the International System of Units. Appropriate rounding should be made to comply with Section 4 of ASTM E380. (Revised
March 2003)

iv
APPROXIMATE CONVERSIONS FROM SI UNITS
SYMBOL WHEN YOU KNOW MULTIPLY BY TO FIND SYMBOL
LENGTH mm millimeters 0.039 inches in m meters 3.28 feet ft m meters 1.09 yards yd km kilometers 0.621 miles mi
AREA mm
2 square millimeters 0.0016 square inches in
2
m2 square meters 10.764 square feet ft2
m2 square meters 1.195 square yards yd2
ha hectares 2.47 acres ac km
2 square kilometers 0.386 square miles mi
2
VOLUME mL milliliters 0.034 fluid ounces fl oz L liters 0.264 gallons gal
m3 cubic meters 35.314 cubic feet ft3
m3 cubic meters 1.307 cubic yards yd3
MASS g grams 0.035 ounces oz kg kilograms 2.202 pounds lb Mg (or "t") megagrams (or "metric ton") 1.103 short tons (2000 lb) T
TEMPERATURE (exact degrees) oC Celsius 1.8C+32 Fahrenheit oF
ILLUMINATION lx lux 0.0929 foot-candles fc cd/m
2 candela/m
2 0.2919 foot-Lamberts fl
FORCE and PRESSURE or STRESS N newtons 0.225 poundforce lbf
kPa kilopascals 0.145 poundforce per square inc h lbf/in2
*SI is the symbol for the International System of Units. Appropriate rounding should be made to comply with Section 4 of ASTM E380. (Revised
March 2003)

vi
TABLE OF CONTENTS
INTRODUCTION ............................................................................................................. 1
EXPERIMENTAL METHODS .......................................................................................... 4
Materials ...................................................................................................................... 4
Procedure for synthesis and mixing of polymer nanocomposite .................................. 4
Flexural Testing ........................................................................................................... 6
Tension Testing ........................................................................................................... 8
Compression Testing ................................................................................................. 14
Electrical Monitoring and Damage Feature ................................................................ 16
Fatigue testing of PC overlays with and without nanomaterials ................................. 20
Fracture toughness testing of PC overlays with and without nanomaterials .............. 23
Finite element modeling of PC overlays with steel substrate ..................................... 35
Microstructural Analysis ............................................................................................. 42
CONCLUSIONS ............................................................................................................ 49
REFERENCES .............................................................................................................. 50

vii
LIST OF FIGURES
Figure 1: Technique for mixing PC incorporating MWCNTs. .......................................... 5
Figure 2: Flexural strength of PC with and without P-MWCNTs showing change from -
19% to 9% from PC-Neat. ............................................................................................... 7
Figure 3: Flexural strength of PC with and without COOH-MWCNTs showing change
from -14% to 42% from PC-Neat. .................................................................................... 7
Figure 4: Flexural strength of PC with and without ANPSshowing change from -17% to
30% from PC-Neat. ......................................................................................................... 8
Figure 5: Tension sample molds, dimensions and sample. ............................................ 9
Figure 6: Tensile strength of PC mixes using different nanomaterials as well as 90%
filler content. .................................................................................................................... 9
Figure 7: Tensile strain at failure of PC mixes using different nanomaterials as well as
90% filler content. .......................................................................................................... 10
Figure 8: Tensile displacement at failure of PC mixes using different nanomaterials as
well as 90% filler content. .............................................................................................. 10
Figure 9: Stress-strain diagrams for NCPC mixes in tensile test. ................................. 12
Figure 10: Toughness of PC and NCPC in tensile test................................................. 12
Figure 11: Compression cylinders: Tested sample (right) with untested (left). ............. 15
Figure 12: Compressive strength of PC and NCPC. .................................................... 15
Figure 13: Percentage of tensile strength to compressive strength of PC and NCPC. . 16
Figure 14: Test set-up for monitoring damage evolution in PC under flexural static
loading. Figure shows the extreme deformability of PC incorporating P-MWCNTs. Red
connectors are connected to silver tape painted on around PC to measure change in
electrical resis ............................................................................................................... 17
Figure 15: Electrical damage, mechanical damage and strain with respect to stress for
PCNP-2.0 showing the ability of monitoring static damage evolution in PC with MWCNTs
using electrical conductivity. .......................................................................................... 18
Figure 16: Electrical damage, mechanical damage and strain with respect to stress for
PCNP-3.0 showing the ability of monitoring static damage evolution in PC with MWCNTs
using electrical conductivity. .......................................................................................... 20
Figure 17: New fatigue test set-up developed by the PI showing the loading frame and
the source meter connected to measure change in electrical resistance to monitor
fatigue damage evolution in PC. ................................................................................... 21

viii
Figure 18: Change in electrical resistance in PC with and without MWCNTs. Figure
shows the non-conductive nature of PC neat and the ability to measure electrical
conductivity of PC incorporating 2.0% MWCNTs. ......................................................... 22
Figure 19: Fatigue life of PC incorporating MWCNTs showing the increase of fatigue
life for PC incorporating 1-2% MWCNTs. (% values above bars represent change
compared with neat PC). ............................................................................................... 22
Figure 20:Initial load setup by the PI to examine the fracture toughness of PC ........... 23
Figure 21: Modified fracture toughness test setup per ACI446 used to capture all tests.
...................................................................................................................................... 24
Figure 22: Schematics of the setup presented in Figure 21 clarifying all test features. 24
Figure 23: Shop drawings for fracture test setup including loading and reference frames.
...................................................................................................................................... 26
Figure 24: Basic principles used for analysis of notched beam set-up data to extract the
bilinear fracture curve of PC after Chapman [64]. ......................................................... 27
Figure 25: Schematics of the methods prescribed to translate the test data from three-
point bending to direct tension test as prescribed by Chapman. ................................... 28
Figure 26: Schematics of the methods prescribed to translate the test data from three-
point .............................................................................................................................. 28
Figure 27: Schematics of the methods prescribed to translate the test data from three-
point .............................................................................................................................. 29
Figure 28: Schematics of the methods prescribed to translate the test data from three-
point .............................................................................................................................. 29
Figure 29: Model of Quasi-Brittle Fracture materials showing the increase in stress due
to the fracture process zone [66]. .................................................................................. 31
Figure 30: QBFM analysis for-loop using the effective crack modulus [65]. ................. 32
Figure 31: The critical stress intensity factor per QBFM analysis ................................. 34
Figure 32: The critical energy release rate per QBFM analysis .................................... 34
Figure 33: The critical J-integral values per QBFM analysis ........................................ 35
Figure 34: The critical total fracture energy per QBFM analysis ................................... 35
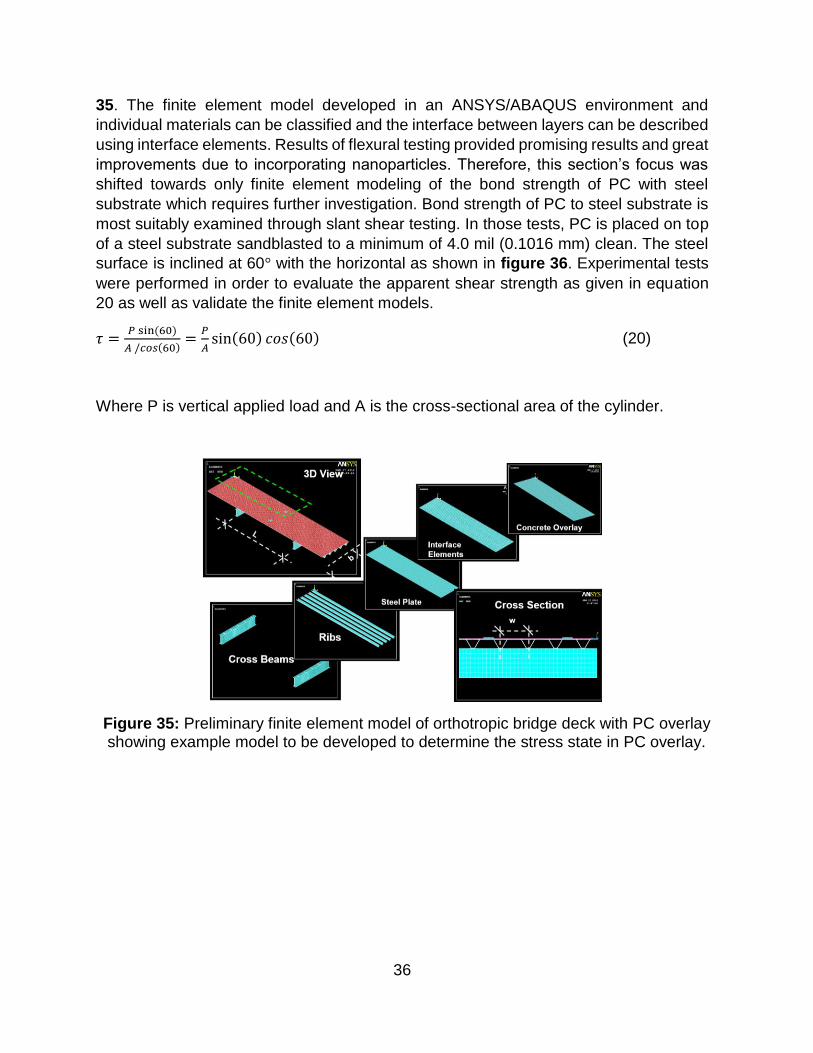
Figure 35: Preliminary finite element model of orthotropic bridge deck with PC overlay
showing example model to be developed to determine the stress state in PC overlay. 36
Figure 36: Slant shear test schematics and an actual specimen showing both
substrates. ..................................................................................................................... 37
Figure 37: FE model using ABAQUS simulation environment: (a) Boundary conditions
(b) Bilinear shear stress-slip relation where Kt is shear contact stiffness, GII is mode II

ix
fracture energy and τu is maximum shear stress (c) Meshed model using 74,524
elements. ....................................................................................................................... 38
Figure 38: Load-displacement curves of PC with different nanomaterials as measured
experimentally during slant shear test and extracted using the finite element method for
(a) PC-Neat, (b) PCNC-0.5, (c) PCNA-0.5, (d) PCNA-2.0. ............................................ 39
Figure 39: Apparent shear strength of all PC mixes (MPa) .......................................... 40
Figure 40: Slant shear fracture surface post-failure for all PC mixes showing complete
adhesion failure. ............................................................................................................ 40
Figure 41: Shear strength for different PC incorporating nanomaterials interpreted using
apparent shear strength (average stress based on slant shear standard) and maximum
local shear stress using the finite element model. The % difference shown is the
difference ...................................................................................................................... 41
Figure 42: Load-displacement extract from finite element analysis of neat PC showing
magnified slippage at 0.720mm, 0.802mm, and 0.837mm. ........................................... 42
Figure 43: Shear contours showing locations of maximum local shear stress during
slippage at vertical slip of (a) 0.720 mm (b) 0.802 mm and (c) 0.837 mm ..................... 42
Figure 44: SEM scans for hardened epoxy containing (a) 0.5 wt.% content P-MWCNTs
and (b) 2.0 wt.% content P-MWCNTs. .......................................................................... 44
Figure 45: SEM scans for hardened epoxy containing 0.5 wt.% COOH-MWCNTs (left)
and 2.0 wt.% COOH-MWCNTs (right). .......................................................................... 44
Figure 46: SEM scans for hardened epoxy containing (a) and (b) 0.5 wt.% ANPSand
(c) and (d) 3.0 wt.% ANP. .............................................................................................. 45
Figure 47: SEM scans for neat hardened epoxy. ......................................................... 45
Figure 48: Results of neat PC, 0.5 and 2.0 wt.% MWCNTs FTIR spectrograph .......... 46
Figure 49: Results of PC-Neat and 0.5 wt.% P-MWCNTs and COOH-MWCNTs FTIR
spectrograph ................................................................................................................. 47
Figure 50: Results of PC-Neat and 0.5, 2.0 and 3.0 wt.% ANPs FTIR spectrograph ... 48

x
LIST OF TABLES
Table 1: Mix proportions for polysulfide siloxane epoxy nanocomposites kg/m3 (lb/ft3). 5
Table 2: Linear elastic fracture mechanics least dimension parameter values. ............ 30

xi
EXECUTIVE SUMMARY
Polymer concrete (PC) overlays are typically used to improve friction in highway bridges
and parking structures and to protect the structural substrate in steel and concrete
bridges. Limited bond strength and fatigue failures of PC overlays have been observed
and pose an expensive maintenance challenges for highway bridges. In spite of its
superior durability performance, compared with normal concrete overlays, PC overlays
fracture toughness is slightly higher than normal concrete and thus has limited crack
propagation resistance. Such criteria limit PC’s ability to resist debonding or fatigue
damage. During the last two decades, significant improvements to polymer materials
were made by considering nanomaterials. Experimental and field research efforts have
proven the ability of nanomaterials to alter polymers and to produce new polymer
nanocomposite materials with improved strength, stiffness and resistance to
degradation. Examples of improvement of polymers and polymer composites using
carbon nanotubes, nano silica and nanoclay have been reported in the literature.
This study proposes to improve the bond strength, ductility, fracture toughness and
fatigue life of PC overlays using nanomaterials such as multi-walled carbon nanotubes
(MWCNTs) or alumina nanoparticles (ANPs). Different contents of each nanoparticle
were investigated to define the optimal content desired for improved mechanical
performance. In particular, two types of MWCNTs namely pristine (P-MWCNTs) and
carboxyl functionalized MWCNTs (COOH-MWCNTs) were investigated. P-MWCNTs
also resulted in improved electrical conductivity of PC enabling structural health
monitoring (SHM) by correlating mechanical damage to changes in electrical
conductivity or resistance. Mechanical characterization methods included tensile,
compressive and flexural strength tests to evaluate ductility (strain at failure), fatigue,
toughness and fracture toughness. Further analysis of the bond strength of PC-steel
surfaces was investigated using slant shear method and finite element analysis (FEA)
using ABAQUS. Microstructural analysis utilizing scanning electron microscope (SEM)
and Fourier transform infrared spectroscope (FTIR) were used to examine proper
dispersion and investigate potential chemical reaction between the polymer and the
nanomaterials. Special fatigue, tension and fracture toughness test apparatuses were
developed and used to evaluate performance of PC with nanomaterials.
SEM images of all epoxy nanocomposite reveal that uniform dispersion was achieved
using shear mixing and ultrasonication. Thus, this method of dispersion was kept
constant for all PC mixes. The experimental results show that PC provide superior
ductility over conventional concrete materials. PC exhibit large tensile strengths up to
11.5 MPa and tensile strain at failure of 1.8%. Incorporating P-MWCNTs resulted in
small decrease in tensile strength with a minimum appreciable tensile strength of 9 MPa.
The strain at failure, however, increased to 3.2%. COOH-MWCNTs results show a
different behavior by increasing the tensile strength up to a maximum of 15.4 MPa with
a decrease in strain at failure to 0.8%. ANPs showed similar results to that of P-
MWCNTs with a minimum of 9.5 MPa and an improved tensile strain at failure of 4.9%.

xii
Thus, incorporating nanoparticles resulted in a maximum decrease of tensile strength
by 22% countered by a maximum improvement in strain at failure by 91%. The
significant improvements achieved were clearly reflected with improvements in PC’s
toughness by a maximum of 80%, and 135% for P-MWCNTs and ANPs respectively.
P-MWCNTs were solely investigated for fatigue performance as COOH-MWCNTs bond
with the host polymer matrix and ANPs do not provide a conductive network. Fatigue
performance of P-MWCNTs PC mixes showed improvements in fatigue life up to 1240%
at 2.0 wt.% content. Furthermore, the percolation level is achieved at such low content
allowing mechanical damage to be correlated to the change in electrical resistance.
Thus, self-sensing of PC is possible enabling the observation of damage propagation in
PC overlays using electrical measurements. PC samples in all mechanical tests
exhibited non-linear behavior redeeming linear elastic fracture mechanics (LEFM)
analysis, often used for concrete, invalid. Quasi-brittle fracture mechanics (QBFM) was
therefore used for the analysis of the fracture toughness parameters of PC with
nanoparticles. Total fracture energy parameter combining both elastic and J-integral
values of fracture toughness was used to describe the fracture toughness of PC. Results
show that incorporating P-MWCNTs, COOH-MWCNTs and ANPs improve the total
fracture toughness by 52%, 112%, and 128% respectively. Improvements with P-
MWCNTs mixes were achieved mainly with plastic fracture toughness while ANPs and
COOH-MWCNTs achieved improvements in both elastic and plastic fracture toughness.
FEA was utilized to examine the true shear stresses inflicted to PC-steel bond. Analysis
revealed the true shear stresses are formed at locations of maximum stiffness
mismatch. At these locations, minimum thickness of PC to steel is present and the shear
stresses are increased by up to 100%. Nonetheless, PC with nanoparticles provided
strong bond to steel substrates with improvement in bond strength up to 51%. Finally,
FTIR spectrographs reveal that both P-MWCNTs and ANPs delay the epoxy
polymerization and thus reduce PC crosslinking density thus improve ductility. On the
other hand, COOH-MWCNTs react with the host epoxy matrix forming C=O ester bonds
that increase the level of crosslinking density and improve strength.
PC incorporating nanoparticles provide a promising material that can be engineered to
provide mechanical enhancements in bond strength, ductility, fatigue life and fracture
toughness. Those parameters not only reduce the required maintenance associated
with PC overlays but also provide a promising material alternative to conventional
concrete in structural applications. While different nanomaterials result in different
mechanical and chemical enhancing mechanisms, the variation in nanoparticles with
polymer epoxy systems provide a promising research target to meet many highway
bridge overlay need and eliminate many undesired drawbacks. With the continuous
decrease in cost of nanoparticles and the low content required to induce significant
improvements (0.5 – 3.0 wt.% of resin weight), nanoparticles are superior to common
additives such as chopped fibers and chemical admixtures in providing much superior
mechanical performance prolonging structures life and reducing maintenance needs.

1
INTRODUCTION
Polymer concrete (PC) is a composite material in which a polymer matrix such as epoxy,
unsaturated polyester (UP) or Poly methyl methacrylate (PMMA) replaces Portland
cement as a binder to bond aggregate together [1]. PC is used in numerous applications
including bridge deck overlays, machine foundations, pipes and pipe liners, hazard
materials storage and architectural panels [1-2]. PC gained worldwide attention in the
construction field since the 1970s because of its superior durability and attractive
mechanical properties. Typical mechanical properties of PC incorporate a compressive
strength of 100-120 MPa, a tensile strength of 8-10 MPa, a flexural strength of 20-24
MPa and a wide range of modulus of elasticity in the range of 20-40 GPa depending on
the type of resin and aggregates used [3-4]. Hsu and Fowler [5] showed that PC has
superior fatigue strength compared with conventional Portland cement concrete. PC has
also been reported to have excellent bond strength to different substrates including
concrete and steel [6]. The improved mechanical characteristics of PC stem from a tight
microstructure which allows PC to have excellent durability as well [7]. The above
attractive mechanical and durability characteristics promoted the use of PC as overlays
in bridge decks and parking structures. While PC overlays have been used in numerous
bridges and parking structures worldwide, they have been reported to suffer fatigue
cracks that lead to premature debonding [1]. Methods to improve fatigue strength of PC
have been sought [8].
Nanoparticles such as nanoclay, alumina nanoparticles, carbon nanotubes, and carbon
nanofibers have been recently examined to improve polymer materials. Jo et al. [9]
reported improved mechanical and thermal performance of unsaturated polyester (UP)
concrete mixed with montmorillonite (MMT). Moreover, modified nanoclay was added to
epoxy concrete and improved some mechanical properties, but it decreased tensile and
flexural strengths [10]. Alumina nanoparticles (ANPs) were successively used with
cementitious materials to improve strength development of calcium silicate hydrate
(CSH) gels and to limit the interfacial transition zone (ITZ) between paste and aggregate
and improve its characteristics [11-13]. Furthermore, the mechanical properties
including tensile strength and strain of latex modified concrete were reported to be
significantly improved at low CNTs’ content [14]. CNTs are tabular structure made from
concentrically rolled single or multiple graphite sheets. CNTs were first introduced as
single-walled carbon nanotubes (SWCNTs) and proved to have superior mechanical
properties compared to many other nanomaterials, but they were typically expensive.
High-purity SWCNTs were synthesized and grown using thermal Chemical vapor
deposition (CVD) at a growth temperature of and above 700 oC [15].
Multi-walled carbon nanotubes (MWCNTs) appeared later as a cheaper alternative form
of CNTs. Using the CVD method, MWCNTs are synthesized at a relatively low
temperature of 450 oC compared to 700 oC for SWCNTs [16]. In order to generate a
2
chemical bond between CNTs and polymer matrix, CNTs need to be functionalized by
chemical groups that can react with the polymer matrix. Functionalization is a process
of surface treatment where a chemically attractive functional group is planted on the
surface of the nanomaterial. Functionalized nanomaterials proved necessary for good
dispersion inside polymer matrices [17-18]. Furthermore, surface functionalization
enables nanomaterials to cross the length scale by generating a chemical bond with the
polymer matrix and thus altering the original polymer and generating a new polymer
nanocomposite [19] and by participating as reinforcement (fibers or platelets) that
hinders chain movement and bridge microcracks to improve mechanical and fracture
properties of the polymer nanocomposite [20]. Swain et al. [21] reported using saline
functionalized MWCNTs in producing polymer nanocomposites with improved
mechanical properties. Soliman et al. [22] showed the significance of carboxylic group
functionalization on improving the off-axis tensile strength of woven carbon fiber
composites. Furthermore, wax coated MWCNTs enhanced the electrical conductivity
and improved the mechanical properties of high-density polyethylene system [23].
Alumina nanoparticles (ANPs) provide a different approach to altering the mechanical
properties of polymers and other materials. While MWCNTs are classified as two
dimensional nanoparticles, ANPs are three dimensional nanoparticles with significantly
higher surface area allowing high chemical reactivity [24]. Li et al. [11] examined the
elastic modulus and compressive strength of cement concrete including ANPs at 3, 7
and 28 days of curing and reported 143% increase in mortar elastic modulus using 5%
ANPs after the 28 days curing period. However, no increase in compressive strength
was reported [11]. In order to obtain eco-efficient cements, Campillo et al. [12] used
agglomerated dry alumina and colloidal alumina in hydrated belite cements. The
addition of two types of ANPs increased the 7-day compressive strength of the mixes.
Hosseini et al. [13] investigated the effect of different kinds of nano-particles including
SiO2, Al2O3, clay and CaCO3 on performance of cementitious materials. As a result,
they pointed out that with the addition of nano-particles flexural strength of the mixes
was improved [13]. To improve polymers, Dorigato and Pegoretti [25] used ANPs
dispersed in epoxy to investigate thermo-mechanical behavior of the ANPs- epoxy
mixture. It was shown that ANPs could effectively improve the stiffness, adhesion
strength, and fracture toughness of epoxy [25]. Furthermore, Zabihi et al. [26]
synthesized epoxy nanocomposites with various weight content of ANPs and showed
that inclusion of ANPs significantly affects the thermal degradation kinetics of the epoxy
nanocomposites [26].
In the last two decades, additives have been added to the PC binder system or replaced
some of the aggregate to enhance one or more of the mechanical or chemical
properties. These additives included polymeric wastes such as recycled plastic bottles
[27], recycled PC [28], rubbers and electrical cable wastes [29]. Prior work also included
replacing aggregate filler in PC by fly ash [30]. Moreover, nanoscale inorganic particles
such as nanoclay, carbon nanotubes, and carbon nanofibers were added to polymer
matrices to manufacture polymer nanocomposites. With homogeneous dispersion of the

3
nanoscale particles in polymer matrices, polymer nanocomposites experience improved
properties compared with pure polymer matrices [31-32]. New generation of latex
modified concrete with enhanced properties was also produced by incorporating Carbon
Nano-Tubes (CNTs) in the polymer matrix during PC fabrication [33]. Here we suggest
altering polymer concrete using multi-wall carbon nanotubes.
Many researchers have studied the effects of carbon nanotubes on tensile properties of
hardened epoxy samples through various sample dimensions and various mechanical
tests namely; direct tension, flexural and through dynamic modulus analyser (DMA)
tests [34-42]. The content introduced often ranged between 0.1 and 2.0 wt.% content
[34-36, 39-43] with few divergent up to 5.0 and 10.0 wt.% [38, 44] and as low as 0.01
wt.% [37]. The inclusion of MWCNTs reported improvements in tensile strength in the
range of 9 to 51% of epoxy and PMMA composites [34-43]. An increase of tensile
strength was observed with the increase of content but in a decaying fashion. Wang et
al. showed that parallel aligned single walled CNTs improve the tensile strength as CNTs
contents increase up to 168% [44]. Alignment in the perpendicular direction however
showed smaller improvements and further a decrease in strength beyond 2.0 wt.%
content [44]. The variation in the reported results therefore is attributed to the random
orientation of CNTs resulting in non-uniform strengthening mechanisms as well as the
different chemical interaction between epoxy and MWCNTs.
Literature on fracture toughness of epoxy polymer systems is often incomplete and is
most often limited to the critical stress intensity factor (KIc) [45-51]. For instance, while
the vast majority of literature show an increase in fracture toughness [45-57] and further
improvements with the increase in content [45-47, 58], Ma et al. and Opelt et al. showed
a decrease of KIc with the increase in content of pristine MWCNTs [58, 59]. The
inclusion of significantly stiffer materials to a polymer matrix (1 TPa compared to ~1-10
GPa) along with the change in chemical bonds and crosslinking density alters the
material’s stiffness and strength. For example, the elastic modulus has been shown to
increase due to the incorporation of MWCNTs by 3 – 26% [48, 50, 53-56, 59-60].
Therefore, reports on the critical energy release rate (GIc) or the critical J-integral (JIc)
provide more thorough fracture toughness representation. In fact, researchers found
greater increase in fracture toughness in the range of 56 – 138% measured by GIc
compared to 27-51% measured by KIc [52-55, 57-58]. The content of nanotubes
examined to induce improvements in fracture toughness often ranged between 0.05 and
1.5 wt.% content [45-46, 48-50, 52-53, 56-57, 59]. Yu et al. and Ma et al. examined
higher contents up to 3.0 and 5.0 wt.% respectively [47, 59]. The polymer-nanotubes
chemical interaction occurs differently based on the content of nanotubes and the type
of polymer used. This is reflected for example at 1.0 wt.% content of pristine MWCNTs
where White and Sue showed a 42% increase in KIc compared to 27% by Tang et al.
On the other hand, Zhou et al. showed similar improvements to Tang et al. of 30% at
much lower content (0.3 wt.%) while Yu et al. reported parallel 33% improvements
however at much higher content (3.0 wt.%) [47-48, 54]. The nano-induced chemical
effects alter polymers chemically modifying the material’s stress transfer mechanism.

4
This is apparent as MWCNTs epoxy samples show a change in the glass transition
temperature (Tg) as it was reported to increase [46, 54-55, 58] or a decrease [53, 56].
On the other hand, MWCNTs provide significantly high aspect ratio that lead to
microfiber-like crack arresting mechanisms such as fiber pull-out or bridging [53]. As a
result, analysis of the effects of MWCNTs of fracture toughness are only valid when
establishing both mechanical and chemical features. Only then the crack energy
consumption mechanisms can be identified and the change of fracture behavior caused
by nanotubes is identified.
EXPERIMENTAL METHODS
Materials
1. Polymers
The polymer used is polysulfide epoxy including silane. This epoxy is usually used as
an overlay material for repair of bridge decks. The epoxy consists of two components,
epoxy resin and epoxy hardener. The resin is mixture of Bisphenol A/Epichlorohydrin
Epoxy Resin including silane. The hardener is Diethylenetriamine (DETA), Phenol, 4,4’-
(1-methylethylidene)bis-, and Tetraethyllenepentamine.
2. Filler
In all mixes crystalline silica (quartz) and ceramic microspheres powder was used as
mixing filler to produce the slurry to be cast and harden.
3. Nanomaterials
Pristine and functionalized with carboxyl group MWCNTs namely P-MWCNTs and
COOH-MWCNTs respectively were provided by Cheap Tubes, Inc. Both have an outer
dimension of 20-30 nm, an inner dimension of 5-10 nm, and a length of 10-30 μm. The
Alumina nanoparticles (ANP) used is Alumina Oxide (Al2O3) Nano-particles of 50 nm
maximum particle size provided by Sigma Aldrich Inc.
Procedure for synthesis and mixing of polymer nanocomposite
For the neat polymer, the required amount of resin and hardener were mixed together
for 2-3 minutes using a low speed mixer, after which the required aggregate filler was
added. Mixing continued for 2-3 minutes until the mixture was uniform. For the
nanocomposite mix, the nanoparticles (e.g. MWCNTs) were added to the required
amount of the resin, the mix was stirred for 2 hours at 110 oC using magnetic stirring.
This relatively high mixing temperature was used to reduce the resin viscosity and
improve the dispersion of nanomaterials. The mix was then sonicated for 2 additional
hours at 60 oC. During the sonication, sound waves are generated from the transducer
and radiate through the liquid causing high and low pressures. At the low pressure

5
stage, millions of microscopic bubbles are formed; during the high pressure stage, the
previous bubbles collapse releasing high amount of energy and improving the dispersion
of the nanoparticles. Fig. 1 shows the mixing process for the polymer nanocomposite.
The polymer resin nanocomposite was left to reach room temperature and then mixed
with the hardener for 2-3 minutes. The required aggregate was then added and mixing
continued for 2-3 additional minutes until the mixture looked uniform. Table 1 provides
the neat (control) mix and PC mixes incorporating nanomaterials as percentage of the
epoxy resin by weight.
Figure 1: Technique for mixing PC incorporating MWCNTs: Magnetic stirring of MWCNTs in the epoxy resin (first dispersion step). The ultrasonication of that resin (the
second and last dispersion step). Mixing the resin incorporating MWCNTs with the hardener and aggregate to produce PC
Table 1: Mix proportions for polysulfide siloxane epoxy nanocomposites kg/m3 (lb/ft3).
Mix designation Resin Hardener Filler Nanomaterials Nano content
PC-Neat 288 (18) 128 (8) 1570 (98) None 0.00 (0.00)
PCNP-0.1 288 (18) 128 (8) 1570 (98) P-MWCNTs 0.29 (0.018)
PCNP-0.25 288 (18) 128 (8) 1570 (98) P-MWCNTs 0.72 (0.045)
PCNP-0.5 288 (18) 128 (8) 1570 (98) P-MWCNTs 1.44 (0.09)
PCNP-0.75 288 (18) 128 (8) 1570 (98) P-MWCNTs 2.16 (0.135)
PCNP-1.0 288 (18) 128 (8) 1570 (98) P-MWCNTs 2.88 (0.18)
PCNP-1.5 288 (18) 128 (8) 1570 (98) P-MWCNTs 4.32 (0.27)
PCNP-2.0 288 (18) 128 (8) 1570 (98) P-MWCNTs 5.76 (0.36)
PCNP-3.0 288 (18) 128 (8) 1570 (98) P-MWCNTs 8.64 (0.54)
PCNC-0.5 288 (18) 128 (8) 1570 (98) COOH-MWCNTs 1.44 (0.09)
PCNC-1.0 288 (18) 128 (8) 1570 (98) COOH-MWCNTs 2.88 (0.18)
PCNC-1.5 288 (18) 128 (8) 1570 (98) COOH-MWCNTs 4.32 (0.27)

6
PCNC-2.0 288 (18) 128 (8) 1570 (98) COOH-MWCNTs 5.76 (0.36)
PCNA-0.5 288 (18) 128 (8) 1570 (98) ANPs 1.44 (0.09)
PCNA-1.0 288 (18) 128 (8) 1570 (98) ANPs 2.88 (0.18)
PCNA-2.0 288 (18) 128 (8) 1570 (98) ANP 5.76 (0.36)
PCNA-3.0 288 (18) 128 (8) 1570 (98) ANP 8.64 (0.54)
PC-Neat-90F 288 (18) 128 (8) 1410 (88) None 0.00 (0.00)
PCNP-2.0-90F 288 (18) 128 (8) 1410 (88) P-MWCNTs 5.76 (0.36)
PCNA-2.0-90F 288 (18) 128 (8) 1410 (88) ANP 5.76 (0.36)
Analysis Flexural Testing
Three-point bending test under static loads were performed to investigate the behavior
of the PC overlay using a MTS Bionex servo hydraulic machine. Static loading 3-point
bending was conducted on 25 x 25 x 150 mm specimen as displacement control test
with a loading rate in the range of 0.20-0.45 mm/min. Throughout the test, time, load,
and displacement were recorded using MTS® 793 data acquisition system with a
sampling rate of 1 Hz. Five specimens of each PC mix were tested under flexural load
until failure. The results show that incorporating MWCNTs in the PC can increase the
flexural load capacity of PC at certain percentages. Mixes incorporating COOH-
MWCNTs provided an overall improvement in modulus of rupture (MOR) while P-
MWCNTs and ANPs averaged lower MOR. Figures 2, 3 and 4 show the results of MOR
for all mixes. The improvements in MOR ranged from 21% to 42% for COOH-MWCNTs,
1% to 9% for P-MWCNTs and 0 to 30% for ANP. The drop on the other hand was
insignificant with -13% to -19% for P-MWCNTs, -14% for COOH-MWCNTs, -4% to -17%
for ANP. Nonetheless, all mixes incorporating showed significant increase in ductility as
the maximum deflection increased as reflected as well in direct tension test discussed
later.

7
Figure 2: Flexural strength of PC with and without P-MWCNTs showing change from -19% to 9% from PC-Neat.
Figure 3: Flexural strength of PC with and without COOH-MWCNTs showing change from -14% to 42% from PC-Neat.

8
Figure 4: Flexural strength of PC with and without ANPs showing change from -17% to 30% from PC-Neat.
Tension Testing
The tensile strength of nanocomposite PC (NCPC) was evaluated using direct tension
test on standard dumbbell-shaped samples. The test was performed using a MTS
Bionex servo hydraulic machine. The test was performed according to ASTM D638-14.
In order to produce NCPC type III samples, specific molds were designed to cast
samples ready for testing. Figure 5 shows both type III dimensions and their specific
molds. NCPC samples were treated as rigid samples with a loading rate of 3.75 mm/min.
Strain recording extensometer was used to measure tensile strain at the mid-section of
samples were maximum strain is often observed. In order to produce NCPC with high
strain and strength, samples were heat cured at 60℃. Also, samples containing reduced
filler at 90% of the original mix were tested. Five samples per mix were used and the
average of all is shown in Figures 6, 7, 8, 9 and 10 for tensile strength, maximum strain,
maximum displacement, stress-strain curves and toughness respectively.

9
(a) Tension sample type III dimensions as produced by the specific molds shown
(b) PC tension samples produced
(c) PC sample in testing using extensometer
Figure 5: Tension sample molds, dimensions and sample.
Figure 6: Tensile strength of PC mixes using different nanomaterials as well as 90% filler content.

10
Figure 7: Tensile strain at failure of PC mixes using different nanomaterials as well as 90% filler content.
Figure 8: Tensile displacement at failure of PC mixes using different nanomaterials as well as 90% filler content.

11
(a) All NCPC mixes heat cured at 60℃ stress-strain diagrams for tensile test.
(b) NCPC incorporating P-MWCNTs stress-strain curves for tensile test,
(c) NCPC incorporating COOH-
MWCNTs stress-strain
curves for tensile test.

12
(d) NCPC incorporating ANPs stress-strain curves for tensile test.
(e) NCPC at 90% filler content incorporating P-MWCNTs and ANPs
Figure 9: Stress-strain diagrams for NCPC mixes in tensile test.
Figure 10: Toughness of PC and NCPC in tensile test.

13
NCPC mixes containing 100% filler:
The results above show evidently nominal curing conditions for the PC samples at 60℃.
All mixes reached sufficiently high tensile strength with a maximum of 11.30 MPa for
PC-Neat. Such tensile strength is significantly higher than that of ordinary concrete (OC)
and ordinary cementitious materials used in construction. OC samples will be prepared
for comparison at a later stage. The addition of nanomaterials showed a change of
tensile strength in the range of -5% to -22% for P-MWCNTs, -8% to 36% for COOH-
MWCNTs, -4% to -16% for ANPs. Mixes containing P-MWCNTs content ≤ 0.5 wt.%
showed larger drop than those of higher contents. COOH-MWCNTs samples were the
only samples to show improvement of tensile strength at 1.5 and 2.0 wt.% content. This
is attributed to the functionalization of MWCNTs that enables nanotubes to perform
chemical bonds with the host polymer matrix. The tensile strength of ANPs mixes
decrease similarly to P-MWCNTs with slightly less decrease from that of nanotubes.
Nonetheless, the tensile strength of all NCPC is significantly higher of OC at the range
of 9-15.4 MPa. On the other hand, improvements in strain at failure and toughness were
observed due to the incorporation of nanomaterials. Specifically, samples containing 3.0
wt.% ANPs content reached 4.9%. P-MWCNTs showed two distinct behaviors however
at contents ≤ 0.75 wt.% compared higher contents. At low contents, the tensile strain at
failure was firmly in the range of 2.3-2.9% with no clear impact of the content of
nanotubes. At 1.0 wt.% content, the strain at failure drops from that of lower contents to
1.6%. The addition of higher contents of nanotubes then corresponds to improvement
in tensile strain. In fact, at 2.0 wt.% content, NCPC shows similar strain at failure of that
of lower contents. In contrast, mixes containing COOH-MWCNTs shows a decrease of
tensile strain at failure with the increase in content. This is in agreement with the findings
of tensile strength as higher content results in increased reactivity increasing the
crosslinking of the polymer. Nonetheless, appreciable strain is achieved in the range of
0.8-1.9%. Therefore, it’s evident that the addition of nanomaterials significantly increase
the ductility of PC.
To further investigate the ductility, the area under the stress-strain curves of the tension
test were measured representing toughness. Significant increase is observed for all
mixes ranging from -4% to 80% for P-MWCNTs, -50% to -4% for COOH-MWCNTs, and
83% to 135% for ANP. P-MWCNTs results showed trends similar to those found in the
results of strain at failure. However, at 0.1 wt.% content the increase in toughness is
significantly different that those at contents in the range of 0.1-0.75 wt.%. At 1.0 wt.%
the toughness is lower than that at lower content but a general increase is observed with
the increase of content up to 2.0 wt.% content where it reaches similar increase to that
observed at lower contents. Mixes incorporating COOH-MWCNTs showed a decrease
in toughness with the increase in content of nanotubes. These results agree with the
findings of strength and strain at failure confirming the increase in cross linking. 3.0 wt.%
content of ANPs provides the highest increase in toughness and strain at failure.

14
Microstructural investigation is aimed to explain the differences in findings for all
nanomaterials used.
NCPC mixes containing 90% filler:
The reduction in filler content resulted in an increase in tensile strength by 21%,
decrease in strain at failure by -52% and a decrease in toughness by -11%. This is
explained by the increase in the crosslinking of the polymer chains that are less
interrupted with lower content of aggregate filler. Also, the decrease in filler content
results in an increase in particle density distribution eliminating part of the larger
particles. Therefore, the results with 90% filler showed demolished effect of
nanomaterials on PC-Neat when compared to 100% Filler. Tensile strength increased
by 7% and 10% for P-MWCNTs and ANPs at 2.0 wt.% content respectively. While the
effect of P-MWCNTs on strain and displacement is insignificant, ANPs had showed low
increase in strain and displacement by 51% and 10% when compared with PC-Neat-
90F. The change in toughness is also negligible for P-MWCNTs with an increase of 18%
but more significant with ANPs at 120%. As mentioned earlier, the effect of
nanomaterials at 90% filler is demolished as moving the increase in toughness, for
example, from 550% to 120% for ANP.
Compression Testing
Compressive testing of PC and NCPC was performed using 2inØ x 4 in cylinders.
Samples were casted and cured in similar fashion to tension samples using 60℃.
Testing of PC showed significant deformation prior to reaching the compressive strength
of the samples as shown in Figure 11. Figure 12 shows the compressive strength of all
mixes discussed previously in the tension testing section. At 100% filler, the inclusion of
nanomaterials decreases the compressive strength of PC-Neat by 18% and 22% for
MWCNTs and ANP. On the other hand, at 90% filler, the compressive strength for the
mixes incorporating MWCNTs and ANPs showed an increase of 35% for both.

15
Figure 11: Compression cylinders: Tested sample (right) with untested (left).
It seems the effect of nanomaterials on the materials strength (in compression or
tension) is reduced by the addition of nanomaterials. However, the strain of the material
is significantly improved. At lower content of filler, the effect of nanomaterials in
improving ductility is decreased but strength is gained. The percentage of tensile
strength to compressive strength of PC and NCPC seems significantly different of that
of OC. Figure 13 shows such relationship PC and NCPC tensile capacity is significantly
close to its compressive strength. Nanomaterials improve the tensile capacity of PC
more significantly than its compressive strength. Therefore, the percentage of tensile
strength to compressive strength for both neat samples is higher than that of NCPC.
Future work will discuss different curing conditions, filler content and nanomaterials
percentage incorporated as well OC testing to correlate the results of PC-Neat.
Figure 12: Compressive strength of PC and NCPC.

16
Figure 13: Percentage of tensile strength to compressive strength of PC and NCPC.
Electrical Monitoring and Damage Feature
Electrical conductivity measurement was recorded for PCNP-2.0 to PCNP-3.0 and
damage feature λ(t) was calculated using Equation 1. The damage feature λ(t)
represents the change in electrical resistance with 𝑅(𝑡) and 𝑅(𝑡0) as the electrical
resistance of the PC beam at time 𝑡 and 𝑡0. A quantification of the mechanical damage
evolution was performed for all tests through measurements of the change in flexural
rigidity. Equation 2 and 3 show the details of this measurement. where EI(i) is the
specimen flexural rigidity at any cycle, E is the modulus of elasticity, I is the cross
sectional second moment of inertia, ∆P(i) is the difference between maximum and
minimum loads at the same cycle, ∆(i) is the corresponding difference between
displacements, L is the span length of 175 mm, D(i) is the fatigue damage in %, and
EI(0) is the initial flexural rigidity.
λ(𝑡) =𝑅(𝑡)−𝑅(𝑡0)
𝑅(𝑡0) (1)
𝐸𝐼(𝑖) = (5
288) ∗
∆ P(i)∗L^3
∆ (i) (2)
𝐷(𝑖) = 1 −𝐸𝐼(𝑖)
𝐸𝐼(0) (3)
However, the resistance of Neat, PCNP-0.5 and PCNP-1.0 were too low to record
conductivity/resistivity changes quantifying damage during flexural testing. However, by
incorporating 2.0 wt.% MWCNTs the change in electrical resistance of the PC beams
was successfully recorded with a typical source meter. However, it is worth noting that
NCPC-3.0 with 3.0% P-MWCNTs was challenging to produce due to the significantly

17
high viscosity. Nonetheless, PCNP-2.0 and PCNP-3.0 provided sufficient damage
monitoring. The increase of load during static flexural loading corresponds to an
increase in microcrack development at the interface and then within the matrix. Such
cracks are then intersected by the high content of well-dispersed MWCNTs. This is
shown by an increase in resistivity of the PC beam with the increase in load. Figure 14
shows the test set-up used for monitoring damage propagation in PC under static
loading. Figure 14 also depicts the superior ductility/deformability of PC incorporating
MWCNTs (this case for 2.0% P-MWCNTs). Figure 15 and 16 show the relationship
between the load-damage feature λ(t) and load-displacement of PCNP-2.0 and PCNP-
3.0 respectively. It is evident incorporating P-MWCNTs in PC matrix prior to fabrication
allows monitoring damage evolution during static flexural loading to failure.
Figure 14: Test set-up for monitoring damage evolution in PC under flexural static loading. Figure shows the extreme deformability of PC incorporating P-MWCNTs. Red connectors are connected to silver tape painted on around PC to measure change in
electrical resis

18
(a) Electrical damage feature vs flexural stress and stress-strain for PCNP-2.0
(b) Mechanical damage evolution vs flexural stress and stress-strain for PCNP-2.0
(c) Electrical damage feature vs flexural stress and mechanical damage evolution vs
flexural stress for PCNP-2.0
Figure 15: Electrical damage, mechanical damage and strain with respect to stress for PCNP-2.0 showing the ability of monitoring static damage evolution in PC with
MWCNTs using electrical conductivity.

19
(a) Electrical damage feature vs flexural stress and stress-strain for PCNP-3.0
(b) Mechanical damage evolution vs flexural stress and stress-strain for PCNP-3.0

20
(c) Electrical damage feature vs flexural stress and mechanical damage evolution vs
flexural stress for PCNP-3.0
Figure 16: Electrical damage, mechanical damage and strain with respect to stress for PCNP-3.0 showing the ability of monitoring static damage evolution in PC with
MWCNTs using electrical conductivity.
Fatigue testing of PC overlays with and without nanomaterials
There is no standard fatigue test for concrete. This is attributed to the difficulty to conduct
the fatigue test on concrete with repeatable results. We therefore suggest borrowing the
standard fatigue test for asphalt overlay AASHTO T321- 07 [61] and modifying it to allow
testing of the PC overlay. The fatigue test proposed is a four-point bending displacement
controlled cyclic test. In this test, the displacement will be ramped up from zero to 2.0
mm in 1 minute, then test specimens will be cycled between 1.0 and 2.0 mm using a
sinusoidal waveform with a frequency of 1.0 Hz. Five prisms of each mix will be tested.
Each prism is 25 x 25 x 200 mm. The test will be conducted on an MTS® Bionix servo
hydraulic system in the PI’s lab (please see facilities section). A new test fixture has
been designed and produced by the PI as shown in Figure 17. The new set-up allows
holding two linear variable differential transducers (LVDTs) at the centre line of the test
specimen in order to record the displacement. Through the test, time, load and
displacement will be recorded and at a sampling rate of 10 Hz. The recorded time
(number of cycles), load and displacement will allow for determining the fatigue strength
and damage propagation in the specimen. Following the AASHTO standard [61], failure
point is considered when the cycle experienced 50% reduction in the initial flexural
rigidity.

21
Figure 17: New fatigue test set-up developed by the PI showing the loading frame and the source meter connected to measure change in electrical resistance to monitor
fatigue damage evolution in PC.
Testing showed that incorporating MWCNTs can significantly improve the electrical
conductivity of PC and thus enabled monitoring fatigue damage propagation in PC.
Figure 18 shows an example result for monitoring fatigue damage as the change in
electrical resistance in PC. It is interesting to note the significant improvement of PC
fatigue life incorporating 1.0% MWCNTs increased fatigue life of PC under the same
cyclic loading from 75,000 cycles to 300,000 cycles representing 300% increase in
fatigue life of PC. It is also apparent that the change in electrical conductivity/resistivity
follows the classical damage propagation modes of initial, steady-state to tertiary
confirming the ability of the proposed technique to monitor damage propagation in PC.
We note that measurements of PC incorporating less than 2.0% MWCNTs did not show
improvement of electrical conductivity. Further testing by the PIs confirmed that 2.0% to
be the percolation limit for this type of MWCNTs.

22
Figure 18: Change in electrical resistance in PC with and without MWCNTs. Figure shows the non-conductive nature of PC neat and the ability to measure electrical
conductivity of PC incorporating 2.0% MWCNTs.
Test results of PC-Neat, PCNP-0.5, PCNP-1.0, PCNP-2.0 and PCNP-3.0 showed an
increase in number of cycles to failure criteria described previously (50% reduction in
initial flexural rigidity) by incorporating MWCNTs. Fatigue life test results are presented
in Figure 19.
Figure 19: Fatigue life of PC incorporating MWCNTs showing the increase of fatigue life for PC incorporating 1-2% MWCNTs. (% values above bars represent change
compared with neat PC).

23
Fracture toughness testing of PC overlays with and without nanomaterials
Fracture toughness of PC with and without nanomaterials was determined using four-point bending. The test set-up developed is a notched beam test to obtain a bilinear approximation of the complete stress-crack opening displacement (COD) curve following the procedure presented in ACI 446 [62], which follows the original work of Guinea et al. [63]. In this test a beam is notched and is loaded in three-point bending and feedback is provided using Crack Mouth Opening Displacement (CMOD) measurement. Load rates were determined through trial testing with based on displacement control samples to ensure reaching the peak in timely fashion and record the softening curves of the tested specimen. ACI 446 [62] provides a detailed description of the test specimen preparation, loading set-up and test procedure. A standard beam 25 x 25 x 150 mm test is used. The test enables extracting standard stress-COD curves and thus fracture toughness KIC and fracture energy GF. All this information is essential for predicting fatigue strength of PC and for modeling PC. Two setups were used in executing the four point bending tests. Figures 20 and 21 show the initial and the final setups with proof of the excessive deformation leading to developing the new setup. Due to the ductile nature of PC and the extensive displacement and CMOD exhibited with cracking, special clip gauge was also used to capture CMOD values up to 14 mm. The initial setup used allowed confirmation of capturing the fracture toughness parameters of PC with four-point bending. The new setup had to be developed to capture the significant deformations as well as the effect of the large fracture process zone. The new setup confirms to ACI 446 recommendations on the fracture testing of concrete as well as it adapts to the ductile nature of PC. Figure 22 shows the schematics of all the parts and design drawings of the new setup. The new setup allows for testing different fracture samples at different lengths. This allows the PI to produce samples with overhangs that counter the self-weight; hence, eliminating the moment at the crack location. The new fixture also allows the rotation of one of the supports and the loading heads with±10°. The new fixture drawings are shown in Figure 23.
Figure 20:Initial load setup by the PI to examine the fracture toughness of PC

24
Figure 21: Modified fracture toughness test setup per ACI446 used to capture all tests.
Figure 22: Schematics of the setup presented in Figure 21 clarifying all test features.

25
(a) Loading head: Top part (b) Loading head: Bottom part
(c) Loading head: Loading plate (d) Loading head: Intermediate plate
(e) Loading frame: Left support (f) Loading frame: Right support

26
(g) Loading frame: Loading plate
(h) Reference frame: Top part – First support
(i) Reference frame: Top part – Second support
(j) Reference frame: Bottom part
Figure 23: Shop drawings for fracture test setup including loading and reference frames.
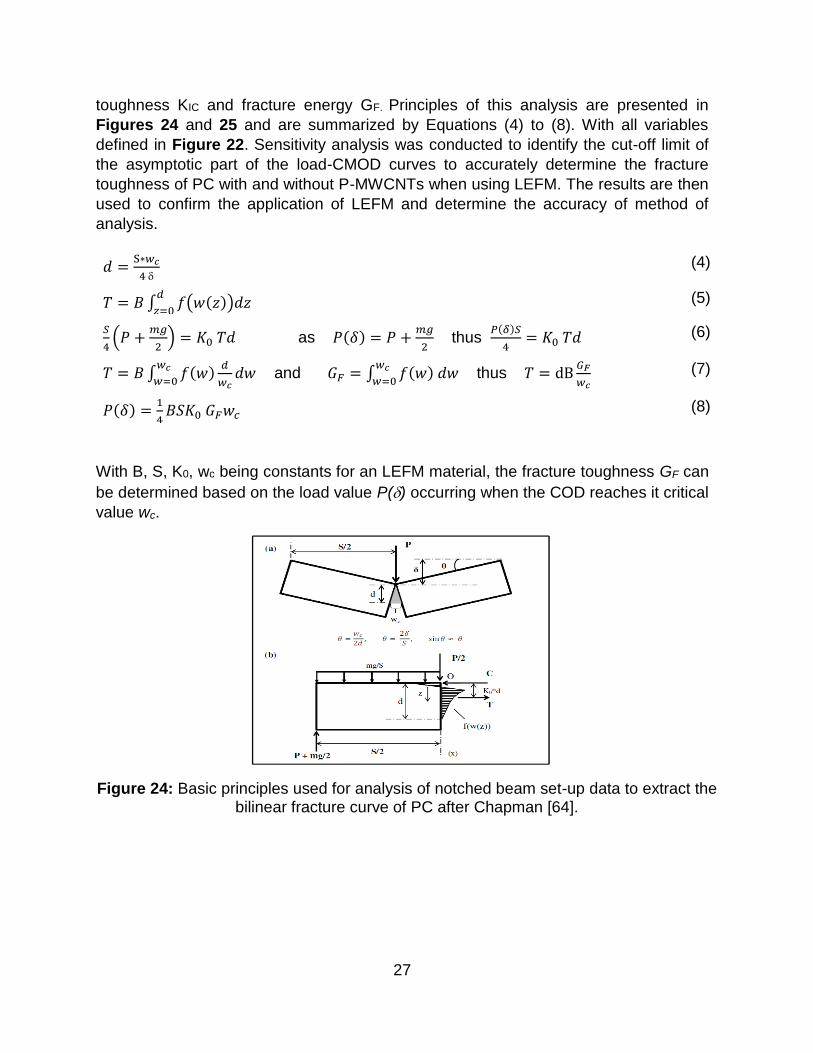
Analysis of the data was based on work by Guinea et al. [63] and Chapman [64] for
using principles of LEFM to identify the bilinear stress-COD curves and thus fracture
27
toughness KIC and fracture energy GF. Principles of this analysis are presented in
Figures 24 and 25 and are summarized by Equations (4) to (8). With all variables
defined in Figure 22. Sensitivity analysis was conducted to identify the cut-off limit of
the asymptotic part of the load-CMOD curves to accurately determine the fracture
toughness of PC with and without P-MWCNTs when using LEFM. The results are then
used to confirm the application of LEFM and determine the accuracy of method of
analysis.
𝑑 =S∗𝑤𝑐
4 (4)
𝑇 = 𝐵 ∫ 𝑓(𝑤(𝑧))𝑑𝑧𝑑
𝑧=0 (5)
𝑆
4(𝑃 +
𝑚𝑔
2) = 𝐾0 𝑇𝑑 as 𝑃(𝛿) = 𝑃 +
𝑚𝑔
2 thus
𝑃(𝛿)𝑆
4= 𝐾0 𝑇𝑑 (6)
𝑇 = 𝐵 ∫ 𝑓(𝑤)𝑑
𝑤𝑐𝑑𝑤
𝑤𝑐
𝑤=0 and 𝐺𝐹 = ∫ 𝑓(𝑤) 𝑑𝑤
𝑤𝑐
𝑤=0 thus 𝑇 = dB
𝐺𝐹
𝑤𝑐 (7)
𝑃(𝛿) =1
4𝐵𝑆𝐾0 𝐺𝐹𝑤𝑐 (8)
With B, S, K0, wc being constants for an LEFM material, the fracture toughness GF can
be determined based on the load value P() occurring when the COD reaches it critical
value wc.
Figure 24: Basic principles used for analysis of notched beam set-up data to extract the bilinear fracture curve of PC after Chapman [64].

28
Figure 25: Schematics of the methods prescribed to translate the test data from three-point bending to direct tension test as prescribed by Chapman.
Results of load-CMOD curves are shown in figure 26 for samples containing 0.5, 1.0,
1.5 and 2.0 wt.% MWCNTs and Neat Namely PCNP-0.5, PCNP-1.0, PCNP-1.5, PCNP-
2.0 and PC-Neat respectively. The bilinear approximation curves generated per the
previous discussion are shown in figure 27. Analysis of those curves allowed the
calculation of the fracture toughness parameters and evaluate the effect of incorporating
MWCNTs. Those results show a general increase in the fracture toughness of PC due
to the incorporation of MWCNTs in the range of 24-73% as shown in figure 28. Tension
tests allowed the extraction of the modulus of elasticity and the yield strength of PC.
Two parameters that along the fracture toughness are needed to confirm the
applicability of LEFM analysis. Equation (9) was used to measure the analysis’s least
sample dimension required for LEFM analysis and the results are shown in table 2.
l≥ 2.5 (K1C
σy)
2
=2.5 (√GFE
σy)
2
(9)
Figure 26: Load-CMOD curves for PC samples with and without MWCNTs.

29
Figure 27: Schematics of the methods prescribed to translate the test data from three-point
Figure 28: Schematics of the methods prescribed to translate the test data from three-point

30
Table 2: Linear elastic fracture mechanics least dimension parameter values.
Va
lue
PC
-Nea
t
PC
NP
-0.5
PC
NP
-1.0
PC
NP
-1.5
PC
NP
-2.0
E (GPa) 14.2 6.07 11.2 9.37 5.53
GF (kN/m)
4.09 6.77 5.06 7.08 5.80
𝝈𝒚 (MPa) 16.1 8.9 10.7 10.6 10.2
l (mm) 560 1287 1231 1490 772
The previous shows that LEFM is not an applicable analysis method since the least
sample’s dimension is 8 mm (representing the length of the crack) which is an order of
magnitude lower than the limit discussed in table 2. Hence, it was confirmed that PC
with and without MWCNTs exhibit Quasi-Brittle like material behavior and requires
further investigation to better quantify their fracture toughness parameters. The effective
crack modulus method of analysis was chosen based on prior work by the PI on Quasi-
Brittle Fracture Mechanics (QBFM) analysis [65]. This method of analysis was selected
due to the presence of large fracture process zone in which it increases the consumption
of fracture energy as shown in figure 29 and equation (10). Equations (11) and (12)
describe the effective elastic modulus of both the elastic and the critical limits
respectively. Equations (11) and (12) were used in support with (13) - (18) to calculate
all other parameters. A total fracture energy (TIc) was introduced per equation 19 that
combines the fracture energy from both the J-integral and the energy release rate.
Figure 30 shows the for-loop process performed on a Matlab code to determine the
critical crack depth used to measure QBFM fracture toughness parameters.
𝐺𝐼 = 𝐺𝐼𝑐 + ∫ 𝜎(𝐶𝑇𝑂𝐷)𝑑(𝐶𝑇𝑂𝐷)𝐶𝑇𝑂𝐷𝑐
0
(10)
𝐸∗ =1
𝑏𝑑𝛿𝑐(
13𝑤𝑙4
32𝑑2+
3𝑃𝑐𝑙3
4𝑑2+
3(1 + 𝜐)𝑃𝑐𝑙
4+
9𝑃𝑐𝑙2
2𝑑𝐹(𝛼𝑖𝑐)) (11)
𝐸 =1
𝑏𝑑𝛿𝑒(
13𝑤𝑙4
32𝑑2+
3𝑃𝑒𝑙3
4𝑑2+
3(1 + 𝜐)𝑃𝑒𝑙
4+
9𝑃𝑒𝑙2
2𝑑𝐹(𝛼𝑖𝑒)) (12)
𝐹(𝛼𝑖) = ∫ 𝛼 𝑔2(𝛼)𝑑𝛼 𝛼𝑖
0
(13)
𝑔(𝛼) = 𝑔1(𝛼)√𝜋 , 𝛼 =𝑎
𝑑 (14)

31
𝑔1(𝛼) = 1.122 − 1.4𝛼 + 7.33𝛼2 − 13.08𝛼3 + 14.0𝛼4 (15)
𝐾𝐼 = 𝑔1(𝛼)𝜎√𝜋𝑎 (16)
𝐺𝐼𝑐 =𝐾𝐼𝑐
2
𝐸 (17)
𝐽𝐼𝑐 =2
𝐻𝑐𝑏(𝐴𝑁 − 𝐴𝑈𝑁) (18)
𝑇𝐼𝑐 = 𝐺𝐼𝑐 + 𝐽𝐼𝑐 (19)
Figure 29: Model of Quasi-Brittle Fracture materials showing the increase in stress due
to the fracture process zone [66].

32
Figure 30: QBFM analysis for-loop using the effective crack modulus [65].
The results of QBFM analysis are presented according to the three different material
parameters as shown in figures 31 – 34. The fracture toughness parameters per QBFM
define the fracture toughness energy to be of two parts: one consumed through elastic
deformation creating new surfaces and another consumed at the fracture process zone.
Those parts present the LEFM and J-integral parameters. Hence, the combination of
those two parameters determine the effect of nanoparticles on the fracture toughness.
Figure 31 shows the effect of all nanoparticles at different contents on the critical stress
intensity factors (KIc). P-MWCNTs showed a change in the range of -6% to 20%, COOH-
MWCNTs showed an increase of 21% to 39% and ANPs showed -14% to 155%.
However, the effect of nanoparticles on such parameter don’t provide the complete
effect of quasi-brittle materials and the effect on energy consumption is the critical
parameter. Figures 32-34 display the effect of each nanoparticle on the energy release
rate. Specifically, Figure 34 shows the total effect while figures 32 and 33 show the
components in which each nanoparticle at specific content provides improvements. For
P-MWCNTs, two different behaviors appear as discussed previously with tension
results. At 0.5 wt.% content, a total improvement of 56% is achieved strictly from J-

33
integral energy. At 1.0 wt.%, the results show that the total fracture energy is reduced
by 31%. This reduction is greatly affected by the critical energy release rate rather than
J-integral. At 1.5 wt.% content, similar reduction in critical energy release rate is
observed but with rather significant improvements in the J-integral values resulting in a
total increase in total fracture energy of 52%. At 2.0 wt.% content, the reduction in critical
energy release rate is diminished while maintaining significant improvements in J-
integral netting a 47% increase in total fracture energy. Therefore, P-MWCNTs improve
the fracture toughness of PC at 0.5, 1.5 and 2.0 wt.% with 47% to 56% while at 1.0 wt.%
decrease the fracture toughness with -31%. COOH-MWCNTs on the other hand follow
mostly a consistent pattern between their content and their impact on fracture toughness
up to 1.5 wt.%. The increase in total fracture energy decrease from 112% at 0.5 wt.% to
64% at 1.5 wt.%. at 2.0 wt.% content the total fracture energy increase again by 81%.
The increase in fracture toughness due to J-integral remains between 110% and 140%
for all mixes including 2.0 wt.%. On the other hand, the increase in critical energy release
rate decrease with increasing the content. In fact, at 1.5 and 2.0 wt.% content the critical
energy release rate decreases by 20% and 34% respectively. Nonetheless, COOH-
MWCNTs prove more effective in improving the fracture toughness of PC than P-
MWCNTs by achieving a maximum improvement of 112% at 0.5 wt.% COOH-MWCNTs
content compared to 56% at similar P-MWCNTs content.
Both types of MWCNTs overall showed a decreased efficiency in improving the fracture
toughness of PC with increasing their content. In fact, for both types of nanoparticles the
highest improvement was reported at 0.5 wt.% content. ANPs on the other hand
provided improved total fracture energy with increasing their content. The improvements
continue from 45% in total fracture energy at 0.5 wt.% content up to 128% at 3.0 wt.%
content. However, the mechanisms in which these improvements are achieved differ
greatly. From 0.5 wt.% content up to 2.0 wt.%, the fracture energy from J-integral
increase from 54% to 171% while the elastic energy drops down from 29% at 0.5 wt.%
content to -14% at 2.0 wt.%. At 3.0 wt.% content however, the J-integral fracture energy
increase is less effective as it drops from 171% at 2.0 wt.% to 113%. The elastic fracture
energy however increases dramatically reaching an improvement of 155%.
Because of their extreme small dimensions, nanoparticles provide significantly large
area at very low contents. By increasing their content, their polymer interactive abilities
and mechanism differ greatly. Such abilities can be separated into chemical and
mechanical in which they manipulate mechanical properties. In order to evaluate the
overall effect of incorporating nanoparticles on improving the fracture toughness, the
difference in these mechanisms can be ignored and their effectiveness can be evaluated
with an overall total fracture energy parameter. With such parameter, it can be
concluded that ANPs and COOH-MWCNTs both were able to provide a significant 128%
and 112% increase in total fracture energy. Those improvements however were
observed at the maximum content examined for ANPs of 3.0 wt.% content and the
minimum COOH-MWCNTs content of 0.5 wt.%. P-MWCNTs still provided good
improvements of 56% at 0.5 wt.% content as well. On the other hand, all nanoparticles

34
at all contents (with the exception of 1.0 wt.% content of P-MWCNTs) provided
improvements in J-integral fracture energy. It can be assumed that J-integral fracture
energy is generated by the nanoparticles mechanical properties. Thus, a general trend
of either an increase in J-integral energy with the increase in content or a steady
increase can be observed with between 0.5 wt.% and 1.5 wt.% for P-MWCNTs and
COOH-MWCNTs and 0.5 and 2.0 wt.% for ANP. Increasing the content beyond these
limits however result in a decrease from their previous maximum. This decrease can be
correlated to a noticeable drop in flowability. Those changes are caused by the
increased difficulty in obtaining dispersion which results in reduced viscosity and
flowability. Chemical changes are described further using microstructural analysis and
FTIR results.
Figure 31: The critical stress intensity factor per QBFM analysis
Figure 32: The critical energy release rate per QBFM analysis

35
Figure 33: The critical J-integral values per QBFM analysis
Figure 34: The critical total fracture energy per QBFM analysis
Finite element modeling of PC overlays with steel substrate
Finite element analysis was proposed to be developed to similar the behavior of PC
overlay under flexural loading. In which, a representative volume element model to
similar the behavior of PC under flexural stress and to also predict the change in PC
electrical conductivity as a result of microcrack development. A snapshot from some
preliminary finite element modeling by the PI of PC-steel deck overlay is shown in Figure
36
35. The finite element model developed in an ANSYS/ABAQUS environment and
individual materials can be classified and the interface between layers can be described
using interface elements. Results of flexural testing provided promising results and great
improvements due to incorporating nanoparticles. Therefore, this section’s focus was
shifted towards only finite element modeling of the bond strength of PC with steel
substrate which requires further investigation. Bond strength of PC to steel substrate is
most suitably examined through slant shear testing. In those tests, PC is placed on top
of a steel substrate sandblasted to a minimum of 4.0 mil (0.1016 mm) clean. The steel
surface is inclined at 60° with the horizontal as shown in figure 36. Experimental tests
were performed in order to evaluate the apparent shear strength as given in equation
20 as well as validate the finite element models.
𝜏 =𝑃 sin (60)
𝐴 /𝑐𝑜𝑠(60)=
𝑃
𝐴sin(60) 𝑐𝑜𝑠(60) (20)
Where P is vertical applied load and A is the cross-sectional area of the cylinder.
Figure 35: Preliminary finite element model of orthotropic bridge deck with PC overlay showing example model to be developed to determine the stress state in PC overlay.

37
Figure 36: Slant shear test schematics and an actual specimen showing both substrates.
Finite element analysis of the slant shear test configuration was conducted using
ABAQUS modeling software. PC was defined as a nonlinear elastic-plastic material
using the constitutive stress-strain response measured in the uniaxial compression
tests. The steel was assumed to be elastic perfectly plastic material. Convergence
studies used two different types of built-in elements: 8-node linear hexagonal and 6-
node linear triangular. These element types are capable of producing computationally
inexpensive solutions for stress calculations. For each element type, different mesh
sizes were used varying from 9,480 elements to 74,524 elements. Boundary conditions
fixed the steel part from the bottom and prevented lateral deformation of the assembly.
Figure 37 (a) shows the boundary conditions as applied on the model. Figure 37 (c)
shows the meshed model using 6-node linear triangular elements. Displacement was
applied to the top of PC to simulate slant shear tests. Load-displacement curves were
extracted from the simulations and compared to those observed in the slant shear tests.

38
Figure 37: FE model using ABAQUS simulation environment: (a) Boundary conditions (b) Bilinear shear stress-slip relation where Kt is shear contact stiffness, GII is mode II
fracture energy and τu is maximum shear stress (c) Meshed model using 74,524 elements.
In order to define contact between PC and steel, a zero-thickness cohesive
contact element was defined. Bilinear shear stress-slippage relationship was used to
describe the contact element as shown in Figure 37 (b) [67, 68]. This relationship is
based on pure in-plane shear fracture mode (mode II) and is defined in ABAQUS using
damage and cohesive behavior interaction [69]. The cohesive element characterizes the
initial slope of the stress-slip curve (Kt) which is governed by the interfacial stiffness
between the two slant shear test parts. The damage element on the other hand is
prescribed using three components; initiation, evolution and stabilization. Firstly,
damage initiation represents that maximum nominal stress in shear fracture mode (τu)
characterized by the peak of the stress-slip curve. Secondly, damage evolution in this
model was used based on the critical energy release rate in mode II (GII) which denotes
the area under the stress-slip curve. Finally, damage stabilization represents the energy
dissipation module and is governed by the viscosity coefficient (V). In general, lower
values of V signify rapid energy release and since failure in slant shear test is sudden,
a constant low value of 0.001 was selected for all models. The values of τu, GII, V and
Kt were determined through experimental validation of the FE simulation and back-
solving for those parameters [70]. This was performed using a trial and error for-loop
were the values of the cohesive and damage model were estimated and the resultant
load-displacement curve of the simulation was matched with the experimental. Our
objective is to use the validated FE model to realize the local shear stresses developed
at failure of the slant shear test. Table 3 summarizes the contact interaction properties.
Figure 38 shows load-displacement curves for both FE model and slant shear test for
the selected mixes namely PC-Neat, PCNC-0.5, PCNA-0.5, PCNA-2.0.

39
(a) (b)
(c) (d) Figure 38: Load-displacement curves of PC with different nanomaterials as measured experimentally during slant shear test and extracted using the finite element method for
(a) PC-Neat, (b) PCNC-0.5, (c) PCNA-0.5, (d) PCNA-2.0.
Apparent shear/bond strength results of slant shear tests of PCN and steel are shown
in Figure 39. All test specimens failed at the adhesion interface and no cohesive failure
was observed as shown in Figure 40. As explained later interpreting the results of FEA,
the samples failed when the fracture energy criteria GII was reached. Hence, sudden
failure was observed in the mechanical testing of slant shear where as FEA explored
the critical location over the shear interface where the fracture criteria was satisfied.
PCNs showed a significant increase in apparent bond strength compared with neat PC.
Results of mixes incorporating COOH-MWCNTs at 0.5, 1.0 and 2.0 wt.% showed a
similar increase of 7% in apparent bond strength compared with neat PC. This result
suggests no advantage with respect to apparent bond strength by using COOH-
MWCNTs beyond 0.5 wt.%. An increase in ANPs content corresponded to increase in
apparent bond strength: apparent bond strengths of 20, 23 and 51% above neat PC with
0.5, 1.0 and 2.0 wt.% of added ANPs, respectively. This result may be attributed to the
possible chemical reactions of ANPs with -OH groups formed on sand blasted steel
surface leading to higher bond strength.

40
Figure 39: Apparent shear strength of all PC mixes (MPa)
Figure 40: Slant shear fracture surface post-failure for all PC mixes showing complete adhesion failure.

41
Finite element analysis results of shear stress are shown in Figure 41 and were also
used to examine the interfacial shear stress contours at the PC-steel interface. Figure
42 shows the load-displacement of neat PC extracted from the FE model with magnified
slippage in the assembly at vertical displacements of 0.720 mm, 0.802 mm, and 0.837
mm. At each of these points, shear contours on the interface were plotted showing the
maximum local shear stress to reach 40 MPa. Locations of maximum local shear stress
concentration on the interface are shown in Figure 42. Maximum local shear stress only
develops at the location of minimum height of PC before reaching ultimate load as
shown in Figure 42 and Figure 43 (a). As slippage occurs, the maximum local shear
stress moves along the interface. The maximum local shear stress path follows the
height of PC from minimum to maximum as shown in transition in Figure 43 from (a),
(b) and (c). Slant shear tests show that complete slippage occurs after the ultimate load
due to release of energy as a result of bond failure.
Figure 41: Shear strength for different PC incorporating nanomaterials interpreted using apparent shear strength (average stress based on slant shear standard) and maximum
local shear stress using the finite element model. The % difference shown is the difference

42
Figure 42: Load-displacement extract from finite element analysis of neat PC showing magnified slippage at 0.720mm, 0.802mm, and 0.837mm.
Figure 43: Shear contours showing locations of maximum local shear stress during slippage at vertical slip of (a) 0.720 mm (b) 0.802 mm and (c) 0.837 mm
Microstructural Analysis
Microstructural analysis consisted of Scanning electron microscope (SEM) as well as
Fourier Transform Infrared Spectroscopy (FTIR). SEM were designated to examine the
effectiveness of dispersion of all nanoparticles at different contents. The device used is
Hitachi S-5200 Nano SEM which is capable of magnification within the range of 100-2

43
million with a resolution of 1.7 nm at 1 kV and 0.5 nm at 30kV. Due to the polymeric
nature of the epoxy, charging hindered the use of high voltage measurement and all
scans were collected at 2.0 and 5.0 kV. In order to better understand the chemically
induced effects, FTIR scans were acquired for all nanoparticles at different contents.
Scans were acquired using a horizontal Attenuated Total Reflectance (ATR) and a
DiComp Crystal made of a diamond ATR with Zinc Selenide focusing element were used
to collect 4000 scans at a resolution of 4 cm-1. The samples were of 25.4 cm2 and 2 mm
thickness of similar mixes to those discussed in DMA and SEM. Analysis of scans were
performed using PerkinElmer FTIR with Universal ATR (UATR) accessory. The scans
were converted to absorbance using Kramers-Kronig equations [71].
SEM scans are collected for 0.5 and 2.0 wt.% content of P-MWCNTs and COOH-
MWCNTs as shown in figure 44 and 45 and 0.5 and 3.0 wt.% content of ANPs as shown
in figure 46. Scans of neat samples were also collected as reference for all scans as
shown in figure 47. Those scans provide both extremes of the contents examined during
mechanical testing. All previous scans show that sufficient nanoparticles dispersion is
achieved using the described dispersion technique. Scans with P-MWCNTs further
examined the networking abilities of those particles that enable electrical conductivity
described earlier in fatigue and SHM. Those networks however didn’t appear in scans
of 0.5 wt.% content and only were noticeable at 2.0 wt.% confirming percolation limit.
Those networks aid in increasing the resistivity of PC samples up to measurable levels
that can aid in quantifying mechanical damage. COOH-MWCNTs chemically interact
with polymeric chains and hence don’t develop such network as those observed with P-
MWCNTs. ANPs are similar to P-MWCNTs as they don’t interact with the polymer
matrix. However, unlike MWCNTs, ANPs are of a smaller dimension and their scans
can only show embedment of the nanoparticles into the epoxy polymer matrix.
(a)

44
(b)
Figure 44: SEM scans for hardened epoxy containing (a) 0.5 wt.% content P-MWCNTs and (b) 2.0 wt.% content P-MWCNTs.
Figure 45: SEM scans for hardened epoxy containing 0.5 wt.% COOH-MWCNTs (left) and 2.0 wt.% COOH-MWCNTs (right).

45
Figure 46: SEM scans for hardened epoxy containing (a) and (b) 0.5 wt.% ANPs and (c) and (d) 3.0 wt.% ANPs.
Figure 47: SEM scans for neat hardened epoxy.
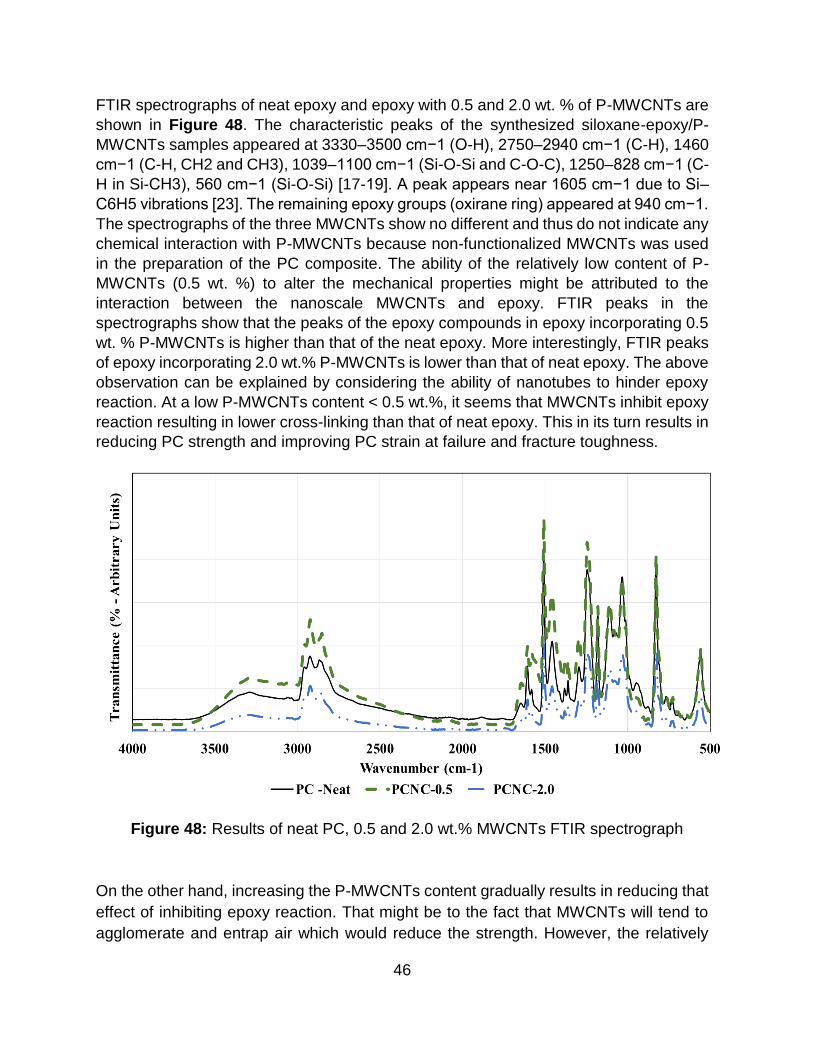
46
FTIR spectrographs of neat epoxy and epoxy with 0.5 and 2.0 wt. % of P-MWCNTs are
shown in Figure 48. The characteristic peaks of the synthesized siloxane-epoxy/P-
MWCNTs samples appeared at 3330–3500 cm−1 (O-H), 2750–2940 cm−1 (C-H), 1460
cm−1 (C-H, CH2 and CH3), 1039–1100 cm−1 (Si-O-Si and C-O-C), 1250–828 cm−1 (C-
H in Si-CH3), 560 cm−1 (Si-O-Si) [17-19]. A peak appears near 1605 cm−1 due to Si–
C6H5 vibrations [23]. The remaining epoxy groups (oxirane ring) appeared at 940 cm−1.
The spectrographs of the three MWCNTs show no different and thus do not indicate any
chemical interaction with P-MWCNTs because non-functionalized MWCNTs was used
in the preparation of the PC composite. The ability of the relatively low content of P-
MWCNTs (0.5 wt. %) to alter the mechanical properties might be attributed to the
interaction between the nanoscale MWCNTs and epoxy. FTIR peaks in the
spectrographs show that the peaks of the epoxy compounds in epoxy incorporating 0.5
wt. % P-MWCNTs is higher than that of the neat epoxy. More interestingly, FTIR peaks
of epoxy incorporating 2.0 wt.% P-MWCNTs is lower than that of neat epoxy. The above
observation can be explained by considering the ability of nanotubes to hinder epoxy
reaction. At a low P-MWCNTs content < 0.5 wt.%, it seems that MWCNTs inhibit epoxy
reaction resulting in lower cross-linking than that of neat epoxy. This in its turn results in
reducing PC strength and improving PC strain at failure and fracture toughness.
Figure 48: Results of neat PC, 0.5 and 2.0 wt.% MWCNTs FTIR spectrograph
On the other hand, increasing the P-MWCNTs content gradually results in reducing that
effect of inhibiting epoxy reaction. That might be to the fact that MWCNTs will tend to
agglomerate and entrap air which would reduce the strength. However, the relatively

47
large MWCNTs content helps in maintaining the integrity of PC and allows it to slightly
improve the strength and strain at failure. It is apparent that the significance of MWCNTs
on strength and fracture can be explained based on its chemical effect at relatively low
content< 0.5 wt.% but the explanation becomes extremely complex with many
interdependent factors at high P-MWCNTs content. Further research is warranted to
measure the cross-linking density of epoxy incorporating the different amount of
MWCNTs.
To compare the effect of functionalization of MWCNTs with carboxyl groups (COOH),
scans of samples containing 0.5 wt.% of both P-MWCNTs and COOH-MWCNTs were
examined. Figure 49 shows the respective spectrograph. With COOH-MWCNTs, a new
band appears at 1750 cm-1. This new band is attributed to the C=O stretching which is
due to the ester group being formed as a result of the esterification reaction between
the epoxy resin and the carboxylic group of the functionalized COOH0MWCNTs as
reported by Zou et al. [72] and Kim et al. [73]. This reaction, specifically at higher
MWCNTs content, will result in increasing epoxy crosslinking and thus creating a stiffer
and stronger PCNC compared with PC-Neat.
Figure 49: Results of PC-Neat and 0.5 wt.% P-MWCNTs and COOH-MWCNTs FTIR spectrograph

48
Comparing the O-H stretching bands of all epoxy-ANPs nanocomposite spectra with
that in the neat specimen shown in figure 50, it is noticed that O-H bands of epoxy-
ANPs nanocomposites show lower absorption height with broader bands than that of
the neat epoxy sample. This observation might be attributed to the effect of ANPs on
the O-H 13 association. It is well known that the broad complex band of the hydroxyl
stretching vibration region at about 3200–3600 cm−1 is attributed to the combined effect
of the differently associated hydroxyl groups, i.e. hydrogen bonding between hydroxyl
and hydroxyl/carbonyl groups of different strength and hydrogen bonding of water
molecules. In addition, a matrix having O–H groups could undergo two modes of
hydrogen bonding: inter- and intramolecular hydrogen bonds between O–H groups [74].
Overall, the O–H band broadening and intensity lowering can be attributed to
redistribution in the arrangement of the hydroxyl group association due to the different
geometry caused by the lowered cross-linked matrix. Consequently, the authors
hypothesize that incorporating ANPs in the epoxy matrix reduced 295 epoxy
crosslinking. Lowering the crosslinking bonds consequently changed the ratios of
hydrogen bonding modes, which lead to different geometry with different force constants
and consequently broadened O-H bands with lower absorption values as those
observed in Figure 50. The above microstructural analysis explains the ability of ANPs
to produce PC with appreciable strength, superior ductility and improved fracture
toughness. The ability of ANPs to reduce epoxy matrix crosslinking intensity enables
producing PC with significantly higher ductility than that observed by neat epoxy PC.
Figure 50: Results of PC-Neat and 0.5, 2.0 and 3.0 wt.% ANPs FTIR spectrograph

49
CONCLUSIONS
The above experimental investigations show that it is possible to improve the bond
strength, ductility, fracture toughness and fatigue performances of PC using
nanomaterials such as multi-walled carbon nanotubes (MWCNTs), or alumina
nanoparticles (ANPs). Incorporating P-MWCNTs resulted in small decrease in tensile
strength with a minimum appreciable tensile strength of 9 MPa. The strain at failure,
however, increased to 3.2%. COOH-MWCNTs results show a different behavior by
increasing the tensile strength up to a maximum of 15.4 MPa with a decrease in strain
at failure to 0.8%. ANPs showed similar results to that of P-MWCNTs with a minimum
of 9.5 MPa and an improved tensile strain at failure of 4.9%. Thus, incorporating
nanoparticles resulted in a maximum decrease of tensile strength by 22% countered by
a maximum improvement in strain at failure by 91%. The significant improvements
achieved were clearly reflected with improvements in PC’s toughness by a maximum of
80%, and 135% for P-MWCNTs and ANPs respectively.
P-MWCNTs were solely investigated for fatigue performance as COOH-MWCNTs bond
with the host polymer matrix and ANPs do not provide a conductive network. Fatigue
performance of P-MWCNTs PC mixes showed improvements in fatigue life up to 1240%
at 2.0 wt.% content. PC samples in all mechanical tests exhibited non-linear behavior
redeeming linear elastic fracture mechanics (LEFM) analysis, often used for concrete,
invalid. Quasi-brittle fracture mechanics (QBFM) was therefore used for the analysis of
the fracture toughness parameters of PC with nanoparticles. PC incorporating P-
MWCNTs, COOH-MWCNTs and ANPs improve the total fracture toughness by 52%,
112%, and 128% respectively. Improvements with P-MWCNTs mixes were achieved
mainly with plastic fracture toughness while ANPs and COOH-MWCNTs achieved
improvements in both elastic and plastic fracture toughness. PC with nanoparticles
provided strong bond to steel substrates with improvement in bond strength up to 51%.
Self-sensing of PC incorporating P-MWCNTs using electrical measurements is possible.
The percolation level of P-MWCNTs is achieved at such low content (about 2%) allowing
mechanical damage to be correlated to the change in electrical resistance.
SEM images of all epoxy nanocomposite reveal that uniform dispersion was achieved
using shear mixing and ultrasonication. FTIR spectrographs reveal that both P-
MWCNTs and ANPs delay the epoxy polymerization and thus reduce PC crosslinking
density thus improve ductility. On the other hand, COOH-MWCNTs react with the host
epoxy matrix forming C=O ester bonds that increase the level of crosslinking density
and improve strength.
PC incorporating nanoparticles provide a promising material that can be engineered to
provide improved mechanical enhancements in bond strength, ductility, fatigue life and
fracture toughness. PC incorporating nanoparticles can also have self-sensing
capabilities. The proposed nanomaterials can be used to improve performance and
prolonging service life of PC overlays.

50
REFERENCES
[1] ACI Committee 548, Polymers and Adhesives in Concrete, State of the Art Report, 2009.
[2] Kraus, P.D. Bridge Deck Repair Using Polymers, International Congress on Polymers in Concrete, North American Workshop, San Francisco, CA, USA, 1991.
[3] Koblischek, P.J. Polymer concrete as an alternative material for grey cast iron and steel weldments on machine tool applications, in: Proceedings of ICPIC, San Francisco, CA, USA, 1991.
[4] Abdel-Fattah, H. El-Hawary, M.M. Flexural behavior of polymer concrete, Constr. Build Mater. 13(5), (1999) 253-262.
[5] Hsu, H.T. Fowler, D.W. Creep and fatigue of polymer concrete, Polymer Concrete: Uses, Materials, and Properties, American Concrete Institute (ACI) SP-89, MI, 1985, pp. 323-341.
[6] Czarnecki, L. Chmielewska, B. The influence of coupling agent on the properties of vinylester mortar, in: Proceedings of the Second International RILEM Symposium on Adhesion between Polymers and Concrete, RILEM, Cachan, France, Sept. 1999, pp. 57-65.
[7] Heidari-Rarani, M. Aliha, M.R.M. Shokrieh, M.M. Ayatollahi, M.R. Mechanical durability of an optimized polymer concrete under various thermal cyclic loadings – an experimental study, Construction and Bldg. Mater.. 64 (2014) 308-315.
[8] Bedi, R. Chandra, R. Singh, S.P. Mechanical properties of polymer concrete, J. of Composites. Article ID 948745 (2013) 12 pages.
[9] Jo, B.-W., Park S.K, Park J.C., “Mechanical properties of polymer concrete made with recycled PET and recycled concrete aggregates”, Construction and Building Materials V. 22 (2008), 2281–2291.
[10] Shokrieh, M. M., Kefayati, A. R., Chitsazzadeh, M., “Fabrication and mechanical properties of clay/epoxy nanocomposite and its polymer concrete”, Materials and Design V. 40 (2012), 443–452.
[11] Li, Z., Wang, H., He, S., Lu, Y., and Wang, M. (2006). “Investigations on the preparation and mechanical properties of the nano-alumina reinforced cement composite.” Mater. Lett., 60(3), 356–359.
[12] Campillo, I., Guerrero, A., Dolado, J. S., Porro, A., Ibáñez, J. A., and Goñi, S. (2007). “Improvement of initial mechanical strength by nanoalumina in belite cements.” Mater. Lett., 61(8–9), 1889–1892.
[13] Hosseini, P., Hosseinpourpia, R., Pajum, A., Khodavirdi, M. M., Izadi, H., and Vaezi, A. (2014). “Effect of nano-particles and aminosilane interaction on the performances of cement-based composites: An experimental study.” Constr. Bldg. Mater., 66, 113–124.

51
[14] Soliman, E., Kandil, U. F., Reda Taha, M.M. “The Significance of Carbon Nanotubes on Styrene Butadiene Rubber (SBR) and SBR Modified Mortar”, Materials and Structures, V. 45, No. 6 (2012), 803–816.
[15] Sharmaa, R., and Iqbal, Z., “In situ observations of carbon nanotube formation using environmental transmission electron microscopy”, Applied Physics Letters, V. 84, No. 6 (2004).
[16] Ting, J. H., Lyu, J. Y., Huang, F. Y., Li, T. L., Hsu, C. L., Liu, C. W., “Synthesis of single-wall carbon nanotubes by atmospheric thermal CVD”, 17th Biennial University/Government/Industry Micro-Nano Symposium - Proceedings, UGIM (2008), 157–160.
[17] Kim, J.A., Seong, D.G., Kang, T.J., and Youn, J.R. “Effects of surface modification on rheological and mechanical properties of CNT/epoxy composites,”, Carbon, V. 44, No. 10 (2006), 1898–1905.
[18] Vaisman, L., Wagner, H.D. and Marom, G. “The role of surfactants in dispersion of carbon nanotubes”, Advanced Colloid Interface Science, V. 128 (2006), 37–46.
[19] Kao, J. H. Polymer Nanocomposites: Processing, Characterization and Applications, McGraw-Gill Nanoscience and Technology Series, (2006).
[20] Seyhan, A.T., Tanoglu, M. and Schulte, K. “Mode I and mode II fracture toughness of E-glass non-crimp fabric/carbon nanotube (CNT) modified polymer based composites”, Engineering Fracture Mechanics, V. 75, No. 18 (2008), 5151–5162.
[21] Swain, S., Sharma, R. A., Patil, S., Bhattacharya, S., Gadiyaram, S. P., and Chaudhari, L., “Effect of Allyl Modified/Silane Modified Multiwalled Carbon Nano Tubes on the Electrical Properties of Unsaturated Polyester Resin Composites”, Transactions on Electrical and Electronic Materials, V. 13, No. 6 (2012), 267–272.
[22] Geng, Y., Liu, M.Y., Li, J., Shi, X.M. and Kim, JK. “Effects of surfactant treatment on mechanical and electrical properties of CNT/epoxy nanocomposites”, Composites Part A, V. 39, No. 12 (2008), 1876–1883.
[23] Jiang, X., Drzal, L. T., “Improving electrical conductivity and mechanical properties of high density polyethylene through incorporation of paraffin wax coated exfoliated grapheme nanoplatelets and multi-wall carbon nano-tubes”, Composites: Part A, V. 42 (2011), 1840–1849.
[24] Rashad, A. M. (2013). “A synopsis about the effect of nano-Al2O3, nano-Fe2O3, nano-Fe3O4 and nano- clay on some properties of cementitious materials – A short guide for Civil Engineer.” Mater. & Design, 52, 143–157.
[25] Dorigato, A., and Pegoretti, A. (2011). “The role of alumina nanoparticles in epoxy adhesives.” J. of Nanoparticle Res. 13(6), 2429–2441.
[26] Zabihi, O., Omrani, A., and Rostami, A. A. (2012). “Thermo-oxidative degradation kinetics and mechanism of the system epoxy nanocomposite reinforced with nano-Al2O3.” J. of Thermal Anal. and Calorimetry, 108(3), 1251–1260
52
[27] Tawfik, M.E., and Eskander, S.B. (2006) Polymer Concrete from Marble Wastes and Recycled Poly (Ethylene Terephthalate). Journal of Elastomers and Plastics 38: 65-79.
[28] Jo, B.-W., Tae, G.-H., Kim, C.-H. (2007) Uniaxial creep behavior and prediction of recycled-PET polymer concrete. Construction and Building Materials 21: 1552-1559.
[29] Bignozzi, M.C., Saccani, A., and Sandrolini, F. (2000) New Polymer Mortars Containing Polymeric Wastes. Part 1: Microstructure and Mechanical Properties. Composites, Part A: Applied Science and Manufacturing 31: 97-106.
[30] Rebeiz, K.S., Serhal, S.P., and Craft, A.P. (2004) Properties of Polymer Concrete Using Fly Ash. ASCE J. of Materials in Civil Engineering 16: 15-19.
[31] Jo, B. W., Park, S. K., Kim, D. K. (2008) Mechanical properties of nano-MMT reinforced polymer composite and polymer concrete. Construction and Building Materials 22: 14-20.
[32] Shokrieh, M. M., Kefayati, A. R., Chitsazzadeh, M. (2012) Fabrication and mechanical properties of clay/epoxy nanocomposite and its polymer concrete. Materials and Design 40: 443–452.
[33] Soliman, E., Kandil, U. F., Reda Taha, M.M. (2012) “The Significance of Carbon Nanotubes on Styrene Butadiene Rubber (SBR) and SBR Modified Mortar”, Materials and Structures, 45 (6) : 803–816.
[34] Theodore, M., Hosur, M., Thomas, J., & Jeelani, S. (2011). Influence of functionalization on properties of MWCNT–epoxy nanocomposites. Materials Science & Engineering: A, 528(3).
[35] Balakrishnan, A., & Saha, M. C. (2011). Tensile fracture and thermal conductivity characterization of toughened epoxy/CNT nanocomposites. Materials Science & Engineering A, 528(3), 906-913. doi:10.1016/j.msea.2010.09.064
[36] Hameed, A., Islam, M., ahmad, I., Mahmood, N., Saeed, S., & Javed, H. (2015). Thermal and mechanical properties of carbon nanotube/epoxy nanocomposites reinforced with pristine and functionalized multiwalled carbon nanotubes. Polymer Composites, 36(10), 1891-1898. doi:10.1002/pc.23097.
[37] Patankar S.N., Mohan R., Kelkar A.D., & Vaidyanathan R. (2011). Processing and characterization of epoxy resin dispersed with multi walled carbon nanotube (MWNT) derived from camphor. Materials Science And Engineering A, 529(1), 253-256. doi:10.1016/j.msea.2011.09.025
[38] Yeh, M.-K., Hsieh, T.-H., & Tai, N.-H. (2008). Fabrication and mechanical properties of multi-walled carbon nanotubes/epoxy nanocomposites. Materials Science & Engineering A, 483-484, 289-292. doi:10.1016/j.msea.2006.09.138.
[39] Lu-Qi L., Wagner, H. D. (2007). A comparison of the mechanical strength and stiffness of MWNT-PMMA and MWNT-epoxy nanocomposites. Composite Interfaces, 14(4).
53
[40] Xiao, H., Song, G., Li, H., & Sun, L. (2015). Improved tensile properties of carbon nanotube modified epoxy and its continuous carbon fiber reinforced composites. Polymer Composites, 36(9), 1664-1668. doi:10.1002/pc.23076.
[41] Ghosh, P. K., Kumar, K., & Chaudhary, N. (2015). Influence of ultrasonic dual mixing on thermal and tensile properties of MWCNTs-epoxy composite. Composites Part B: Engineering, 77, 139-144. doi:10.1016/j.compositesb.2015.03.028.
[42] Chen, X., Wang, J., Lin, M., Zhong, W., Feng, T., Chen, X., ... Xue, F. (2008). Mechanical and thermal properties of epoxy nanocomposites reinforced with amino-functionalized multi-walled carbon nanotubes. Materials Science & Engineering A, 492(1-2), 236-242. doi:10.1016/j.msea.2008.04.044
[43] Sha, J., Li, G., Chen, X., Xia, P., Luo, R., Yang, S., ... Xie, L. (2016). Simultaneous ultrasonication-assisted internal mixing to prepare MWCNTs-filled epoxy composites with increased strength and thermal conductivity. Polymer Composites, 37(3), 870-880. doi:10.1002/pc.23245.
[44] Wang, Q., Dai, J., Li, W., Wei, Z., & Jiang, J. (2008). The effects of CNT alignment on electrical conductivity and mechanical properties of SWNT/epoxy nanocomposites. Composites Science & Technology, 68(7/8).
[45] Sumfleth, J., Prehn, K., Wichmann, M. H. G., Wedekind, S., & Schulte, K. (2010). A comparative study of the electrical and mechanical properties of epoxy nanocomposites reinforced by CVD- and arc-grown multi-wall carbon nanotubes. Composites Science And Technology, 70(1), 173-180. doi:10.1016/j.compscitech.2009.10.007
[46] Ganguli, S., Aglan, H., Dennig, P., & Irvin, G. (2006). Effect of Loading and Surface Modification of MWCNTs on the Fracture Behavior of Epoxy Nanocomposites. Journal Of Reinforced Plastics And Composites, 25(2), 175-188.
[47] Yu, N., Zhang, Z. H., & He, S. Y. (2008). Fracture toughness and fatigue life of MWCNT/epoxy composites. Materials Science & Engineering A, 494(1-2), 380-384. doi:10.1016/j.msea.2008.04.051
[48] Zhou, Y., Pervin, F., Lewis, L., & Jeelani, S. (2008). Fabrication and characterization of carbon/epoxy composites mixed with multi-walled carbon nanotubes. Materials Science & Engineering A, 475(1-2), 157-165. doi:10.1016/j.msea.2007.04.043
[49] Gómez-del Río, T., Salazar, A., Pearson, R. A., & Rodríguez, J. (2016). Fracture behaviour of epoxy nanocomposites modified with triblock copolymers and carbon nanotubes. Composites Part B, 87, 343-349. doi:10.1016/j.compositesb.2015.08.085
[50] Gojny, F. H., Wichmann, M. H. G., Kopke, U., Fiedler, B., & Schulte, K. (2004). Carbon nanotube-reinforced epoxy-composites: enhanced stiffness and fracture toughness at low nanotube content. Composites Science And Technology, 64(15), 2363-2371. doi:10.1016/j.compscitech.2004.04.002
[51] Park, S.-J., Heo, G.-Y., & Jin, F.-L. (2015). Rheological properties and fracture toughness of epoxy resin/multi-walled carbon nanotube composites. Polymer Engineering & Science, 55(11), 2676-2682. doi:10.1002/pen.24165

54
[52] White, K. L., & Sue, H. -J. (2011). Electrical conductivity and fracture behavior of epoxy/polyamide-12/multiwalled carbon nanotube composites. Polymer Engineering & Science, 51(11), 2245-2253. doi:10.1002/pen.21996
[53] Hsieh, T. H., Kinloch, A. J., Taylor, A. C., & Kinloch, I. A. (2011). The effect of carbon nanotubes on the fracture toughness and fatigue performance of a thermosetting epoxy polymer. Journal Of Materials Science: Full Set - Includes `Journal Of Materials Science Letters', 46(23), 7525-7535. doi:10.1007/s10853-011-5724-0
[54] Tang, L.-C., Wan, Y.-J., Peng, K., Pei, Y.-B., Wu, L.-B., Chen, L.-M., ... Lai, G.-Q. (2013). Fracture toughness and electrical conductivity of epoxy composites filled with carbon nanotubes and spherical particles. Composites Part A: Applied Science And Manufacturing, 45(5453), 95-101. doi:10.1016/j.compositesa.2012.09.012
[55] Zhang, Z., Tan, Y., Wang, X., Tan, H., & Li, J. (2015). Mechanical behavior and fracture toughness of epoxy composites reinforced with combination of fibrous and spherical nanofillers. Polymer Composites, 36(12), 2147-2156. doi:10.1002/pc.23125
[56] Opelt, C. V., Becker, D., Lepienski, C. M., & Coelho, L. A. F. (2015). Reinforcement and toughening mechanisms in polymer nanocomposites – Carbon nanotubes and aluminum oxide. Composites: Part B, Engineering, 75.
[57] Seyhan, A. T., Tanoglu, M., & Schulte, K. (2009). Tensile mechanical behavior and fracture toughness of MWCNT and DWCNT modified vinyl-ester/polyester hybrid nanocomposites produced by 3-roll milling. Materials Science & Engineering: A, 523(1/2).
[58] Ma, C., Liu, H.-Y., Du, X., Mach, L., Xu, F., & Mai, Y.-W. (2015). Fracture resistance, thermal and electrical properties of epoxy composites containing aligned carbon nanotubes by low magnetic field. Composites Science And Technology, 114, 126-135. doi:10.1016/j.compscitech.2015.04.007
[59] Ma, P. C., Kim, J.-K., & Tang, B. Z. (2007). Effects of silane functionalization on the properties of carbon nanotube/epoxy nanocomposites. Composites Science And Technology, 67(14), 2965-2972. doi:10.1016/j.compscitech.2007.05.006
[60] Balakrishnan, A., & Saha, M. C. (2011). Tensile fracture and thermal conductivity characterization of toughened epoxy/CNT nanocomposites. Materials Science & Engineering A, 528(3), 906-913. doi:10.1016/j.msea.2010.09.064
[61] AASHTO T321- 07 Determining the Fatigue Life of Compacted Hot-Mix Asphalt (HMA) Subjected to Repeated Flexural Bending (2007).
[62] ACI Committee 446, Report 5, “Fracture Toughness Testing of Concrete”, American Concrete Institute (2009).
[63] Guinea, G. V, Planas, J. and Elices, M., “A General Bilinear Fitting for the Softening Curve of Concrete”, Materials and Structures, V. 27, (1994), 99–105.
[64] Chapman. S. Clarification of the Notched Beam Level II Testing Procedures of ACI446 Committee Report 5. MS Thesis, University of New Mexico. December 2011.

55
[65] Reda Taha, M. M., Xiao, X., Yi, J., & Shrive, N. G. (2002). Evaluation of flexural fracture toughness for quasi-brittle structural materials using a simple test method. Canadian Journal of Civil Engineering, 29(4), 567-575. doi:10.1139/l02-044
[66] Shah, S.P., Swartz, S.E., and Ouyang, C. 1995. Fracture mechanics of concrete: applications of fracture mechanics to concrete, rock and other quasi-brittle materials. John Wiley & Sons, Inc., New York, N.Y.
[67] Meo M. and Thieulot. E. Delamination modeling in a double cantilever beam. Composite Structures 71 (2005); 429-434.
[68] Khokhar, Z. R. Ashcroft, I. A. and Silberschmidt. V. S. Interaction of matrix cracking and delamination in cross-ply laminates: Simulations with stochastic cohesive zone elements. Applied Composite Materials 18.1 (2011);3-16.
[69] ABAQUS 6.14 theory manual, ABAQUS online documentation.
[70] Abdel Wahab, M. The Mechanics of Adhesives in Composite and Metal Joints: Finite Element Analysis with ANSYS, DEStech Publications Inc., Lancaster, PA, USA, 2014
[71] Griffiths, P. de Hasseth, J.A. Fourier Transform Infrared Spectrometry, 2nd ed.; Wiley-Blackwell: Hoboken, NJ, USA, 2007.
[72] Zou, W.; Du, Z.; Liu, Y.; Yang, X.; Li, H.; Zhang, C., (2008), Functionalization of MWNTs using polyacryloyl chloride and the properties of CNT-epoxy matrix nanocomposite. Composite Science & Technology, 68 (15-16), 3259–3264.
[73] Kim, W.; Kang, S.; Ah, C.; Lee, Y.; Ha, D.; Choi, I.; Yun, W. (2004), Functionalization of shortened SWCNTs using esterification. Bull. Korean Chem. Soc., 25 (9), 1301–1302.
[74] Mikhaylova, Y., Adam, G., Häussler, L., Eichhorn, K. J., and Voit, B. (2006). “Temperature-dependent FTIR spectroscopic and thermoanalytic studies of hydrogen bonding of hydroxyl (phenolic group) terminated hyperbranched aromatic polyesters.” J. of Molecular Struct., 788(1–3), 80–88.