Improving Experienced Auditors’ Detection of Deception …wmayew/Bio/HMPV February 2017.pdf ·...
40
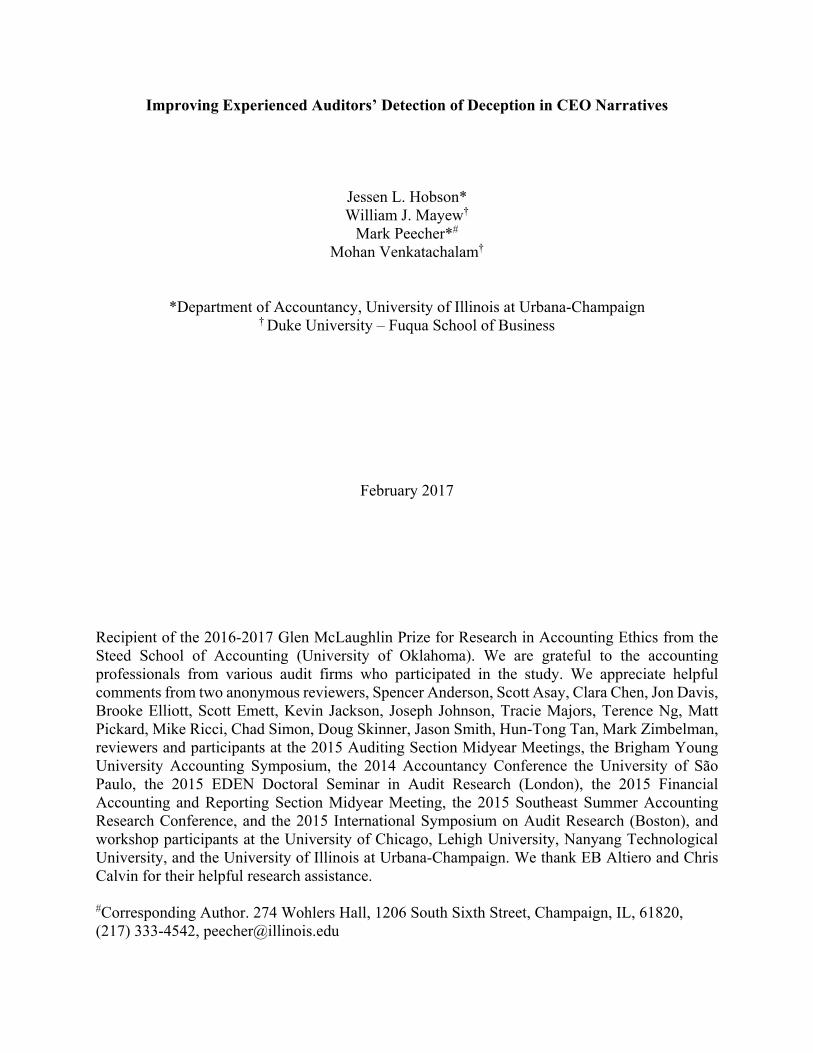
Improving Experienced Auditors’ Detection of Deception in CEO Narratives Jessen L. Hobson* William J. Mayew † Mark Peecher* # Mohan Venkatachalam † *Department of Accountancy, University of Illinois at Urbana-Champaign † Duke University – Fuqua School of Business February 2017 Recipient of the 2016-2017 Glen McLaughlin Prize for Research in Accounting Ethics from the Steed School of Accounting (University of Oklahoma). We are grateful to the accounting professionals from various audit firms who participated in the study. We appreciate helpful comments from two anonymous reviewers, Spencer Anderson, Scott Asay, Clara Chen, Jon Davis, Brooke Elliott, Scott Emett, Kevin Jackson, Joseph Johnson, Tracie Majors, Terence Ng, Matt Pickard, Mike Ricci, Chad Simon, Doug Skinner, Jason Smith, Hun-Tong Tan, Mark Zimbelman, reviewers and participants at the 2015 Auditing Section Midyear Meetings, the Brigham Young University Accounting Symposium, the 2014 Accountancy Conference the University of São Paulo, the 2015 EDEN Doctoral Seminar in Audit Research (London), the 2015 Financial Accounting and Reporting Section Midyear Meeting, the 2015 Southeast Summer Accounting Research Conference, and the 2015 International Symposium on Audit Research (Boston), and workshop participants at the University of Chicago, Lehigh University, Nanyang Technological University, and the University of Illinois at Urbana-Champaign. We thank EB Altiero and Chris Calvin for their helpful research assistance. # Corresponding Author. 274 Wohlers Hall, 1206 South Sixth Street, Champaign, IL, 61820, (217) 333-4542, [email protected]
Transcript of Improving Experienced Auditors’ Detection of Deception …wmayew/Bio/HMPV February 2017.pdf ·...
Improving Experienced Auditors’ Detection of Deception in CEO Narratives
Jessen L. Hobson*
William J. Mayew† Mark Peecher*#
Mohan Venkatachalam†
*Department of Accountancy, University of Illinois at Urbana-Champaign † Duke University – Fuqua School of Business
February 2017
Recipient of the 2016-2017 Glen McLaughlin Prize for Research in Accounting Ethics from the Steed School of Accounting (University of Oklahoma). We are grateful to the accounting professionals from various audit firms who participated in the study. We appreciate helpful comments from two anonymous reviewers, Spencer Anderson, Scott Asay, Clara Chen, Jon Davis, Brooke Elliott, Scott Emett, Kevin Jackson, Joseph Johnson, Tracie Majors, Terence Ng, Matt Pickard, Mike Ricci, Chad Simon, Doug Skinner, Jason Smith, Hun-Tong Tan, Mark Zimbelman, reviewers and participants at the 2015 Auditing Section Midyear Meetings, the Brigham Young University Accounting Symposium, the 2014 Accountancy Conference the University of São Paulo, the 2015 EDEN Doctoral Seminar in Audit Research (London), the 2015 Financial Accounting and Reporting Section Midyear Meeting, the 2015 Southeast Summer Accounting Research Conference, and the 2015 International Symposium on Audit Research (Boston), and workshop participants at the University of Chicago, Lehigh University, Nanyang Technological University, and the University of Illinois at Urbana-Champaign. We thank EB Altiero and Chris Calvin for their helpful research assistance. #Corresponding Author. 274 Wohlers Hall, 1206 South Sixth Street, Champaign, IL, 61820, (217) 333-4542, [email protected]
Improving Experienced Auditors’ Detection of Deception in CEO Narratives
Audit firms, audit standard setters, regulators, and investors have expressed a desire to better understand and identify new ways to enhance auditors’ deception detection capability. Using CEO narratives from conference calls, we predict and find experimental evidence that experienced auditors’ deception judgments are less accurate for fraud companies than for non-fraud companies unless they are first instructed that negative affect is a deception cue. To better understand this instruction-driven improvement in accuracy, we ask auditors to identify and describe perceived red flags in the narratives. We find that when instructed, auditors provide more extensive red flag descriptions for fraud companies. We also ask auditors to mark specific locations in the narratives that they believe pertain to fraud. Instructed auditors are more accurate at identifying specific sentences related to underlying frauds, suggesting an ability to conduct follow-on audit procedures to address specific concerns. Because poor performance at detecting fraud-related deception can threaten audit effectiveness and, in turn, impair judgments made by financial statement users, it is promising that a simple instruction to attend to negative affect improves experienced auditors’ accuracy in detecting deception in earnings calls, at both the company and sentence level.
1
Improving Experienced Auditors’ Detection of Deception in CEO Narratives
1. Introduction
Despite their responsibility to provide reasonable assurance that financial statements are
not materially misstated due to error or fraud (AS Nos. 8-15, PCAOB [2010]; AS No. 16, PCAOB
[2012]), auditors are seldom the first party to detect fraud when it exists (Dyck et al. [2010]). It is
therefore unsurprising that auditors, audit standard setters, regulators and investors have expressed
a desire to better understand and find new ways to enhance auditors’ ability to detect deception
associated with accounting fraud (Christensen et al. [2016], PCAOB [2013], CAQ [2010], Hogan
et al. [2008], PCAOB [2007]). In this study, we capitalize on rare access to auditors with extensive
experience, equaling 24 years on average, to examine their capability to detect deception from
CEO narratives. These narratives are from question and answer (Q&A) portions of public
companies’ earnings conference calls, which the PCAOB recommends auditors review when
assessing the risk of material misstatement (AS No. 12, PCAOB [2010]).
How experienced auditors fare in diagnosing deception from conference call narratives
using their own professional judgment is unknown and difficult to infer from other literatures. The
vast psychology literature on deception detection, including studies that use experts in other
domains, provides reasons to be pessimistic about experienced auditors’ ability to reach accurate
deception conclusions. Studies using experienced police officers and judges only rarely attain
above-chance or above-novice performance in detecting deception (Bond and DePaulo [2006],
Bond and DePaulo [2008], Vrij et al. [2006]). However, unlike police officers, who interact with
a suspect only during a given investigation, auditors repeatedly interact with their clients during
2
the annual audit. Moreover, police officers are not paid by the criminal suspects they investigate,
whereas clients pay their auditors.
Based on theory and findings from prior psychology and auditing research, we predict that
auditors experientially learn to avoid false positives about fraud rather than to acquire and evaluate
evidence objectively to reach accurate deception judgments (Friedrich [1993]). Indeed, a stream
of studies suggest that auditors face disincentives to exercise skepticism to detect fraud. For
example, audit supervisors penalize subordinates who act on their skeptical beliefs (Brazel et al.
[2016]). Further, even after being prompted to assess the quality of management’s accounting
objectively, auditors use motivated reasoning that favors allowing aggressive accounting methods
(e.g., Bazerman et al. [1997], Kadous et al. [2003]). In addition, auditors collect less evidence to
avoid unpleasant interactions with management (Nelson [2009]; Bennett and Hatfield [2013]), and
they become increasingly reluctant skeptics with greater experience (Shaub and Lawrence [1999]).
Collectively, these studies suggest experienced auditors are more attuned to the benefits of
minimizing false positives as compared to false negatives (Peecher et al. [2013]), implying they
will be more accurate at identifying non-fraud companies than fraud companies.
We predict, however, that providing a negative affect instruction to experienced auditors
will enable them to more accurately detect deception in fraud companies. This instruction prompts
consideration of the degree to which CEO narratives contain cognitive dissonance, a negative
feeling that commonly accompanies deception. It also helps neutralize experienced auditors’
tendency to overlook or discount fraud cues, enabling them to apply audit-related knowledge that
they have acquired over many years to better avoid false negatives.
We test our predictions by gathering 124 judgments from thirty-one experienced auditors
spanning multiple accounting firms. Each auditor provides deception judgments for four excerpted
3
CEO responses to analyst questions during quarterly conference calls. The four excerpts are
randomly drawn from a population of five fraud and five non-fraud public companies,
manipulating within subjects whether an evaluated company is fraudulent. Excerpts are classified
as fraudulent if the company’s quarterly financial statements discussed during the conference call
were later restated and linked to fraud, regulator investigation, or class-action litigation. Next, we
manipulate the supply of the negative affect instruction. After reviewing CEO answers to analyst
questions, auditors decide whether the financial results being discussed are fraudulent. This
company-level decision is our primary dependent measure.
As predicted, while all auditors’ accuracy rates are high (exceed 50 percent) when judging
non-fraud companies, only instructed auditors accurately judge fraud companies. The only
experimental condition in which experienced auditors’ accuracy rate fails to exceed 50 percent is
when judging fraud companies without instruction. To better understand the instruction driven
improvement in accuracy, we asked all auditors to describe “red flags” in the CEO narratives in
support of their company-level deception judgments. We find that, when instructed, auditors
provide more extensive descriptions of perceived red flags for fraud companies relative to non-
fraud companies, consistent with the instruction enabling more extensive application of audit-
related knowledge.
We also asked auditors to note specific locations in the CEO’s narratives where they
believe red flags exist. We then coded each narrative sentence as either containing a perceived red
flag or not, and also coded whether that sentence topically pertained to the eventually revealed
fraud. This coding enables an analysis of accuracy judgments at the sentence level of the narrative.
We find the negative affect instruction improves the accuracy of auditors’ deception judgments at
the sentence level for fraud companies. This implies that the benefits of a negative affect
4
instruction are not limited to a vague sense that something is amiss at a company, but also extend
to specific content in sentences spoken by CEOs. The ability to pinpoint worrisome portions of
CEO narratives holds promise for auditors’ ability to tailor audit procedures to test specific
accounts and transactions in need of investigation (Hammersley et al. [2011]; Simon [2012]).
Our findings set the stage for future work that investigates how company type (fraud vs.
non-fraud) and interventions such as a negative affect instruction (absent vs. present) jointly affect
the accuracy of deception judgments made by auditors who have less experience (e.g., audit staff,
seniors, managers) or by auditors or other professionals who have specialized training or economic
interests to detect fraud (e.g., forensic auditors, buy-side analysts, etc.). Theory suggests that one
should consider how attuned these different potential participants are to avoiding false positives
versus false negatives as well as their likely capability to detect negative affect when instructed to
do so. Along these lines, a negative affect instruction may not be as effective for less experienced
professionals since the capacity to detect emotion is lower in young adults than in middle-aged
adults, at least in the general population (Hartshorne and Germine 2015).
Future work also could investigate a broader spectrum of narratives, such as those in
shareholder meetings, road show presentations, and, if accessible, client-auditor interactions.
Additionally, research has found that automated methods can detect deception in large samples of
conference calls (Hobson et al. [2012]; Larcker and Zakolyukina [2012]). Such research, however,
has neither developed theory nor explored the degree to which experienced auditors or other
professionals would benefit from or improve upon machine-based analyses. Our research provides
a helpful first step by examining how well (poorly) instructed (uninstructed) experienced auditors
perform at deception detection when unaided by such technology.
5
2. Related Research and Hypotheses
2.1 AUDITORS, INCENTIVES AND FRAUD DETECTION 2.1.1 Existing Evidence on Auditor Fraud Detection. A vast literature in social psychology
reveals that individuals in general fail to exceed chance levels when attempting to detect deception.
Further, experienced professionals’ deception judgments are only rarely better than those of
inexperienced professionals or laypersons (Bond and DePaulo [2006], Bond and DePaulo [2008],
Vrij [2008]). Financial-statement auditors are a unique class of professionals charged with
providing reasonable assurance that financial statements are not materially misstated due to fraud.
However, prior work examining experienced auditors’ capability to detect deception in general is
sparse, and for narratives, is essentially nonexistent (Ariail et al. [2010]). In non-narrative settings,
two studies find that less than half of audit partners detect seeded fraud in case materials (Jamal et
al. [1995], Johnson et al. [2001]). Other research provides indirect evidence that experienced
auditors can detect financial fraud at levels surpassing inexperienced auditors. For example, Brazel
et al. [2010] show greater success in fraud brainstorming sessions when audit partners lead the
session versus lower level staff. Knapp and Knapp [2001] show a positive effect for audit
experience on the effectiveness of analytical procedures in detecting seeded fraud.
Auditor interviews of management during field work and resulting narratives are critical
inputs into the audit process (AS No. 12, 13, 15 PCAOB [2010]), but are impossible to study
because they are private. Prior literature has dealt with this limitation by simulating audit
interviews (Lee and Welker [2007, 2008]; Lee et al. [2013]).1 We deal with this limitation by
1 Lee and Welker [2007, 2008] and Lee et al. [2013] provide the only known studies of auditor deception detection from interviews using researcher-created interviews where male MBA students role-play an audit client. Lee and Welker [2007] find that upper-level accountants had poor detection accuracy for deception and that training did not improve their detection accuracy. Lee and Welker [2008] find that inexperienced and experienced auditors attend to different cues, but both groups fail to achieve deception detection accuracy at greater than chance levels.
6
studying management narratives that occur during the publicly broadcast Q&A portions of
earnings conference calls. These management narratives occur in response to financial analyst
questions, and Auditing Standard No. 12 recommends that auditors observe the earnings
conference call to understand risk factors that might cause material misstatement (PCAOB
[2010]).2 Such a recommendation is consistent with recent archival evidence suggesting Q&A
dialogues between analysts and management provide information about the company (Blau et al.
[2015], Hollander et al. [2010], Matsumoto et al. [2011], Mayew and Venkatachalam [2012], Price
et al. [2012]), including cues that can assist in the detection of financial statement fraud (Larcker
and Zakolyukina [2012]; Hobson et al. [2012]).
2.1.2 Auditor Incentives of Skepticism for Fraud. Shaub and Lawrence [1999] theorize and
provide evidence that auditors become more reluctant skeptics with experience. This occurs
because, over time, auditors experientially learn that there are few rewards and numerous costs to
undertaking skeptical actions. Peecher et al. [2013] highlight that while auditors can be penalized
for failing to find fraud they are not rewarded for work to detect and prevent fraud, nor are there
any public regulatory rewards for performing audits of particularly high quality. Auditors who
blow the whistle for fraud on their own client not only lose that client 50 percent of the time (Doty
[2014], Dyck et al. [2010]), but, perhaps ironically, are also specifically excluded from the set of
persons eligible for monetary rewards from the whistleblowing provisions of the Dodd-Frank Wall
Street Reform and Consumer Protection Act. While there are few salient rewards for skepticism,
the costs of investigating a potential fraud are immediate and loom large. Auditors are motivated
to meet their budgets despite a decreasing trend in audit fees (Audit Analytics Staff [2014], Doty
2 Our discussions with experienced practitioners from several audit firms anecdotally indicate that experienced audit team members commonly read or listen to earnings conference calls to gather evidence about risks. However, there are generally no formal audit procedures about conference calls in their audit.
7
[2014]). Prior research finds that fee pressure and budget issues are key motivators for audit teams
(Willett and Page [1996], Kelley and Margheim [1999]) that decrease audit quality (e.g., Houston
[1999], Asare et al. [2000], Ettredge et al. [2014]) and, potentially, fraud detection (Braun [2000]).
Moreover, expressed suspicion of fraud requires additional audit procedures, potentially causing
tension and budget overruns. Recent experimental evidence suggests that auditors who skeptically
investigate fraud risks receive lower performance evaluations (Brazel et al. 2016).
We posit that, over time, these incentives and experiences have profound psychological
learning effects. Two related theoretical accounts describe the psychological processes auditors
likely learn to employ. First, auditors learn to follow a primary error detection and minimization
(PEDMIN) testing strategy (Friedrich [1993]). Thus, rather than learning to render accurate
deception judgments, auditors learn habitually to minimize false positives, i.e., mislabeling a clean
company as fraudulent. This becomes experienced auditors’ primary concern since errors from
making a “fraud exists” judgment are personally and saliently costly (Shaub and Lawrence
[1999]). Over time, auditors learn to overlook or explain away “red flag” indicators of fraud, since
taking them at face value would increase the likelihood of making a costly false positive error.
Second, much of the learning by auditors to avoid false positives about fraud likely operates
at the subconscious level through motivated reasoning. As Moore et al. [2010, p. 46] point out,
biased information processing arising from a conflict of interest is “typically unconscious and
unintentional—i.e., seldom a matter of deliberate intentional choice.” Motivated reasoning theory
holds that once decision makers have preferred outcomes, they subconsciously pursue directional
goals that trigger criticism of contrary evidence but ready acceptance of supportive evidence
(Kunda [1990]; Ditto and Lopez [1992]). Auditors’ use of motivated reasoning (Nelson [2009];
Lee et al [2013]), impairs their objectivity in assessing the quality of management’s aggressive
8
accounting treatments (Kadous et al. [2003]) and reduces their propensity to speak up about
potential problems (Clor-Proell and Nelson [2007]).
2.2 NEGATIVE AFFECT INSTRUCTION TO IMPROVE FRAUD DETECTION
To remedy auditors’ overlooking or explaining away fraud cues, we consider a key tenet
of motivated reasoning theory. This theory holds that decision makers subconsciously pursue
directional goals, but only if they can maintain their “illusion of objectivity” (Pyszczynski and
Greenberg [1987], Kunda [1990], Kadous et al. [2003], p. 762). Thus, we derive an instruction that
makes it unreasonable for experienced auditors to overlook or easily explain away fraud cues that
they are likely otherwise capable of perceiving. Our instruction informs auditors that deceivers
often experience negative affect from cognitive dissonance. We choose this particular instruction
for three reasons. First, deception frequently leads to negative affect (Ekman [1985], DePaulo et
al. [2003], Harmon-Jones [2000]). Second, research shows that in the sample narratives we utilize,
dissonance markers in the speech of the CEOs are present and associated with financial
misreporting (Hobson et al. [2012]). Third, psychology research indicates that peak performance
for the perception of affective states occurs between the ages of 40 and 60 (Hartshorne and
Germine [2015]), which is the age range of experienced auditors.
In sum, we predict that instructing auditors to attend to management’s negative affect will
shatter motivated reasoning’s “illusion of objectivity” that otherwise subconsciously causes
auditors to overlook or explain away fraud cues in CEO narratives of fraud companies. This
instruction thereby enables experienced auditors to more extensively tap into their accumulated
audit knowledge in ways that facilitates better deception detection in fraud companies. By
contrast, this instruction should result in little, if any, improvement in experienced auditors’
deception judgments for non-fraud companies. If the negative affect instruction causes auditors to
9
more objectively evaluate red flag fraud cues, the accuracy rate among instructed auditors judging
fraud companies will approach the accuracy rates of both instructed and uninstructed auditors
judging non-fraud companies. We formalize this prediction as follows:
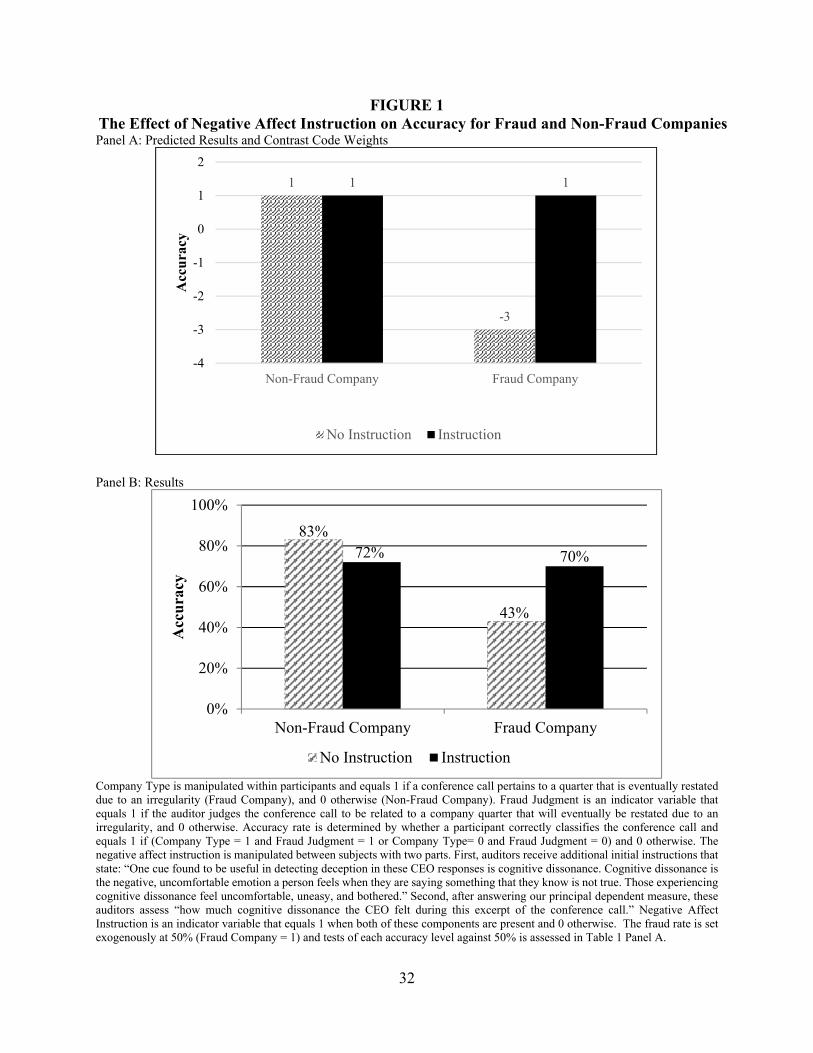
H1A: Company type and negative affect instruction jointly influence experienced auditors’ deception detection accuracy in the form of an ordinal interaction in which they are least accurate on fraud companies when provided with no instruction and most accurate in the other three experimental conditions (see Panel A of Figure 1).
As is frequently the case with ordinal interactions (Dawes [1988]), two simple main effects are
central to H1A, as follows:
H1B: When experienced auditors do not receive the negative affect instruction, they are more accurate for non-fraud companies than for fraud companies.
H1C: When evaluating fraud companies, experienced auditors are more accurate if they
receive the negative affect instruction than if they do not receive the instruction. 3. Method
3.1 PARTICIPANTS
We gather 124 observations from thirty-one current or retired audit professionals at
multiple large public accounting firms with an average of 24 years in the audit, assurance, and/or
fraud/forensic services. Eighty-eight observations are from current or retired partners or directors,
twelve are from managers or senior managers, eight are from seniors, and sixteen are from staff.3
All but three participants are CPAs. Participants spend approximately two hours on the task. We
examine a participant pool with a high level of experience since expertise often takes very
extensive, deliberate, and practical experience (Ericsson et al. [1993]). Further, participants with
this level of audit experience have the necessary experience processing CEO and CFO narratives.
3 Though we requested responses from auditors at only the partner level, we used all responses received, whether from partners, staff, etc. Inferences for our hypotheses tests do not change if we exclude all staff, all staff and seniors, and any participant that identifies themselves as a forensic specialist.
10
3.2 SPEECH CORPUS SELECTION
Each auditor provides deception judgments on excerpts from the question and answer
portion of a quarterly earnings conference call for four public companies. Due to time constraints
and our desire to solicit participants with substantial experience as auditors, we ask participants to
evaluate only four companies. We randomly draw four companies from a population of ten—five
companies with deceptive discussions and five without.4 Auditors are informed of this fraud rate,
which follows the vast majority of deception detection experiments in the literature (Levine et al.
[2014]).5 The ten company quarters are a subset of the 1,572 company-quarter earnings conference
calls studied in Hobson et al. [2012], which originally were broadcast during calendar year 2007.
Each of the ten conference call narrative excerpts are the first five minutes of analyst questions to
male CEOs, and CEO’s responses to those questions. Following Hobson et al. [2012] we
characterize narratives as deceptive if the company’s financial statements being discussed in the
call were restated and any of the following “irregularity conditions” hold: the restatement was
deemed fraudulent, a regulatory investigation followed the restatement, or a class action lawsuit
followed it. We assume that CEOs of fraudulent companies have knowledge of the fraud, and in
turn consciously or unconsciously express negative affect in some area of the narrative excerpt
4 The allocation of four companies to each participant is random with the stipulation that auditors have an 80 percent chance of evaluating two fraud companies and two non-fraud companies, a nine percent chance of one fraud and three non-frauds, a nine percent chance of one non-fraud and three frauds, a one percent chance of all frauds, and a one percent chance of no fraud companies. Additionally, adjustments were made to minimize any one company being evaluated more frequently than another and to ensure that one company was not frequently presented in any specific order position (e.g., always first). 5 We use this fraud rate and multiple observations per auditor for two additional reasons. First, we use a high-risk population of companies because this is our population of interest. A natural-world equivalent is a client acceptance decision for a pool of risky potential clients. Second, we maximize value from the scarce resource of audit partners. A more realistic underlying fraud rate would dramatically increase the number of participants needed to draw reliable inferences for fraud companies. We statistically hold ex ante fraud risk constant by matching companies on F-Score (Dechow et al. [2011]). Also, see section 4.4 for a discussion of our selected fraud rate. Our inferences do not change when we use just the first two observations from each participant.
11
(e.g., via lying, stretching the truth, etc.); however, we cannot be certain of the extent to which the
CEO is aware of the fraud.
We create the population of ten calls using two selection criteria. First, we require that
fraudulent companies do not systematically differ from non-fraud companies on known financial
statement predictors of fraud. To do so, we calculate a financial statement based fraud score or
“F-Score” (Dechow et al. [2011]) for all 1,572 observations in Hobson et al. [2012]. We then sort
all observations by F-Score and, for each fraud observation, select the observation from the same
two-digit industry with the closest F-Score, without replacement. If no industry match is available
within ten observations in either direction, we use one digit SIC code, and if that fails, we take the
closest F-Score without matching on industry. All ten companies are of “above normal” and
“substantial” risk based upon their F-scores, averaging 1.67 for the five fraud companies and 1.94
for the five non-fraud companies (Dechow et al. [2011]). Second, we require the call narratives to
come from companies that are not generally known to be fraudulent, by dropping fraudulent
observations and their related pair based on survey responses from accounting doctoral students
indicating familiarity the company’s fraud. Among remaining companies, we choose eight with
the widest absolute difference in vocal cognitive dissonance as measured in Hobson et al. [2012],
such that fraud companies have higher levels of cognitive dissonance, and two “cross-over”
companies that have low (high) dissonance relative to our other eight companies despite (not)
being fraudulent.6
3.3 SPEECH CORPUS PREPARATION
We manually transcribe each conference call excerpt rather than rely on commercial
6 Inferences from our hypotheses tests do not change when we include the Hobson et al. [2012] measure of cognitive dissonance as a covariate in our analyses.
12
transcription as used in prior literature (Larcker and Zakolyukina [2012]).7 Additionally, while
Hobson et al. [2012] isolate only the voice of the CEO in the conference call, thereby purging any
context from the CEO-analyst exchange, we include the analyst’s question(s) to which the CEO is
responding.8 A generic, computerized male or female voice (based on the gender of the analyst)
reads the analysts’ questions. We use Q&A excerpts instead of the full Q&A session given
practical limits on auditor time.
3.4 PROCEDURE & VARIABLES
We manipulate company type (fraudulent or not) and the presence or absence of the
negative affect instruction. The negative affect instruction (whether or not auditors are instructed
to consider management’s negative affect) has three parts. First, initial instructions for all
participants preceding each company evaluation states “Note: Research indicates that certain cues
in what a CEO says and how s/he says it can help in the detection of deception.” Second, half of
our participants randomly receive the following:
One cue found to be useful in detecting deception in these CEO responses is cognitive dissonance. Cognitive dissonance is the negative, uncomfortable emotion a person feels when they are saying something that they know is not true. Those experiencing cognitive dissonance feel uncomfortable, uneasy, and bothered. Third, after answering our principal dependent measure, participants instructed about
negative affect assess “how much cognitive dissonance the CEO felt during this excerpt of the
conference call.” Overall, then, this instruction defines cognitive dissonance, links cognitive
dissonance and negative affect to deception, and encourages auditors to consider negative affect
7 Manual transcription ensures auditors receive the speech as originally communicated to the financial market, given that commercial transcripts are purged of speech disfluencies (e.g., ah’s, um’s, etc.). We reinsert these disfluencies to be consistent with practice in the deception detection literature; however, there is no statistical difference in number of disfluencies (deflated by characters per sentence) between fraud and non-fraud companies. 8 For seven (three) of the ten conference call narratives, CEO responses are (not) interspersed with responses from other C-suite executives and/or analyst questions addressed and answered by other C-suite executives. Accuracy of instructed and uninstructed auditors is similar between the seven companies and the full sample. Inferences from our hypotheses are identical (though statistically weaker) when we examine just the seven companies.
13
in the conference call. Importantly, the instruction does not indicate any specific speech markers
that can identify dissonance, instruct auditors on how to identify dissonance from CEO narratives,
or provide additional information about the company under scrutiny. We also manipulate
conference call medium at two levels because conference calls are publicly available as both
transcripts and audio files. Some auditors receive the conference call excerpt only as a transcript
while others receive the transcript and accompanying audio. We include the transcript in both
conditions because transcripts often are available long after audio feeds have been removed from
company web sites and because audit firms may evaluate earnings calls after feeds have been
removed.
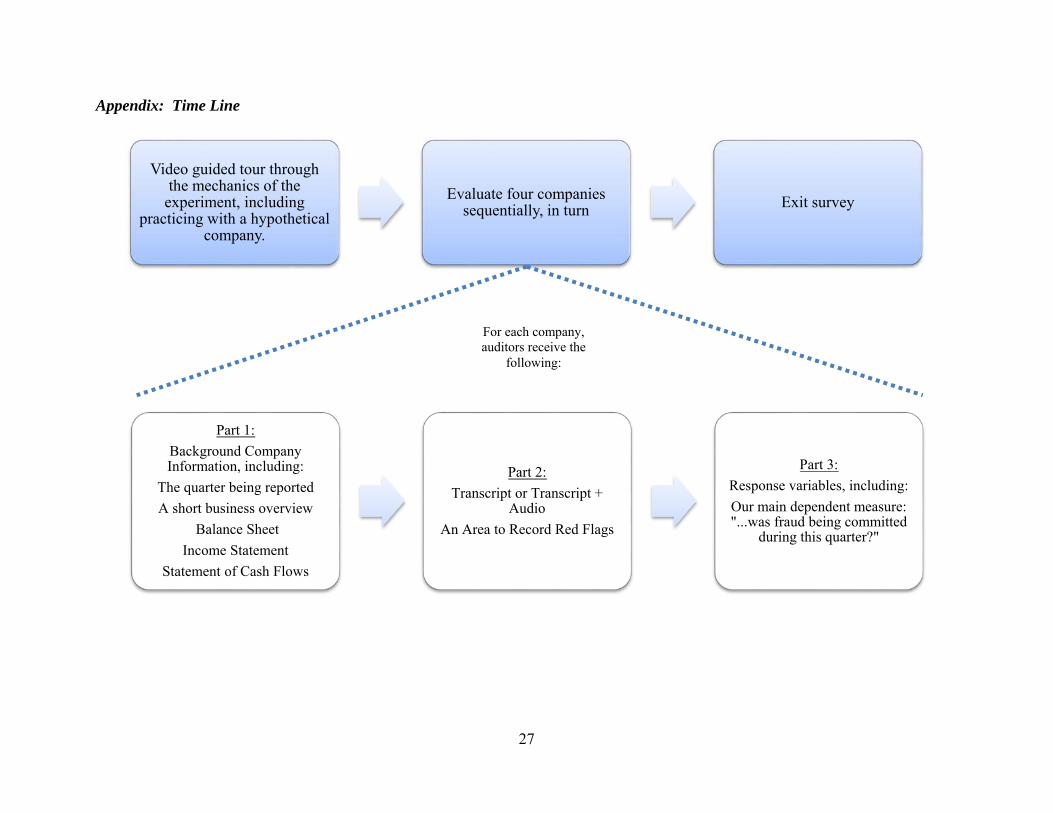
The Appendix provides a timeline of the experiment. The study took about 2 hours to
complete. First, auditors view a brief orientation video that instructs them to complete the
experiment in one sitting without accessing outside information. Next, auditors complete a guided
tour and practice evaluating a fictional company. Written instructions and three narrated videos
aid in this process. For example, we tell auditors that their task is to use the CEO responses to (1)
determine whether they think the results discussed are fraudulent and to (2) identify potential red
flags in the audit of the company. We provide time and encouragement for auditors to practice the
experimental tasks during this example.
The auditors’ evaluation of the example and each of the four real companies consist of
three parts. Part 1 contains background company information including the company name, the
quarter being reported, a short business overview, and the three basic financial statements. Part 2
presents the conference call excerpt and an area to record red flags. We tell auditors that a red flag,
in the context of the present experiment, exists any time they feel that the CEO's comments are
suspicious, give them pause, or require additional investigation. We ask them to read / listen to the
14
entire transcript. We tell all auditors to assume they are the audit engagement partners for the
companies they analyze. In Part 3, we collect responses from auditors. As auditors read / listen to
the transcript, we ask them to note the timestamp / line number of each red flag, what was being
discussed and why it was a red flag. We next solicit our primary dependent measure by asking,
“Next, provide an overall judgment of whether it is more likely than not that fraud was being
committed at this company during this quarter. That is, did this company later restate this quarter’s
financial results due to one or more of the following: fraudulent financial results, a regulatory
investigation, or a class action lawsuit?” Auditors respond, “Yes, fraud was likely being committed
during this quarter” or “No, fraud was not likely being committed during this quarter.”9 We
sequentially present all four evaluated companies in this manner. After evaluating the fourth
company, auditors complete a post-experiment questionnaire that asks questions about work
experience and experience detecting deception.
4. Results
4.1 DESCRIPTIVE STATISTICS
4.1.1 Descriptive Statistics. Each of the 31 auditors provide four judgments, one per
conference call, yielding 124 responses. We eliminate three observations because auditors indicate
they are familiar with fraud at the company, leaving 121 total observations and 31 auditors.10
Average audit experience is 23.62 years. The average length of the conference call narrative
provided is 7.26 minutes; the financial statement based fraud score F-Score is 1.89, and 52% of
the conference calls auditors reviewed are deceptive. There is no statistical difference in average
9 We then ask auditors to state how confident they are about this judgment. Additional questions ask the auditor whether they thought the CEO was lying, what areas of the financial statements appear problematic, and how familiar the auditor was with the company before starting the experiment. 10 The three eliminated observations occurred when the auditor responded “Yes” to the following question: “This company may or may not have had to restate this quarter’s financial results due to one or more of the following: fraudulent financial results, a regulatory investigation, or a class action lawsuit. Before participating in this study, were you aware of any financial improprieties for this company?”
15
audit experience (25.10 vs. 22.21, p = 0.55), length of the conference call excerpt (7.21 vs. 7.30, p
= 0.22), F-Score (1.78 vs 1.99, p = 0.16), or the number of fraudulent companies (51% vs. 53%, p
= 0.26) between auditors not instructed or instructed on negative affect.
4.1.2 Chance Benchmark for Accuracy Rates. In Table 1, Panel A we provide descriptive
statistics on auditor accuracy judgments for each experimental condition. As a baseline and for
comparison to prior literature, we first test whether uninstructed auditors’ deception judgments,
overall, are better than chance rates. Using a simple t-test adjusted for repeated measures, we
observe that the overall accuracy rate of 63% for uninstructed auditors is statistically greater than
chance levels of 50% (p = 0.03). This accuracy rate is high relative to reported accuracy rates for
deception judgments by experts in prior meta-analysis (e.g., less than 55% in Bond and DePaulo
[2006]), and average accuracy rates of 54% that are commonly obtained when subjects face a 50%
fraud rate (Levine et al. [2014]). The rate also rivals accuracy rates from automated machine-based
detection of deception in earnings calls, which range from 56% to 66% (Hobson et al. [2012];
Larcker and Zakolyukina [2012]). Consistent with our theory, though, the overall 63% accuracy
rate for uninstructed auditors is driven by accuracy on non-fraud companies. Their accuracy rates
on non-fraud companies (83%) are far better than chance (p < 0.01) while their accuracy rates on
fraud companies (43%) does not statistically differ from chance (p = 0.43).
4.2 H1—EFFECTS OF COMPANY TYPE AND INSTRUCTION ON ACCURACY RATES
Panel A of Figure 1 depicts the H1A predictions that auditors’ accuracy rates will be lowest
when judging fraud companies without instruction and highest when judging fraud companies with
instruction or when judging non-fraud companies, with or without instruction. Two simple effects
that comprise this ordinal interaction are that uninstructed auditors will more accurately classify
16
non-fraud companies than fraud companies (H1B), and that experienced auditors will be more
accurate when instructed than when uninstructed in evaluating fraud companies (H1C).
To test the H1A ordinal interaction, we estimate a multivariate, repeated measures logistic
model, in which Accuracy is the dependent variable, and Company Type, Negative Affect
Instruction and their interaction are the independent variables.11 Panel A, Table 1 and Panel B,
Figure 1 report descriptive statistics, while Panels B and C of Table 1 report inferential statistics.
We test H1A using an a priori linear contrast where auditors are equally highly accurate (contrasts
weights = 1) unless evaluating fraud companies without the negative affect instruction (weight =
–3). The test statistic for this contrast is significant (Panel C, Table 1), confirming H1A (p < 0.01
one tailed). 12 Panel C shows for H1B that the simple effect of Company Type given No Instruction
is significant (p < 0.01 one tailed), indicating that uninstructed auditors’ accuracy significantly
decreases when evaluating fraud companies (43%) relative to non-fraud companies (83%). For
H1C, the simple main effect of Negative Affect Instruction given Fraud Company is significant (p
= 0.02 one tailed), indicating that instructed auditors (70%) outperform uninstructed auditors
(43%) when evaluating fraud companies. For completeness, we note that the pairwise comparisons
of the three means from uninstructed auditors evaluating non-fraud companies, instructed auditors
evaluating non-fraud companies, and instructed auditors evaluating fraud companies show no
11 Specifically, we estimate generalized linear models (GLIMMIX via SAS 9.4) with random effects by subject to account for within subject correlation, using the logit link function given the dichotomous nature of the outcome variable. 12 In developing H1A and related contrast weights of 1, 1, 1, -3, we are balancing theoretical merit and simplicity. More complex contrast weights also consistent with our theory lead to the same inference. For example, one could predict the highest accuracy rates when instructed or uninstructed auditors judge non-fraud companies (+2 in each case), a moderate accuracy rate when auditors evaluate fraud companies with the instruction (-1) and the lowest accurate rate when auditors evaluate fraud companies without the instruction (-3). Using 2, 2, -1, -3 to test H1A also is statistically significant ( (1) = 7.89, p < 0.01 one tailed).
17
significant differences (all p > 0.24, results not tabulated).13
[Figure 1 and Table 1 about here]
4.3 NEGATIVE AFFECT INSTRUCTION AND IMPROVED DECEPTION DETECTION
The negative affect instruction appears to unlock auditor ability, in turn improving fraud
detection. To more fully characterize the effects of the negative affect instruction, we conduct two
analyses that exploit data underpinning the overall auditor fraud judgments above.
4.3.1 Effect of Negative Affect Instruction on Application of Audit Related Knowledge.
While examining each transcript, auditors were asked to note in a text box the following for each
red flag of fraud they identify: (1) the location of the red flag in the narrative via line number /
timestamp, (2) the topical issue of the red flag, and (3) why it was a red flag. As a collection, the
content of the text box captures the extent to which auditors are applying their audit related
knowledge for the identification, description and justification of fraud cues. We therefore use the
number of characters supplied in the text box as a proxy for the extent to which auditors leverage
their audit related knowledge for the purpose of fraud detection.14 If improvements in fraud
detection occur due to the negative affect instruction’s unlocking of auditor ability, we should
13 Accuracy rates on non-fraud companies for instructed auditors (72%) and uninstructed auditors (83%) are not significantly different (see Figure 1, Panel B). Had accuracy rates for non-fraud companies been significantly lower for instructed versus uninstructed auditors (due, e.g., to a larger sample size), it would highlight a potential tradeoff between audit effectiveness and audit efficiency. Audit inefficiencies are not costless, but even seemingly inefficient audit work directed towards fraud detection could add value by preventing future fraud. Further, audit work that, in hindsight, fails to reveal a material misstatement ordinarily will provide stronger evidentiary support to undergird a clean audit opinion. We leave questions about the conditions under which the cost of audit inefficiency exceeds the benefits society derives from extra audit work on non-fraud companies to future research. 14 This open ended response is a more sensitive measure of whether the instruction is helping auditors apply their knowledge than a separate, later measure in which we ask auditors to identify likely overstatement or understatement in the following categories: Liabilities, Revenues/Gains, Expenses/Losses, Other. This later measure is noisier. For example, if we sum the number of selections from this question we find a significant difference for fraud company (F = 8.79, p < 0.01), but no difference for instruction (F = 0.88, p = 0.36) or the interaction (F = 0.06, p = 0.81). A variable capturing accuracy of this judgment shows no significant effects (all p > 0.38).
18
observe the largest amount of text box content for fraud companies when the negative affect
instruction is provided.
Table 2 reports means, repeated measures analysis, and contrast code analysis of this
dependent variable. As expected, the average number of characters supplied by instructed auditors
evaluating a fraud company (361.18) is larger than that of instructed auditors evaluating a non-
fraud company (168.90), uninstructed auditors evaluating fraud company (255.13), and
uninstructed auditors evaluating a non-fraud company (169.93, p < 0.01 one tailed, see Panels A
and C of Table 2).15 Simple main effects analysis reveals instructed auditors evaluating a fraud
company provide significantly more text box content than when they evaluate a non-fraud
company (361.18 versus 168.90, p < 0.01, one tailed). Additionally, the number of characters
supplied is marginally higher for instructed versus uninstructed auditors when evaluating a fraud
company (361.18 versus 255.13, p = 0.10, one tailed), but not when evaluating a non-fraud
company (169.93 versus 168.90, p = 0.90). These results indicate that the negative affect
instruction does not indiscriminately increase the extent of red flags that instructed auditors find.
Rather, auditors identify substantially more red flags precisely when the company is both a fraud
company and when the auditor receives instruction.
[Table 2 about here]
4.3.2 Effect of Instruction on Sentence-Level Red Flag Accuracy among Fraud Companies.
Because we know the specific locations within the narrative that caused concern for our auditors,
we can refine our analysis of fraud detection to assess whether instructed auditors more accurately
identify sentence-specific fraudulent statements by CEOs in the conference call narratives of fraud
15 Testing this ordinal interaction using 3, -2, 1, -2 contrast weights also yields a statistically significant result ( (1) = 14.52, p < 0.01 one tailed). In addition, using the number of red flags identified instead of the number of characters in the text box yield similar inferences. The number of red flags is correlated 0.77 with the number of characters in the text box.
19
companies. This investigation is important given that the more granular the auditor’s sensitivity
to fraud, the greater the potential for the auditor to design specific substantive tests to diagnose the
particular fraud at hand (Hammersley et al. [2011]; Simon [2012]). Further, if superior
performance obtains among instructed versus uninstructed auditors at the sentence-specific level
among fraud companies, it helps alleviate any potential concerns that our company-level results
are confounded by known (e.g., measurable negative affect) or unknown differences between fraud
vs. non-fraud companies.
To execute this analysis, we assess auditor’s fraud sensitivity at the sentence level for each
of the five fraud companies as follows. First, we classify each CEO sentence in the transcript of
each fraudulent company as fraudulent or not fraudulent, depending on whether the topic of the
sentence pertains to the topic of the fraud. This subjective classification is done by a coauthor and
several teams of research assistants who are blind to the manipulated conditions results, using hand
collected data about each of the five frauds.16 Each fraud company has at least five sentences that
pertained to the fraud and 7.4 on average. Next, the subjective coding of sentence topics is
compared with whether the sentence overlaps with a location of the narrative identified by the
auditor as a red flag. Finally, we define Red Flag Accuracy as 1 if the auditor identifies (does not
identify) a red flag in a fraudulent (non-fraudulent) sentence, and 0 otherwise.
In all, auditors evaluated a total 1,840 sentences across all fraud companies they observed,
of which 465 are fraudulent, yielding an underlying fraud rate of 25.3%. As Panel A of Table 3
shows, auditors’ accuracy rate in flagging the 465 fraudulent sentences is 27%, collapsed across
16 Just over 100 students in a second-year audit course are divided into small groups and asked to research the background information of the fraud of each fraud company, and then to categorize each CEO sentence based on how directly it pertained to the fraud topic. Six groups were assigned to each fraud company. A coauthor, blind to the manipulated conditions, uses the research assistants’ analysis and judgment and her/his own background research to subjectively evaluate each sentence. Of the five fraud companies, there are a total of 145 sentences, of which 37 were identified as pertaining to fraud, for an underlying endogenous fraud rate of 25.5%.
20
instructed and uninstructed auditors. We again use a multivariate, repeated measures logistic
analysis to assess whether the negative affect instruction increases auditor sensitivity. Table 3
panels B and C provide the estimation results. We find significant results using a linear contrast
( (1) = 98.65, p < 0.01 one tailed), with weights corresponding to experienced auditors’
deception judgments being equally highly accurate at the sentence level (contrasts weights = 1),
unless they are evaluating fraud sentences without the negative affect instruction (weight = –3).17
Simple effects analysis also shows that negative affect instruction significantly improves accuracy
at the sentence level for fraud sentences ( (1) = 3.64, p = 0.03, one tailed), but not for non-fraud
sentences ( (1) = 0.04, p = 0.84). The results indicate the positive influence of the negative affect
instruction extends to the sentence level.
As an aside, one reason these sentence level sensitivities are lower than the company-level
sensitivities in Table 1 of 70% (43%) for instructed (uninstructed) auditors is differential fraud
rates. The company fraud rate in Table 1 is 50% by our design. The sentence level fraud rate is
25% (465 fraud topic sentences out of a total of 1,840 sentences), and was determined by CEOs’
actual discussions in fraud companies. The enhancement of accuracy in judging fraud companies
for instructed auditors across these two settings indicates our results are not dependent upon a
particular fraud rate or some other omitted between company-type variable, given we find a similar
pattern of results across fraud and non-fraud companies and within fraud companies.
[Figure 2 and Table 3 about here]
4.4 ALTERNATIVE EXPLANATIONS
4.4.1 50/50 Fraud rate. The ideal deception detection study not only would have high
internal validity but also high external validity by using a fraud rate that matches the fraud rate in
17 Results are similarly significant using contrast weights of 2, 2, -1, -3 ( (1) = 335.72, p < 0.01 one tailed).
21
the field (Levine et al. [2014]). Unfortunately, as is the case in many deception detection settings,
we do not have precise estimates on the true rate of fraudulent financial reporting. Moreover, if we
were to use a particularly low rate of seeded fraud, a large fraction of our scarce audit subject
resource would be assigned to non-fraud companies, inhibiting our ability to study their deception
detection capabilities. As such, we seek a degree of comparability with the vast majority of
deception judgment experiments and use a 50/50 fraud rate.18
Could this research design choice alone drive the pattern of results we observe? Although
it is possible that use of a lower fraud rate at the company level would improve both instructed and
uninstructed auditor’s accuracy in identifying fraud companies, such across the board
improvement would, importantly, not explain our ordinal interaction. Nevertheless, suppose that,
despite informing all subjects that the fraud rate is 50/50,19 instructed auditors assume a relatively
high fraud rate but uninstructed auditors assume a relatively low fraud rate. In this case, for any
given judgment, uninstructed auditors would tend to classify companies as being non-fraudulent
(fraudulent) more (less) often than would instructed auditors. Such undifferentiated choices would
cause uninstructed auditors to exhibit higher (lower) accuracy for non-fraud (fraud) companies,
and instructed auditors to exhibit higher (lower) accuracy for fraud (non-fraud) companies relative
to uninstructed auditors. The pattern of findings in Figure 1 suggests that such an explanation is
plausible. However, for this to be the case, instructed auditors must naively select higher rates of
fraud without explicitly differentiating between fraud and non-fraud companies. Our theory
18 Use of a 50% failure rate is also common in behavioral experimental accounting research, going back to the seminal work by Libby [1975] on usefulness of accounting ratios in loan officers’ business failure predictions. 19 During training, we tell auditors that, “[The] four companies [you will evaluate] were taken from a larger set of companies. In this larger set, 50% of the companies had to restate their earnings due to fraud. Specifically, in half of the companies in this larger set, the quarterly and/or yearly financial results being discussed in the conference call were later restated. Since you have a sample of only four companies, you will not know for sure how many of these companies committed fraud. The most likely scenario is that you will evaluate two fraud companies and two clean companies. However, you could have any combination of fraud and clean companies, including all fraud companies or all clean companies.”
22
predicts accuracy differentiation based on company type, and contrary to this alternative
explanation, we find three sets of evidence for differentiated judgments.
First, we analyze raw fraud judgments of narratives. Uninstructed auditors judge just 31%
of companies to be deceptive, which is significantly less than the 50% rate of instructed auditors
( (1) = 4.16, p = 0.02, one tailed, not tabled). However, this higher rate of selecting fraud is
driven by instructed auditors’ higher rates for fraud companies, since there is no significant
difference between the rate of fraud judgments between instructed and uninstructed auditors
judging non-fraud companies ( (1) = 0.86, p = 0.35, not tabled). This indicates that instructed
auditors accurately discriminate in their fraud judgment rates, as predicted by our theory.
Additionally, overall accuracy is not correlated with the number of times the auditor judged a
company to be fraudulent for instructed auditors (p = 0.25, not tabled).
Second, this same pattern can be seen for the raw number of times auditors judged a
sentence as fraudulent. The rate of judging a sentence as fraudulent is not different for instructed
and uninstructed auditors for non-fraud sentences (15.3% vs 15.8%, (1) = 0.01, p = 0.92, not
tabled). If subjects systematically responded to the instruction by judging sentences as red flags,
we would expect a difference. Both instructed and uninstructed auditors increase their rate of fraud
judgment for fraudulent sentences (32.4% vs 21.4%, not tabled), but instructed auditors do so to a
greater extent ( (1) = 36.26, p < 0.01, one tailed, not tabled), as predicted by our theory.
Additionally, if the instruction prompts specific attention to the stated seeded fraud rate, we should
not observe our sentence level results in Table 3 because the sentence level fraud rate among fraud
companies was not provided to auditor subjects. Nonetheless, we observe that accuracy with
respect to identifying fraudulent sentences increases when auditors are instructed. Finally, we find
that instructed auditors differentiate by providing more extensive descriptions for fraud companies,
23
as discussed in section 4.3.1. That is, instructed auditors appear to apply more of their audit related
knowledge and effort regarding red flags for fraud companies, which demonstrates explicit
differentiation between the presence and absence of fraud.
4.4.2 Medium. We manipulate medium as a manipulation check and to address potential
generalizability issues, given the availability of both transcripts and audio in the marketplace. We
make no particular predictions with respect to the effects of medium on our results (while audio
likely provides more information, this could be useful information or distracting, irrelevant
information). To explore whether the conference call format plays any role in deception detection,
we examine whether the results documented in Table 1 are robust to different mediums. We define
medium as 1 if the auditors have the audio and the transcript of the conference call excerpt and 0
if they have just the transcript. Neither including medium as a covariate nor as an interacted
variable in a 3-way analysis changes our inferences, yields a significant effect for the medium
variable, or yields a significant effect for any of its interactions (all p > 0.37, not tabulated).
5. CONCLUSION, LIMITATIONS AND IMPLICATIONS
We experimentally examine the joint, interactive effects of company type (fraud versus
non-fraud) and negative affect instruction (present versus absent) on how accurately participants
with many years of audit experience detect deception in CEO narratives. Auditors, when
uninstructed about the association between negative affect and deception, classify companies
accurately 63% of the time overall, significantly outperforming chance (50%). This is good news,
as meta-analyses document that experts rarely outperform chance when trying to detect deception
(e.g., Bond and DePaulo [2006]). The bad news, however, is that uninstructed auditors achieve
this above-chance accuracy only because their accuracy rates for non-fraud companies (83%)
significantly exceed that for fraud companies (43%), which does not statistically differ from
24
chance levels. This pattern is consistent with our theory that auditors experientially become more
attuned to avoiding false positives than false negatives regarding deception associated with fraud.
We therefore develop a theory-based instructional remedy to help auditors overcome their
experientially learned avoidance of false positives. Our instruction explicitly encourages auditors
to attend to management’s negative affect in order to shatter their subconscious “illusion of
objectivity” that otherwise enables auditors to downplay fraud cues from CEO narratives. We find
instructed auditor accuracy levels for fraud companies improves from 43% to 70%, consistent with
auditors having the ability to detect deception.
In supplemental findings, we observe that instructed auditors more extensively characterize
red flags among fraudulent companies relative to non-fraudulent companies. Additionally,
instructed auditors show greater fraud sensitivity by accurately identifying fraud-related “red
flags” at the sentence-specific level. Thus, overall, we document that when provided with a
negative affect instruction, participants with extensive audit experience possess sufficient audit-
related knowledge and deception-detection skill to detect fraud. Absent this simple, low cost
instruction, however, even these very seasoned auditors are unable to detect deception from CEO
conference calls narratives.
Our research is subject to potential limitations, which also serve as opportunities for future
research. First, we ask auditors to imagine they are on their own audit engagement when, of
course, the companies they evaluate are not their actual clients (Smith and Kida [1991]). Future
research might consider analyzing auditor behavior for their own clients. Second, since our
experimental participants have numerous years of audit experience, we cannot necessarily
conclude that the success of the negative affect instruction would extend similarly to auditors
having significantly less audit-related knowledge. Our theory-informed conjecture is that this
25
instruction likely has greater benefits for participants possessing greater audit-related knowledge.20
However, this is a testable conjecture we leave to future studies using participants such as audit
managers, seniors and staff.21 Third, we study auditors earnings call narratives. While the majority
of public companies hold earnings calls (NIRI [2016]), some public and most private companies
do not. Nevertheless, other narratives exist even for these companies, such as investor roadshows
or private interviews during audit fieldwork. Our theory would predict the same form of ordinal
interaction between negative affect instruction and company type, at least for auditors. Unlike
financial statement auditors, however, other professionals—such as forensic auditors, investors,
and equity analysts—might not learn over time to focus heavily on avoiding false positives. If so,
company type and a negative affect instruction could have a different joint impact on deception
detection performance for combinations of different professionals and narrative types. We leave
theory development and empirical tests of various combinations to future research.
This research contributes to both audit practice and research. From a practice standpoint,
we show that auditors with substantial audit experience can ascertain fraud cues from conference
calls. Conference calls are public and available for many companies, making them potentially
useful for vetting potential clients. For example, while the prospect of growth in audit revenues is
high in BRIC (Brazil, Russia, India, and China) and other developing countries, auditors have
20 We choose experienced participants since they are most likely to have acquired the ability to detect deception, have had more time to internalize the learned incentives our negative affect instruction counteracts, and are more likely to be able to perceive affective states of others (Hartshorne and Germine [2015]). Additionally, given the hierarchical nature of audit review and documentation, a more experienced auditor could overrule a less-senior auditor’s concern that fraud exists. 21 In a separate, untabulated experiment, we did examine whether the same negative affect instruction helps audit students with audit internship experience to detect deception, but we find that neither instructed (47%) nor uninstructed (50%) audit students perform better than chance at detecting fraud companies (repeated measures t-test p values of the hypothesis that accuracy was equal to chance levels of 50% were 0.40 and 0.87, respectively). This lack of deception detection capability among novices in the audit setting we utilize replicates the standard result that novices generally do not outperform chance (Bond and DePaulo [2006], Bond and DePaulo [2008], Vrij et al. [2006]). This is also consistent with current research on auditors. Hillison (2016) finds that audit partners have internalized their commercial or stakeholder audit role while newer auditors have not. In sum, some level of audit-related knowledge acquired from experience may well be necessary. We leave further examination of this question to future research.
26
expressed hesitancy about accepting prospective clients in parts of the world with higher
corruption indices due to potentially elevated levels of fraud risk (e.g., PCAOB [2011]). To the
degree that our theory and experimental findings helps auditors to better discriminate which clients
to accept versus reject because of heightened risk of fraud, our findings may be useful to the
profession and to investors. Second, our research provides a helpful first step by examining how
well experienced auditors perform at deception detection when unaided by such technology.
Whether, and the conditions under which, machines provide a complementary or substitution role
with respect to seasoned auditors’ attempts at fraud detection is a fruitful area of research
(Dietvorst et al. [2014]; Elkins et al. [2013]) that has potential to help audit practice.
From a research perspective, we demonstrate a setting in which individuals successfully
detect deception from narratives. In particular, we show a setting in which instructed auditors with
extensive audit experience (i.e., experts) perform well in avoiding false positives. We also
highlight the need for additional research examining experienced auditors’ reluctance to suspect a
company is engaging in fraud, as our uninstructed auditors commit numerous false negatives,
which likely is disconcerting to regulators, investors, and other financial statement users. Finally,
we identify an inexpensive and useful remedy—instructing auditors to consider the negative affect
of the speaker—to aid experienced auditors in mitigating these false negative errors.
27
Appendix: Time Line
Video guided tour through the mechanics of the
experiment, including practicing with a hypothetical
company.
Evaluate four companies sequentially, in turn Exit survey
Part 1:
Background Company Information, including:
The quarter being reported
A short business overview
Balance Sheet
Income Statement
Statement of Cash Flows
Part 2:
Transcript or Transcript + Audio
An Area to Record Red Flags
Part 3:
Response variables, including:
Our main dependent measure: "...was fraud being committed
during this quarter?"
For each company, auditors receive the
following:
28
References
ARIAIL, D.L.; J. P. BLAIR; and L.M. SMITH. 'Audit Inquiries and Deception Detection: Standards, Research and Guidance.' Journal of Forensic & Investigative Accounting 2 (2010): 1-25.
ASARE, S. K.; G. M. TROMPETER; and A. M. WRIGHT. 'The Effect of Accountability and Time Budgets on Auditors' Testing Strategies.' Contemporary Accounting Research 17 (2000): 539-560.
AUDIT ANALYTICS STAFF. 'Analysis of Audit Fees by Industry Sector.' Audit Analytics, 07 Jan 2014. www.auditanalytics.com. 01 Jun 2015.
BAZERMAN, M. H.; K. P. MORGAN; and G. F. LOEWENSTEIN. 'The Impossibility of Auditor Independence.' Sloan Management Review 38 (1997): 89-94.
BENNETT, G. B., and R. C. HATFIELD. 'The Effect of the Social Mismatch Staff Auditors and Client Management on the Collection of Audit Evidence.' The Accounting Review 88 (2013): 31-50.
BLAU, B. M.; J. R. DELISLE; and S. M. PRICE. 'Do Sophisticated Investors Interpret Earnings Conference Call Tone Differently Than Investors At Large? Evidence from Short Sales.' Journal of Corporate Finance 31 (2015): 203-219.
BOND, C. F., and B. M. DEPAULO. 'Individual Differences in Judging Deception: Accuracy and Bias.' Psychological Bulletin 134 (2008): 477-492.
BOND, C. F., and B. M. DEPAULO. 'Accuracy of Deception Judgments.' Personality and Social Psychology Review 10 (2006): 214-234.
BRAUN, R. L. 'The Effect of Time Pressure on Auditor Attention to Qualitative Aspects of Misstatements Indicative of Potential Fraudulent Financial Reporting.' Accounting, Organizations and Society 25 (2000): 243-259.
BRAZEL, J. F.; S. B. JACKSON, T. J. SCHAEFER, and B.W. STEWART. 'The Outcome Effect and Professional Skepticism.' The Accounting Review 91 (2016): 1577-1599
BRAZEL, J. F.; T. D. CARPENTER; and J. G. JENKINS. 'Auditors' Use of Brainstorming in the Consideration of Fraud: Reports from the Field.' The Accounting Review 85 (2010): 1273-1301.
CENTER FOR AUDIT QUALITY (CAQ). Deterring and Detecting Financial Reporting Fraud: A Platform for Action. Washington, D.C.: The Center for Audit Quality, 2010.
CHRISTENSEN, B. E.; S. M. GLOVER; T. C. OMER, and M. K. SHELLEY. 'Understanding Audit Quality: Insights from Audit Partners and Investors.' Contemporary Accounting Research 33 (2016): 1648-1684.
CLOR-PROELL, S., and M. W. NELSON. 'Accounting Standards, Implementation Guidance, and Example-Based Reasoning.' Journal of Accounting Research 45 (2007): 699-730.
DAWES, R. M. Rational Choice in an Uncertain World. 1st ed. San Diego: Harcourt Brace Jovanovich College Publishers, 1988.
DECHOW, P. M.; W. GE; C.R. LARSON; and R. G. SLOAN. 'Predicting Material Accounting Misstatements.' Contemporary Accounting Research 28 (2011): 17-82.
DEPAULO, B. M.; J. J. LINDSAY; B. E. MALONE; L. MUHLENBRUCK; K. CHARLTON; and H. COOPER. 'Cues to Deception.' Psychological Bulletin 129 (2003): 74-118.
DIETVORST, B. J.; J. P. SIMMONS and C. MASSEY. Algorithm Aversion: People Erroneously Avoid Algorithms After Seeing Them Err” Journal of Experimental Psychology: General. (2014)
29
DITTO, P. H., and D. F. LOPEZ. 'Motivated Skepticism: Use of Differential Decision Criteria for Preferred and Nonpreferred Conclusions.' Journal of Personality & Social Psychology 63 (1992): 568-584.
DOTY, J. R. Keynote Address: Baruch College 13th Annual Financial Reporting Conference. Baruch College. Vertical Campus Building, New York, NY. 01 May 2014. Keynote Address. Transcript available at http://pcaobus.org/News/Speech/Pages/05012014_Baruch.aspx.
DYCK, I. J. A.; A. MORSE; and L. ZINGALES. 'Who Blows the Whistle on Corporate Fraud?' Journal of Finance 65 (2010): 2213-2253.
EKMAN, P. Telling Lies: Clues to Deceit in the Marketplace, Politics, and Marriage. New York: W. W. Norton & Company, Inc., 1985.
ETTREDGE, M.; C. LI; and E. EMEIGH. 'Fee Pressure and Audit Quality.' Accounting, Organizations and Society 39 (2014): 247-263.
ELKINS, A.C; N.E. DUNBAR; B. ADAMS; and J.F. NUNAMAKER. 'Are Users Threatened by Creditibliy Assessment Systems?' Journal of Management Information Systems 29 (2013): 249-262.
ERICSSON, K. A.; R. T. KRAMPE; and C. TESCH-RÖMER. 'The Role of Deliberate Practice in the Acquisition of Expert Performance.' Psychological Review 100 (1993): 363-406.
FRIEDRICH, J. 'Primary Error Detection and Minimization (PEDMIN) Strategies In Social Cognition: A Reinterpretation Of Confirmation Bias Phenomena.' Psychological Review 100 (1993): 298-319.
HAMMERSLEY, J. S; K. M. JOHNSTONE; and K. KADOUS. 'How Do Audit Seniors Respond to Heightened Fraud Risk?' AUDITING: A Journal of Practice & Theory 30 (2011): 81-101.
HARMON-JONES, E. 'Cognitive Dissonance and Experienced Negative Affect: Evidence that Dissonance Increases Experienced Negative Affect Even in the Absence of Aversive Consequences.' Personality and Social Psychology Bulletin 26 (2000): 1490-1501.
HARTSHORNE, J. K., and L. T. GERMINE. 'When Does Cognitive Functioning Peak? The Asynchronous Rise and Fall of Different Cognitive Abilities Across the Life Span.' Psychological Science 26 (2015): 433-443.
HILLISION, S. M. 'Audit Partners’ Acceptance of Client-Preferred Financial Reporting: The Influence of Professional Role Identities and Client Importance,' Working Paper, University of Illinois, 2016.
HOBSON, J.; W. J. MAYEW; and M. VENKATACHALAM. 'Analyzing Speech to Detect Financial Misreporting.' Journal of Accounting Research 50 (2012): 349-392.
HOGAN, C. E.; Z. REZAEE, R.A.; RILEY JR.; and U.K. VELURY. 'Financial Statement Fraud: Insights from the Academic Literature.' Auditing: A Journal of Practice and Theory 27 (2008): 231-252.
HOLLANDER, S.; M. PRONK; and E. ROELOFSEN. 'Does Silence Speak? An Empirical Analysis of Disclosure Choices during Conference Calls.' Journal of Accounting Research 48 (2010): 531-563.
HOUSTON, R. W. 'The Effects of Fee Pressure and Client Risk on Audit Seniors' Time Budget Decisions.' Auditing: A Journal of Practice and Theory 18 (1999): 70-86.
JAMAL, K.; P. E. JOHNSON; and R. G. BERRYMAN. 'Detecting Framing Effects in Financial Statements.' Contemporary Accounting Research 12 (1995): 85-105.
30
JOHNSON, P. E.; S. GRAZIOLI; K. JAMAL; and R. GLEN BERRYMAN. 'Detecting Deception: Adversarial Problem Solving in A Low Base-Rate World.' Cognitive Science 25 (2001): 355-392.
KADOUS, K.; S. J. KENNEDY; and M. E. PEECHER. 'The Effect Of Quality Assessment and Directional Goal Commitment on Auditors' Acceptance of Client-Preferred Accounting Methods.' The Accounting Review 78 (2003): 759-778.
KELLEY, T., and L. MARGHEIM. 'Survey On The Differential Effects Of Time Deadline Pressure Versus Time Budget Pressure.' Journal of Applied Business Research 15 (1999).
KNAPP, C. A., and M. C. KNAPP. 'The Effects Of Experience and Explicit Fraud Risk Assessment in Detecting Fraud with Analytical Procedures.' Accounting, Organizations and Society 26 (2001): 25-37.
KUNDA, Z. 'The Case for Motivated Reasoning.' Psychological Bulletin 108 (1990): 480-498. LARCKER, D. F., and A. A. ZAKOLYUKINA. 'Detecting Deceptive Discussions in Conference
Calls.' Journal of Accounting Research 50 (2012): 495-540. LEE, C. C., and R. B. WELKER. 'The Effect of Audit Inquiries on the Ability to Detect
Financial Misrepresentations.' Behavioral Research in Accounting 19 (2007): 161. LEE, C. C., and R. B. WELKER. 'Identification of Perceived Interviewee Behaviors that
Influence Auditors' Assessment of Deception.' International Journal of Auditing 12 (2008): 205-220.
LEE, C. C.; R. B. WELKER; and T. WANG. 'An Experimental Investigation of Professional Skepticism in Audit Interviews.' International Journal of Auditing 17 (2013): 213-226.
LEVINE, T. R.; D. D. CLARE; T. GREEN; K.B. SEROTA; and H.S. PARK. 'The Effects of Truth-Lie Base Rate in Interactive Deception Detection Accuracy.' Human Communication Research 40 (2014): 350-372.
LIBBY, R. 'Accounting Ratios and the Prediction of Failure: Some Behavioral Evidence.' Journal of Accounting Research 13 (1975): 150-161.
MATSUMOTO, D.; M. PRONK; and E. ROELOFSEN. 'What Makes Conference Calls Useful? The Information Content of Managers' Presentations and Analysts' Discussion Sessions.' The Accounting Review 86 (2011): 1383-1414.
MAYEW, W. J., and M. VENKATACHALAM. 'The Power of Voice: Managerial Affective States and Future Firm Performance.' The Journal of Finance 67 (2012): 1-43.
MOORE, D. A., L. TANLU and M. H. BAZERMAN. Conflict of Interest and Intrusion of Bias. Judgment and Decision Making 5 (2010): 37-53.
NATIONAL INVESTOR RELATIONS INSTITUTIE (NIRI). NIRI Earnings Process Practices Research Report. 2016. https://www.niri.org.
NELSON, M. W. 'A Model and Literature Review of Professional Skepticism in Auditing.' Auditing: A Journal of Practice and Theory 28 (2009): 1-34.
PYSZCZYNSKI, T., and GREENBERG, J. A Biased Hypothesis Testing Model of Motivated Attributional Distortion. Advances in Experimental Social Psychology Volume 20. Ed. L. Berkowitz. New York: Academic Press. 1987.
PEECHER, M. E.; I. SOLOMON; and K. T. TROTMAN. 'An Accountability Framework for Financial Statement Auditors and Related Research Questions.' Accounting, Organizations and Society 38 (2013): 596-620.
PRICE, S. M.; J. S. DORAN; D. R. PETERSON; and B. A. BLISS. 'Earnings Conference Calls and Stock Returns: The Incremental Informativeness of Textual Tone.' Journal of Banking & Finance 36 (2012): 992-1011.
31
PUBLIC COMPANY ACCOUNTING OVERSIGHT BOARD (PCAOB). Observations on Auditors' Implementation of PCAOB Standards Relating to Auditors' Responsibilities with Respect to Fraud. Release No. 2007-001. Washington, D.C.: PCAOB, 2007.
PUBLIC COMPANY ACCOUNTING OVERSIGHT BOARD (PCAOB). Auditing Standard Related to the Auditor's Assessment of and Response to Risk and Related Amendments to PCAOB Standards: PCAOB, 2010.
PUBLIC COMPANY ACCOUNTING OVERSIGHT BOARD (PCAOB). Auditing Standard No. 16, Communications with Audit Committees. Washington, D.C.: PCAOB, 2012.
PUBLIC COMPANY ACCOUNTING OVERSIGHT BOARD (PCAOB). Staff Audit Practice Alert No. 8, Audit Risks in Certain Emerging Markets. Washington, D.C.: PCAOB, 2011.
PUBLIC COMPANY ACCOUNTING OVERSIGHT BOARD (PCAOB). PCAOB Reproposes Auditing Standard, Related Parties, and Related Amendments, Including Amendments Regarding Significant Unusual Transactions. PCAOB, 07 May 2013. www.pcaobus.org. 15 May 2015. 2013.
SHAUB, M. K., and J. E. LAWRENCE. 'Differences in Auditors' Professional Skepticism Across Career Levels in the Firm.' Advances in Accounting Behavioral Research 2 (1999): 61-83.
SIMON, C. A. 'Individual Auditors' Identification of Relevant Fraud Schemes.' AUDITING: A Journal of Practice & Theory 31 (2012): 1-16.
SMITH, J. F., and T. KIDA. 'Heuristics and Biases: Expertise and Task Realism in Auditing.' Psychological Bulletin 109 (1991): 472-489.
VRIJ, A. Detecting Lies and Deceit: Pitfalls and Opportunities. 2nd ed. West Sussex: John Wieley & Sones Ltd., 2008.
VRIJ, A.; S. MANN; E. ROBBINS; and M. ROBINSON. 'Police Officers Ability To Detect Deception In High Stakes Situations And In Repeated Lie Detection Tests.' Applied Cognitive Psychology 20 (2006): 741-755.
WILLETT, C., and M. PAGE. 'A Survey of Time Budget Pressure and Irregular Auditing Practices Among Newly Qualified UK Chartered Accountants.' The British Accounting Review 28 (1996): 101-120.
32
FIGURE 1 The Effect of Negative Affect Instruction on Accuracy for Fraud and Non-Fraud Companies Panel A: Predicted Results and Contrast Code Weights
Panel B: Results
Company Type is manipulated within participants and equals 1 if a conference call pertains to a quarter that is eventually restated due to an irregularity (Fraud Company), and 0 otherwise (Non-Fraud Company). Fraud Judgment is an indicator variable that equals 1 if the auditor judges the conference call to be related to a company quarter that will eventually be restated due to an irregularity, and 0 otherwise. Accuracy rate is determined by whether a participant correctly classifies the conference call and equals 1 if (Company Type = 1 and Fraud Judgment = 1 or Company Type= 0 and Fraud Judgment = 0) and 0 otherwise. The negative affect instruction is manipulated between subjects with two parts. First, auditors receive additional initial instructions that state: “One cue found to be useful in detecting deception in these CEO responses is cognitive dissonance. Cognitive dissonance is the negative, uncomfortable emotion a person feels when they are saying something that they know is not true. Those experiencing cognitive dissonance feel uncomfortable, uneasy, and bothered.” Second, after answering our principal dependent measure, these auditors assess “how much cognitive dissonance the CEO felt during this excerpt of the conference call.” Negative Affect Instruction is an indicator variable that equals 1 when both of these components are present and 0 otherwise. The fraud rate is set exogenously at 50% (Fraud Company = 1) and tests of each accuracy level against 50% is assessed in Table 1 Panel A.
1
-3
1 1
-4
-3
-2
-1
0
1
2
Non-Fraud Company Fraud Company
Acc
ura
cy
No Instruction Instruction
83%
43%
72% 70%
0%
20%
40%
60%
80%
100%
Non-Fraud Company Fraud Company
Acc
ura
cy
No Instruction Instruction
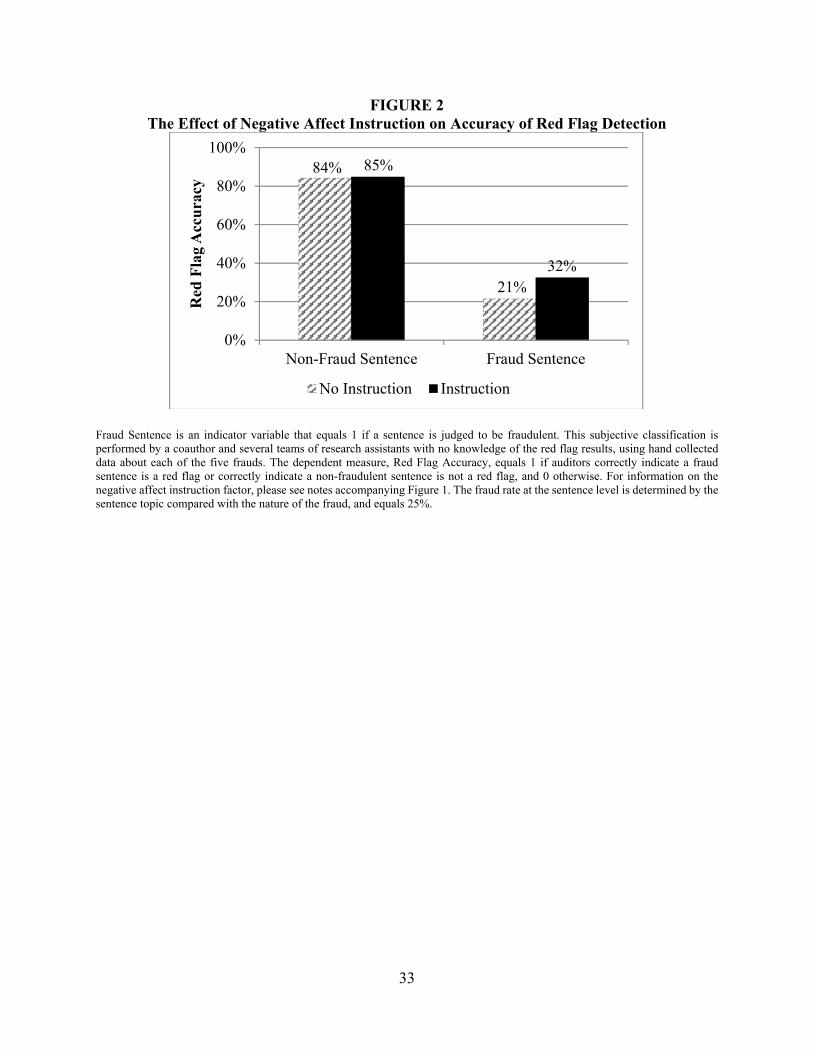
33
FIGURE 2 The Effect of Negative Affect Instruction on Accuracy of Red Flag Detection
Fraud Sentence is an indicator variable that equals 1 if a sentence is judged to be fraudulent. This subjective classification is performed by a coauthor and several teams of research assistants with no knowledge of the red flag results, using hand collected data about each of the five frauds. The dependent measure, Red Flag Accuracy, equals 1 if auditors correctly indicate a fraud sentence is a red flag or correctly indicate a non-fraudulent sentence is not a red flag, and 0 otherwise. For information on the negative affect instruction factor, please see notes accompanying Figure 1. The fraud rate at the sentence level is determined by the sentence topic compared with the nature of the fraud, and equals 25%.
84%
21%
85%
32%
0%
20%
40%
60%
80%
100%
Non-Fraud Sentence Fraud Sentence
Red
Fla
g A
ccu
racy
No Instruction Instruction
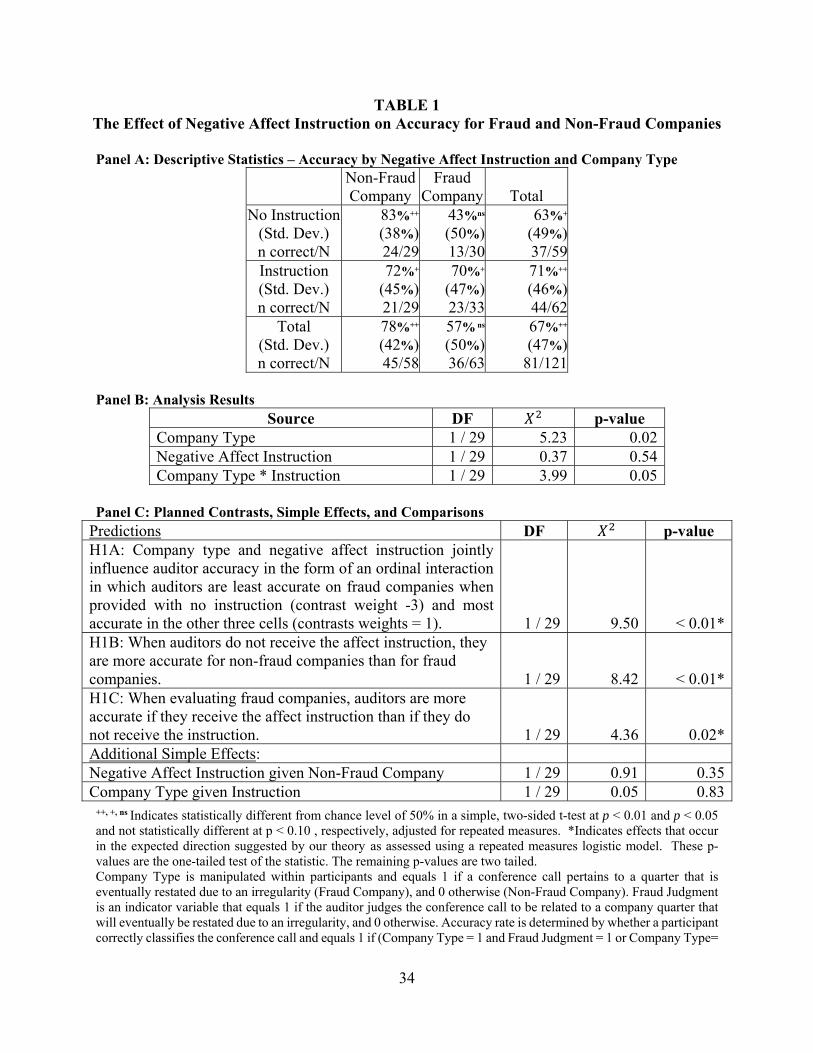
34
TABLE 1 The Effect of Negative Affect Instruction on Accuracy for Fraud and Non-Fraud Companies
Panel A: Descriptive Statistics – Accuracy by Negative Affect Instruction and Company Type
Non-Fraud Company
Fraud Company Total
No Instruction (Std. Dev.) n correct/N
83%++
(38%)24/29
43%ns
(50%)13/30
63%+
(49%)37/59
Instruction (Std. Dev.) n correct/N
72%+
(45%)21/29
70%+
(47%)23/33
71%++
(46%)44/62
Total (Std. Dev.) n correct/N
78%++
(42%)45/58
57% ns
(50%)36/63
67%++
(47%)81/121
Panel B: Analysis Results
Source DF p-value Company Type 1 / 29 5.23 0.02 Negative Affect Instruction 1 / 29 0.37 0.54 Company Type * Instruction 1 / 29 3.99 0.05
Panel C: Planned Contrasts, Simple Effects, and Comparisons
Predictions DF p-value H1A: Company type and negative affect instruction jointly influence auditor accuracy in the form of an ordinal interaction in which auditors are least accurate on fraud companies when provided with no instruction (contrast weight -3) and most accurate in the other three cells (contrasts weights = 1). 1 / 29 9.50 < 0.01* H1B: When auditors do not receive the affect instruction, they are more accurate for non-fraud companies than for fraud companies. 1 / 29 8.42 < 0.01* H1C: When evaluating fraud companies, auditors are more accurate if they receive the affect instruction than if they do not receive the instruction. 1 / 29 4.36 0.02* Additional Simple Effects: Negative Affect Instruction given Non-Fraud Company 1 / 29 0.91 0.35 Company Type given Instruction 1 / 29 0.05 0.83
++, +, ns Indicates statistically different from chance level of 50% in a simple, two-sided t-test at p < 0.01 and p < 0.05 and not statistically different at p < 0.10 , respectively, adjusted for repeated measures. *Indicates effects that occur in the expected direction suggested by our theory as assessed using a repeated measures logistic model. These p-values are the one-tailed test of the statistic. The remaining p-values are two tailed. Company Type is manipulated within participants and equals 1 if a conference call pertains to a quarter that is eventually restated due to an irregularity (Fraud Company), and 0 otherwise (Non-Fraud Company). Fraud Judgment is an indicator variable that equals 1 if the auditor judges the conference call to be related to a company quarter that will eventually be restated due to an irregularity, and 0 otherwise. Accuracy rate is determined by whether a participant correctly classifies the conference call and equals 1 if (Company Type = 1 and Fraud Judgment = 1 or Company Type=

35
0 and Fraud Judgment = 0) and 0 otherwise. The negative affect instruction is manipulated between subjects with two parts. First, auditors receive additional initial instructions that state: “One cue found to be useful in detecting deception in these CEO responses is cognitive dissonance. Cognitive dissonance is the negative, uncomfortable emotion a person feels when they are saying something that they know is not true. Those experiencing cognitive dissonance feel uncomfortable, uneasy, and bothered.” Second, after answering our principal dependent measure, these auditors assess “how much cognitive dissonance the CEO felt during this excerpt of the conference call.” Negative Affect Instruction is an indicator variable that equals 1 when both of these components are present and 0 otherwise. The fraud rate is set exogenously at 50% (Fraud Company = 1).
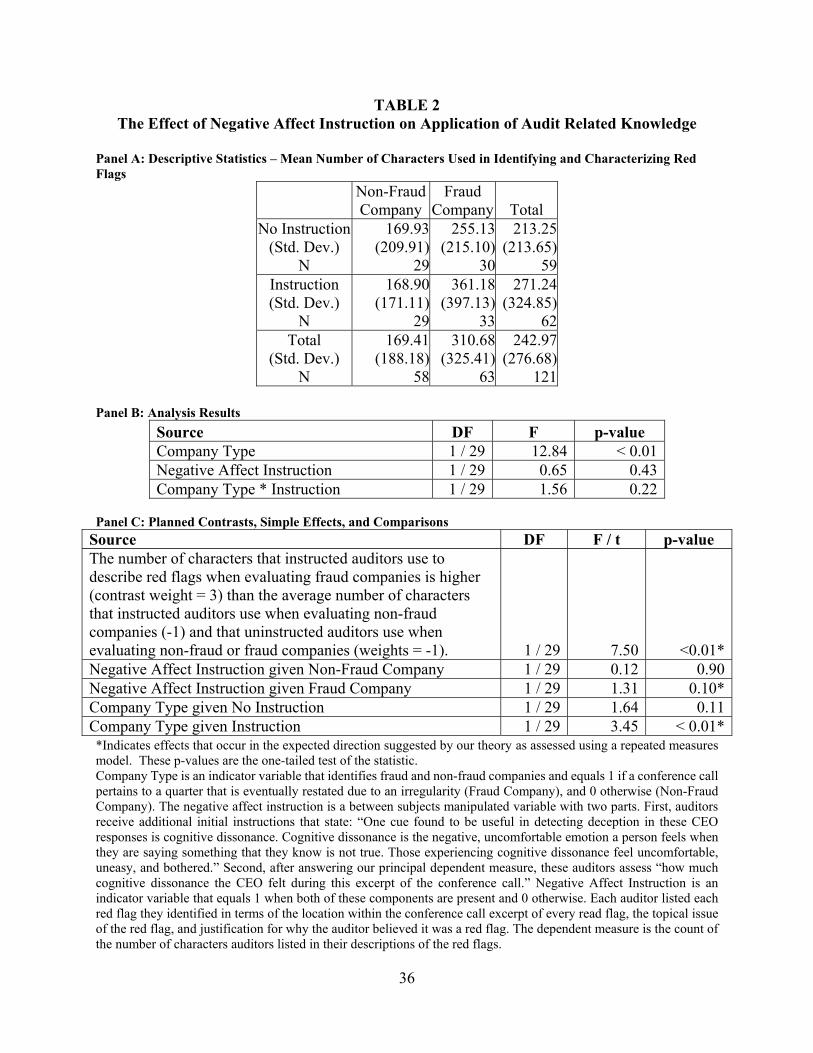
36
TABLE 2 The Effect of Negative Affect Instruction on Application of Audit Related Knowledge
Panel A: Descriptive Statistics – Mean Number of Characters Used in Identifying and Characterizing Red Flags
Non-Fraud Company
Fraud Company Total
No Instruction (Std. Dev.)
N
169.93(209.91)
29
255.13(215.10)
30
213.25(213.65)
59Instruction (Std. Dev.)
N
168.90(171.11)
29
361.18(397.13)
33
271.24(324.85)
62Total
(Std. Dev.) N
169.41(188.18)
58
310.68(325.41)
63
242.97(276.68)
121 Panel B: Analysis Results
Source DF F p-value Company Type 1 / 29 12.84 < 0.01 Negative Affect Instruction 1 / 29 0.65 0.43 Company Type * Instruction 1 / 29 1.56 0.22
Panel C: Planned Contrasts, Simple Effects, and Comparisons
Source DF F / t p-value The number of characters that instructed auditors use to describe red flags when evaluating fraud companies is higher (contrast weight = 3) than the average number of characters that instructed auditors use when evaluating non-fraud companies (-1) and that uninstructed auditors use when evaluating non-fraud or fraud companies (weights = -1). 1 / 29 7.50 <0.01* Negative Affect Instruction given Non-Fraud Company 1 / 29 0.12 0.90 Negative Affect Instruction given Fraud Company 1 / 29 1.31 0.10* Company Type given No Instruction 1 / 29 1.64 0.11 Company Type given Instruction 1 / 29 3.45 < 0.01*
*Indicates effects that occur in the expected direction suggested by our theory as assessed using a repeated measures model. These p-values are the one-tailed test of the statistic. Company Type is an indicator variable that identifies fraud and non-fraud companies and equals 1 if a conference call pertains to a quarter that is eventually restated due to an irregularity (Fraud Company), and 0 otherwise (Non-Fraud Company). The negative affect instruction is a between subjects manipulated variable with two parts. First, auditors receive additional initial instructions that state: “One cue found to be useful in detecting deception in these CEO responses is cognitive dissonance. Cognitive dissonance is the negative, uncomfortable emotion a person feels when they are saying something that they know is not true. Those experiencing cognitive dissonance feel uncomfortable, uneasy, and bothered.” Second, after answering our principal dependent measure, these auditors assess “how much cognitive dissonance the CEO felt during this excerpt of the conference call.” Negative Affect Instruction is an indicator variable that equals 1 when both of these components are present and 0 otherwise. Each auditor listed each red flag they identified in terms of the location within the conference call excerpt of every read flag, the topical issue of the red flag, and justification for why the auditor believed it was a red flag. The dependent measure is the count of the number of characters auditors listed in their descriptions of the red flags.
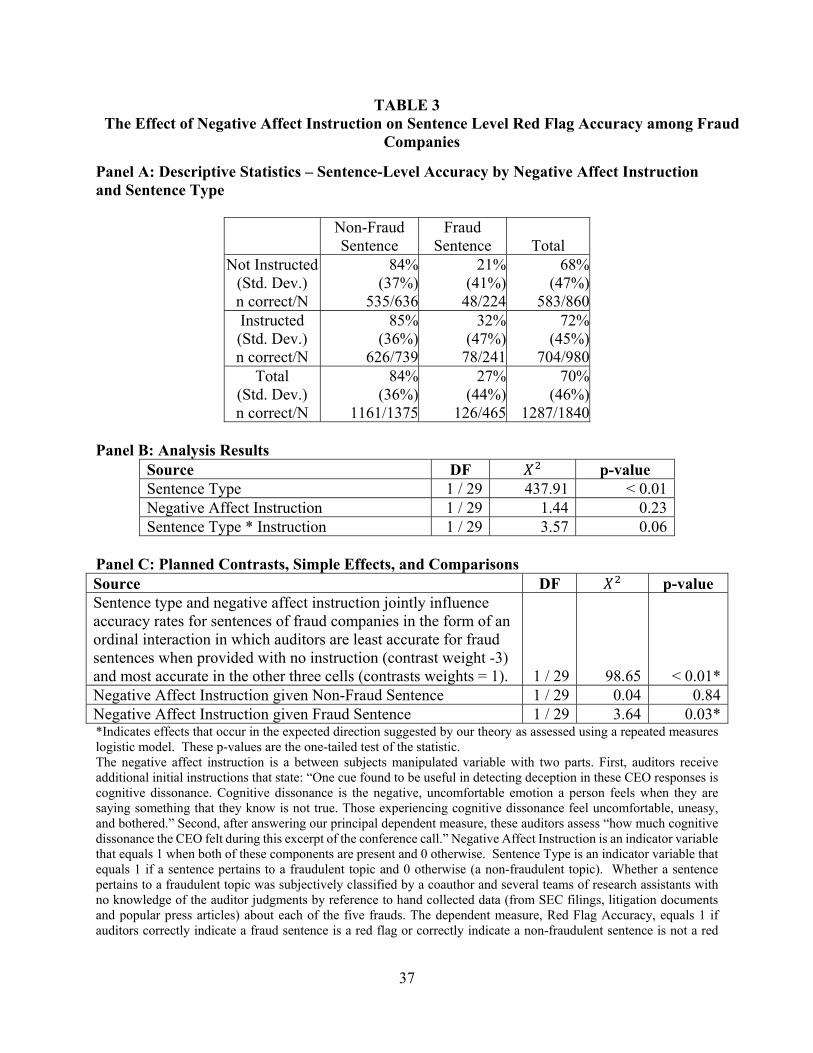
37
TABLE 3 The Effect of Negative Affect Instruction on Sentence Level Red Flag Accuracy among Fraud
Companies
Panel A: Descriptive Statistics – Sentence-Level Accuracy by Negative Affect Instruction and Sentence Type
Non-Fraud Sentence
Fraud Sentence Total
Not Instructed (Std. Dev.) n correct/N
84%(37%)
535/636
21%(41%)
48/224
68%(47%)
583/860Instructed (Std. Dev.) n correct/N
85%(36%)
626/739
32%(47%)
78/241
72%(45%)
704/980Total
(Std. Dev.) n correct/N
84%(36%)
1161/1375
27%(44%)
126/465
70%(46%)
1287/1840 Panel B: Analysis Results
Source DF p-value Sentence Type 1 / 29 437.91 < 0.01 Negative Affect Instruction 1 / 29 1.44 0.23 Sentence Type * Instruction 1 / 29 3.57 0.06
Panel C: Planned Contrasts, Simple Effects, and Comparisons Source DF p-value Sentence type and negative affect instruction jointly influence accuracy rates for sentences of fraud companies in the form of an ordinal interaction in which auditors are least accurate for fraud sentences when provided with no instruction (contrast weight -3) and most accurate in the other three cells (contrasts weights = 1). 1 / 29 98.65 < 0.01* Negative Affect Instruction given Non-Fraud Sentence 1 / 29 0.04 0.84 Negative Affect Instruction given Fraud Sentence 1 / 29 3.64 0.03* *Indicates effects that occur in the expected direction suggested by our theory as assessed using a repeated measures logistic model. These p-values are the one-tailed test of the statistic. The negative affect instruction is a between subjects manipulated variable with two parts. First, auditors receive additional initial instructions that state: “One cue found to be useful in detecting deception in these CEO responses is cognitive dissonance. Cognitive dissonance is the negative, uncomfortable emotion a person feels when they are saying something that they know is not true. Those experiencing cognitive dissonance feel uncomfortable, uneasy, and bothered.” Second, after answering our principal dependent measure, these auditors assess “how much cognitive dissonance the CEO felt during this excerpt of the conference call.” Negative Affect Instruction is an indicator variable that equals 1 when both of these components are present and 0 otherwise. Sentence Type is an indicator variable that equals 1 if a sentence pertains to a fraudulent topic and 0 otherwise (a non-fraudulent topic). Whether a sentence pertains to a fraudulent topic was subjectively classified by a coauthor and several teams of research assistants with no knowledge of the auditor judgments by reference to hand collected data (from SEC filings, litigation documents and popular press articles) about each of the five frauds. The dependent measure, Red Flag Accuracy, equals 1 if auditors correctly indicate a fraud sentence is a red flag or correctly indicate a non-fraudulent sentence is not a red

38
flag, and 0 otherwise. The fraud rate, which is unknown to participants, equals 465/1840 = 25.3% (Fraud Sentence = 1).