Improving engagement and attainment in maths and English ... · Research and project report ......
149
Improving engagement and attainment in maths and English courses: insights from behavioural research Research and project report February 2018 Susannah Hume, Fionnuala O’Reilly, Bibi Groot, Raj Chande, Michael Sanders, Andy Hollingsworth, Janna Ter Meer, Jessica Barnes, Samantha Booth, Eliza Kozman and Xian-Zhi Soon
Transcript of Improving engagement and attainment in maths and English ... · Research and project report ......
Improving engagement and attainment in maths and English courses: insights from behavioural research Research and project report
February 2018
Susannah Hume, Fionnuala O’Reilly, Bibi Groot, Raj Chande, Michael Sanders, Andy Hollingsworth, Janna Ter Meer, Jessica Barnes, Samantha Booth, Eliza Kozman and Xian-Zhi Soon
2
Contents List of figures 4
List of tables 6
Acknowledgements 9
Executive summary 10
Adult numeracy and literacy in England and the rationale for ASK 10
Summary of interventions in FE colleges 11
Summary of interventions with employers 11
Summary of interventions in communities 12
Conclusion 12
1. Introduction 13
1.1 The importance of maths and English 13
1.2 The Behavioural Research Centre for Adult Skills and Knowledge (ASK) 15
1.3 Barriers to engaging with maths and English 16
1.4 Literature review 16
1.5 How to use this report 17
2. Behavioural interventions in FE 18
2.1 Scoping 18
2.2 Implemented interventions 18
2.2.1 Text messages to improve attendance and success 19
2.2.2 Building grit, reinforcing positive identity, and leveraging social support trial 24
2.2.3 Using customised communications to encourage student success 53
2.3 Project that was not taken forward 70
2.3.1 The World Wellbeing Project 70
2.4 Impact and significance 74
3. Research to improve participation in maths and English courses in the workplace 75
3.1 Scoping 75
3.2. Implemented projects or trials 78
3.2.1 Testing job-search benefits of Level 2 qualifications 78
3.2.2 Prompts alongside payslips with Lincolnshire Co-operative 83
3
3.2.3 Nudging managers in Cambridge University Hospitals Trust 87
3.2.3 Peer referrals to training in Transport for London 93
3.2.4 Purpose for Learning 97
3.2.5 Qualitative research on workplace learning 101
3.3 Projects that were not taken forward 104
3.3.1 Piloting payslip messages – Transport for London 104
3.3.2 Piloting a workplace skills conversation 105
3.4 Impact and significance 107
4. Community learning 110
4.1 Scoping 110
4.2 Implemented projects 110
4.2.1 Children’s centres recruitment 110
4.2.2 Children’s centres retention 114
4.2.3 Analysing predictors of success in online English and maths courses 122
4.3 Projects that were not taken forward 130
4.3.1 Boosting maths and English engagement of the homeless: Crisis 130
4.3.2 Helping young people into education or employment: a collaboration with Resurgo Spear 131
4.3.3 Prince’s Trust 133
4.3 Impact and significance 134
5. Laboratory and online experiments 135
5.1 Scoping 135
5.2 Implemented projects 136
5.2.1 Testing different forms of feedback 136
5.2.2 Influencing confidence through implicit communication of effort 139
5.3 Impact and significance 145
6. Conclusion 146
4
List of figures Figure 1: Text messages to improve attendance and success trial- overall average attendance and achievement by treatment assignment 24
Figure 2: Retention and Success trial - randomisation for VA/Grit colleges 30
Figure 3: Retention and Success Trial - randomisation for Study Supporter colleges 31
Figure 4: Randomisation for mixed colleges 32
Figure 5: Effects of Values Affirmation intervention on mid-year and full-year attendance 36
Figure 6: Effects of Values Affirmation intervention on proportion of students passing all exams 39
Figure 7: Effects of Grit intervention on mid-year and full-year attendance 42
Figure 8: Effect of Grit intervention on proportion of students passing all exams 45
Figure 9: Effect of Study Supporter on mid-year and full-year attendance 48
Figure 10: Effects of Study Supporter intervention on proportion of students passing all exams 50
Figure 11: Project Success intervention 56
Figure 12: Project SUCCESS trial design 59
Figure 13: Impact of the SUCCESS intervention on GCSE attainment (pass/fail), complete case analysis (students we have baseline attainment data for) 65
Figure 14: Impact of the SUCCESS intervention on GCSE attainment (pass/fail), multiple imputation of baseline grade. Retains full sample 65
Figure 15: Impact of the SUCCESS intervention on attendance rates by gender 67
Figure 16: Impact of SUCCESS on learners gaining GCSE qualification by subject 69
Figure 17: Impact of SUCCESS on learners gaining GCSE qualification by gender 69
Figure 18: Lincolnshire Co-operative trial flyer 85
Figure 19: Cambridge University Hospitals Foundation NHS Trust trial sign-up rates 92
Figure 20: Tfl trial take-up percentages 96
5
Figure 21: Course outcomes for soldiers in the Purpose for Learning group, compared to control 101
Figure 22: Barriers to skills investment 103
Figure 23: Mock-up of payslip messages to TfL employees 105
Figure 24: Enrolment across treatments in recruitment trial 114
Figure 25: Intended retention trial design 119
Figure 26: Revised trial design after changes 119
Figure 27: Average percentage of classes attended, for control and incentive groups 120
Figure 28: Week-by-week attendance 122
Figure 29: Number of learners by days between enrolment and ‘actual learning end date’ 125
Figure 30: Distribution of first attempt scores 126
Figure 31: Example of mod task exercise 137
Figure 32: Stages of the trial 138
Figure 33: Time spent practising the task in the lead-up to the final round 139
Figure 34: Materials used in LSE feedback trial 141
6
List of tables Table 1: Text messages to improve attendance and success trial - trial arms ................. 21
Table 2: Text messages to improve attendance and success trial - summary statistics .. 22
Table 3: Primary analysis of the adult learner engagement and retention trial ................ 23
Table 4: Retention and Success trial arms ...................................................................... 28
Table 5: Number of control or Values Affirmation learners for whom we have attendance data, by college and treatment assignment ..................................................................... 35
Table 6: Primary effect of Values Affirmation on attendance ........................................... 35
Table 7: Effects of Values Affirmation on attendance, by course type ............................. 37
Table 8: Effects of Values Affirmation on attendance, split by gender ............................. 37
Table 9: Sample description - achievement ..................................................................... 38
Table 10: Primary effects of Values Affirmation on achievement (linear regression) ...... 38
Table 11: Effects of Values Affirmation on achievement rate, split by course type .......... 40
Table 12: Effects of Values Affirmation on achievement rate, split by gender ................. 40
Table 13: Sample description - attendance ...................................................................... 41
Table 14: Primary effects of Grit on attendance ............................................................... 42
Table 15: Effects of Grit on attendance, split by course type ........................................... 43
Table 16: Sample description - achievement ................................................................... 44
Table 17: Primary effects of Grit on achievement ............................................................ 44
Table 18: Effects of Grit on achievement rate, split by course type ................................. 45
Table 19: Effects of Grit on achievement rate, split by gender ......................................... 46
Table 20: Sample description - attendance ...................................................................... 47
Table 21: Primary effects of Study Supporter on attendance ........................................... 47
Table 22: Effects of Study Supporter on attendance, split by gender and course type .... 48
Table 23: Sample description - achievement ................................................................... 49
7
Table 24: Primary effects of Study Supporter on achievement ........................................ 50
Table 25: Effects of Study Supporter on pass rate, split by course type .......................... 51
Table 26: Effects of Study Supporter on achievement rate, split by gender .................... 51
Table 27: Project Success trial arms ............................................................................... 57
Table 28: Summary statistics of attendance - outcome of Interest .................................. 60
Table 29: Summary statistics of attainment - outcome of Interest ................................... 60
Table 30: Treatment assignment by college .................................................................... 61
Table 31: Nominated Study Supporter categories ........................................................... 61
Table 32: Effects of treatment on attendance rate in treated subject ............................... 62
Table 33: Effect of treatments on pass/fail attainment of GCSE course .......................... 64
Table 34: Effect of treatments on attendance rate, partitioned by subject and gender .... 66
Table 35: Effect of treatments on achievement, partitioned by subject and gender ......... 68
Table 36: Correlation between LIWC and attendance ..................................................... 73
Table 37: CV Project – trial arms ..................................................................................... 81
Table 38: Main results - effects of treatment on contact .................................................. 82
Table 39: Effects of volunteering types, by qualification level .......................................... 83
Table 40: Lincolnshire Co-Operative trial arms ................................................................ 85
Table 41: Primary effects on response rates ................................................................... 86
Table 42: Cambridge University Hospitals Foundation NHS Trust trial arms ................... 90
Table 43: Cambridge University Hospitals Foundation NHS Trust trial impact ................ 91
Table 44: TfL project trial arms ........................................................................................ 95
Table 45: Tfl trial effects................................................................................................... 96
Table 46: Purpose for Learning trial arms ........................................................................ 99
Table 47: Purpose for Learning trial - allocation of participants to treatment arms .......... 99
8
Table 48: Children’s centre recruitment trial arms ......................................................... 113
Table 49: Buddy incentives trial description ................................................................... 117
Table 50: OLS regression results of treatment effects on average attendance ............. 121
Table 51: Online courses analysis - breakdown by gender ............................................ 123
Table 52: Online courses analysis - breakdown by ethnicity .......................................... 123
Table 53: Online courses analysis – breakdown by age ................................................ 123
Table 54: Online courses analysis – breakdown by region ............................................ 124
Table 55: Online courses analysis - breakdown by course for course completers ......... 124
Table 56: Online courses analysis – number of passes by course ................................ 126
Table 57: Regression model of factors associated with a learner’s score on first attempt ....................................................................................................................................... 126
Table 58: Crisis project trial arms .................................................................................. 131
Table 59: Resurgo Spear project trial arms ................................................................... 132
Table 60: LSE feedback project trial arms ..................................................................... 137
Table 61: Primary results from LSE feedback trial ......................................................... 143
Table 62: Primary results from replication study ............................................................ 145
9
Acknowledgements We would like to thank our collaborators for their invaluable intellectual contributions, tireless enthusiasm, guidance and patience. This work would not have been possible without them. In particular we are grateful to Professor Geoffrey Cohen and Michael Schwalbe, Stanford University, Professor Angela Duckworth and Dr Lauren Eskreis-Winkley, University of Pennsylvania, Professor Michael Luca, Harvard Business School, Professor Todd Rogers, Harvard Kennedy School, Professor Silvia Saccardo, Carnegie Mellon University, Dr Johannes Eichstaedt and Professor Andrew Schwartz as well as the ‘World Wellbeing Project’ team, University of Pennsylvania, Professor Heather Kappes and Professor Barbara Fasolo and Dr Jeroen Nieboer, London School of Economics and Political Science, Professor Sarah Smith, University of Bristol, Professor Syon Bhanot, Swarthmore College and David Mallows, Institute of Education, University College London.
Thanks are also due to to our colleagues at the Department for Education (DfE) including Catherine Paulson-Ellis, Eoin Parker, Helen McDaniel, Frank Bowley, Carl Creswell, Jo-Anna Irving, Richard Ward, Yeolanda Lopes, Gillian McFarland, Laura Reed and Alex Barker.
We would like to express our appreciation to the collaborating organisations who played such a vital role in making these projects happen, including the British Army, Lincolnshire Co-operative, Transport for London, the Association of Colleges, not to mention the dedicated staff at the colleges, businesses andChildren’s Centres who went the extra mile to help us deliver this research.
Lastly, at the Behavioural Insights Team (BIT) we would like to thank Elspeth Kirkman, Dr David Halpern, Owain Service, James Watson, Miranda Jackman, David Nolan, Alex Tupper, Dr Oana Borcan, Sean Robinson, Professor Netta Barak-Corren, Professor Elizabeth Linos, Dr Karen Melrose, Lucy Makinson, Pieter Cornel, Jessica Hunt, Ed Fitzhugh, Dr Pantelis Solomon, Chris Larkin, Jessica Heal, Sophie Odenthal, Samuel Hanes and everyone else who has contributed over the last three years.
10
Executive summary In 2014, the Department for Business, Innovation and Skills (BIS) commissioned the Behavioural Insights Team (BIT) to develop and test behavioural interventions to improve participation and completion of maths and English courses. This partnership was referred to as the Behavioural Research Centre for Adult Skills and Knowledge (ASK) for the duration of the work programme. This report provides a full catalogue of the 23 projects undertaken.
Adult numeracy and literacy in England and the rationale for ASK
Just over a quarter of working-aged adults in England have weak numeracy and/or literacy skills: their levels of proficiency are below the level expected of an 11-year old.1 For example, they may struggle to understand medication labels or read a petrol gauge. England compares relatively poorly to high-performing OECD countries, ranking 16th out of 23 in the PIAAC Survey of Adult Skills. These deficiencies have widespread negative implications. Not only do low skill levels hinder productivity and econYomic growth, but they also affect individual and family wellbeing. Many lack the skills needed to perform essential tasks that feed into a fulfilling life, like planning the budget for grocery shopping or supporting a child with their homework.
Successive governments have addressed this problem in different ways, including by reforming the way maths and English are taught in schools, raising the school leaving age,2 requiring students and apprentices who have yet to obtain a standard pass in maths and English GCSE or equivalent to continue to study these subjects alongside other courses, and funding adult learners. These reforms are necessary and can be strengthened by exploring how best to tackle the psychological barriers faced by many learners when participating in post-16 and adult education. Interventions informed by behavioural science can aid learners who did not acquire these skills in school to progress. This rationale underpins the work undertaken by ASK. In this report, we categorise our projects by their domain; Further Education (FE) Colleges; Workplaces; Communities; and Laboratory. We summarise the headline findings from each domain below.
1 Kuczera, M., Field, S., & Windisch, H. C. (2016). Building skills for all: a review of England. 2 The last time the school leaving age was raised was in 2015. This new legislation requires young people to either remain in full time education, take up a apprenticeship/traineeship, or complete part time education along with a traineeship until they turned 18 years old.
11
Summary of interventions in FE colleges
A majority of our work focused on 16-19 year old and adult students enrolled in maths and English courses in Further Education colleges. A number of promising findings emerged. The legacy of these projects is a set of scalable and effective interventions that colleges and other training providers can implement with minimal additional resources.
• Weekly text messages of encouragement to adult learners (aged 19+) enrolled on maths and English courses improved attendance rates by 22 percent (7.4 percentage points, from 34.0 to 41.4 percent) and achievement rates by 16 percent (8.7 percentage points, from 54.5 to 63.2 percent).
• A social support intervention, where we texted updates to learners’ (aged 16+) friends and family about their progress in their maths and English courses, improved attendance rates by 5 percent (3.2 percentage points, from 63.5 to 66.7 percent) and achievement rates by 27 percent (5.9 percentage points, from 22.2 to 28.1 percent).
• An intervention that incorporated weekly text messages of encouragement to learners (aged 16 – 19) and helpful updates to their social supporters improved attainment rates by 24 percent (5.1 percentage points, from 21.1 to 26.2 percent).
• A short writing exercise, where learners reflect on their personal values and why they are important to them, improved attainment in maths and English courses by 25 percent (4.2 percentage points, from 16.7 to 20.9 percent).
Summary of interventions with employers
Workplaces were hypothesised to be a promising channel for intervention as many may want to improve their skill levels to find work or get promoted. However, our findings revealed mixed results indicating that more research may be required to explore how best to optimise behavioural interventions in a work-based setting.
• Recruiting employers are more likely to respond to applicants with GCSEs than equivalent level Functional Skills qualifications. We also found that voluntary experience did not improve response rates from employers.
• Prompting learners in the British Army to reflect on the relevance of their learning increased pass rates by 5 percent (4.9 percentage points, from 86.6 to 91.5 percent).
• Other projects were attempted with a range of employers to encourage participation in maths and English courses, but they received extremely low response rates from employees, indicating this channel may be less promising than hypothesised.
12
Summary of interventions in communities
Much of our target population may not be in work or engaged with learning institutions, but may engage with community settings instead.
• Cash incentives for attending numeracy and literacy classes in Children’s Centres improved attendance by 73 percent (31.7 percentage points, from 43.6 to 75.3 percent).
• As with our workplace projects, community projects were challenging to implement due to small sample sizes and sporadic data practices.
Conclusion
Our work in FE colleges was our most substantive programme and leaves a legacy of high-impact, cost-effective and innovative interventions that can be implemented with minimal time, training or financial resources for colleges and other training providers. Results from our work in other domains were more mixed, but no less insightful for policymakers seeking to learn which behavioural levers are most likely to have the strongest impact on improving skill levels. Lastly, although this report has largely focused on our trials and evaluations, an important contribution by ASK has been to introduce FE and the adult learning sector to the rigorous evaluation methods that are ultimately needed if we are to continue to build and share knowledge on what works to improve skills. Although we believe behavioural science has a part to play, it is this increasing experience of the culture of evaluation that we believe will be the most enduring legacy of ASK.
Specific guidance on how practitioners and policymakers might look to introduce many of the findings from ASK’s research is available in a separate report, Retention and Success in Maths and English: A Practitioner Guide to Applying Behavioural Insights.3
3 Available at: www.behaviouralinsights.co.uk/publications/retention-and-success-in-maths-and-english-a-practitioner-guide-to-applying-behavioural-insights
13
1. Introduction Behavioural science has had a profound impact on how we think about some of modern society’s most pressing challenges, ranging from combating obesity through to encouraging people to save for their retirement. However, as leading economists Steven Levitt, John List, Susanne Neckermann and Sally Sadoff note, education is “one area where behavioral economics has made only limited inroads.”4 This is particularly true in the area of post-16 and adult education, which is generally studied less by researchers. However, these authors also note that education is “an area where the insights gained from behavioral economics might be especially great.”5
This report summarises the results of a programme of work that includes a number of pioneering studies with behavioural science interventions that have been shown to improve engagement and attainment in education.
Richard Thaler, recipient of the 2017 Nobel Memorial Prize in Economic Sciences wrote in his 2015 book Misbehaving that “we need to run experiments to figure out how to improve [in education], and have only just started doing so.”6 ASK has been privileged to make a contribution to this journey. This report outlines many successful interventions, as well as a number of unsuccessful ones, and it highlights the importance of trialing and testing to build our knowledge of how to best support learners of all ages.
In the rest of this section, we briefly review the importance of addressing poor maths and English skills in England. We then provide a brief overview of the barriers commonly faced by adult learners and explain how our work programme was designed to overcome these obstacles.
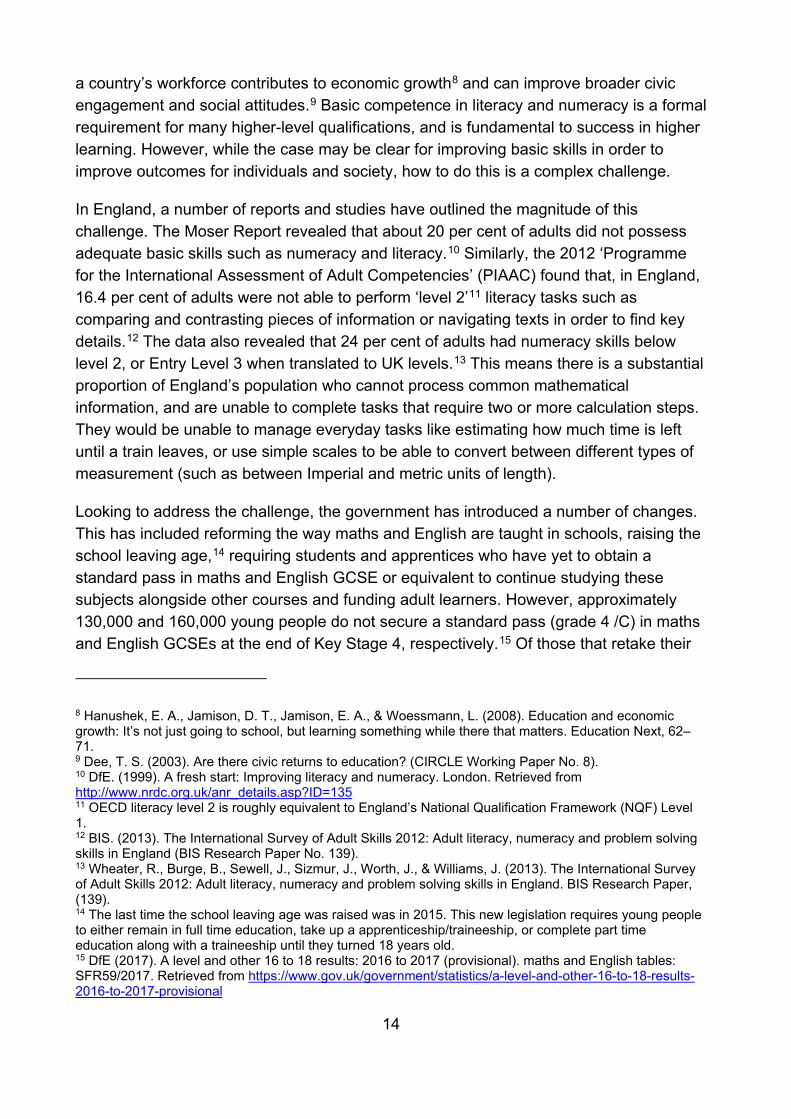
1.1 The importance of maths and English Having an adequate level of literacy and numeracy is associated with a reduced likelihood of economic disadvantage, unemployment, and poor health.7 These skills also enable individuals to deal with day-to-day life, to play an active role in their communities, and to engage effectively in the workplace. Low numeracy and literacy in the population also has broader implications for the community and society. Improving the skills level in
4 Levitt, Steven D., John A. List, Susanne Neckermann, and Sally Sadoff. 2016. "The Behavioralist Goes to School: Leveraging Behavioral Economics to Improve Educational Performance." American Economic Journal: Economic Policy, 8(4): 183-219, p 183. 5 Ibid, p 183. 6 Thaler, R, Misbehaving: The Story of Behavioral Economics, New York, W.W. Norton & Company, Inc, 2015, p 355. 7 OECD. (2013). Skilled for Life? Key Findings from the Survey of Adult Skills. https://doi.org/10.1787/9789264204027-en
14
a country’s workforce contributes to economic growth8 and can improve broader civic engagement and social attitudes.9 Basic competence in literacy and numeracy is a formal requirement for many higher-level qualifications, and is fundamental to success in higher learning. However, while the case may be clear for improving basic skills in order to improve outcomes for individuals and society, how to do this is a complex challenge.
In England, a number of reports and studies have outlined the magnitude of this challenge. The Moser Report revealed that about 20 per cent of adults did not possess adequate basic skills such as numeracy and literacy.10 Similarly, the 2012 ‘Programme for the International Assessment of Adult Competencies’ (PIAAC) found that, in England, 16.4 per cent of adults were not able to perform ‘level 2’11 literacy tasks such as comparing and contrasting pieces of information or navigating texts in order to find key details.12 The data also revealed that 24 per cent of adults had numeracy skills below level 2, or Entry Level 3 when translated to UK levels.13 This means there is a substantial proportion of England’s population who cannot process common mathematical information, and are unable to complete tasks that require two or more calculation steps. They would be unable to manage everyday tasks like estimating how much time is left until a train leaves, or use simple scales to be able to convert between different types of measurement (such as between Imperial and metric units of length).
Looking to address the challenge, the government has introduced a number of changes. This has included reforming the way maths and English are taught in schools, raising the school leaving age,14 requiring students and apprentices who have yet to obtain a standard pass in maths and English GCSE or equivalent to continue studying these subjects alongside other courses and funding adult learners. However, approximately 130,000 and 160,000 young people do not secure a standard pass (grade 4 /C) in maths and English GCSEs at the end of Key Stage 4, respectively.15 Of those that retake their
8 Hanushek, E. A., Jamison, D. T., Jamison, E. A., & Woessmann, L. (2008). Education and economic growth: It’s not just going to school, but learning something while there that matters. Education Next, 62–71. 9 Dee, T. S. (2003). Are there civic returns to education? (CIRCLE Working Paper No. 8). 10 DfE. (1999). A fresh start: Improving literacy and numeracy. London. Retrieved from http://www.nrdc.org.uk/anr_details.asp?ID=135 11 OECD literacy level 2 is roughly equivalent to England’s National Qualification Framework (NQF) Level 1. 12 BIS. (2013). The International Survey of Adult Skills 2012: Adult literacy, numeracy and problem solving skills in England (BIS Research Paper No. 139). 13 Wheater, R., Burge, B., Sewell, J., Sizmur, J., Worth, J., & Williams, J. (2013). The International Survey of Adult Skills 2012: Adult literacy, numeracy and problem solving skills in England. BIS Research Paper, (139). 14 The last time the school leaving age was raised was in 2015. This new legislation requires young people to either remain in full time education, take up a apprenticeship/traineeship, or complete part time education along with a traineeship until they turned 18 years old. 15 DfE (2017). A level and other 16 to 18 results: 2016 to 2017 (provisional). maths and English tables: SFR59/2017. Retrieved from https://www.gov.uk/government/statistics/a-level-and-other-16-to-18-results-2016-to-2017-provisional
15
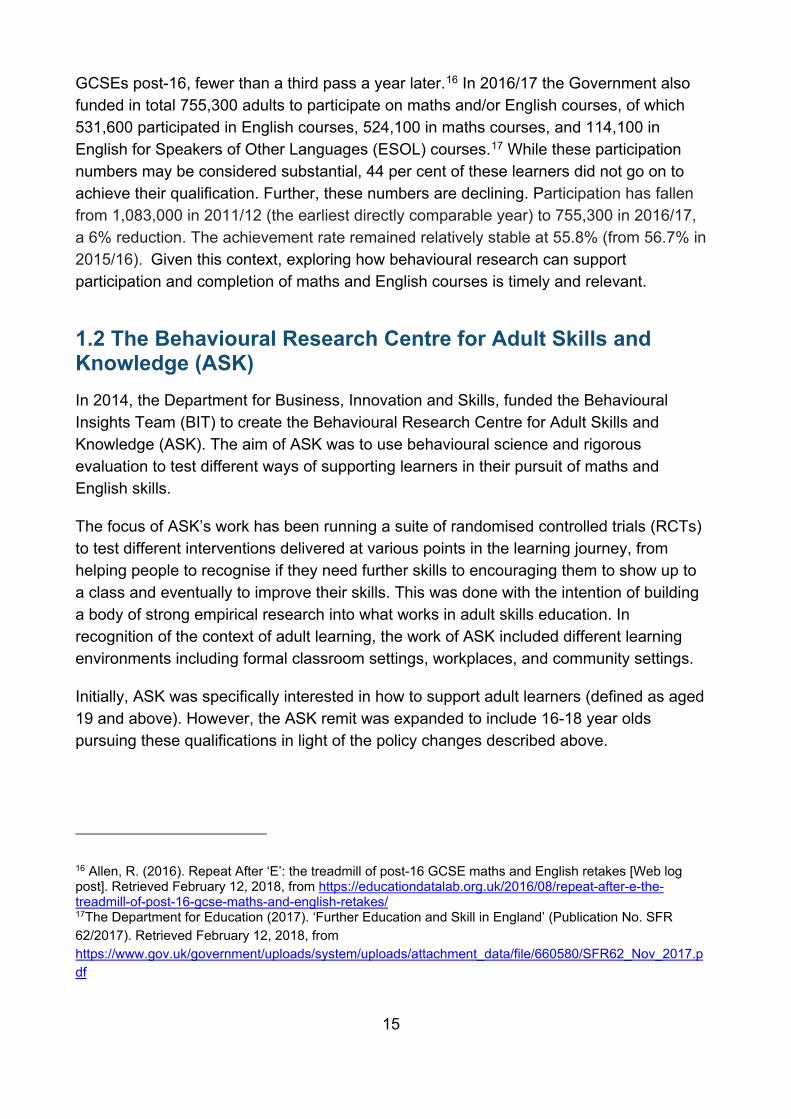
GCSEs post-16, fewer than a third pass a year later.16 In 2016/17 the Government also funded in total 755,300 adults to participate on maths and/or English courses, of which 531,600 participated in English courses, 524,100 in maths courses, and 114,100 in English for Speakers of Other Languages (ESOL) courses.17 While these participation numbers may be considered substantial, 44 per cent of these learners did not go on to achieve their qualification. Further, these numbers are declining. Participation has fallen from 1,083,000 in 2011/12 (the earliest directly comparable year) to 755,300 in 2016/17, a 6% reduction. The achievement rate remained relatively stable at 55.8% (from 56.7% in 2015/16). Given this context, exploring how behavioural research can support participation and completion of maths and English courses is timely and relevant.
1.2 The Behavioural Research Centre for Adult Skills and Knowledge (ASK) In 2014, the Department for Business, Innovation and Skills, funded the Behavioural Insights Team (BIT) to create the Behavioural Research Centre for Adult Skills and Knowledge (ASK). The aim of ASK was to use behavioural science and rigorous evaluation to test different ways of supporting learners in their pursuit of maths and English skills.
The focus of ASK’s work has been running a suite of randomised controlled trials (RCTs) to test different interventions delivered at various points in the learning journey, from helping people to recognise if they need further skills to encouraging them to show up to a class and eventually to improve their skills. This was done with the intention of building a body of strong empirical research into what works in adult skills education. In recognition of the context of adult learning, the work of ASK included different learning environments including formal classroom settings, workplaces, and community settings.
Initially, ASK was specifically interested in how to support adult learners (defined as aged 19 and above). However, the ASK remit was expanded to include 16-18 year olds pursuing these qualifications in light of the policy changes described above.
16 Allen, R. (2016). Repeat After ‘E’: the treadmill of post-16 GCSE maths and English retakes [Web log post]. Retrieved February 12, 2018, from https://educationdatalab.org.uk/2016/08/repeat-after-e-the-treadmill-of-post-16-gcse-maths-and-english-retakes/ 17The Department for Education (2017). ‘Further Education and Skill in England’ (Publication No. SFR 62/2017). Retrieved February 12, 2018, from https://www.gov.uk/government/uploads/system/uploads/attachment_data/file/660580/SFR62_Nov_2017.pdf
16
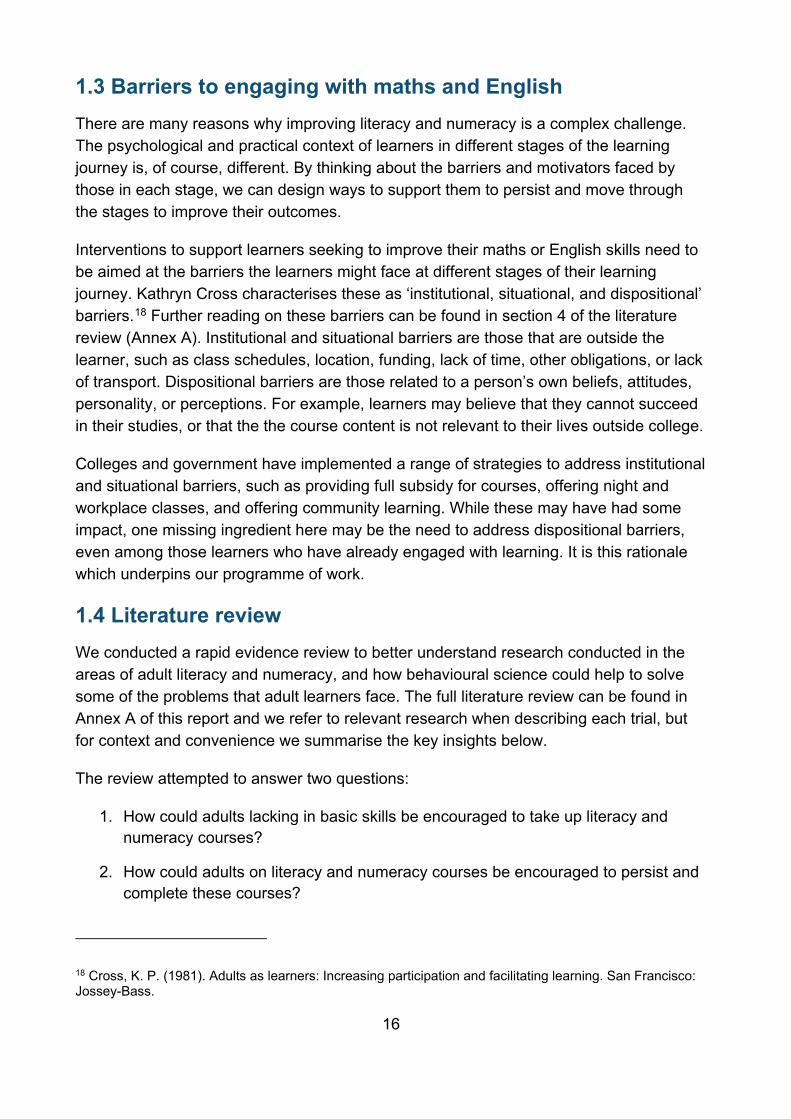
1.3 Barriers to engaging with maths and English There are many reasons why improving literacy and numeracy is a complex challenge. The psychological and practical context of learners in different stages of the learning journey is, of course, different. By thinking about the barriers and motivators faced by those in each stage, we can design ways to support them to persist and move through the stages to improve their outcomes.
Interventions to support learners seeking to improve their maths or English skills need to be aimed at the barriers the learners might face at different stages of their learning journey. Kathryn Cross characterises these as ‘institutional, situational, and dispositional’ barriers.18 Further reading on these barriers can be found in section 4 of the literature review (Annex A). Institutional and situational barriers are those that are outside the learner, such as class schedules, location, funding, lack of time, other obligations, or lack of transport. Dispositional barriers are those related to a person’s own beliefs, attitudes, personality, or perceptions. For example, learners may believe that they cannot succeed in their studies, or that the the course content is not relevant to their lives outside college.
Colleges and government have implemented a range of strategies to address institutional and situational barriers, such as providing full subsidy for courses, offering night and workplace classes, and offering community learning. While these may have had some impact, one missing ingredient here may be the need to address dispositional barriers, even among those learners who have already engaged with learning. It is this rationale which underpins our programme of work.
1.4 Literature review We conducted a rapid evidence review to better understand research conducted in the areas of adult literacy and numeracy, and how behavioural science could help to solve some of the problems that adult learners face. The full literature review can be found in Annex A of this report and we refer to relevant research when describing each trial, but for context and convenience we summarise the key insights below.
The review attempted to answer two questions:
1. How could adults lacking in basic skills be encouraged to take up literacy and numeracy courses?
2. How could adults on literacy and numeracy courses be encouraged to persist and complete these courses?
18 Cross, K. P. (1981). Adults as learners: Increasing participation and facilitating learning. San Francisco: Jossey-Bass.
17
The aims of the review were to identify, describe and appraise literature relevant to these two research questions in order to give an overview of the research findings to date and to provide ideas for future research. The intention was to provide an introduction to many different relevant areas that could be used as a basis for the development of ideas for future research. In subsequent years, we used the review to prioritise areas of interest and to inform future projects based on the evidence base at that time.
The review highlighted that there are many different ways in which adults can be encouraged to participate and persist in basic skills learning. However, little is known about what strategy or combination of strategies are most effective due to a general lack of research in this area and a lack of robust evaluations in particular. Although many researchers have called for the use of RCTs in adult education, these are rare, which means research in the sector is not sufficiently robust to draw reliable conclusions. Many studies evaluate initiatives and interventions using only qualitative methods or self-reported outcomes, if they have been evaluated at all. Given this absence of causal evidence, the review strongly supported our objective of producing strong empirical research in the area.
1.5 How to use this report This report brings together all of the work conducted by ASK. We categorise projects under four themes - Further Education, Workplace, Community, and Laboratory. For each project, we provide relevant background information and the theoretical underpinnings of the intervention, as well as the reasons we believed it would work for the specific context. We then describe the implementation of the the intervention, the analytical strategy, and the results. In instances where a RCT was not feasible, we describe why this was so and what this means for similar initiatives in the future.
Our structure provides a thorough catalogue of our work, with completeness prioritised above narrative power. This means our language is often precise, but dispassionate, especially in its description of our analytical strategies and results. Technical details are often repeated for thoroughness and presented sequentially to help the guide the reader through the underlying logic of the trial. We have attempted to maintain a standardised structure across the description of the trials, but there will be some variation where we have prioritised the provision of necessary detail over consistency between subsections.
A separate report, Retention and Success in Maths and English: A Practitioner Guide to Applying Behavioural Insights, contains more details about how an organisation may wish to look to implement some of the findings from this research.19
19 Available at: www.behaviouralinsights.co.uk/publications/retention-and-success-in-maths-and-english-a-practitioner-guide-to-applying-behavioural-insights
18
2. Behavioural interventions in FE
2.1 Scoping To better understand the barriers that learners face at college, BIT conducted in-depth interviews with 103 learners and 20 members of staff at 11 different colleges across England. The interviews involved 41 learners aged 16-18, 62 learners aged 19+, and 20 tutors, administrators, or counselors.
The questions focused on the ‘helpers and hinderers’ to success at college: positive and negative defining moments and challenges inside and outside of college. Interviewers were debriefed after every interview to establish which were the most prominent issues for students. The prevalence of issues was calculated by taking the number of interviews in which an issue was mentioned as a percentage of the total number of interviews.
We provide a non-exhaustive list of the barriers arising from the interviews below:
• Not viewing maths and English as relevant to one’s future career;
• Having a fixed mindset (i.e. believing that their abilities are fixed and cannot be improved upon);
• Being afraid of looking stupid in front of their tutor and peers; and
• Lacking social support for one’s learning
The information gathered in these interviews informed the selection and design of the interventions we ran with FE learners over the course of the ASK grant. They also helped to inform the framing of intervention content to students.
2.2 Implemented interventions In this section, we describe each of the projects we implemented in the FE sector. There were three trials taken forward, one involving text messages to learners with the aim of improving attendance and achievement, a second that had three interventions that included one focused on building ‘grit’, another reinforcing positive identity in learning and one that used text messages to encourage social support. The third trial built on the social support intervention developed in the second trial, with a focus on customised communication.
19
2.2.1 Text messages to improve attendance and success
2.2.1.1 Background
We were interested in adults (aged 19 or above) who had returned to college to study up to a Level 2 English and/or maths qualification (either Functional Skills or GCSE). While many adults enrol in these skills programmes, there are significant barriers to attendance and completion. Many adult learners may have no experience of post compulsory school education or could be returning to education after years out of the system. Moreover, adult learners can also face high opportunity costs to attending. For example, adult learners are more likely to be working and to have children than younger learners.
Informal discussions with prospective trial partner colleges suggested that learners drop out steadily throughout the year, with increased attrition observed after breaks such as Christmas, Easter, or mid-term breaks. We therefore decided that the focus of this intervention would be to reduce drop-out amongst adult learners.
2.2.1.2 Theoretical motivation
Due to their often non-linear educational journeys, many adult learners have ‘fragile learner identities’.20 In comparison to traditional (college-aged) learners, adult report higher levels of math anxiety,21 and a prevalent theme in qualitative research is the feeling that society has labelled them as incompetent learners.22 Some, for example, lack the continuous encouragement needed to persevere and to overcome challenges. Learners, particularly those in non-compulsory education, may need support to develop the routines that lead to regular attendance and work habits.
Text messages are an inexpensive and scalable way of reaching learners at times when they can take advantage of information. There is a growing body of evidence in other fields to suggest that personalised text messages sent directly to participants can have a significant effect on behaviour. For example, such messages have been shown to be an
20 Crossan, B., Field, J., Gallacher, J., & Merrill, B. (2003). Understanding participation in learning for non-traditional adult learners: learning careers and the construction of learning identities. British journal of sociology of education, 24(1), 55-67. 21 Jameson, M. M., & Fusco, B. R. (2014). Math anxiety, math self-concept, and math self-efficacy in adult learners compared to traditional undergraduate students. Adult Education Quarterly, 64(4), 306-322. 22 Tett, L., & Maclachlan, K. (2007). Adult literacy and numeracy, social capital, learner identities and self-confidence. Studies in the Education of Adults, 39(2), 150-167.
20
effective way of improving health outcomes like increasing fruit and vegetable intake,23 reducing risky sexual behaviour,24 and encouraging weight loss.25
2.2.1.3 Intervention
The trial consisted of texting encouragement and, where necessary, reminders of the resumption of classes at the end of holiday periods. Learners received 39 text messages over the course of the trial period (October 2014 to July 2015), sent on behalf of their college. During term time, the texts were sent weekly on Sunday evenings as we hypothesised this is when learners might be planning their week ahead. Learners were texted more frequently during holidays, up to three times per week, to encourage them to stay engaged. The messages required minimal investment on the part of the college, as they were sent via an automated platform and did not require tutors’ time or college resources. Were the intervention to be rolled out for a whole academic year, we estimate the cost would be less than £5 per learner (including the cost of the messages and staff time).
We developed the text messages in collaboration with Professor Michael Luca at Harvard University. The messages were underpinned by several theories of improving educational success from the academic literature, including
• mindset theory (the idea that a person’s ability is not shaped primarily by their talent, but rather by the effort they put into achieving their goal),26
• social belonging (feeling committed to others through a shared interest or way of life),27 and
• the proven benefits of planning.28
23 Norman, G. J., Kolodziejczyk, J. K., Adams, M. A., Patrick, K., & Marshall, S. J. (2013). Fruit and vegetable intake and eating behaviors mediate the effect of a randomized text-message based weight loss program. Preventive medicine, 56(1), 3-7. 24 Suffoletto, B., Akers, A., McGinnis, K. A., Calabria, J., Wiesenfeld, H. C., & Clark, D. B. (2013). A sex risk reduction text-message programme for young adult females discharged from the emergency department. Journal of Adolescent Health, 53(3), 387-393. 25 Napolitano, M. A., Hayes, S., Bennett, G. G., Ives, A. K., & Foster, G. D. (2013). Using Facebook and text messaging to deliver a weight loss programme to college learners. Obesity, 21(1), 25-31. 26 Dweck, C. S., Chiu, C. Y., & Hong, Y. Y. (1995). Implicit theories: Elaboration and extension of the model. Psychological inquiry, 6(4), 322-333. 27 Osterman, K. F. (2000). Learners' need for belonging in the school community. Review of educational research, 70(3), 323-367. 28 Gollwitzer, P. M. (1999). Implementation intentions: Strong effects of simple plans. American psychologist, 54(7), 493.
21
2.2.1.4 Method
We tested the intervention in two colleges - Manchester College and Leicester College - during the academic year 2014/15.29 All learners in our sample were aged 19 or above, and had enrolled in English and/or maths courses. Most learners in the trial were aiming for a Level 2 qualification, although some were studying at Level 1.
Once the colleges had stable class lists (around week 3), we randomly allocated half of the classes to receive the text messages (the treatment group), while the learners in the remaining classes did not receive the text messages (the control group).
2.2.1.5 Trial design
The trial arms are shown in the table below.
Table 1: Text messages to improve attendance and success trial - trial arms
Arm Description
Treatment Weekly text messages of encouragement
Control Business as usual, no text messages
This trial was conducted as a class-level, or ‘clustered’ RCT. This minimised the risk of contamination (likely to be high if randomisation was to occur at the individual level), while preserving statistical power. The trial commenced after the October half-term break of the 2014/15 academic year, allowing for the recruitment of learners into the sample and for the collection of baseline data on attendance.
Our final sample consists of 1,780 adult learners (aged 19 or above), who sat a total of 2,529 exams across 152 classes. Summary statistics of the sample are available below (Table 9). Odd numbers generated during stratification are resolved in favour of the treatment group in all cases, creating a slight numerical imbalance in assignment of classes.
29 There were originally three colleges, but we were unable to contact the third college, despite numerous attempts to collect outcome data.
22
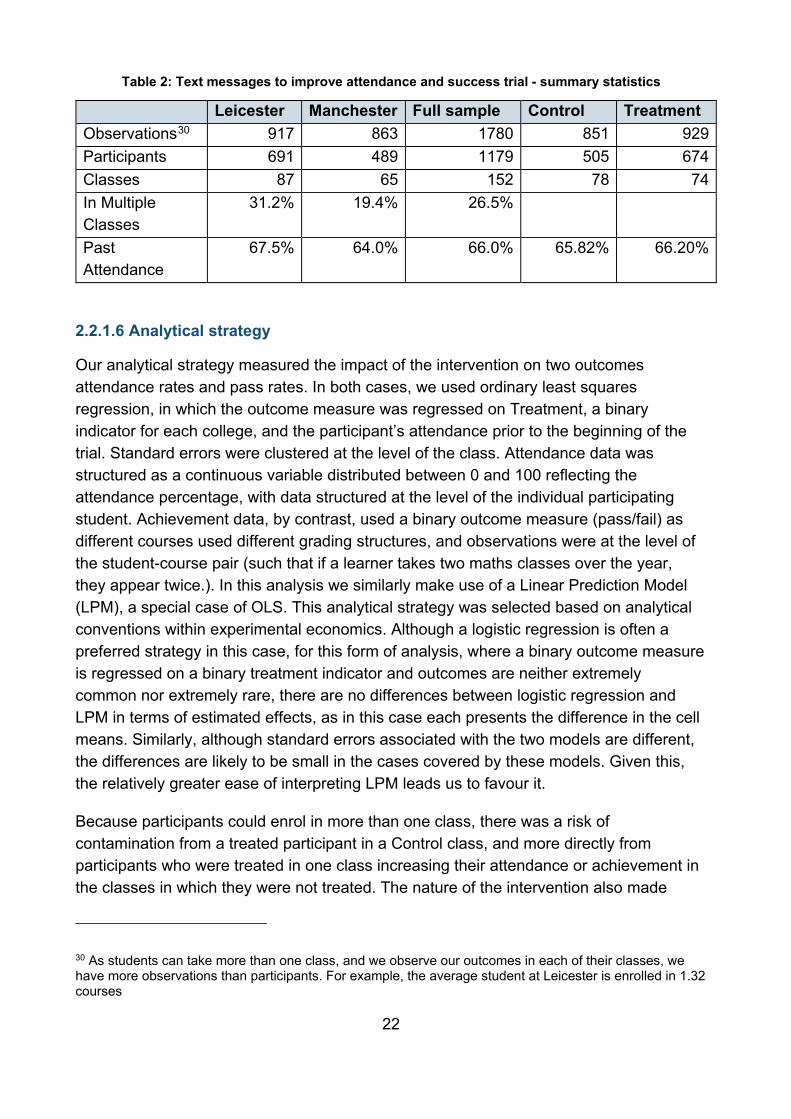
Table 2: Text messages to improve attendance and success trial - summary statistics
Leicester Manchester Full sample Control Treatment Observations30 917 863 1780 851 929 Participants 691 489 1179 505 674 Classes 87 65 152 78 74 In Multiple Classes
31.2% 19.4% 26.5%
Past Attendance
67.5% 64.0% 66.0% 65.82% 66.20%
2.2.1.6 Analytical strategy
Our analytical strategy measured the impact of the intervention on two outcomes attendance rates and pass rates. In both cases, we used ordinary least squares regression, in which the outcome measure was regressed on Treatment, a binary indicator for each college, and the participant’s attendance prior to the beginning of the trial. Standard errors were clustered at the level of the class. Attendance data was structured as a continuous variable distributed between 0 and 100 reflecting the attendance percentage, with data structured at the level of the individual participating student. Achievement data, by contrast, used a binary outcome measure (pass/fail) as different courses used different grading structures, and observations were at the level of the student-course pair (such that if a learner takes two maths classes over the year, they appear twice.). In this analysis we similarly make use of a Linear Prediction Model (LPM), a special case of OLS. This analytical strategy was selected based on analytical conventions within experimental economics. Although a logistic regression is often a preferred strategy in this case, for this form of analysis, where a binary outcome measure is regressed on a binary treatment indicator and outcomes are neither extremely common nor extremely rare, there are no differences between logistic regression and LPM in terms of estimated effects, as in this case each presents the difference in the cell means. Similarly, although standard errors associated with the two models are different, the differences are likely to be small in the cases covered by these models. Given this, the relatively greater ease of interpreting LPM leads us to favour it.
Because participants could enrol in more than one class, there was a risk of contamination from a treated participant in a Control class, and more directly from participants who were treated in one class increasing their attendance or achievement in the classes in which they were not treated. The nature of the intervention also made
30 As students can take more than one class, and we observe our outcomes in each of their classes, we have more observations than participants. For example, the average student at Leicester is enrolled in 1.32 courses
23
spillover effects more likely, given it was looking to improve general attitudes and motivation around learning. As a result, participants in our analysis who were treated at least once were considered to have been treated in all of their classes.
2.2.1.7 Results
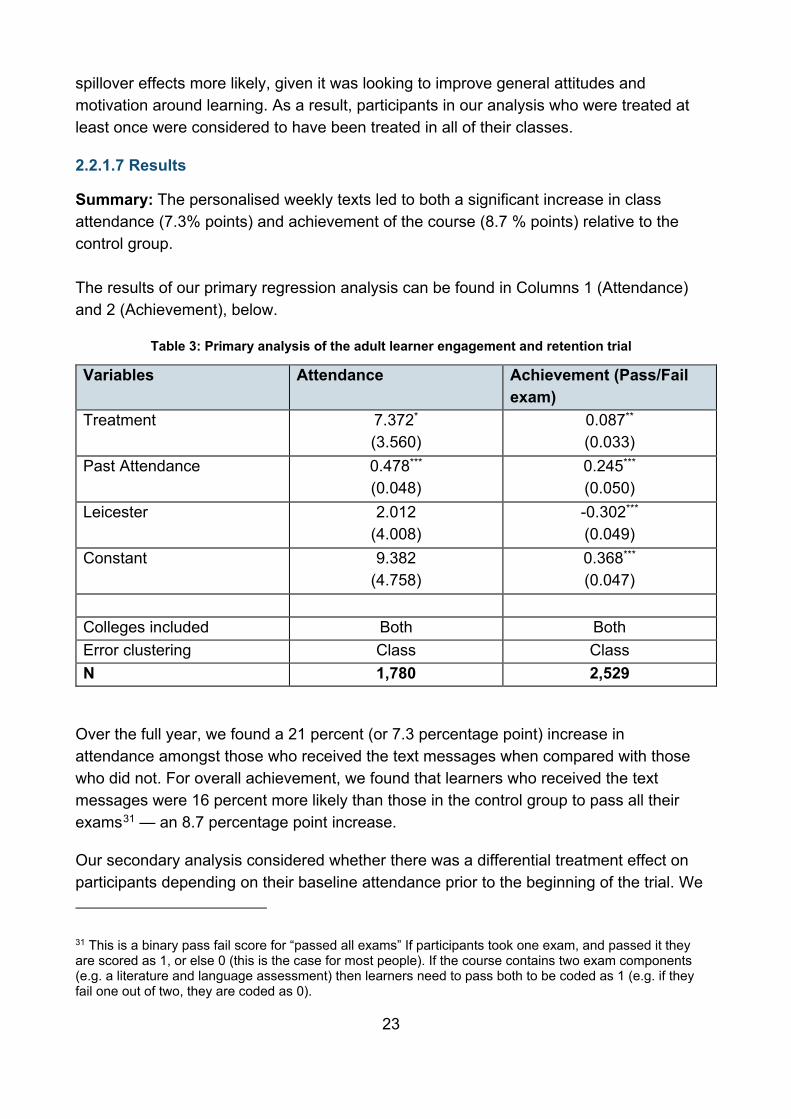
Summary: The personalised weekly texts led to both a significant increase in class attendance (7.3% points) and achievement of the course (8.7 % points) relative to the control group. The results of our primary regression analysis can be found in Columns 1 (Attendance) and 2 (Achievement), below.
Table 3: Primary analysis of the adult learner engagement and retention trial
Variables Attendance Achievement (Pass/Fail exam)
Treatment 7.372* (3.560)
0.087** (0.033)
Past Attendance 0.478*** (0.048)
0.245*** (0.050)
Leicester 2.012 (4.008)
-0.302*** (0.049)
Constant 9.382 (4.758)
0.368*** (0.047)
Colleges included Both Both Error clustering Class Class N 1,780 2,529
Over the full year, we found a 21 percent (or 7.3 percentage point) increase in attendance amongst those who received the text messages when compared with those who did not. For overall achievement, we found that learners who received the text messages were 16 percent more likely than those in the control group to pass all their exams31 — an 8.7 percentage point increase.
Our secondary analysis considered whether there was a differential treatment effect on participants depending on their baseline attendance prior to the beginning of the trial. We 31 This is a binary pass fail score for “passed all exams” If participants took one exam, and passed it they are scored as 1, or else 0 (this is the case for most people). If the course contains two exam components (e.g. a literature and language assessment) then learners need to pass both to be coded as 1 (e.g. if they fail one out of two, they are coded as 0).
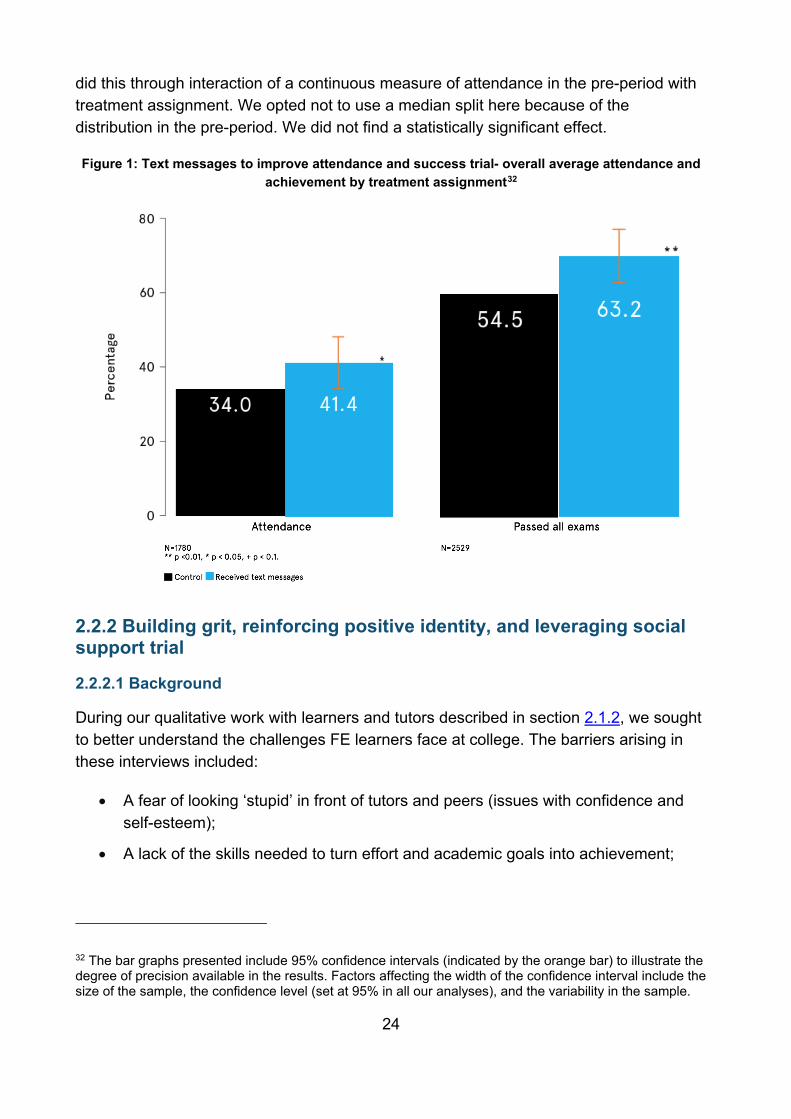
24
did this through interaction of a continuous measure of attendance in the pre-period with treatment assignment. We opted not to use a median split here because of the distribution in the pre-period. We did not find a statistically significant effect.
Figure 1: Text messages to improve attendance and success trial- overall average attendance and achievement by treatment assignment32
2.2.2 Building grit, reinforcing positive identity, and leveraging social support trial
2.2.2.1 Background
During our qualitative work with learners and tutors described in section 2.1.2, we sought to better understand the challenges FE learners face at college. The barriers arising in these interviews included:
• A fear of looking ‘stupid’ in front of tutors and peers (issues with confidence and self-esteem);
• A lack of the skills needed to turn effort and academic goals into achievement;
32 The bar graphs presented include 95% confidence intervals (indicated by the orange bar) to illustrate the degree of precision available in the results. Factors affecting the width of the confidence interval include the size of the sample, the confidence level (set at 95% in all our analyses), and the variability in the sample.
25
• The belief that even hard work and persistence would not help them improve i.e. having a fixed mindset;33
• A lack of social support - many learners reported ‘not knowing who to turn to’ when they were finding college life difficult; and
• Negative attitudes towards maths and English.
In our reviews of the academic literature, we looked for interventions that would help learners to overcome these challenges.
2.2.2.2 Theoretical motivation
To tackle the first theme outlined above, we considered interventions that helped boost confidence and self-esteem so that learners would feel more at ease when at college. One approach to this is to employ ‘Values Affirmation’ (VA) interventions, which build on psychological research regarding identity.34 35 36 Researchers hypothesised that prompting a person to reflect on their own core values – the things that matter most to them in their lives and that give them meaning – might reinforce the strength of that person’s identity such that they do not experience intense feelings of inadequacy or threat when faced with a challenge. By spending some time reflecting on what makes them who they are, and what they care about, the learner might then have an increased ability to take on challenges. This approach was found to be effective in reducing stereotype threat37 among African-American learners in academic settings,38 and in improving the grades of female university learners studying engineering and physics.39 40 Due to its impact in educational environments VA was a strong candidate for use in FE
33 Dweck, C. S., Chiu, C. Y., & Hong, Y. Y. (1995). Implicit theories: Elaboration and extension of the model. Psychological inquiry, 6(4), 322-333. 34 Cohen, G. L., Garcia, J., Purdie-Vaughns, V., Apfel, N., & Brzustoski, P. (2009). Recursive processes in self-affirmation: Intervening to close the minority achievement gap. Science, 324(5925), 400-403. 35 Sherman, D. K., & Cohen, G. L. (2006). The psychology of self‐defense: Self‐affirmation theory. Advances in experimental social psychology, 38, 183-242. 36 Cohen, G. L., & Sherman, D. K. (2014). The psychology of change: self-affirmation and social psychological intervention. Annual Review of Psychology, 65, 333–71. 37 Stereotype threat is being at risk of confirming, as self-characteristic, a negative stereotype about one's group. The term was first described by Steele, C. M., & Aronson, J. (1995). Stereotype threat and the intellectual test performance of African Americans. Journal of Personality and Social Psychology, 69(5), 797-811. 38 Cohen, G. L., Garcia, J., Apfel, N., & Master, A. (2006). Reducing the Racial Achievement Gap: A Social-Psychological Intervention. Science, 313(5791), 1307–1310. 39 Miyake, A., Kost-Smith, L. E., Finkelstein, N. D., Pollock, S. J., Cohen, G. L., & Ito, T. A. (2010). Reducing the gender achievement gap in college science: A classroom study of values affirmation. Science, 330(July), 1234–1237. 40 Walton, G. M., Logel, C., Peach, J. M., Spencer, S. J., & Zanna, M. P. (2015). Two brief interventions to mitigate a “chilly climate” transform women’s experience, relationships, and achievement in engineering. Journal of Educational Psychology, 107(2), 468–485.

26
colleges, particularly because many learners may lack confidence due to negative educational experiences in primary or secondary school.
The second theme which arose frequently in our preparatory work with learners was that many learners simply do not have the right strategies to help them turn a goal into an achievement. This was coupled with the fact that many learners showed signs of having a fixed mindset (i.e. believing that their ability is fixed and cannot really be changed). Grit, considered a ‘essential life’ or ‘non-cognitive’ skill, is defined as one’s ‘passion and perseverance for long term goals’.41 Passion in this sense means sustaining interest in a particular field for long periods of time, whereas perseverance involves having the tenacity, diligence, and resilience to carry on through times of frustration, disappointment and ambiguity. Grit has shown to be correlated with one’s likelihood of persisting in various settings. For example, one study found that ‘grittier’ adult learners (aged 25 and above) recorded higher levels of educational attainment than their less gritty counterparts.42 Researchers in the US are looking for ways to improve grit in school age children and adults alike.43 They have come up with a programme called ‘Deliberate Practice’, which helps learners with goal setting, distractions, and feedback. The programme was effective in a sample of US secondary school students, improving end-of-course grades especially among lower performing students.44 We felt that this intervention could help FE learners to develop strategies to overcome distractions and to understand that mistakes and failures are all part of learning.
Another relevant theme from our qualitative research related to learners’ perceived lack support from others in their studies. Young people who say they have access to supportive parents, peers, and teachers do better in school than those who cannot identify such sources of support.45 46 In particular, parental engagement in learning is strongly and consistently linked to positive outcomes, including reduced absenteeism, higher academic aspirations, life satisfaction, and academic performance.47 48 Having
41 Duckworth, A. L., Peterson, C., Matthews, M. D., & Kelly, D. R. (2007). Grit: perseverance and passion for long-term goals. Journal of personality and social psychology, 92(6), 1087. 42 Duckworth, A. L., Weir, D., Tsukayama, E., & Kwok, D. (2012). Who does well in life? Conscientious adults excel in both objective and subjective success. Frontiers in psychology, 3. 43 https://www.characterlab.org/ 44 Eskreis-Winkler, L., Shulman, E. P., Young, V., Tsukayama, E., Brunwasser, S. M., & Duckworth, A. L. (2016). Using wise interventions to motivate deliberate practice. Journal of personality and social psychology, 111(5), 728. 45 Wentzel, K. R., Russell, S., & Baker, S. (2016). Emotional support and expectations from parents, teachers, and peers predict adolescent competence at school. Journal of Educational Psychology, 108(2), 242. 46 Furrer, C., & Skinner, E. (2003). Sense of relatedness as a factor in children’s academic engagement and performance. Journal of Educational Psychology, 95, 148–162. 47 Fryer Jr, R.G., 2016. The Production of Human Capital in Developed Countries: Evidence from 196 Randomized Field Experiments (No. w22130). National Bureau of Economic Research. 48 Jeynes, W.H., 2007. The relationship between parental involvement and urban secondary school learner academic achievement a meta-analysis. Urban education, 42(1), pp.82-110.
27
meaningful interactions with parents, siblings, other relatives, and friends is associated with positive outcomes.49 However, it is often challenging for those people to know how to engage with the learner’s education in the most effective way. We felt an intervention that activates a learner's’ social network in order to support them in their learning could help them to feel more supported in their studies.
2.2.2.3 Interventions
We developed three different interventions to address the behavioural barriers described above.
2.2.2.3.1 Values Affirmation
We collaborated with Professor Geoffrey Cohen and his team at Stanford University to adapt a VA exercise for our context. The exercise prompted learners to reflect on their personal values - the aspects of their lives that make them feel happy or give them meaning. Learners then wrote about times when these values were particularly important to them. The exercise was intended to help learners reflect on who they are as individuals, and to build their sense of self-integrity. Further reading on learner identity and values can be found in section 2.1of the literature review (Annex A).
2.2.2.3.2 Grit
We collaborated with Professor Angela Duckworth and her team at University of Pennsylvania to develop a ‘Grit’ intervention. We adapted a previous version of the ‘Deep Practice’ modules which had been used in middle schools in the US.50 The intervention taught learners the facets of ‘Deep Practice’ (to set specific goals, focus one’s attention and find feedback) and helped them to plan how they would incorporate Deep Practice into their own lives. Learners also watched motivational videos of well-known celebrities, like Will Smith, who recalled just how much effort and hard work they had to put in everyday in order to become successful. Refer to section 2 of the literature review (Annex A) for further reading on grit and goal setting.
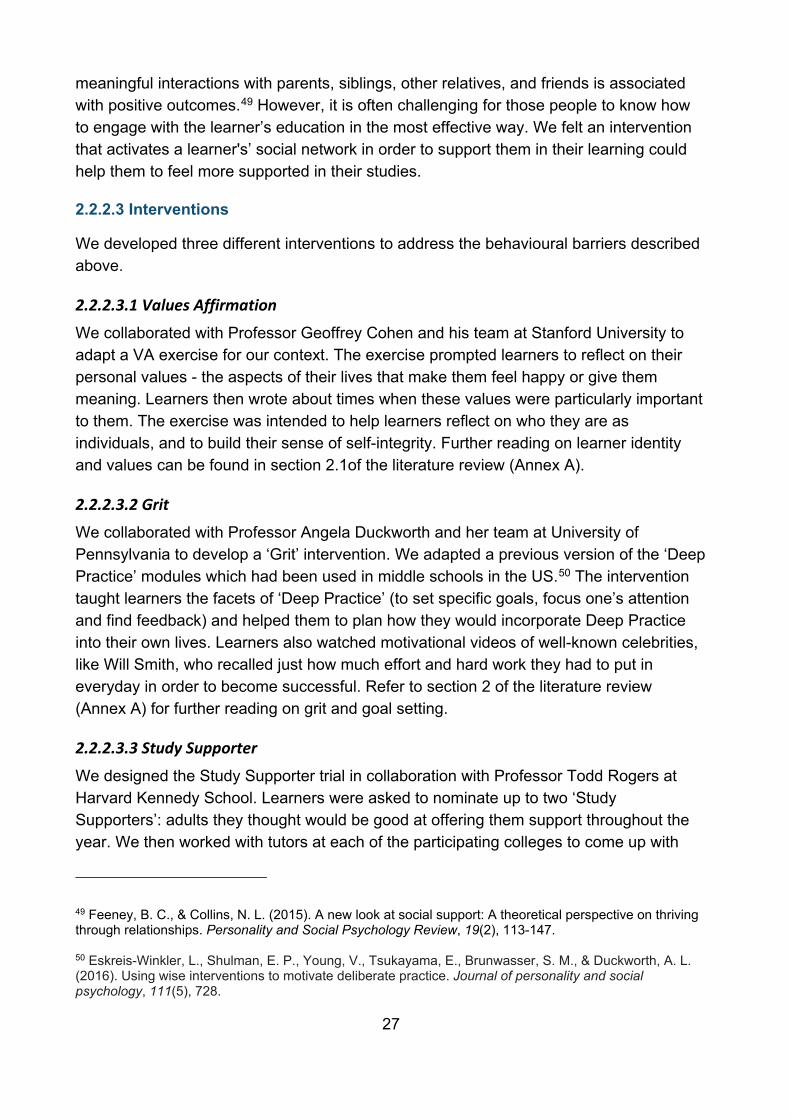
2.2.2.3.3 Study Supporter
We designed the Study Supporter trial in collaboration with Professor Todd Rogers at Harvard Kennedy School. Learners were asked to nominate up to two ‘Study Supporters’: adults they thought would be good at offering them support throughout the year. We then worked with tutors at each of the participating colleges to come up with
49 Feeney, B. C., & Collins, N. L. (2015). A new look at social support: A theoretical perspective on thriving through relationships. Personality and Social Psychology Review, 19(2), 113-147. 50 Eskreis-Winkler, L., Shulman, E. P., Young, V., Tsukayama, E., Brunwasser, S. M., & Duckworth, A. L. (2016). Using wise interventions to motivate deliberate practice. Journal of personality and social psychology, 111(5), 728.
28
content to send to Study Supporters. The texts encouraged the supporters to ask the learner how revision was progressing, to praise the learner’s effort and to wish the learner luck ahead of exams and assessments. Learners allocated to receive the SS intervention completed two online sessions - one at the beginning of the year in which they nominated their Study Supporters and one towards the end of the year in which they provided feedback as to how useful they felt the intervention had been.
2.2.2.4 Method
The Grit and VA interventions were delivered online in maths and English classes in four sessions over the year. No content-specific tutor training was required, but BIT visited each of the participating colleges before the launch of the trial to brief tutors on what they would need to do in class to facilitate the interventions. Tutors were made aware that this was an experiment and therefore the nature of the content could not be revealed until after the project had been concluded.
The online component of the interventions was delivered via ‘Qualtrics’ (an online research tool) which allowed the researchers to track response rates. Each day, we produced a report for each college detailing the classes that were due to complete the intervention on that day, as well as the classes which had completed the intervention the previous day. The text messages were sent via ‘Firetext’ (a commercial text messaging platform) and were sent on a fortnightly basis to learners allocated to the Grit and VA arms and on a weekly basis to those in the SS arm.
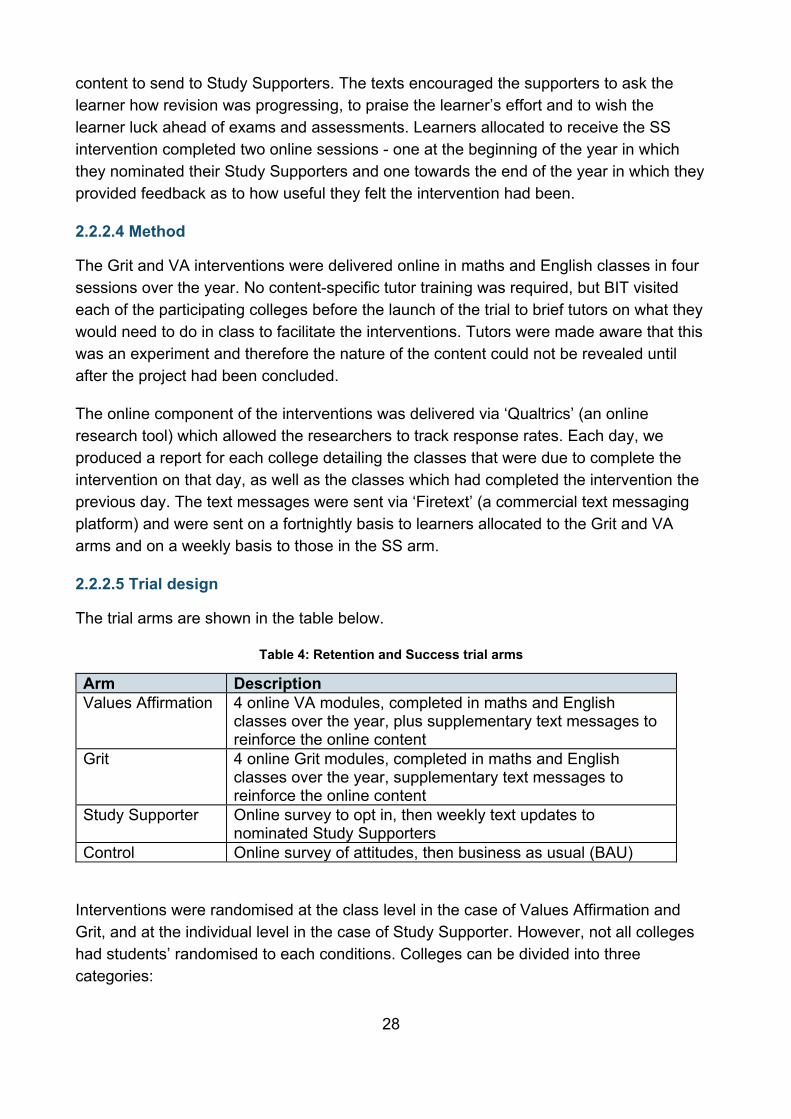
2.2.2.5 Trial design
The trial arms are shown in the table below.
Table 4: Retention and Success trial arms
Arm Description Values Affirmation 4 online VA modules, completed in maths and English
classes over the year, plus supplementary text messages to reinforce the online content
Grit 4 online Grit modules, completed in maths and English classes over the year, supplementary text messages to reinforce the online content
Study Supporter Online survey to opt in, then weekly text updates to nominated Study Supporters
Control Online survey of attitudes, then business as usual (BAU)
Interventions were randomised at the class level in the case of Values Affirmation and Grit, and at the individual level in the case of Study Supporter. However, not all colleges had students’ randomised to each conditions. Colleges can be divided into three categories:
29
1. VA/Grit colleges, 2. SS colleges, and 3. Mixed colleges (where students could receive any of the three interventions).
These allocations were made non-randomly, taking into account the college’s capacity (for example, having enough computers to sit the online modules) and preferences. In order to maximise statistical power, randomisation strategies varied between interventions.
Colleges were randomly assigned as either ‘English’ or ‘maths’ colleges. This assignment did not alter what the colleges taught, but determined which classes within a college were eligible for treatment. This was to reduce the complexity that arose from learners potentially being treated multiple times, potentially in different Treatment conditions. There were 10 ‘English’ and 10 ‘maths’ colleges.
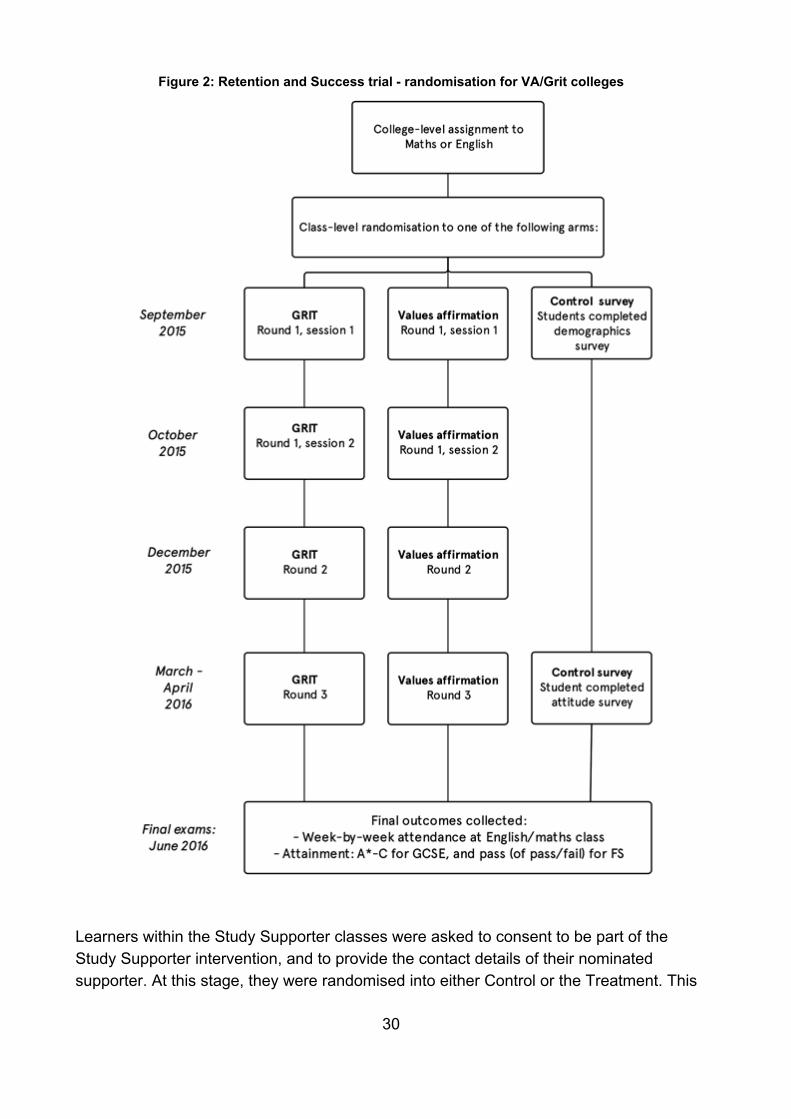
Figure 2 shows the randomised allocation procedure for the Grit/VA colleges. All participants within the VA and Grit classes who attend the class in which it is administered receive the intervention.
30
Figure 2: Retention and Success trial - randomisation for VA/Grit colleges
Learners within the Study Supporter classes were asked to consent to be part of the Study Supporter intervention, and to provide the contact details of their nominated supporter. At this stage, they were randomised into either Control or the Treatment. This
31
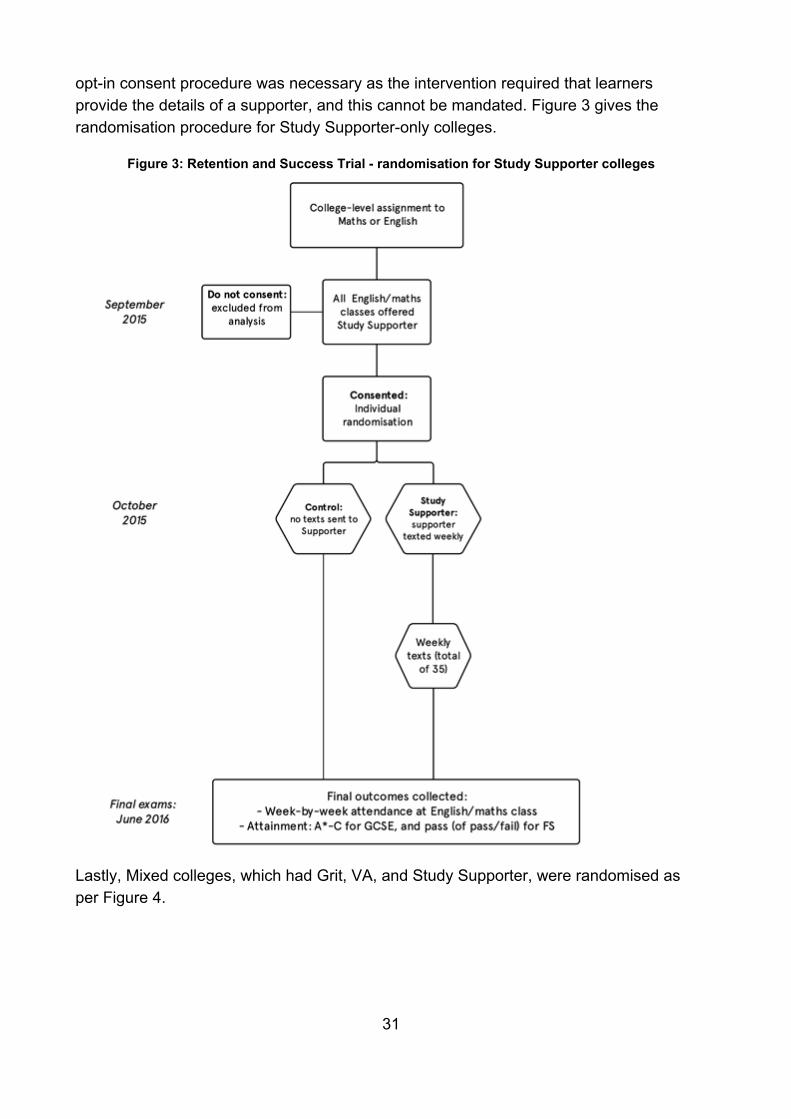
opt-in consent procedure was necessary as the intervention required that learners provide the details of a supporter, and this cannot be mandated. Figure 3 gives the randomisation procedure for Study Supporter-only colleges.
Figure 3: Retention and Success Trial - randomisation for Study Supporter colleges
Lastly, Mixed colleges, which had Grit, VA, and Study Supporter, were randomised as per Figure 4.
32
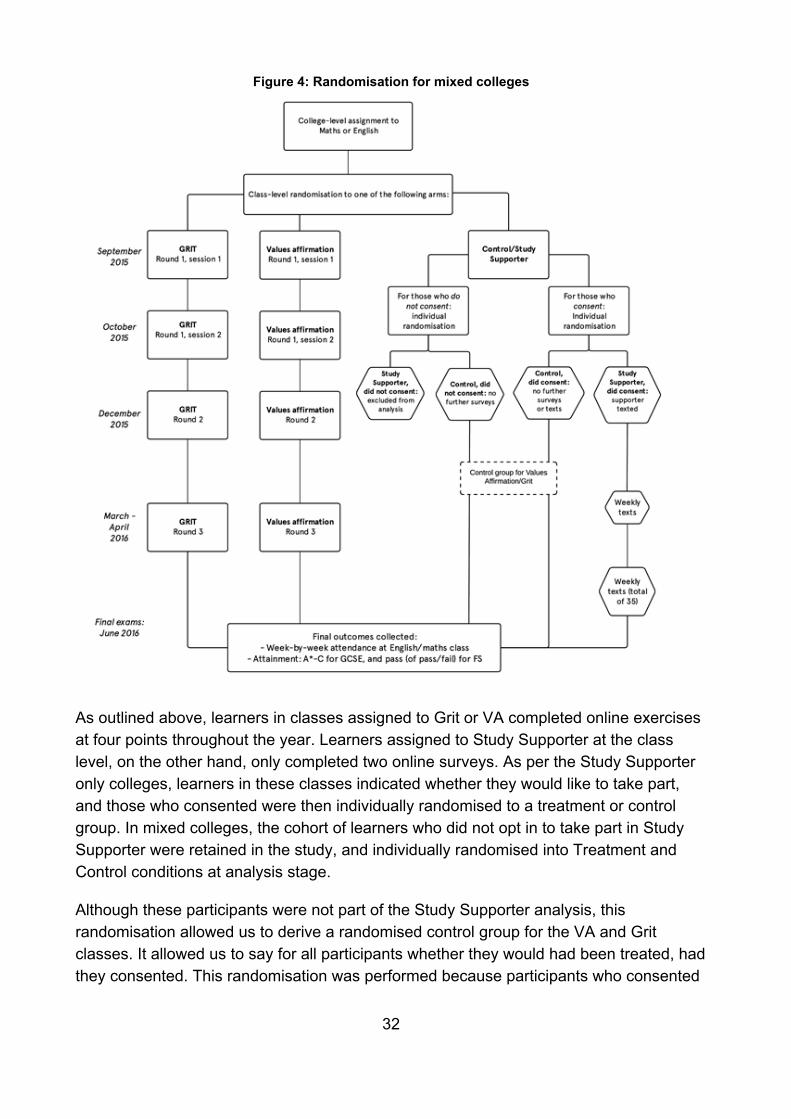
Figure 4: Randomisation for mixed colleges
As outlined above, learners in classes assigned to Grit or VA completed online exercises at four points throughout the year. Learners assigned to Study Supporter at the class level, on the other hand, only completed two online surveys. As per the Study Supporter only colleges, learners in these classes indicated whether they would like to take part, and those who consented were then individually randomised to a treatment or control group. In mixed colleges, the cohort of learners who did not opt in to take part in Study Supporter were retained in the study, and individually randomised into Treatment and Control conditions at analysis stage.
Although these participants were not part of the Study Supporter analysis, this randomisation allowed us to derive a randomised control group for the VA and Grit classes. It allowed us to say for all participants whether they would had been treated, had they consented. This randomisation was performed because participants who consented
33
to participate and were randomised to Study Supporter (either by exclusion, or by including a Study Supporter treatment variable), biased our counterfactual group for Grit and VA away from those who would have consented. Learners who would have been randomised to the Study Supporter treatment group, but who did not consent, were excluded for analysis of VA and Grit. The last group consisted of learners who would have been randomised to the Study Supporter control group, but did not consent. Combining this group with the learners who consented to the Study Supporter but who were randomised to Control, we created our control group for Grit and VA. Individuals in the control group therefore did not receive any of the interventions (neither online, nor through texts).
2.2.2.6 Analytical strategy
Analysis of this trial was conducted separately for each condition, for clarity. Datasets were provided by colleges for attendance and achievement separately, reflecting the different ways in which these sets are structured. Our sample sizes were different between the attendance and achievement analysis for two reasons. First, some colleges who provided attendance data early in the data gathering process, before attainment data were available, were not contactable again subsequently, while some colleges that provided attainment data later in collection had not, and did not, provide attendance data. Secondly, some colleges provided datasets for one or other outcome measure which were unusable; for example, sending maths attainment data in a college where only English learners were treated, or sending attendance data for vocational courses rather than Functional Skills or GCSEs.
Within the attendance dataset, observations corresponded to course-student pairs, such that if a learner takes two maths classes over the year, they appear twice. Attendance was provided on a day-by-day basis, with each date recorded as a variable that indicates whether the student was present on that date, regardless of whether or not they had a class on that day. The data did not contain, for a given course, how many classes the student could have attended. We therefore derived for each course a maximum number of classes that were attended by any student51, and made the simplifying assumption that the most attending student for that class had an attendance rate of 100 percent. We used this maximum to calculate an attendance rate for all other participants in that class.
Our goal was to have our data at the level of the individual student, rather than the course‑student pair level. To achieve this, we calculated the mean attendance by that student in all of the courses for which they had non-zero attendance recorded. If a
51 Within every class, we observe the number of present and missed attendances for all learners. Assuming that within a class all learners have the same number of possible lesson slots, we count who has the highest number of possible attendances (e.g. 40 over a full academic year), and derive the maximum number of classes for their classmates. We do this for every course/classcode.
34
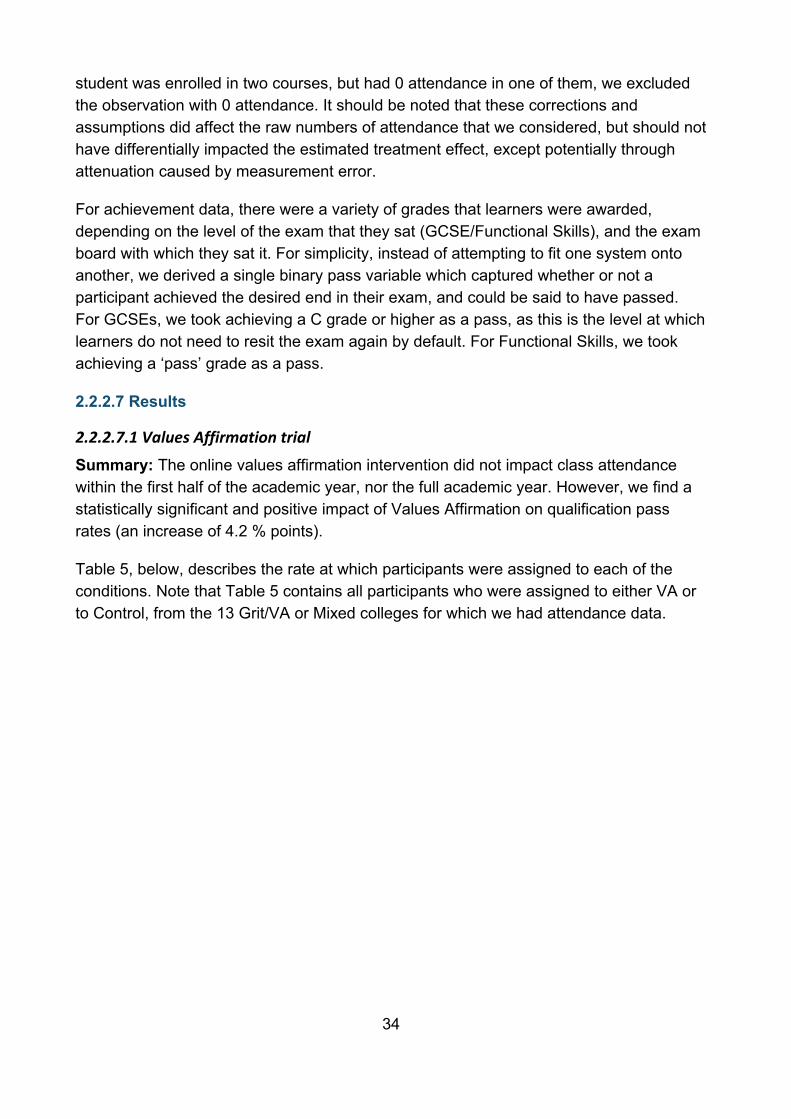
student was enrolled in two courses, but had 0 attendance in one of them, we excluded the observation with 0 attendance. It should be noted that these corrections and assumptions did affect the raw numbers of attendance that we considered, but should not have differentially impacted the estimated treatment effect, except potentially through attenuation caused by measurement error.
For achievement data, there were a variety of grades that learners were awarded, depending on the level of the exam that they sat (GCSE/Functional Skills), and the exam board with which they sat it. For simplicity, instead of attempting to fit one system onto another, we derived a single binary pass variable which captured whether or not a participant achieved the desired end in their exam, and could be said to have passed. For GCSEs, we took achieving a C grade or higher as a pass, as this is the level at which learners do not need to resit the exam again by default. For Functional Skills, we took achieving a ‘pass’ grade as a pass.
2.2.2.7 Results
2.2.2.7.1 Values Affirmation trial
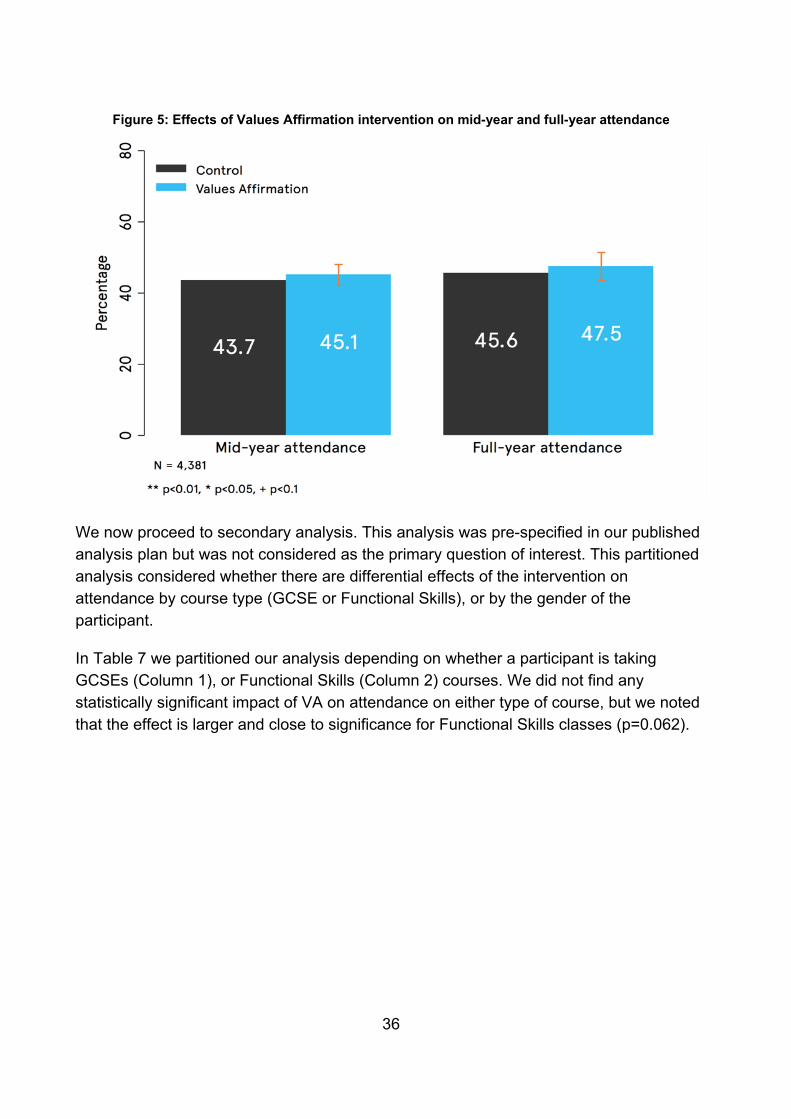
Summary: The online values affirmation intervention did not impact class attendance within the first half of the academic year, nor the full academic year. However, we find a statistically significant and positive impact of Values Affirmation on qualification pass rates (an increase of 4.2 % points).
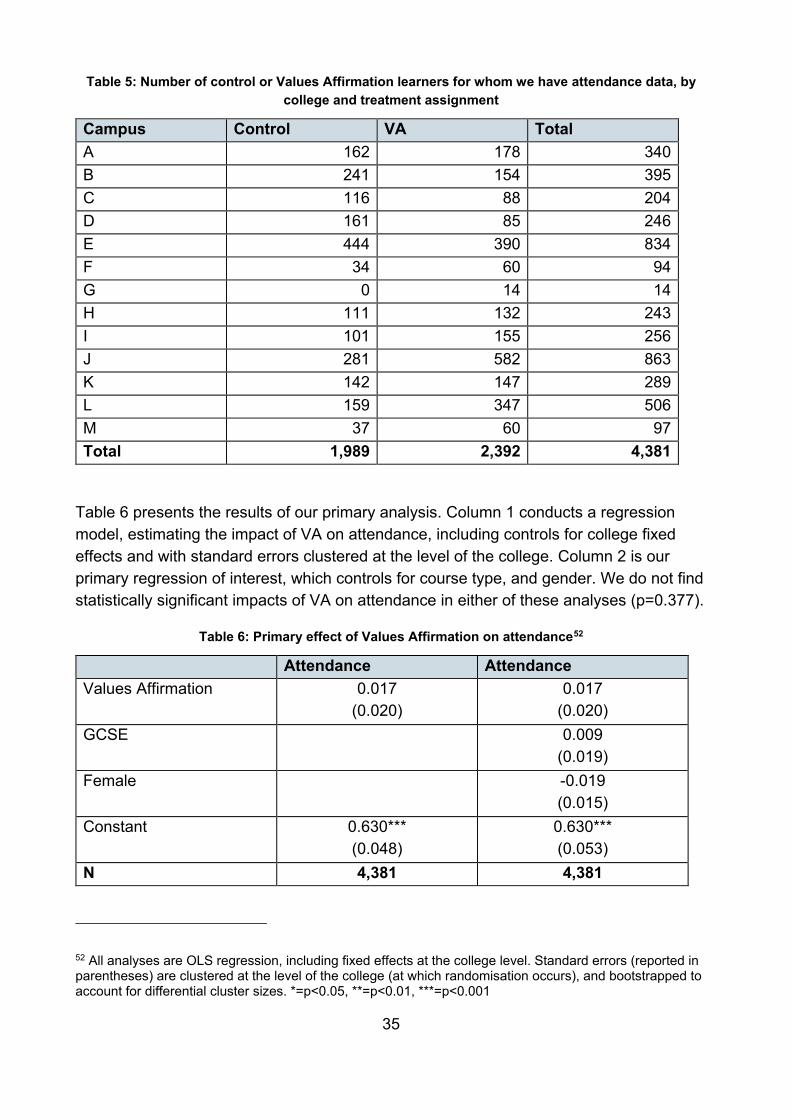
Table 5, below, describes the rate at which participants were assigned to each of the conditions. Note that Table 5 contains all participants who were assigned to either VA or to Control, from the 13 Grit/VA or Mixed colleges for which we had attendance data.
35
Table 5: Number of control or Values Affirmation learners for whom we have attendance data, by college and treatment assignment
Campus Control VA Total A 162 178 340 B 241 154 395 C 116 88 204 D 161 85 246 E 444 390 834 F 34 60 94 G 0 14 14 H 111 132 243 I 101 155 256 J 281 582 863 K 142 147 289 L 159 347 506 M 37 60 97 Total 1,989 2,392 4,381
Table 6 presents the results of our primary analysis. Column 1 conducts a regression model, estimating the impact of VA on attendance, including controls for college fixed effects and with standard errors clustered at the level of the college. Column 2 is our primary regression of interest, which controls for course type, and gender. We do not find statistically significant impacts of VA on attendance in either of these analyses (p=0.377).
Table 6: Primary effect of Values Affirmation on attendance52
Attendance Attendance Values Affirmation 0.017
(0.020) 0.017
(0.020) GCSE 0.009
(0.019) Female -0.019
(0.015) Constant 0.630***
(0.048) 0.630*** (0.053)
N 4,381 4,381
52 All analyses are OLS regression, including fixed effects at the college level. Standard errors (reported in parentheses) are clustered at the level of the college (at which randomisation occurs), and bootstrapped to account for differential cluster sizes. *=p<0.05, **=p<0.01, ***=p<0.001
36
Figure 5: Effects of Values Affirmation intervention on mid-year and full-year attendance
We now proceed to secondary analysis. This analysis was pre-specified in our published analysis plan but was not considered as the primary question of interest. This partitioned analysis considered whether there are differential effects of the intervention on attendance by course type (GCSE or Functional Skills), or by the gender of the participant.
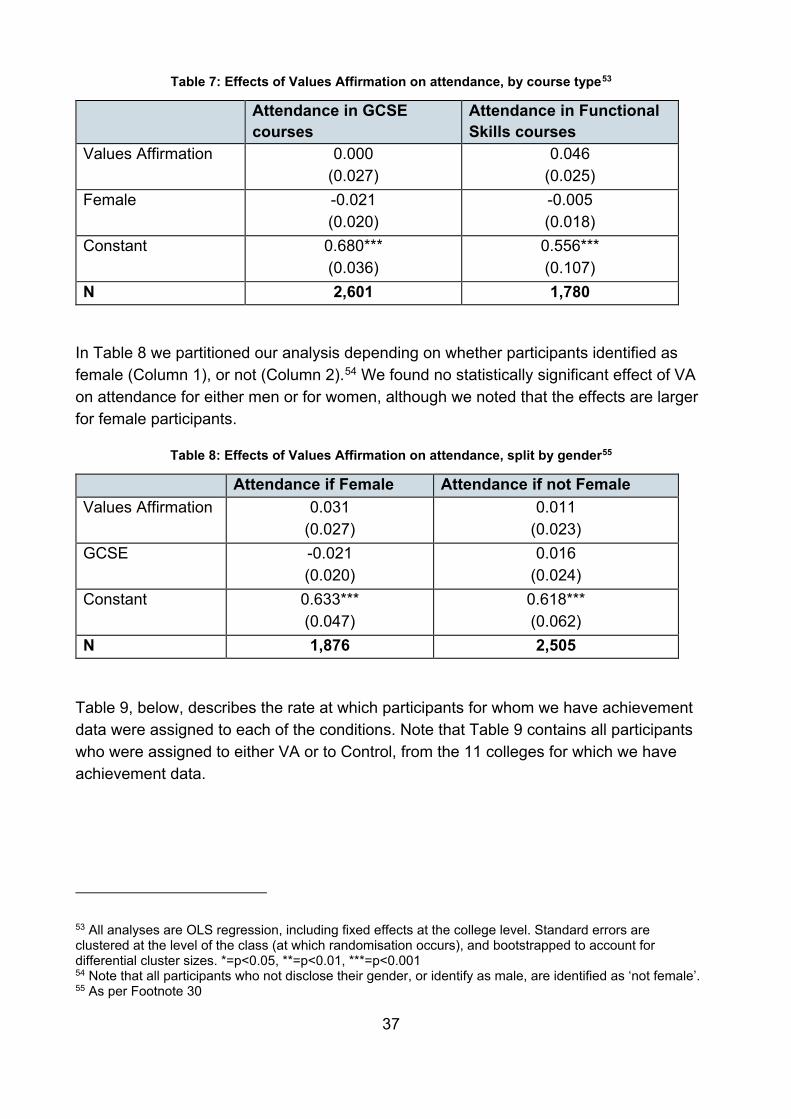
In Table 7 we partitioned our analysis depending on whether a participant is taking GCSEs (Column 1), or Functional Skills (Column 2) courses. We did not find any statistically significant impact of VA on attendance on either type of course, but we noted that the effect is larger and close to significance for Functional Skills classes (p=0.062).
37
Table 7: Effects of Values Affirmation on attendance, by course type53
Attendance in GCSE courses
Attendance in Functional Skills courses
Values Affirmation 0.000 (0.027)
0.046 (0.025)
Female -0.021 (0.020)
-0.005 (0.018)
Constant 0.680*** (0.036)
0.556*** (0.107)
N 2,601 1,780
In Table 8 we partitioned our analysis depending on whether participants identified as female (Column 1), or not (Column 2).54 We found no statistically significant effect of VA on attendance for either men or for women, although we noted that the effects are larger for female participants.
Table 8: Effects of Values Affirmation on attendance, split by gender55
Attendance if Female Attendance if not Female Values Affirmation 0.031
(0.027) 0.011
(0.023) GCSE -0.021
(0.020) 0.016
(0.024) Constant 0.633***
(0.047) 0.618*** (0.062)
N 1,876 2,505
Table 9, below, describes the rate at which participants for whom we have achievement data were assigned to each of the conditions. Note that Table 9 contains all participants who were assigned to either VA or to Control, from the 11 colleges for which we have achievement data.
53 All analyses are OLS regression, including fixed effects at the college level. Standard errors are clustered at the level of the class (at which randomisation occurs), and bootstrapped to account for differential cluster sizes. *=p<0.05, **=p<0.01, ***=p<0.001 54 Note that all participants who not disclose their gender, or identify as male, are identified as ‘not female’. 55 As per Footnote 30
38
Table 9: Sample description - achievement
Campus Control VA Total A 152 178 330 B 312 213 525 C 99 87 186 D 94 85 179 E 210 390 600 F 85 155 240 G 314 660 974 H 128 147 275 I 198 403 601 J 54 97 151 K 45 204 249 Total 1,692 2,633 4,325
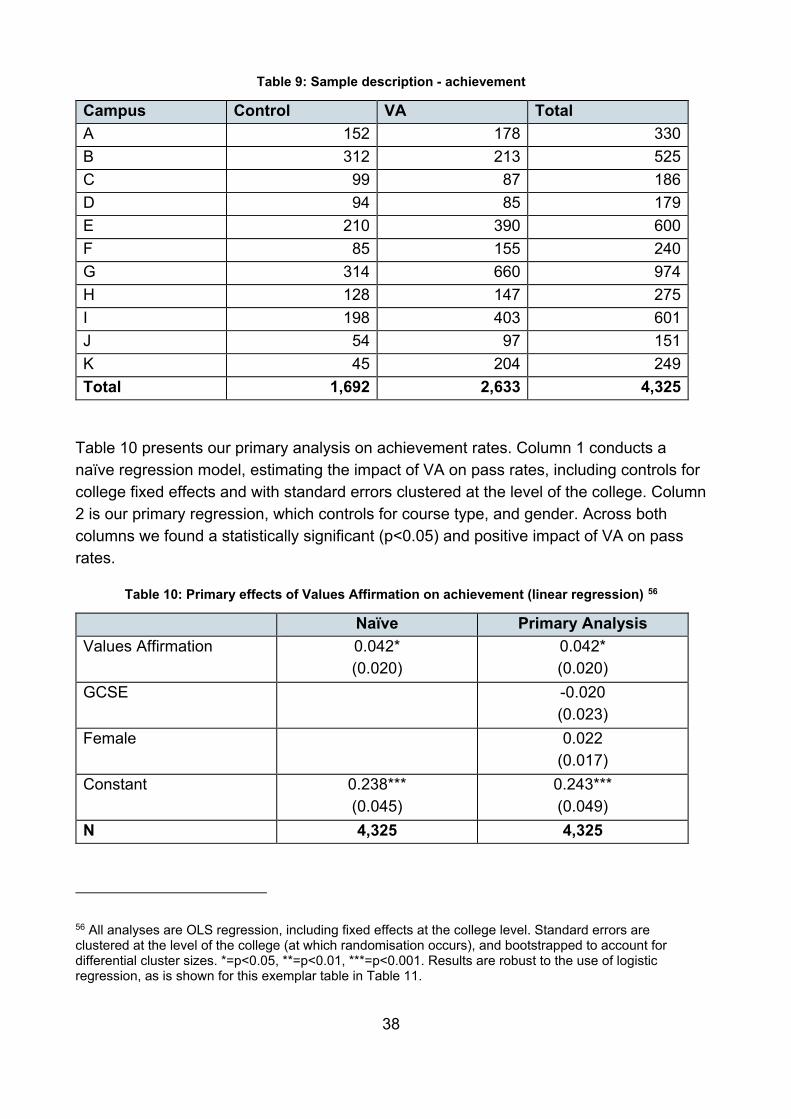
Table 10 presents our primary analysis on achievement rates. Column 1 conducts a naïve regression model, estimating the impact of VA on pass rates, including controls for college fixed effects and with standard errors clustered at the level of the college. Column 2 is our primary regression, which controls for course type, and gender. Across both columns we found a statistically significant (p<0.05) and positive impact of VA on pass rates.
Table 10: Primary effects of Values Affirmation on achievement (linear regression) 56
Naïve Primary Analysis Values Affirmation 0.042*
(0.020) 0.042* (0.020)
GCSE -0.020 (0.023)
Female 0.022 (0.017)
Constant 0.238*** (0.045)
0.243*** (0.049)
N 4,325 4,325
56 All analyses are OLS regression, including fixed effects at the college level. Standard errors are clustered at the level of the college (at which randomisation occurs), and bootstrapped to account for differential cluster sizes. *=p<0.05, **=p<0.01, ***=p<0.001. Results are robust to the use of logistic regression, as is shown for this exemplar table in Table 11.
39
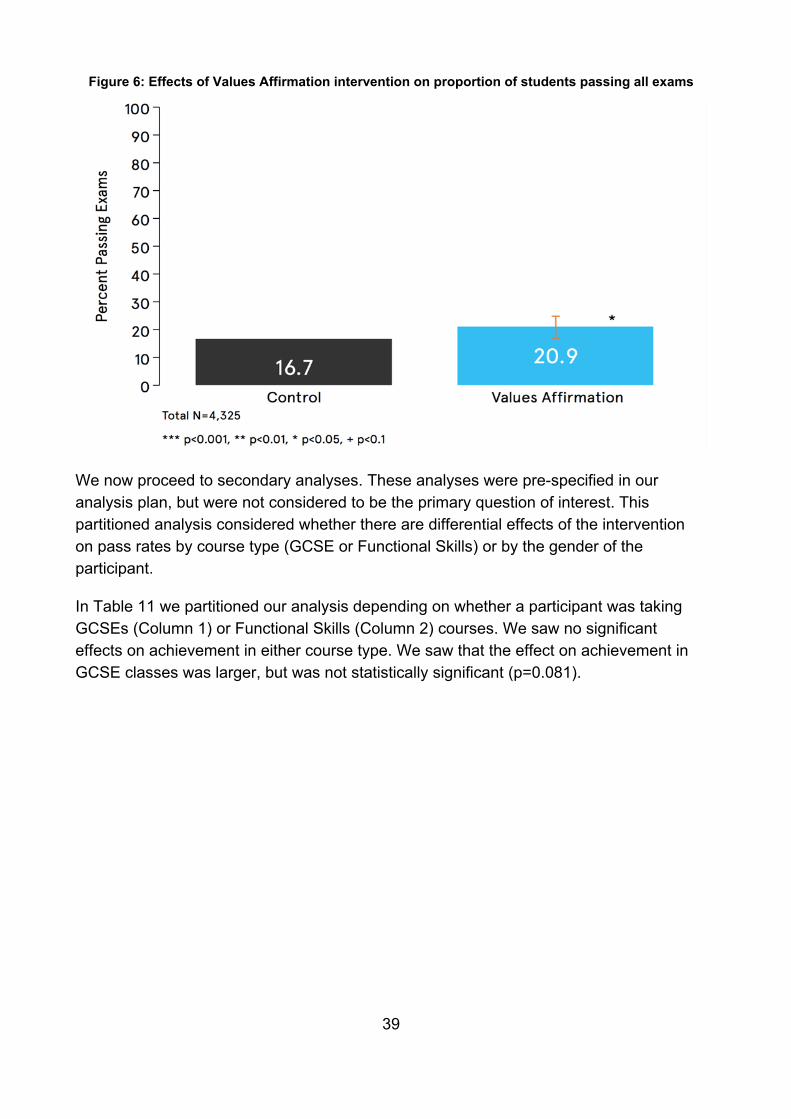
Figure 6: Effects of Values Affirmation intervention on proportion of students passing all exams
We now proceed to secondary analyses. These analyses were pre-specified in our analysis plan, but were not considered to be the primary question of interest. This partitioned analysis considered whether there are differential effects of the intervention on pass rates by course type (GCSE or Functional Skills) or by the gender of the participant.
In Table 11 we partitioned our analysis depending on whether a participant was taking GCSEs (Column 1) or Functional Skills (Column 2) courses. We saw no significant effects on achievement in either course type. We saw that the effect on achievement in GCSE classes was larger, but was not statistically significant (p=0.081).
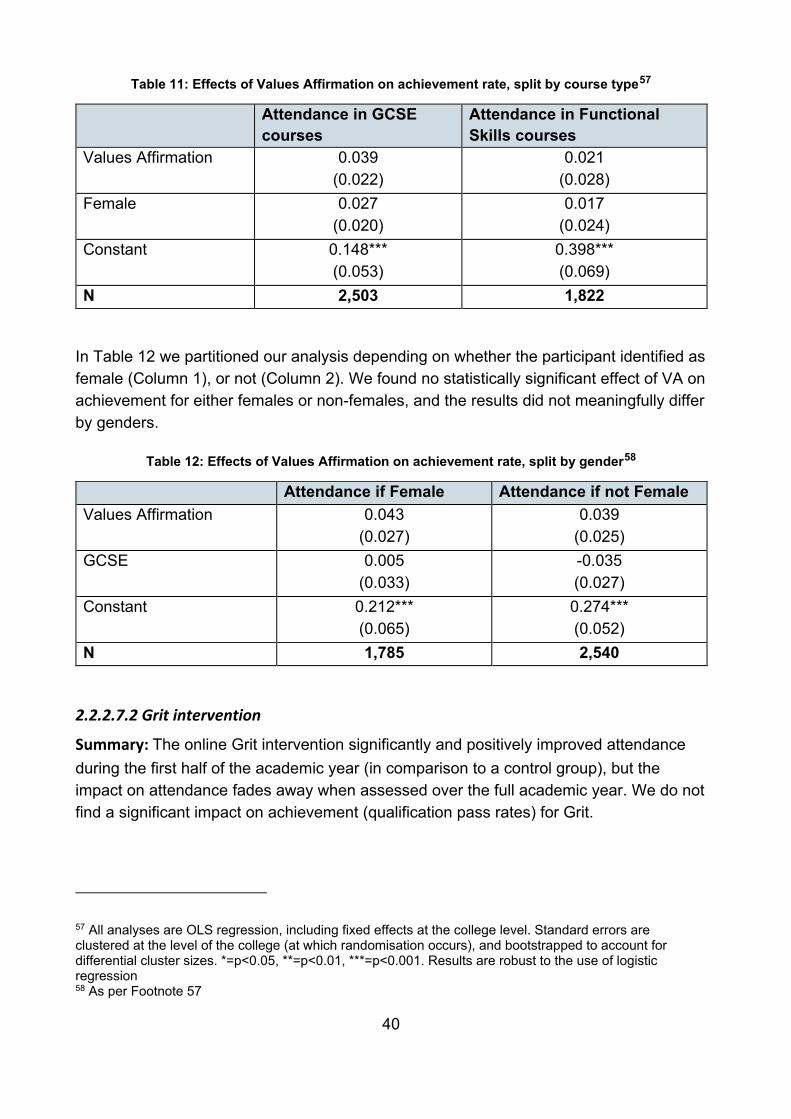
40
Table 11: Effects of Values Affirmation on achievement rate, split by course type57
Attendance in GCSE courses
Attendance in Functional Skills courses
Values Affirmation 0.039 (0.022)
0.021 (0.028)
Female 0.027 (0.020)
0.017 (0.024)
Constant 0.148*** (0.053)
0.398*** (0.069)
N 2,503 1,822
In Table 12 we partitioned our analysis depending on whether the participant identified as female (Column 1), or not (Column 2). We found no statistically significant effect of VA on achievement for either females or non-females, and the results did not meaningfully differ by genders.
Table 12: Effects of Values Affirmation on achievement rate, split by gender58
Attendance if Female Attendance if not Female Values Affirmation 0.043
(0.027) 0.039
(0.025) GCSE 0.005
(0.033) -0.035 (0.027)
Constant 0.212*** (0.065)
0.274*** (0.052)
N 1,785 2,540
2.2.2.7.2 Grit intervention
Summary: The online Grit intervention significantly and positively improved attendance during the first half of the academic year (in comparison to a control group), but the impact on attendance fades away when assessed over the full academic year. We do not find a significant impact on achievement (qualification pass rates) for Grit.
57 All analyses are OLS regression, including fixed effects at the college level. Standard errors are clustered at the level of the college (at which randomisation occurs), and bootstrapped to account for differential cluster sizes. *=p<0.05, **=p<0.01, ***=p<0.001. Results are robust to the use of logistic regression 58 As per Footnote 57
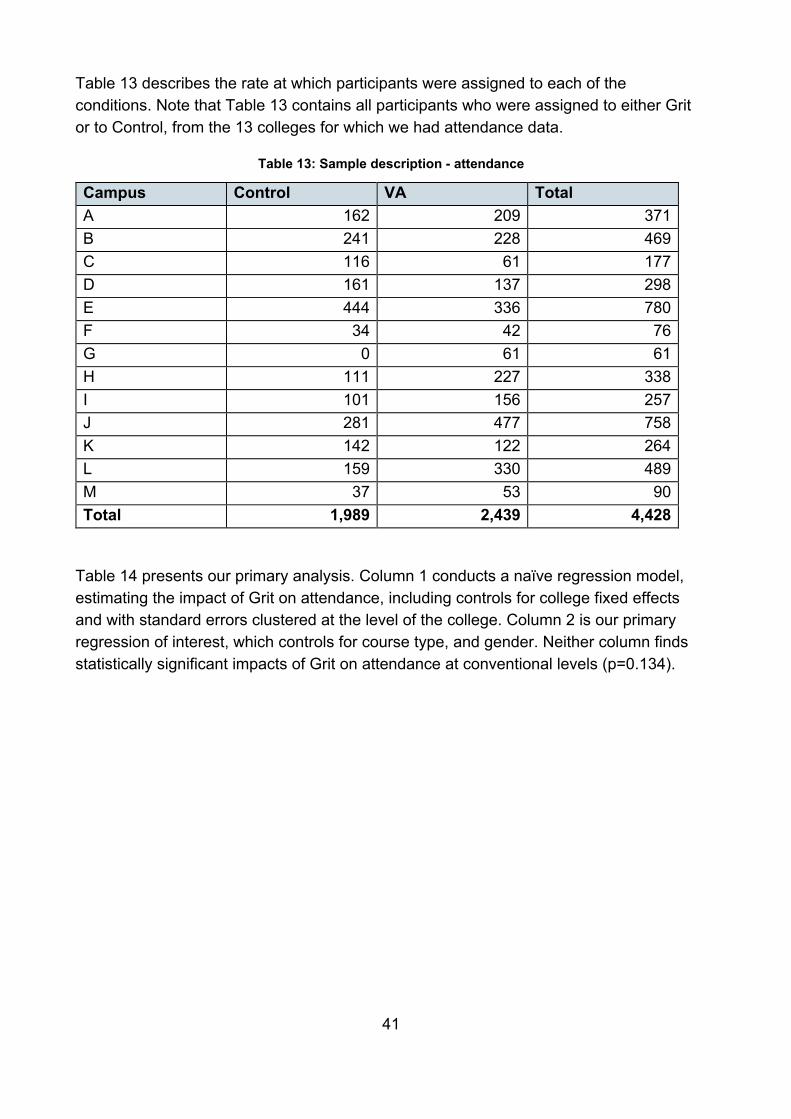
41
Table 13 describes the rate at which participants were assigned to each of the conditions. Note that Table 13 contains all participants who were assigned to either Grit or to Control, from the 13 colleges for which we had attendance data.
Table 13: Sample description - attendance
Campus Control VA Total A 162 209 371 B 241 228 469 C 116 61 177 D 161 137 298 E 444 336 780 F 34 42 76 G 0 61 61 H 111 227 338 I 101 156 257 J 281 477 758 K 142 122 264 L 159 330 489 M 37 53 90 Total 1,989 2,439 4,428
Table 14 presents our primary analysis. Column 1 conducts a naïve regression model, estimating the impact of Grit on attendance, including controls for college fixed effects and with standard errors clustered at the level of the college. Column 2 is our primary regression of interest, which controls for course type, and gender. Neither column finds statistically significant impacts of Grit on attendance at conventional levels (p=0.134).
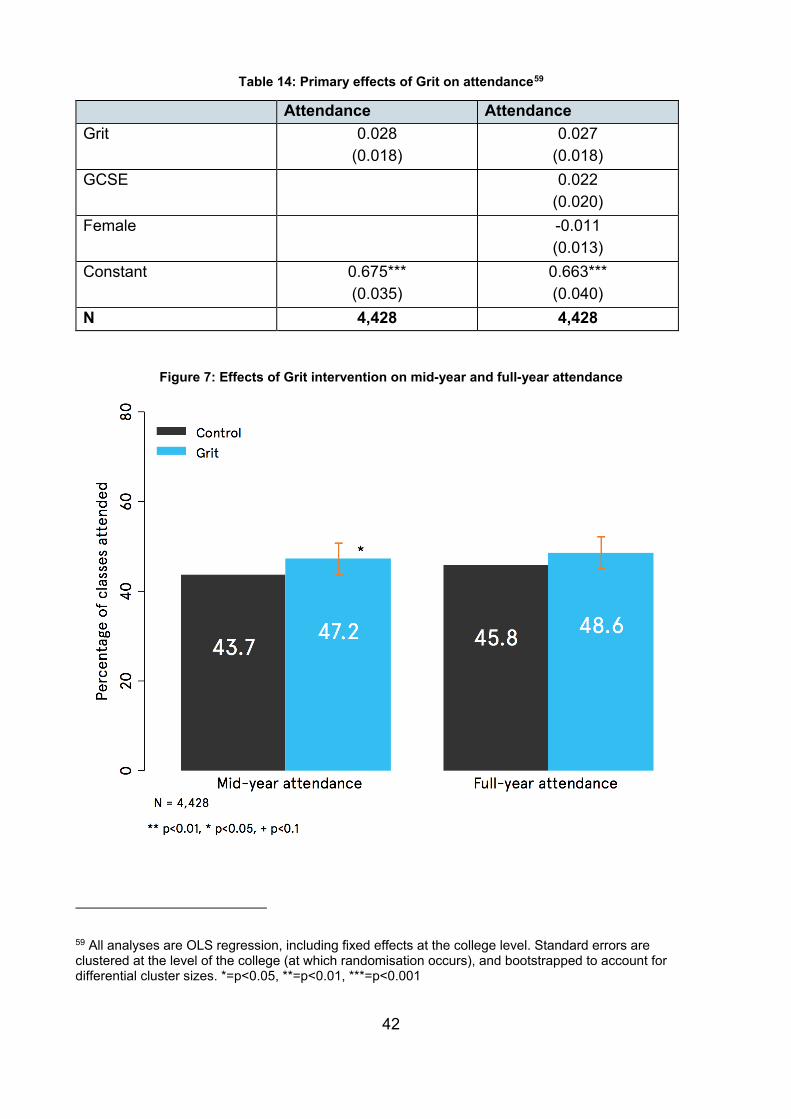
42
Table 14: Primary effects of Grit on attendance59
Attendance Attendance Grit 0.028
(0.018) 0.027
(0.018) GCSE 0.022
(0.020) Female -0.011
(0.013) Constant 0.675***
(0.035) 0.663*** (0.040)
N 4,428 4,428
Figure 7: Effects of Grit intervention on mid-year and full-year attendance
59 All analyses are OLS regression, including fixed effects at the college level. Standard errors are clustered at the level of the college (at which randomisation occurs), and bootstrapped to account for differential cluster sizes. *=p<0.05, **=p<0.01, ***=p<0.001
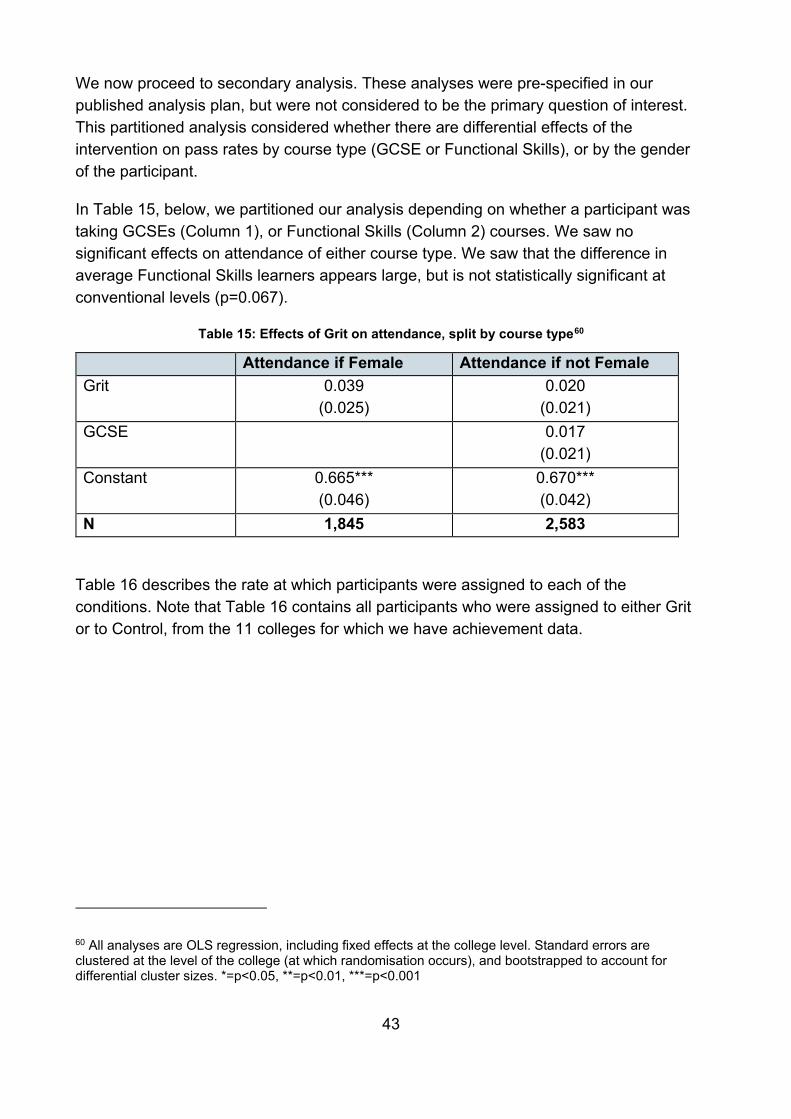
43
We now proceed to secondary analysis. These analyses were pre-specified in our published analysis plan, but were not considered to be the primary question of interest. This partitioned analysis considered whether there are differential effects of the intervention on pass rates by course type (GCSE or Functional Skills), or by the gender of the participant.
In Table 15, below, we partitioned our analysis depending on whether a participant was taking GCSEs (Column 1), or Functional Skills (Column 2) courses. We saw no significant effects on attendance of either course type. We saw that the difference in average Functional Skills learners appears large, but is not statistically significant at conventional levels (p=0.067).
Table 15: Effects of Grit on attendance, split by course type60
Attendance if Female Attendance if not Female Grit 0.039
(0.025) 0.020
(0.021) GCSE 0.017
(0.021) Constant 0.665***
(0.046) 0.670*** (0.042)
N 1,845 2,583
Table 16 describes the rate at which participants were assigned to each of the conditions. Note that Table 16 contains all participants who were assigned to either Grit or to Control, from the 11 colleges for which we have achievement data.
60 All analyses are OLS regression, including fixed effects at the college level. Standard errors are clustered at the level of the college (at which randomisation occurs), and bootstrapped to account for differential cluster sizes. *=p<0.05, **=p<0.01, ***=p<0.001
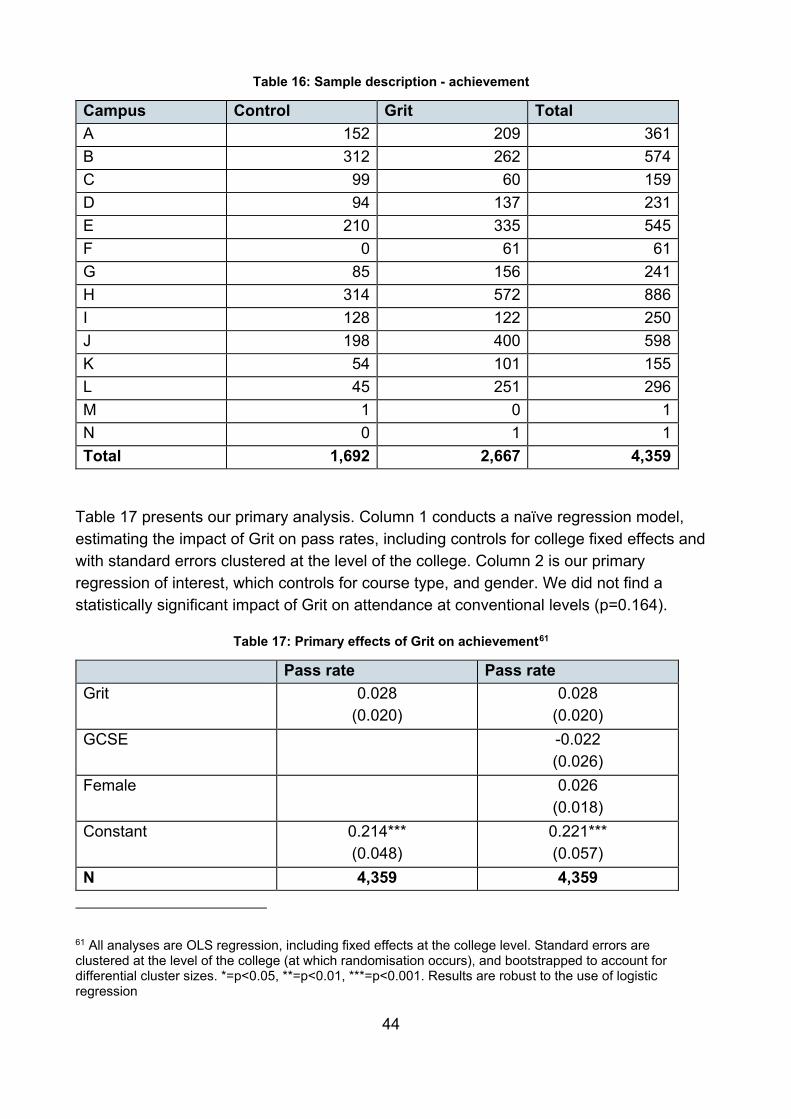
44
Table 16: Sample description - achievement
Campus Control Grit Total A 152 209 361 B 312 262 574 C 99 60 159 D 94 137 231 E 210 335 545 F 0 61 61 G 85 156 241 H 314 572 886 I 128 122 250 J 198 400 598 K 54 101 155 L 45 251 296 M 1 0 1 N 0 1 1 Total 1,692 2,667 4,359
Table 17 presents our primary analysis. Column 1 conducts a naïve regression model, estimating the impact of Grit on pass rates, including controls for college fixed effects and with standard errors clustered at the level of the college. Column 2 is our primary regression of interest, which controls for course type, and gender. We did not find a statistically significant impact of Grit on attendance at conventional levels (p=0.164).
Table 17: Primary effects of Grit on achievement61
Pass rate Pass rate Grit 0.028
(0.020) 0.028
(0.020) GCSE -0.022
(0.026) Female 0.026
(0.018) Constant 0.214***
(0.048) 0.221*** (0.057)
N 4,359 4,359
61 All analyses are OLS regression, including fixed effects at the college level. Standard errors are clustered at the level of the college (at which randomisation occurs), and bootstrapped to account for differential cluster sizes. *=p<0.05, **=p<0.01, ***=p<0.001. Results are robust to the use of logistic regression
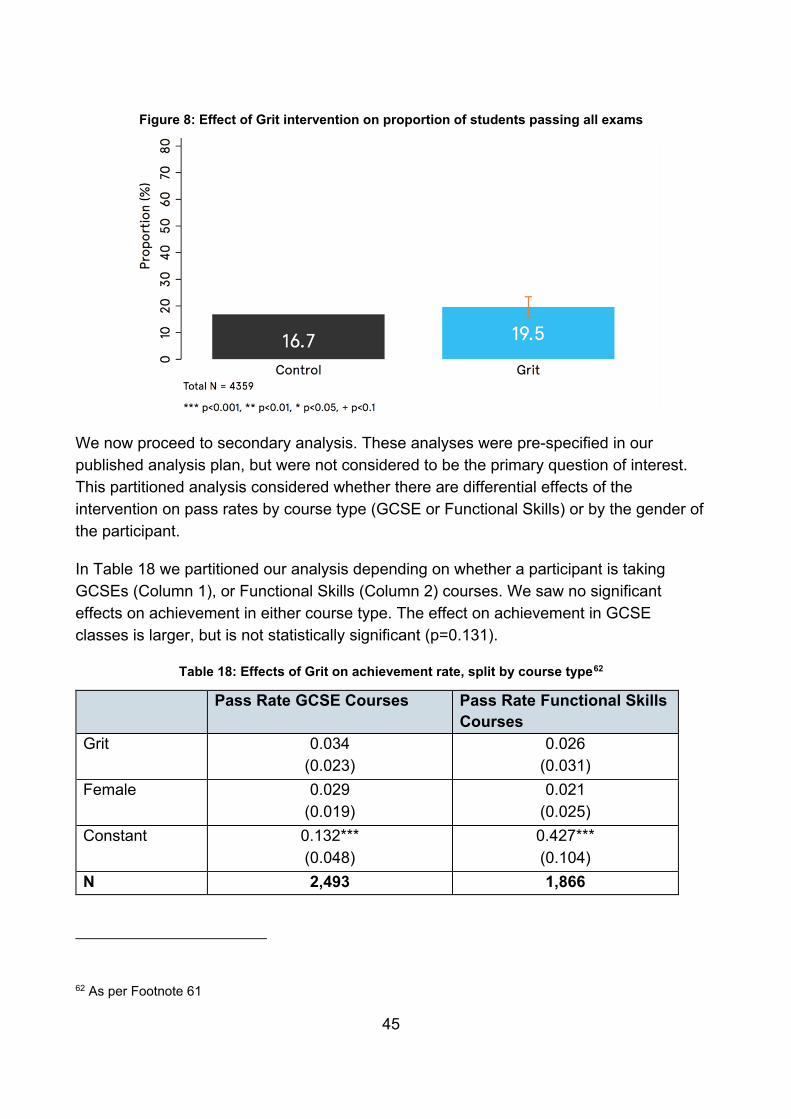
45
Figure 8: Effect of Grit intervention on proportion of students passing all exams
We now proceed to secondary analysis. These analyses were pre-specified in our published analysis plan, but were not considered to be the primary question of interest. This partitioned analysis considered whether there are differential effects of the intervention on pass rates by course type (GCSE or Functional Skills) or by the gender of the participant.
In Table 18 we partitioned our analysis depending on whether a participant is taking GCSEs (Column 1), or Functional Skills (Column 2) courses. We saw no significant effects on achievement in either course type. The effect on achievement in GCSE classes is larger, but is not statistically significant (p=0.131).
Table 18: Effects of Grit on achievement rate, split by course type62
Pass Rate GCSE Courses Pass Rate Functional Skills Courses
Grit 0.034 (0.023)
0.026 (0.031)
Female 0.029 (0.019)
0.021 (0.025)
Constant 0.132*** (0.048)
0.427*** (0.104)
N 2,493 1,866
62 As per Footnote 61
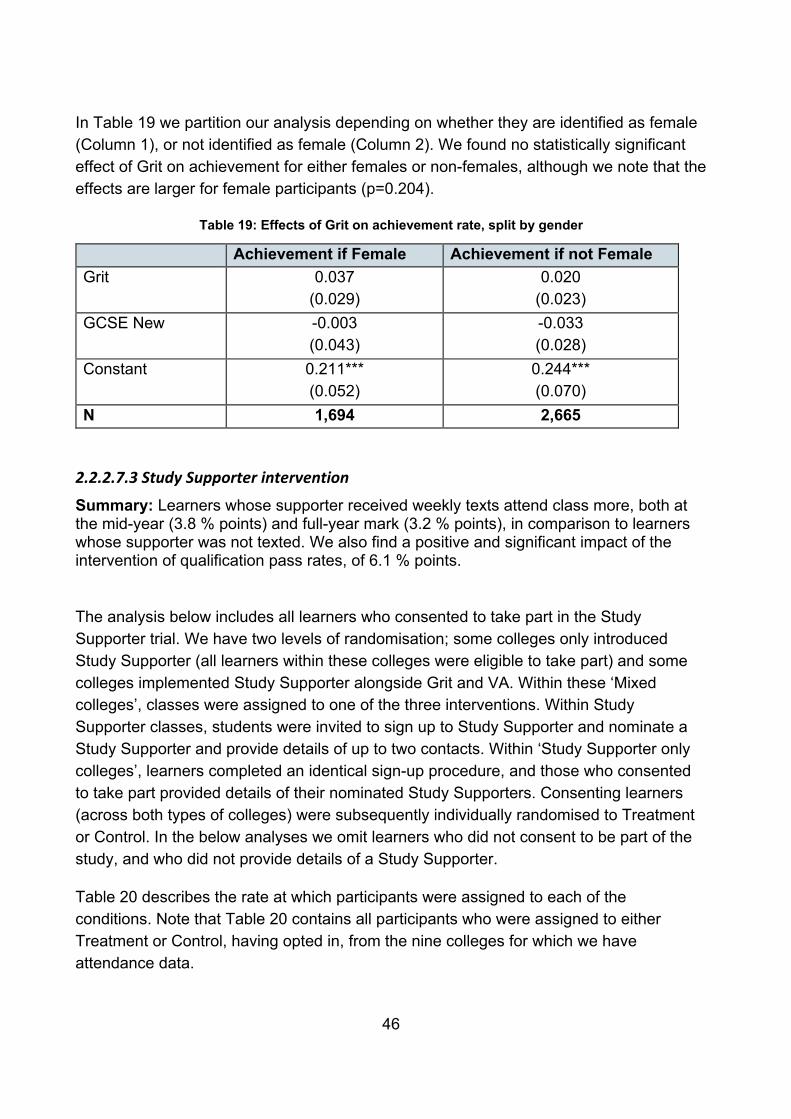
46
In Table 19 we partition our analysis depending on whether they are identified as female (Column 1), or not identified as female (Column 2). We found no statistically significant effect of Grit on achievement for either females or non-females, although we note that the effects are larger for female participants (p=0.204).
Table 19: Effects of Grit on achievement rate, split by gender
Achievement if Female Achievement if not Female Grit 0.037
(0.029) 0.020
(0.023) GCSE New -0.003
(0.043) -0.033 (0.028)
Constant 0.211*** (0.052)
0.244*** (0.070)
N 1,694 2,665
2.2.2.7.3 Study Supporter intervention
Summary: Learners whose supporter received weekly texts attend class more, both at the mid-year (3.8 % points) and full-year mark (3.2 % points), in comparison to learners whose supporter was not texted. We also find a positive and significant impact of the intervention of qualification pass rates, of 6.1 % points.
The analysis below includes all learners who consented to take part in the Study Supporter trial. We have two levels of randomisation; some colleges only introduced Study Supporter (all learners within these colleges were eligible to take part) and some colleges implemented Study Supporter alongside Grit and VA. Within these ‘Mixed colleges’, classes were assigned to one of the three interventions. Within Study Supporter classes, students were invited to sign up to Study Supporter and nominate a Study Supporter and provide details of up to two contacts. Within ‘Study Supporter only colleges’, learners completed an identical sign-up procedure, and those who consented to take part provided details of their nominated Study Supporters. Consenting learners (across both types of colleges) were subsequently individually randomised to Treatment or Control. In the below analyses we omit learners who did not consent to be part of the study, and who did not provide details of a Study Supporter.
Table 20 describes the rate at which participants were assigned to each of the conditions. Note that Table 20 contains all participants who were assigned to either Treatment or Control, having opted in, from the nine colleges for which we have attendance data.
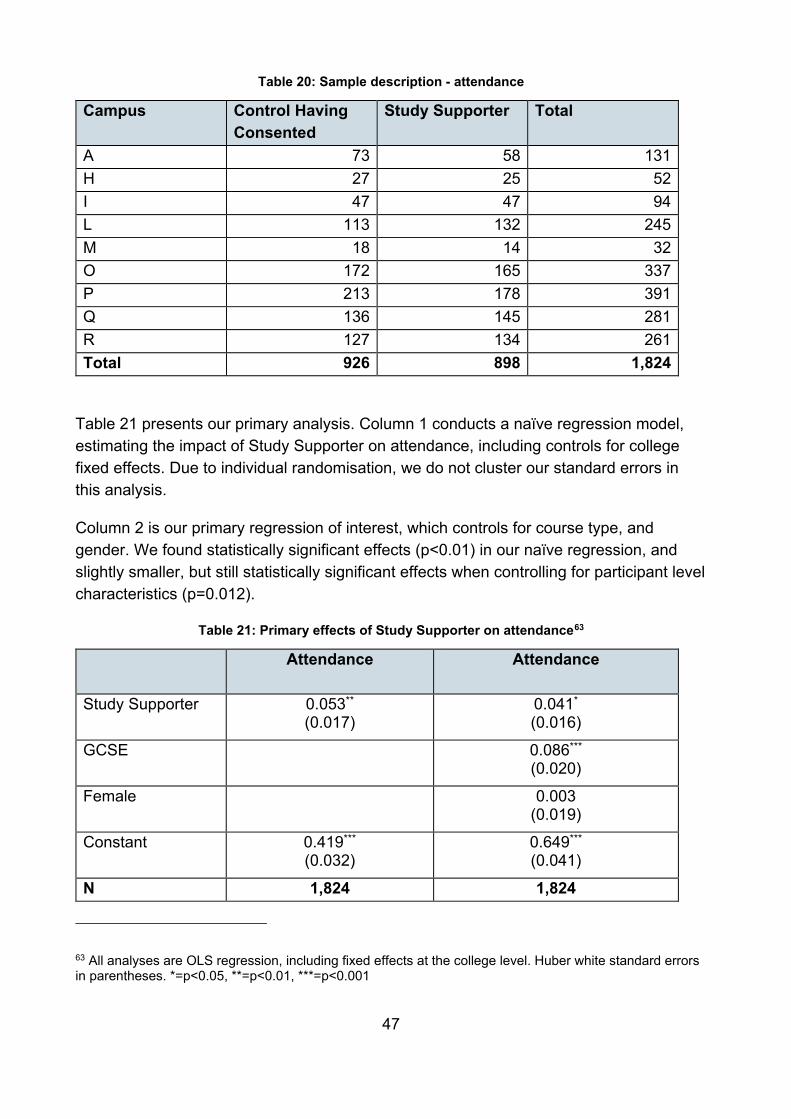
47
Table 20: Sample description - attendance
Campus Control Having Consented
Study Supporter Total
A 73 58 131 H 27 25 52 I 47 47 94 L 113 132 245 M 18 14 32 O 172 165 337 P 213 178 391 Q 136 145 281 R 127 134 261 Total 926 898 1,824
Table 21 presents our primary analysis. Column 1 conducts a naïve regression model, estimating the impact of Study Supporter on attendance, including controls for college fixed effects. Due to individual randomisation, we do not cluster our standard errors in this analysis.
Column 2 is our primary regression of interest, which controls for course type, and gender. We found statistically significant effects (p<0.01) in our naïve regression, and slightly smaller, but still statistically significant effects when controlling for participant level characteristics (p=0.012).
Table 21: Primary effects of Study Supporter on attendance63
Attendance Attendance
Study Supporter 0.053**
(0.017) 0.041*
(0.016)
GCSE 0.086***
(0.020)
Female 0.003 (0.019)
Constant 0.419***
(0.032) 0.649***
(0.041)
N 1,824 1,824
63 All analyses are OLS regression, including fixed effects at the college level. Huber white standard errors in parentheses. *=p<0.05, **=p<0.01, ***=p<0.001
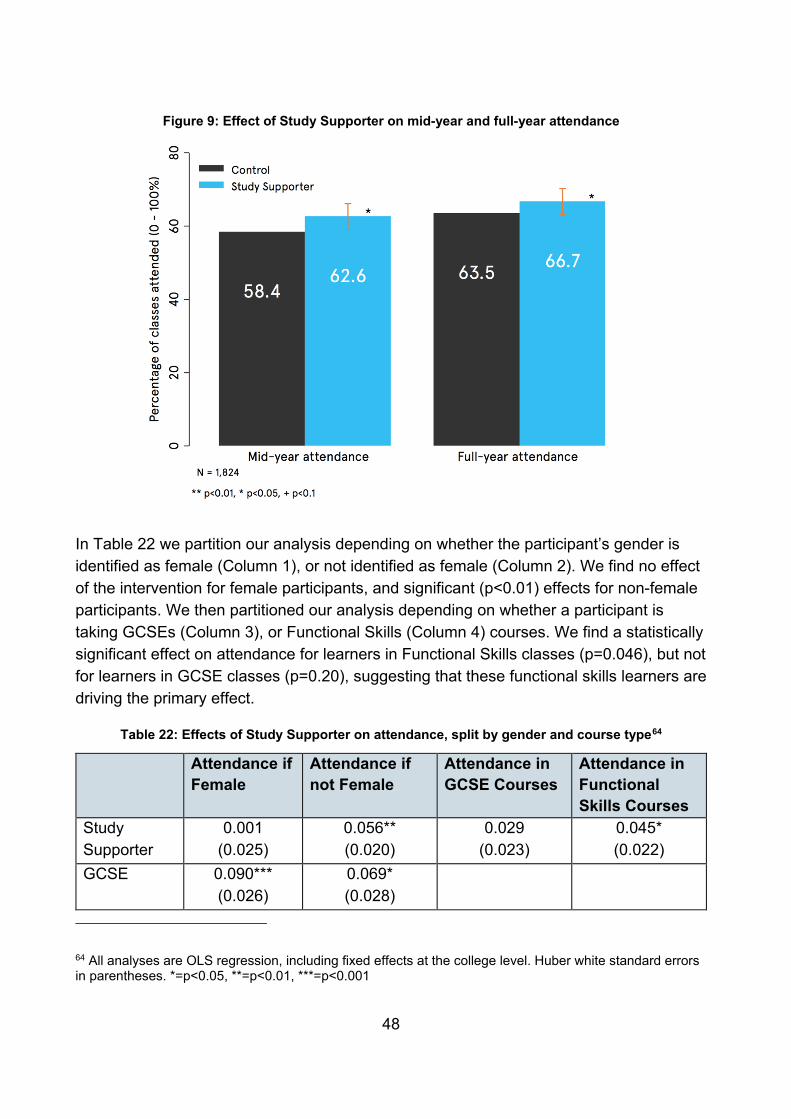
48
Figure 9: Effect of Study Supporter on mid-year and full-year attendance
In Table 22 we partition our analysis depending on whether the participant’s gender is identified as female (Column 1), or not identified as female (Column 2). We find no effect of the intervention for female participants, and significant (p<0.01) effects for non-female participants. We then partitioned our analysis depending on whether a participant is taking GCSEs (Column 3), or Functional Skills (Column 4) courses. We find a statistically significant effect on attendance for learners in Functional Skills classes (p=0.046), but not for learners in GCSE classes (p=0.20), suggesting that these functional skills learners are driving the primary effect.
Table 22: Effects of Study Supporter on attendance, split by gender and course type64
Attendance if Female
Attendance if not Female
Attendance in GCSE Courses
Attendance in Functional Skills Courses
Study Supporter
0.001 (0.025)
0.056** (0.020)
0.029 (0.023)
0.045* (0.022)
GCSE 0.090*** (0.026)
0.069* (0.028)
64 All analyses are OLS regression, including fixed effects at the college level. Huber white standard errors in parentheses. *=p<0.05, **=p<0.01, ***=p<0.001
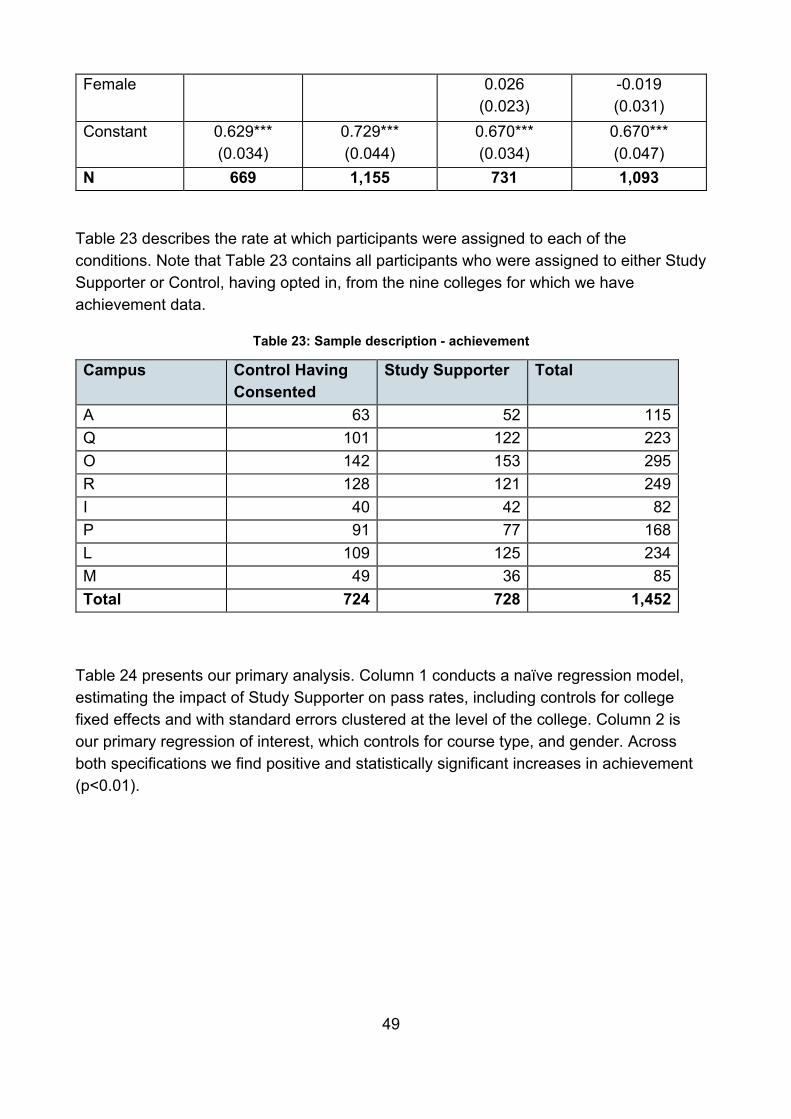
49
Female 0.026 (0.023)
-0.019 (0.031)
Constant 0.629*** (0.034)
0.729*** (0.044)
0.670*** (0.034)
0.670*** (0.047)
N 669 1,155 731 1,093
Table 23 describes the rate at which participants were assigned to each of the conditions. Note that Table 23 contains all participants who were assigned to either Study Supporter or Control, having opted in, from the nine colleges for which we have achievement data.
Table 23: Sample description - achievement
Campus Control Having Consented
Study Supporter Total
A 63 52 115 Q 101 122 223 O 142 153 295 R 128 121 249 I 40 42 82 P 91 77 168 L 109 125 234 M 49 36 85 Total 724 728 1,452
Table 24 presents our primary analysis. Column 1 conducts a naïve regression model, estimating the impact of Study Supporter on pass rates, including controls for college fixed effects and with standard errors clustered at the level of the college. Column 2 is our primary regression of interest, which controls for course type, and gender. Across both specifications we find positive and statistically significant increases in achievement (p<0.01).
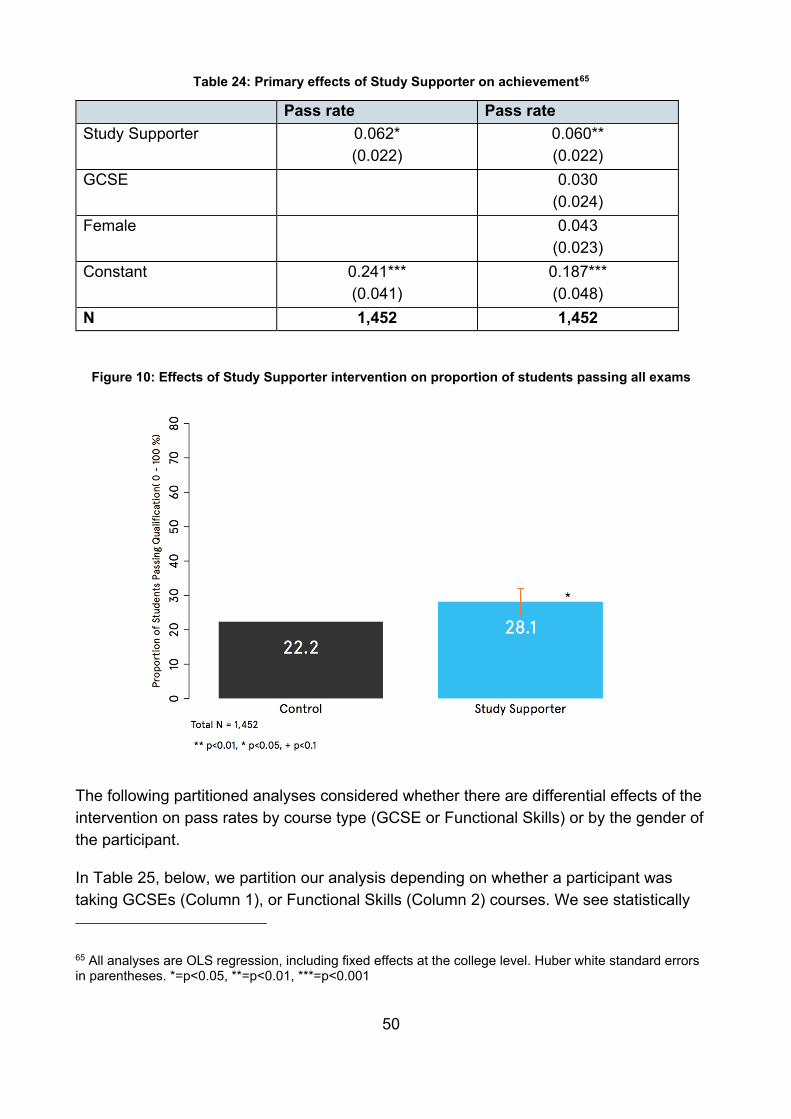
50
Table 24: Primary effects of Study Supporter on achievement65
Pass rate Pass rate Study Supporter 0.062*
(0.022) 0.060** (0.022)
GCSE 0.030 (0.024)
Female 0.043 (0.023)
Constant 0.241*** (0.041)
0.187*** (0.048)
N 1,452 1,452
Figure 10: Effects of Study Supporter intervention on proportion of students passing all exams
The following partitioned analyses considered whether there are differential effects of the intervention on pass rates by course type (GCSE or Functional Skills) or by the gender of the participant.
In Table 25, below, we partition our analysis depending on whether a participant was taking GCSEs (Column 1), or Functional Skills (Column 2) courses. We see statistically 65 All analyses are OLS regression, including fixed effects at the college level. Huber white standard errors in parentheses. *=p<0.05, **=p<0.01, ***=p<0.001
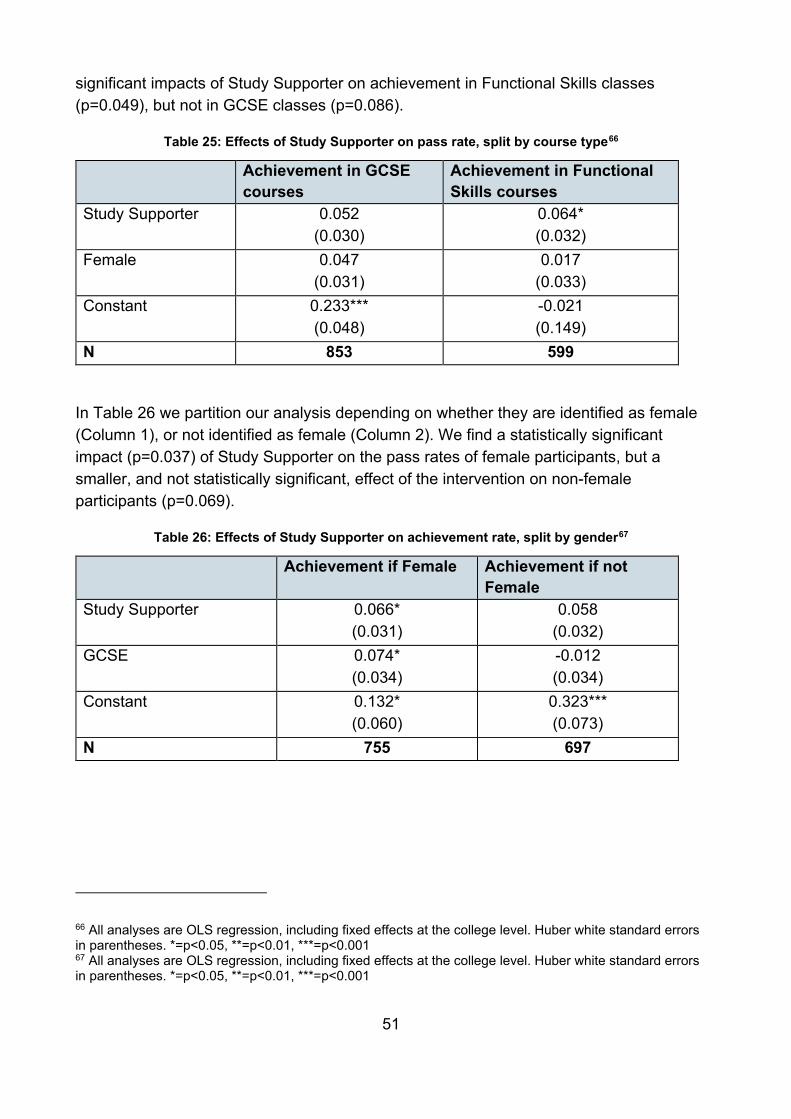
51
significant impacts of Study Supporter on achievement in Functional Skills classes (p=0.049), but not in GCSE classes (p=0.086).
Table 25: Effects of Study Supporter on pass rate, split by course type66
Achievement in GCSE courses
Achievement in Functional Skills courses
Study Supporter 0.052 (0.030)
0.064* (0.032)
Female 0.047 (0.031)
0.017 (0.033)
Constant 0.233*** (0.048)
-0.021 (0.149)
N 853 599
In Table 26 we partition our analysis depending on whether they are identified as female (Column 1), or not identified as female (Column 2). We find a statistically significant impact (p=0.037) of Study Supporter on the pass rates of female participants, but a smaller, and not statistically significant, effect of the intervention on non-female participants (p=0.069).
Table 26: Effects of Study Supporter on achievement rate, split by gender67
Achievement if Female Achievement if not Female
Study Supporter 0.066* (0.031)
0.058 (0.032)
GCSE 0.074* (0.034)
-0.012 (0.034)
Constant 0.132* (0.060)
0.323*** (0.073)
N 755 697
66 All analyses are OLS regression, including fixed effects at the college level. Huber white standard errors in parentheses. *=p<0.05, **=p<0.01, ***=p<0.001 67 All analyses are OLS regression, including fixed effects at the college level. Huber white standard errors in parentheses. *=p<0.05, **=p<0.01, ***=p<0.001
52
2.2.2.7.4 Caveats and limitations
The results presented here are robust to re-specification to include additional covariates, including age of participants and whether they are taking a maths or English course (although this is collinear on the college's ID). Achievement findings are not sensitive to the use of logistic or probit regressions instead of linear probability models. Participants’ baseline data is not available, and so detailed balance checks are not possible.
Data on the number of modules completed were collected for both Grit and VA. However, identifiers (student IDs) and class numbers were entered with substantial errors in these datasets, and in many cases are in a different format to the administrative data provided by the college. As such, it is difficult to accurately match participants from one use of the intervention to another (in order to measure their dosage), and difficult to merge this data to our outcome data provided by the colleges. Due to this constraint, and the endogeneity of dosage with our outcome measures (the main determinant of dosage appears to be class attendance), we have not produced this analysis.
Our results have three main caveats.
• First, different randomisation strategies were employed across colleges, for practical reasons. As a result, randomisation to the Grit and VA conditions is correlated to a certain extent with learners’ college ID (i.e. which college they are in). We attempt to control for this analytically, but cannot say categorically that there is no contamination of our effect. We would note that this risk does not exist for Study Supporter, as it was randomised separately.
• Secondly, the way in which our outcome measures are derived, particularly attendance, means that it would be a mistake to focus too heavily on the absolute levels of these outcome measures, which may be subject to biases in either direction. However, these biases are secular across treatments, which is why we are comfortable that the underlying narratives of our results are unaffected.
• Third, although we find no overall effect of the Grit intervention on attendance or achievement, we did find an effect of Grit in the interim analysis. This effect is partially attenuated by the time of the final analysis (2.7 percentage points at final analysis vs 3.2 percentage points at interim), but the loss of statistical significance can be at least partially explained by an increase in the sample variance and inter-cluster correlation rate between the interim and final analyses.
53
2.2.3 Using customised communications to encourage student success
2.2.3.1 Background
The Study Using Customised Communications to Encourage Student Success (Project SUCCESS) is a direct follow up of the earlier learner texting trial (section 2.2.1) and the Study Supporter trial (section 2.2.2.3.3), incorporating both text messages to learners and their nominated supporter(s). SUCCESS ran over the 2016/17 academic year, and is evaluated using college administrative data and National Pupil Database (NPD) data from October 2017.
Four FE colleges participated in this trial. All 16+ GCSE English or maths students were eligible to take part. In total, 972 students consented to take part and provided valid phone numbers. The vast majority of learners were aged 16 – 18 (79.5%).
2.2.3.2 Theoretical motivation
As can be concluded from the earlier sections on the adult learner engagement and retention trial (section 2.2.1) and the Study Supporter trial (section 2.2.2.3.3), informative and timely text messages can help students achieve better grades and attend class more often. However, few studies have directly examined whether it is more effective to provide supportive information either to the learner directly, or via a person in their social network who cares about them and their learning. The theoretical support for both pathways is strong. Personalised mobile phone messaging reminders have been found to improve the rate of attendance at healthcare appointments,68 increase youth in college attendance to complete enrollment to post-secondary education,69 and promote smoking cessation.70 On the other hand, involving the individual’s social network may produce benefits above and beyond those achieved by direct messages to the learner. Friends and family are among the most potent forces in changing people’s behaviour, yet this power is seldom harnessed to help people achieve their goals. A substantial body of
68 Gurol-Urganci, I., de Jongh, T., Vodopivec-Jamsek, V., Atun, R. & Car, J. (2013). Mobile phone messaging reminders for attendance at scheduled healthcare appointments. Cochrane Database of Systematic Reviews, (4). 69 Castleman, B. L., & Page, L. C. (2015). Summer nudging: Can personalized text messages and peer mentor outreach increase college going among low-income high school graduates?. Journal of Economic Behavior & Organization, 115, 144-160. 70 Head, K. J., Noar, S. M., Iannarino, N. T., & Harrington, N. G. (2013). Efficacy of text messaging-based interventions for health promotion: a meta-analysis. Social Science & Medicine, 97, 41-48.
54
(observational) literature shows that adolescents who report supportive parents, peers and teachers do better in school than those who do not.71 72 73 74 75
Few studies have attempted to improve academic engagement and achievement by strengthening supportive communication between the student and the people that care about them and their learning. A number of recent text messaging interventions sent parents information on missed attendances, grades and homework notifications,76 77 but these were predominantly aimed at increasing parental monitoring rather than social support.
2.2.3.3 Intervention
We therefore set out to implement an intervention aimed at strengthening the positive and supportive communication between FE College learners and their peers and families. In this project, we tested a system whereby learners can opt-in to enlist their friends and family to encourage and support them in school. We hypothesised that participation in this programme would increase learner success, and persistence with mathematics and English GCSEs.
Students who agreed to participate in the study were randomly assigned to one of the following conditions:
Control: Students nominated two Study Supporters during the initial survey but these were not contacted
Supporter only: Students nominated two Study Supporters who then received text messages
Learner only: Students nominated two Study Supporters but these did not receive text messages. Instead the learners themselves received text messages
71 Wentzel, K. R., Russell, S., & Baker, S. (2016). Emotional support and expectations from parents, teachers, and peers predict adolescent competence at school. Journal of Educational Psychology, 108(2), 242. 72 Demaray, M. K., & Malecki, C. K. (2002). The relationship between perceived social support and maladjustment for students at risk. Psychology in the Schools, 39(3), 305-316. 73 Levitt, M. J., Guacci-Franco, N., & Levitt, J. L. (1994). Social support and achievement in childhood and early adolescence: A multi-cultural study. Journal of Applied Developmental Psychology, 15, 207–222. 74 Song, J., Bong, M., Lee, K., & Kim, S. I. (2015). Longitudinal investigation into the role of perceived social support in adolescents’ academic motivation and achievement. Journal of Educational Psychology, 107(3), 821. 75 Pomerantz, E. M., Cheung, C. S. S., & Qin, L. (2012). Relatedness between children and parents: Implications for motivation. The Oxford handbook of human motivation, 579-349. 76 Berlinski, S., Busso, M., Dinkelman, T., & Martinez, C. (2016). Reducing parent-school information gaps and improving education outcomes: Evidence from high frequency text messaging in Chile. 77 Bergman, P. L. S., & Chan, E. W. (2017). Leveraging Technology to Engage Parents at Scale: Evidence from a Randomized Controlled Trial (No. 6493). CESifo Group Munich.
55
Supporter + learner: Students nominated two Study Supporters and both the supporters and the learners received text messages about College
Nominated Study Supporters and the learners themselves assigned to the ‘Learner only arm’ were contacted every week throughout the 2016-17 academic year via text messages (or until they opted out of receiving texts). In total, 35 text messages were sent between November 2016 and June 2017. In the weeks and days leading to the GCSE maths and English exams, the messages were more frequent with reminders at three and one days before the exam. In total, 38 learners (9%) opted out of the text messages, and 24 Study Supporters did so (6%).
SMS messages were scheduled via the FireText texting platform, and sent out every Thursday evening at 7 PM. The messages to Study Supporters encouraged them to talk to the learner about specific topics related to the learner’s educational experience at college, such as available resources, upcoming events or deadlines, and questions about the material the learner was covering in class. Study supporters never receive information about the learner’s performance in class, or their attendance. Essentially, the texts are always positive and forward-looking.
Learners assigned to the ‘SS + learner’ group received text messages at the same time as their Study Supporters. These messages always informed the learner of the topic they could expect their Study Supporter to ask them about over the coming days. For example:
Study Supporter message:
"Hello [Study Supporter first name], [learner first name] has a mock exam coming up next week, ask [him/her] when [he/she] is planning to prepare for it. Thanks, [College]"
Student message:
"Hello [learner first name], your study supporter [first name] may ask you about your mock exam, which is happening next week. Tell [him/her] when and how you are preparing for it. Thanks, [College]"
Message content was always be related to the learners’ educational experience. We collaborated with Heads of Curriculum for Maths and English at the participating colleges to ensure that the text messages were specific and applicable to each college, as there was substantial variation between colleges in terms of key exam dates and course content.
2.2.3.4 Method
Figure 11 below shows the intervention in full.
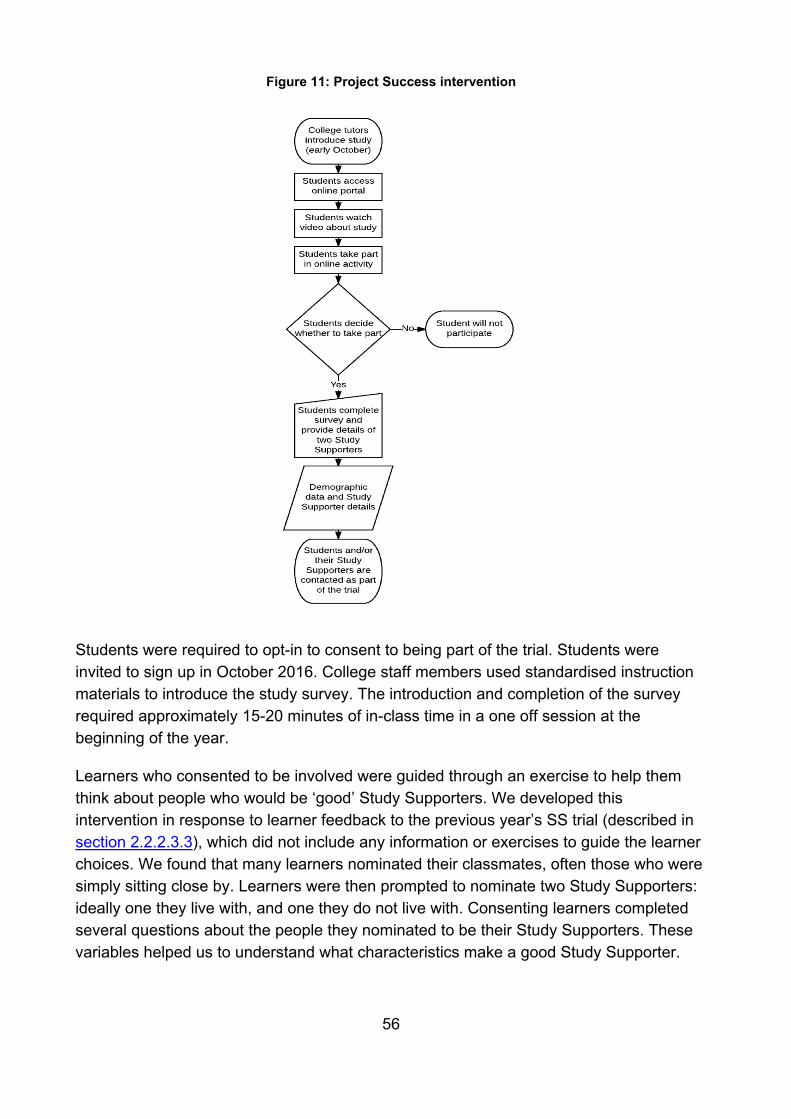
56
Figure 11: Project Success intervention
Students were required to opt-in to consent to being part of the trial. Students were invited to sign up in October 2016. College staff members used standardised instruction materials to introduce the study survey. The introduction and completion of the survey required approximately 15-20 minutes of in-class time in a one off session at the beginning of the year.
Learners who consented to be involved were guided through an exercise to help them think about people who would be ‘good’ Study Supporters. We developed this intervention in response to learner feedback to the previous year’s SS trial (described in section 2.2.2.3.3), which did not include any information or exercises to guide the learner choices. We found that many learners nominated their classmates, often those who were simply sitting close by. Learners were then prompted to nominate two Study Supporters: ideally one they live with, and one they do not live with. Consenting learners completed several questions about the people they nominated to be their Study Supporters. These variables helped us to understand what characteristics make a good Study Supporter.
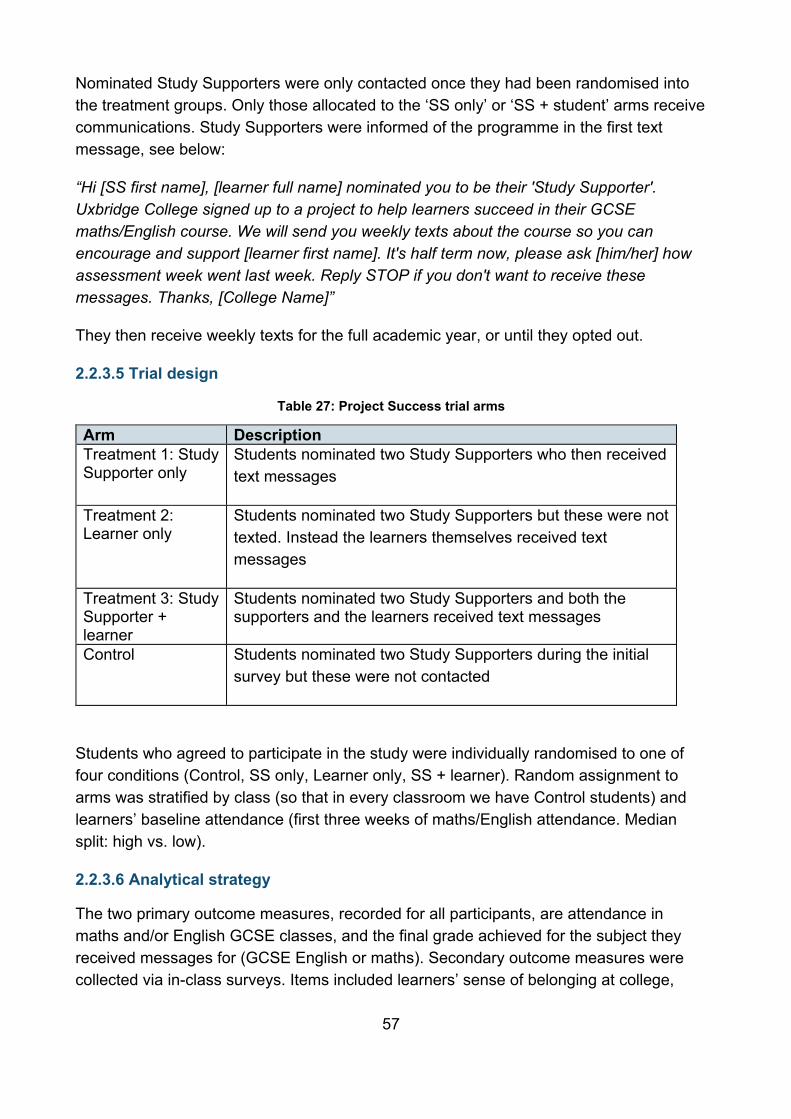
57
Nominated Study Supporters were only contacted once they had been randomised into the treatment groups. Only those allocated to the ‘SS only’ or ‘SS + student’ arms receive communications. Study Supporters were informed of the programme in the first text message, see below:
“Hi [SS first name], [learner full name] nominated you to be their 'Study Supporter'. Uxbridge College signed up to a project to help learners succeed in their GCSE maths/English course. We will send you weekly texts about the course so you can encourage and support [learner first name]. It's half term now, please ask [him/her] how assessment week went last week. Reply STOP if you don't want to receive these messages. Thanks, [College Name]”
They then receive weekly texts for the full academic year, or until they opted out.
2.2.3.5 Trial design
Table 27: Project Success trial arms
Arm Description Treatment 1: Study Supporter only
Students nominated two Study Supporters who then received text messages
Treatment 2: Learner only
Students nominated two Study Supporters but these were not texted. Instead the learners themselves received text messages
Treatment 3: Study Supporter + learner
Students nominated two Study Supporters and both the supporters and the learners received text messages
Control Students nominated two Study Supporters during the initial survey but these were not contacted
Students who agreed to participate in the study were individually randomised to one of four conditions (Control, SS only, Learner only, SS + learner). Random assignment to arms was stratified by class (so that in every classroom we have Control students) and learners’ baseline attendance (first three weeks of maths/English attendance. Median split: high vs. low).
2.2.3.6 Analytical strategy
The two primary outcome measures, recorded for all participants, are attendance in maths and/or English GCSE classes, and the final grade achieved for the subject they received messages for (GCSE English or maths). Secondary outcome measures were collected via in-class surveys. Items included learners’ sense of belonging at college,
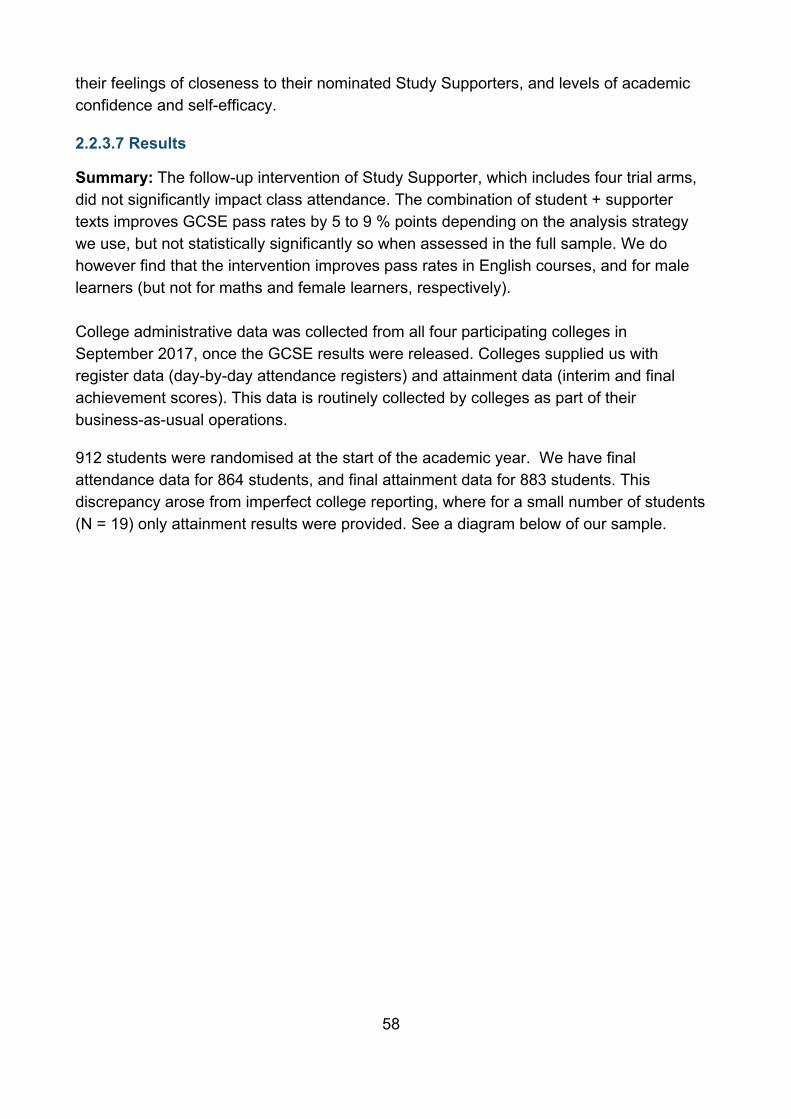
58
their feelings of closeness to their nominated Study Supporters, and levels of academic confidence and self-efficacy.
2.2.3.7 Results
Summary: The follow-up intervention of Study Supporter, which includes four trial arms, did not significantly impact class attendance. The combination of student + supporter texts improves GCSE pass rates by 5 to 9 % points depending on the analysis strategy we use, but not statistically significantly so when assessed in the full sample. We do however find that the intervention improves pass rates in English courses, and for male learners (but not for maths and female learners, respectively). College administrative data was collected from all four participating colleges in September 2017, once the GCSE results were released. Colleges supplied us with register data (day-by-day attendance registers) and attainment data (interim and final achievement scores). This data is routinely collected by colleges as part of their business-as-usual operations.
912 students were randomised at the start of the academic year. We have final attendance data for 864 students, and final attainment data for 883 students. This discrepancy arose from imperfect college reporting, where for a small number of students (N = 19) only attainment results were provided. See a diagram below of our sample.
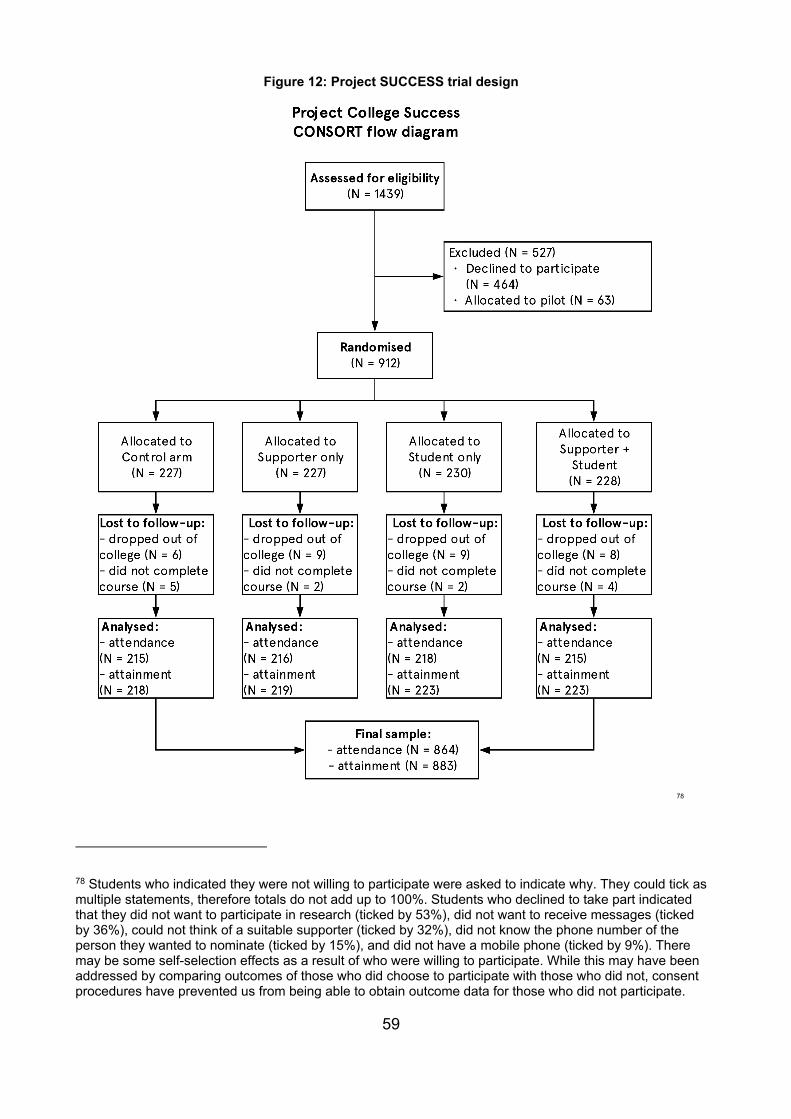
59
Figure 12: Project SUCCESS trial design
78
78 Students who indicated they were not willing to participate were asked to indicate why. They could tick as multiple statements, therefore totals do not add up to 100%. Students who declined to take part indicated that they did not want to participate in research (ticked by 53%), did not want to receive messages (ticked by 36%), could not think of a suitable supporter (ticked by 32%), did not know the phone number of the person they wanted to nominate (ticked by 15%), and did not have a mobile phone (ticked by 9%). There may be some self-selection effects as a result of who were willing to participate. While this may have been addressed by comparing outcomes of those who did choose to participate with those who did not, consent procedures have prevented us from being able to obtain outcome data for those who did not participate.
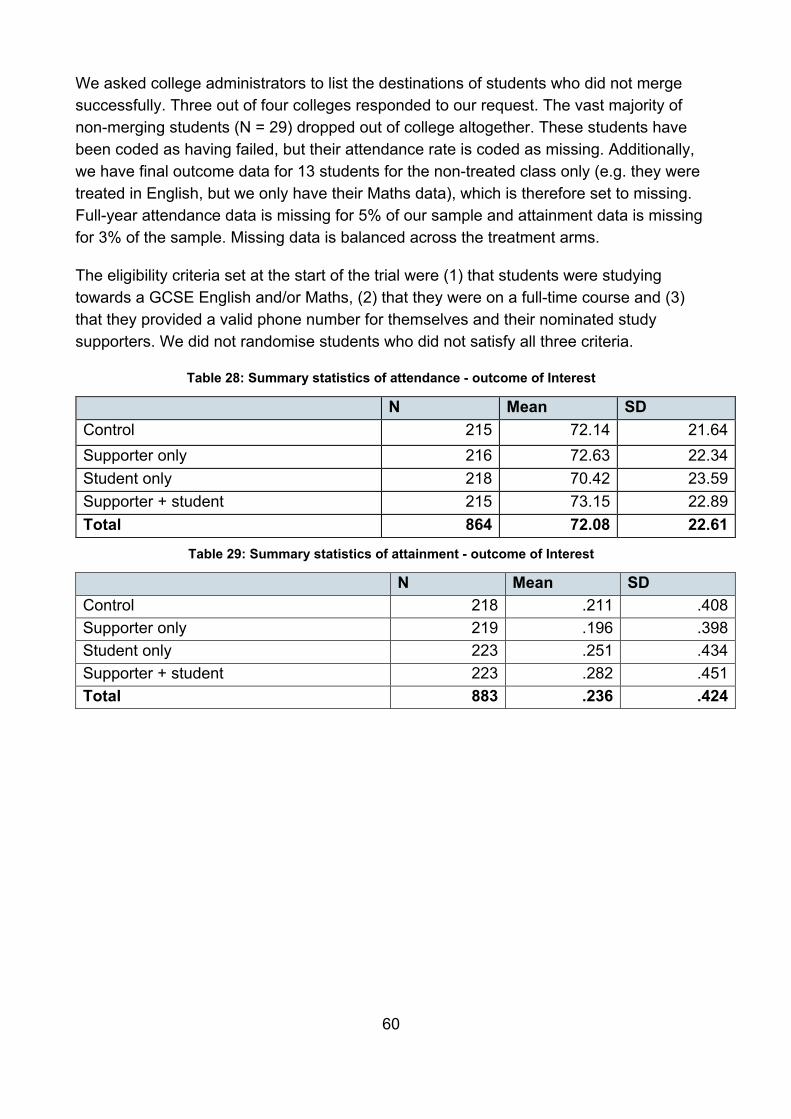
60
We asked college administrators to list the destinations of students who did not merge successfully. Three out of four colleges responded to our request. The vast majority of non-merging students (N = 29) dropped out of college altogether. These students have been coded as having failed, but their attendance rate is coded as missing. Additionally, we have final outcome data for 13 students for the non-treated class only (e.g. they were treated in English, but we only have their Maths data), which is therefore set to missing. Full-year attendance data is missing for 5% of our sample and attainment data is missing for 3% of the sample. Missing data is balanced across the treatment arms.
The eligibility criteria set at the start of the trial were (1) that students were studying towards a GCSE English and/or Maths, (2) that they were on a full-time course and (3) that they provided a valid phone number for themselves and their nominated study supporters. We did not randomise students who did not satisfy all three criteria.
Table 28: Summary statistics of attendance - outcome of Interest
N Mean SD Control 215 72.14 21.64 Supporter only 216 72.63 22.34 Student only 218 70.42 23.59 Supporter + student 215 73.15 22.89 Total 864 72.08 22.61
Table 29: Summary statistics of attainment - outcome of Interest
N Mean SD Control 218 .211 .408 Supporter only 219 .196 .398 Student only 223 .251 .434 Supporter + student 223 .282 .451 Total 883 .236 .424
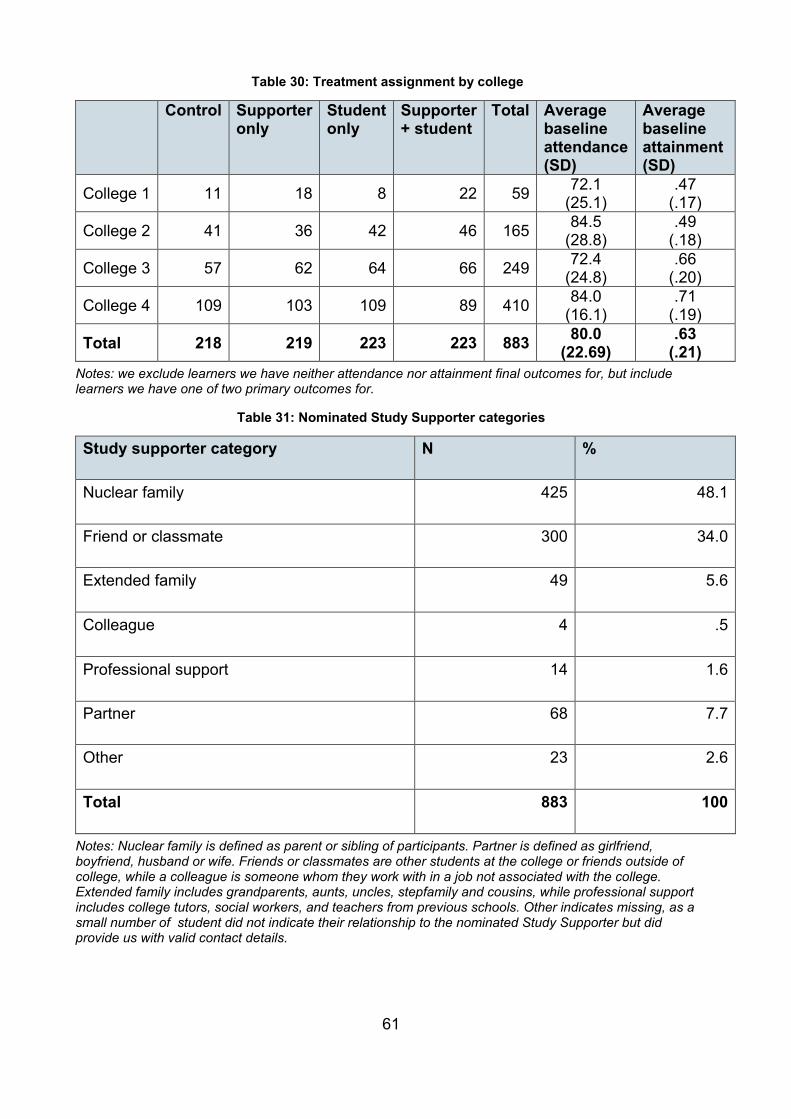
61
Table 30: Treatment assignment by college
Control Supporter
only Student only
Supporter + student
Total Average baseline attendance (SD)
Average baseline attainment (SD)
College 1 11 18 8 22 59 72.1 (25.1)
.47 (.17)
College 2 41 36 42 46 165 84.5 (28.8)
.49 (.18)
College 3 57 62 64 66 249 72.4 (24.8)
.66 (.20)
College 4 109 103 109 89 410 84.0 (16.1)
.71 (.19)
Total 218 219 223 223 883 80.0 (22.69)
.63 (.21)
Notes: we exclude learners we have neither attendance nor attainment final outcomes for, but include learners we have one of two primary outcomes for.
Table 31: Nominated Study Supporter categories
Study supporter category N %
Nuclear family 425 48.1
Friend or classmate 300 34.0
Extended family 49 5.6
Colleague 4 .5
Professional support 14 1.6
Partner 68 7.7
Other 23 2.6
Total 883 100
Notes: Nuclear family is defined as parent or sibling of participants. Partner is defined as girlfriend, boyfriend, husband or wife. Friends or classmates are other students at the college or friends outside of college, while a colleague is someone whom they work with in a job not associated with the college. Extended family includes grandparents, aunts, uncles, stepfamily and cousins, while professional support includes college tutors, social workers, and teachers from previous schools. Other indicates missing, as a small number of student did not indicate their relationship to the nominated Study Supporter but did provide us with valid contact details.
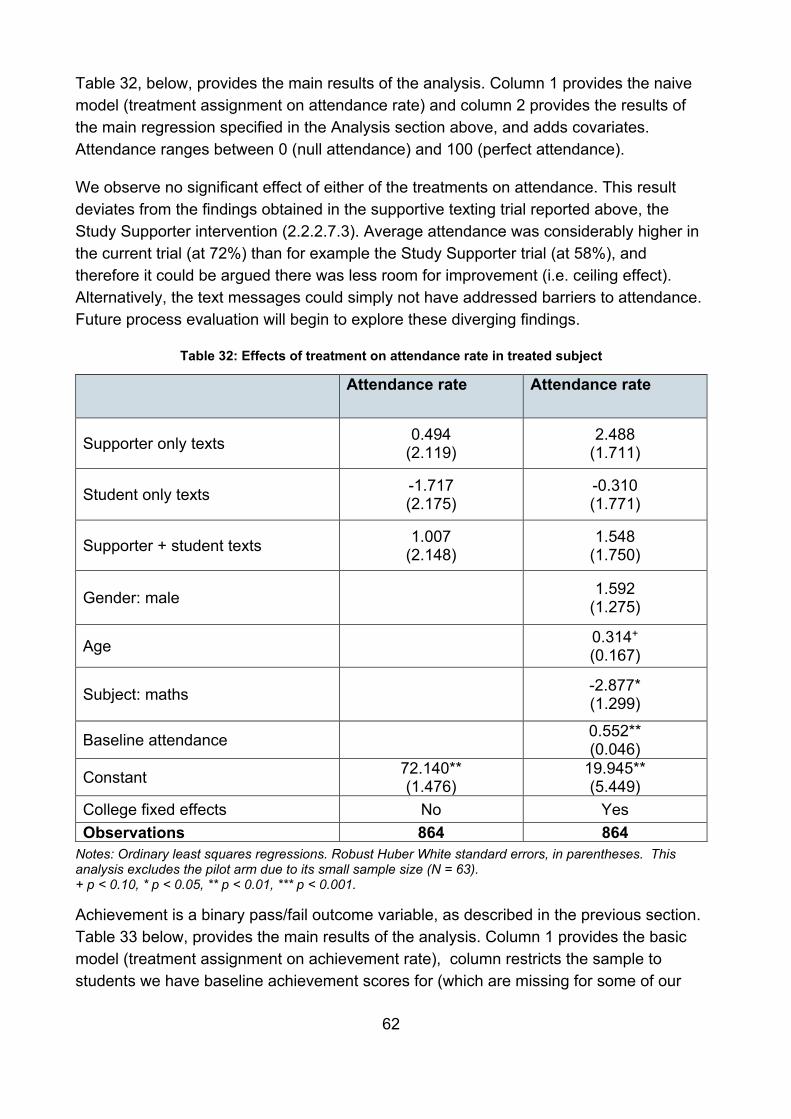
62
Table 32, below, provides the main results of the analysis. Column 1 provides the naive model (treatment assignment on attendance rate) and column 2 provides the results of the main regression specified in the Analysis section above, and adds covariates. Attendance ranges between 0 (null attendance) and 100 (perfect attendance).
We observe no significant effect of either of the treatments on attendance. This result deviates from the findings obtained in the supportive texting trial reported above, the Study Supporter intervention (2.2.2.7.3). Average attendance was considerably higher in the current trial (at 72%) than for example the Study Supporter trial (at 58%), and therefore it could be argued there was less room for improvement (i.e. ceiling effect). Alternatively, the text messages could simply not have addressed barriers to attendance. Future process evaluation will begin to explore these diverging findings.
Table 32: Effects of treatment on attendance rate in treated subject
Attendance rate
Attendance rate
Supporter only texts 0.494 (2.119)
2.488 (1.711)
Student only texts -1.717 (2.175)
-0.310 (1.771)
Supporter + student texts 1.007 (2.148)
1.548 (1.750)
Gender: male 1.592 (1.275)
Age 0.314+ (0.167)
Subject: maths -2.877* (1.299)
Baseline attendance 0.552** (0.046)
Constant 72.140** (1.476)
19.945** (5.449)
College fixed effects No Yes Observations 864 864
Notes: Ordinary least squares regressions. Robust Huber White standard errors, in parentheses. This analysis excludes the pilot arm due to its small sample size (N = 63). + p < 0.10, * p < 0.05, ** p < 0.01, *** p < 0.001.
Achievement is a binary pass/fail outcome variable, as described in the previous section. Table 33 below, provides the main results of the analysis. Column 1 provides the basic model (treatment assignment on achievement rate), column restricts the sample to students we have baseline achievement scores for (which are missing for some of our
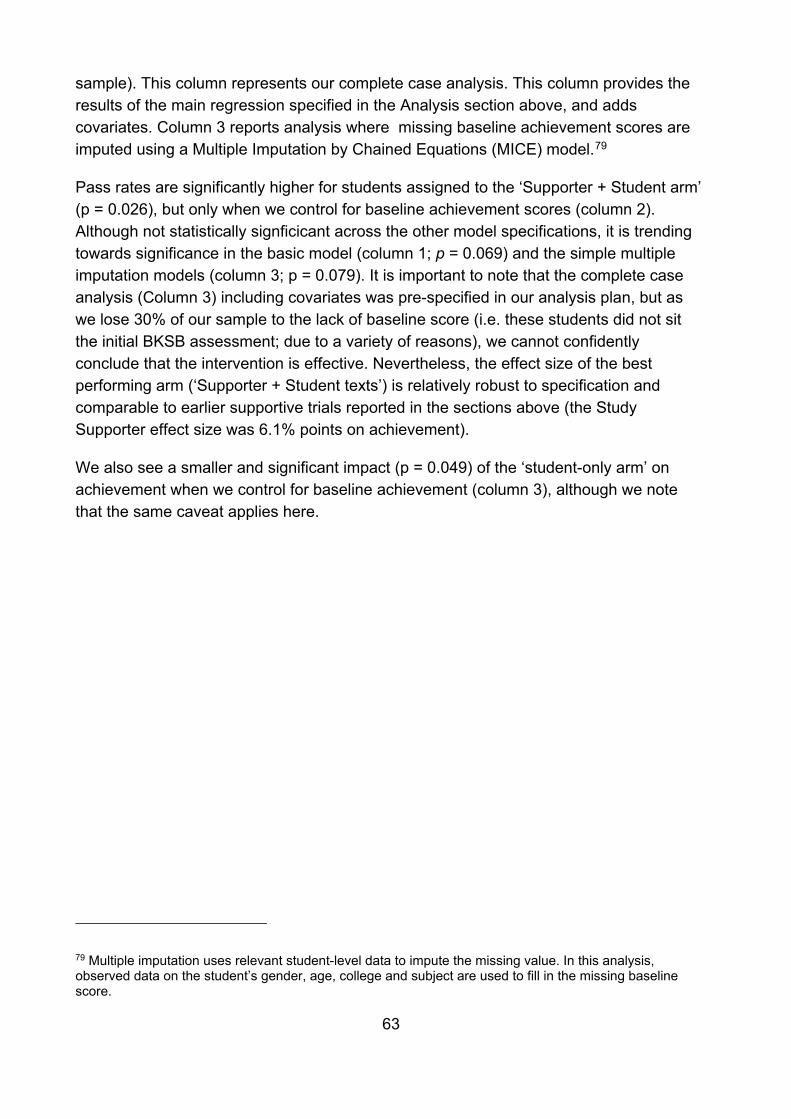
63
sample). This column represents our complete case analysis. This column provides the results of the main regression specified in the Analysis section above, and adds covariates. Column 3 reports analysis where missing baseline achievement scores are imputed using a Multiple Imputation by Chained Equations (MICE) model.79
Pass rates are significantly higher for students assigned to the ‘Supporter + Student arm’ (p = 0.026), but only when we control for baseline achievement scores (column 2). Although not statistically signficicant across the other model specifications, it is trending towards significance in the basic model (column 1; p = 0.069) and the simple multiple imputation models (column 3; p = 0.079). It is important to note that the complete case analysis (Column 3) including covariates was pre-specified in our analysis plan, but as we lose 30% of our sample to the lack of baseline score (i.e. these students did not sit the initial BKSB assessment; due to a variety of reasons), we cannot confidently conclude that the intervention is effective. Nevertheless, the effect size of the best performing arm (‘Supporter + Student texts’) is relatively robust to specification and comparable to earlier supportive trials reported in the sections above (the Study Supporter effect size was 6.1% points on achievement).
We also see a smaller and significant impact (p = 0.049) of the ‘student-only arm’ on achievement when we control for baseline achievement (column 3), although we note that the same caveat applies here.
79 Multiple imputation uses relevant student-level data to impute the missing value. In this analysis, observed data on the student’s gender, age, college and subject are used to fill in the missing baseline score.
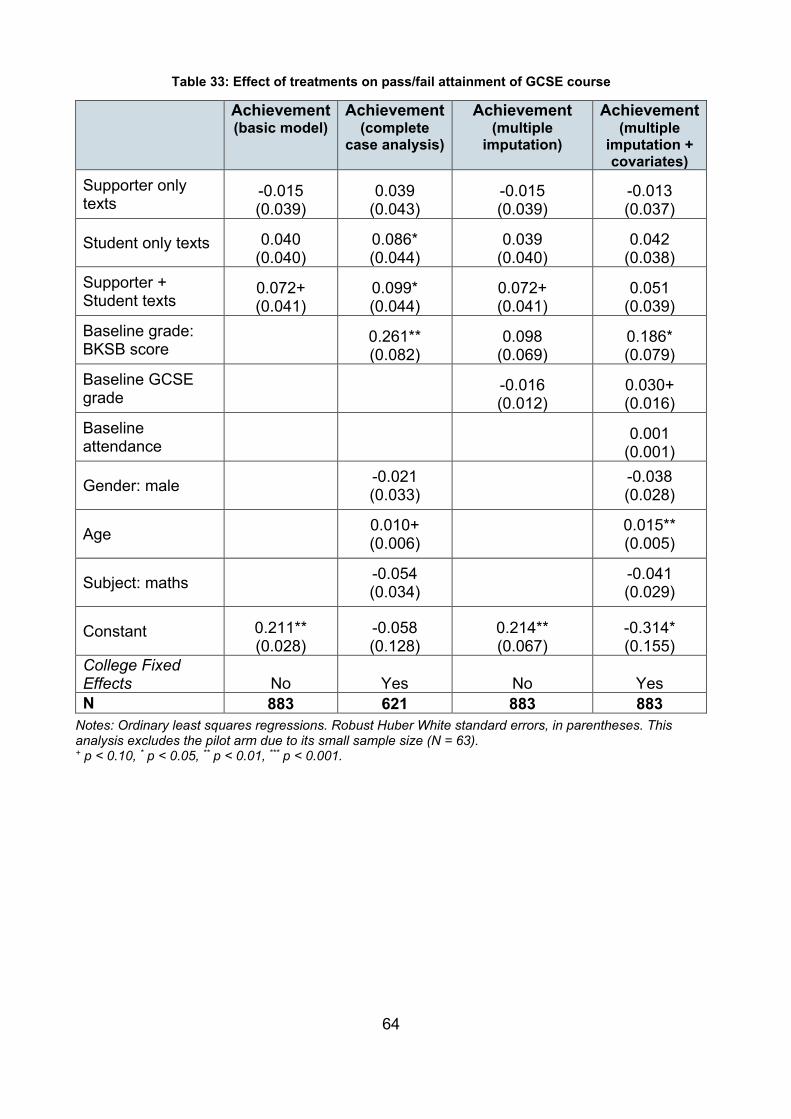
64
Table 33: Effect of treatments on pass/fail attainment of GCSE course
Achievement (basic model)
Achievement (complete
case analysis)
Achievement (multiple
imputation)
Achievement (multiple
imputation + covariates)
Supporter only texts
-0.015 (0.039)
0.039 (0.043)
-0.015 (0.039)
-0.013 (0.037)
Student only texts 0.040 (0.040)
0.086* (0.044)
0.039 (0.040)
0.042 (0.038)
Supporter + Student texts
0.072+ (0.041)
0.099* (0.044)
0.072+ (0.041)
0.051 (0.039)
Baseline grade: BKSB score
0.261** (0.082)
0.098 (0.069)
0.186* (0.079)
Baseline GCSE grade
-0.016 (0.012)
0.030+ (0.016)
Baseline attendance
0.001
(0.001)
Gender: male -0.021 (0.033) -0.038
(0.028)
Age 0.010+ (0.006) 0.015**
(0.005)
Subject: maths -0.054 (0.034) -0.041
(0.029)
Constant 0.211** (0.028)
-0.058 (0.128)
0.214** (0.067)
-0.314* (0.155)
College Fixed Effects No Yes No Yes N 883 621 883 883
Notes: Ordinary least squares regressions. Robust Huber White standard errors, in parentheses. This analysis excludes the pilot arm due to its small sample size (N = 63). + p < 0.10, * p < 0.05, ** p < 0.01, *** p < 0.001.
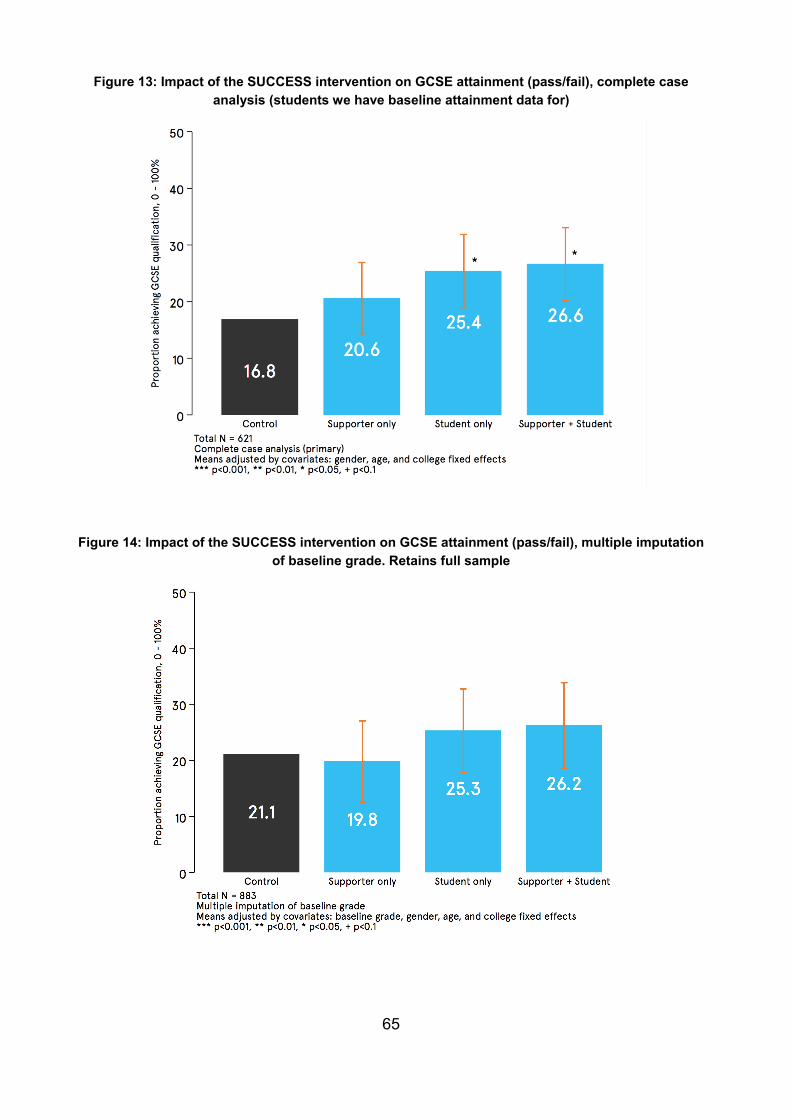
65
Figure 13: Impact of the SUCCESS intervention on GCSE attainment (pass/fail), complete case analysis (students we have baseline attainment data for)
Figure 14: Impact of the SUCCESS intervention on GCSE attainment (pass/fail), multiple imputation
of baseline grade. Retains full sample
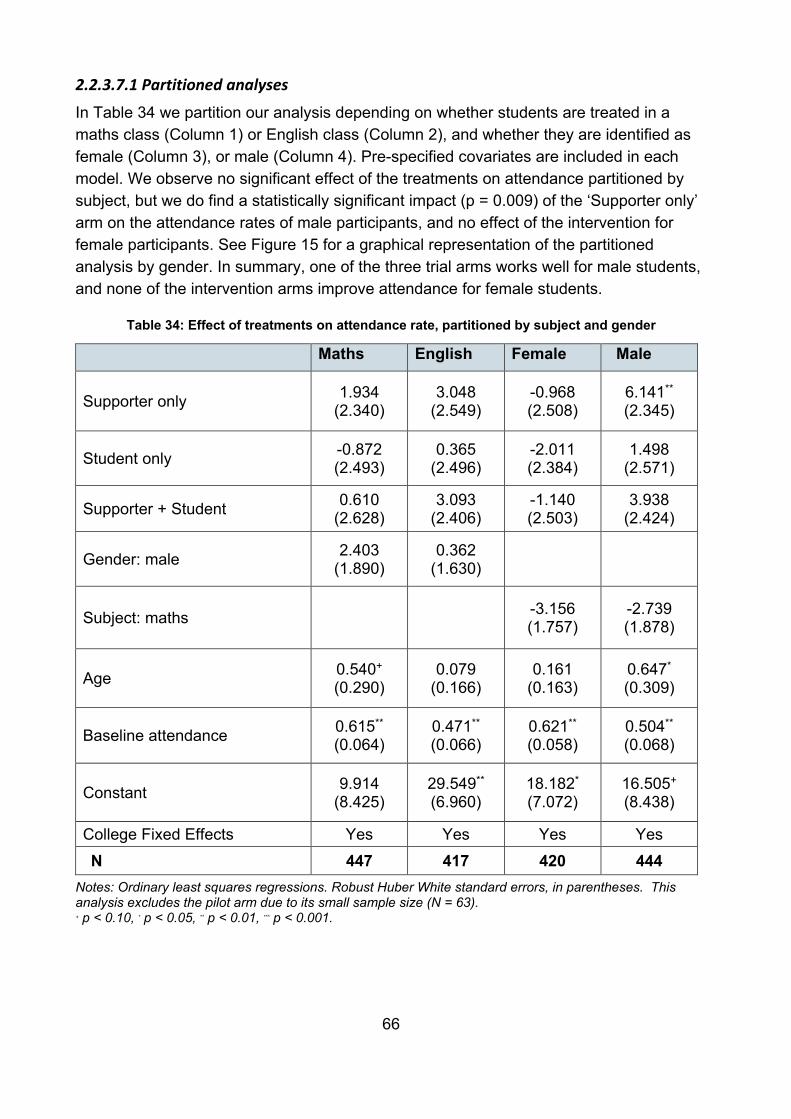
66
2.2.3.7.1 Partitioned analyses In Table 34 we partition our analysis depending on whether students are treated in a maths class (Column 1) or English class (Column 2), and whether they are identified as female (Column 3), or male (Column 4). Pre-specified covariates are included in each model. We observe no significant effect of the treatments on attendance partitioned by subject, but we do find a statistically significant impact (p = 0.009) of the ‘Supporter only’ arm on the attendance rates of male participants, and no effect of the intervention for female participants. See Figure 15 for a graphical representation of the partitioned analysis by gender. In summary, one of the three trial arms works well for male students, and none of the intervention arms improve attendance for female students.
Table 34: Effect of treatments on attendance rate, partitioned by subject and gender
Maths English Female Male
Supporter only 1.934 (2.340)
3.048 (2.549)
-0.968 (2.508)
6.141** (2.345)
Student only -0.872 (2.493)
0.365 (2.496)
-2.011 (2.384)
1.498 (2.571)
Supporter + Student 0.610 (2.628)
3.093 (2.406)
-1.140 (2.503)
3.938 (2.424)
Gender: male 2.403 (1.890)
0.362 (1.630)
Subject: maths -3.156 (1.757)
-2.739 (1.878)
Age 0.540+ (0.290)
0.079 (0.166)
0.161 (0.163)
0.647* (0.309)
Baseline attendance 0.615** (0.064)
0.471** (0.066)
0.621** (0.058)
0.504** (0.068)
Constant 9.914 (8.425)
29.549** (6.960)
18.182* (7.072)
16.505+ (8.438)
College Fixed Effects Yes Yes Yes Yes N 447 417 420 444
Notes: Ordinary least squares regressions. Robust Huber White standard errors, in parentheses. This analysis excludes the pilot arm due to its small sample size (N = 63). + p < 0.10, * p < 0.05, ** p < 0.01, *** p < 0.001.
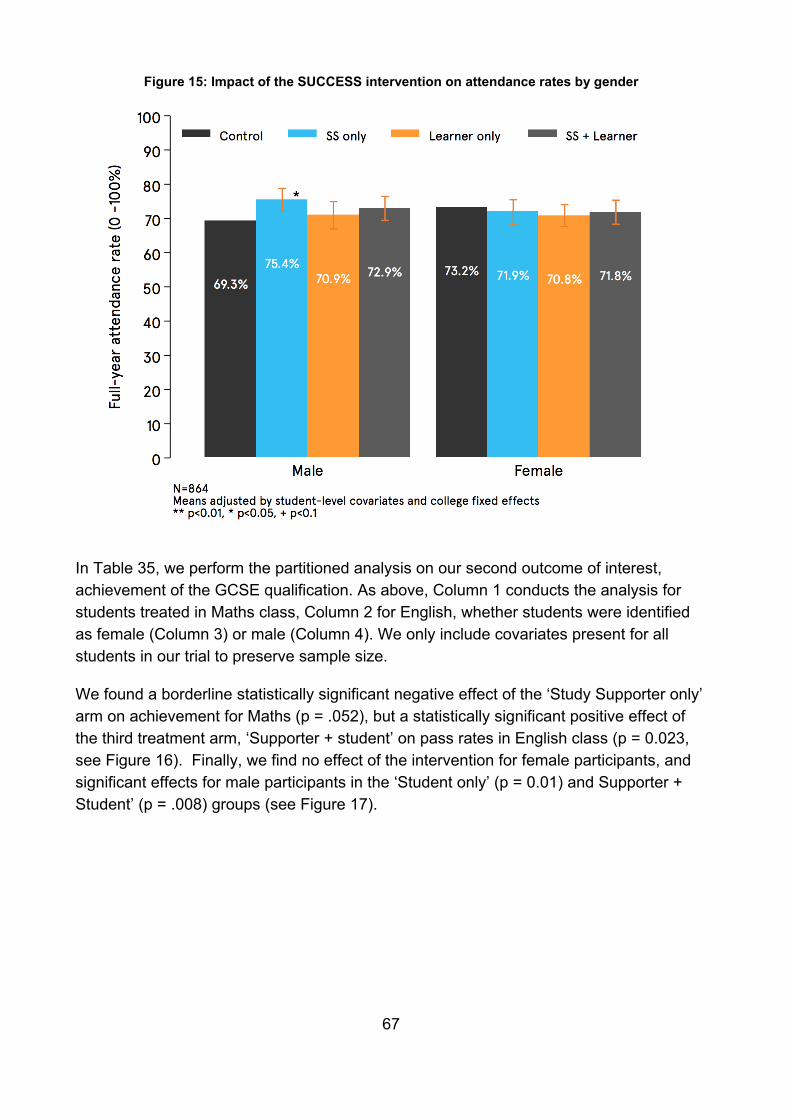
67
Figure 15: Impact of the SUCCESS intervention on attendance rates by gender
In Table 35, we perform the partitioned analysis on our second outcome of interest, achievement of the GCSE qualification. As above, Column 1 conducts the analysis for students treated in Maths class, Column 2 for English, whether students were identified as female (Column 3) or male (Column 4). We only include covariates present for all students in our trial to preserve sample size.
We found a borderline statistically significant negative effect of the ‘Study Supporter only’ arm on achievement for Maths (p = .052), but a statistically significant positive effect of the third treatment arm, ‘Supporter + student’ on pass rates in English class (p = 0.023, see Figure 16). Finally, we find no effect of the intervention for female participants, and significant effects for male participants in the ‘Student only’ (p = 0.01) and Supporter + Student’ (p = .008) groups (see Figure 17).
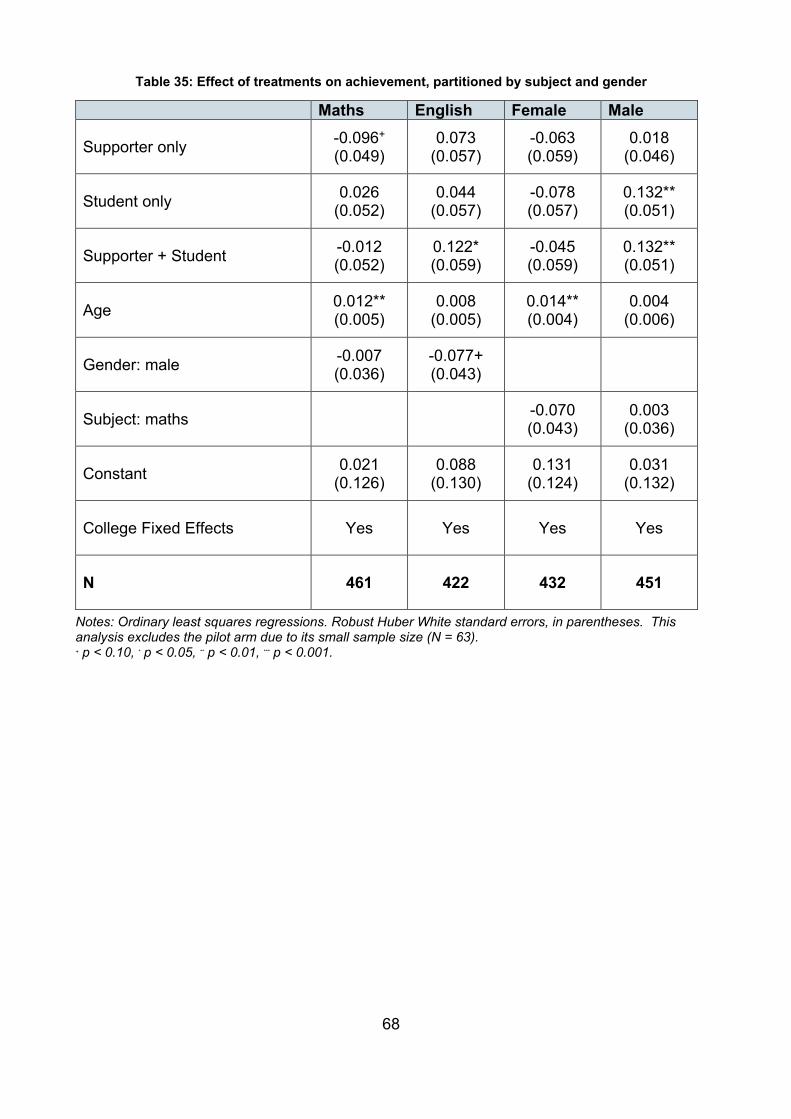
68
Table 35: Effect of treatments on achievement, partitioned by subject and gender
Maths English Female Male
Supporter only -0.096+ (0.049)
0.073 (0.057)
-0.063 (0.059)
0.018 (0.046)
Student only 0.026 (0.052)
0.044 (0.057)
-0.078 (0.057)
0.132** (0.051)
Supporter + Student -0.012 (0.052)
0.122* (0.059)
-0.045 (0.059)
0.132** (0.051)
Age 0.012** (0.005)
0.008 (0.005)
0.014** (0.004)
0.004 (0.006)
Gender: male -0.007 (0.036)
-0.077+ (0.043)
Subject: maths -0.070 (0.043)
0.003 (0.036)
Constant 0.021 (0.126)
0.088 (0.130)
0.131 (0.124)
0.031 (0.132)
College Fixed Effects Yes Yes Yes Yes
N 461 422 432 451
Notes: Ordinary least squares regressions. Robust Huber White standard errors, in parentheses. This analysis excludes the pilot arm due to its small sample size (N = 63). + p < 0.10, * p < 0.05, ** p < 0.01, *** p < 0.001.
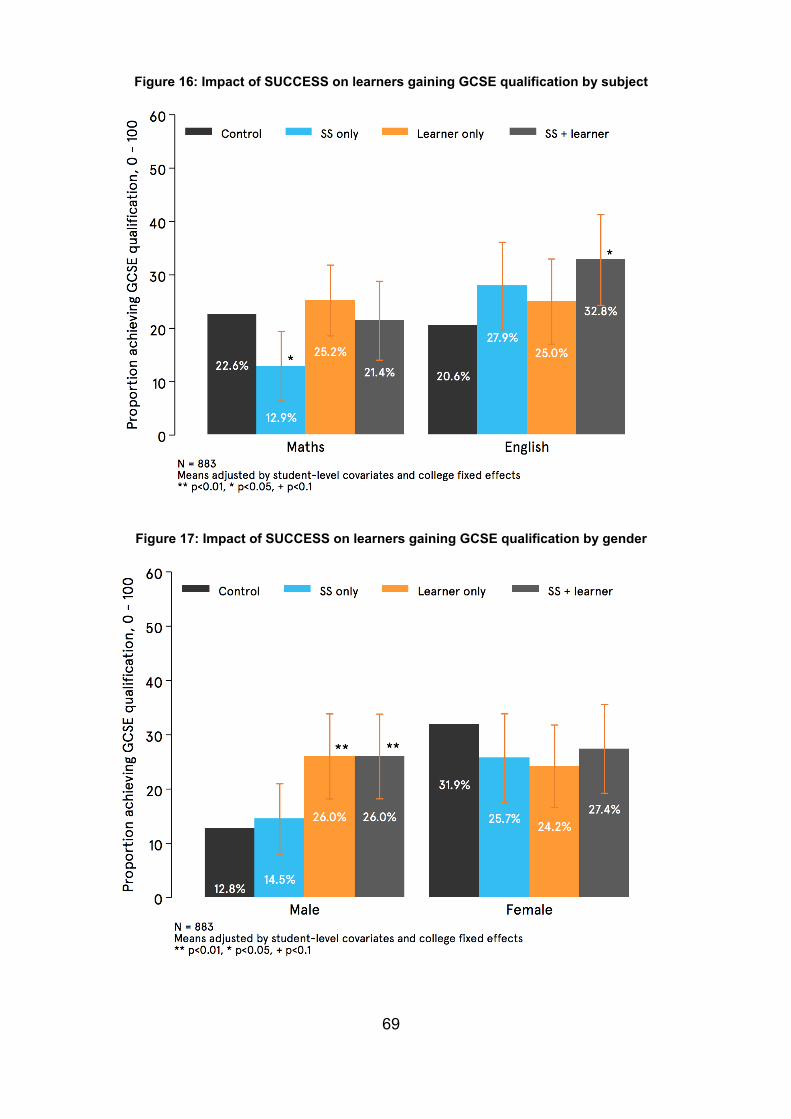
69
Figure 16: Impact of SUCCESS on learners gaining GCSE qualification by subject
Figure 17: Impact of SUCCESS on learners gaining GCSE qualification by gender
70
2.3 Project that was not taken forward BIT explored the feasibility of running one other project in FE colleges that was ultimately not taken forward. In the next section, we provide a brief description of this project along with an explanation for why it could not be progressed.
2.3.1 The World Wellbeing Project
2.3.1.1 Background
The ‘World Wellbeing Project’ (WWBP) sought to gain a better understanding of people’s wellbeing by studying the words and phrases they use on social media. Traditionally, wellbeing is measured by asking questions such as ‘on a scale of 1 to 10, how satisfied are you with your life at the moment?’.80 81 While informative, such measures suffer from a number of biases. For example, people may only report how they are feeling at the exact moment they fill out the survey, or they may respond according to how they think the researcher wants them to respond.82 WWBP tries to overcome such measurement issues by unobtrusively measuring wellbeing using the words and phrases people use in their everyday lives. Exploring the text that people produce naturally on Facebook and Twitter over time allows for a more complete picture of people’s emotions, cognitions and behaviors outside the confines of a single survey.
2.3.1.2 Theoretical motivation
Little is known about the wellbeing of FE learners.83 Part of an FE college’s mission is to ensure the care and wellbeing of learners during their education. We undertook this research to gain a better understanding of the psychological barriers learners face in college everyday as expressed in real-time changes in language on Facebook and Twitter. We compared language profiles between learners who differed in attainment and attendance. This was the first study of its kind undertaken in the UK.
80 Dolan, P., Peasgood, T., & White, M. (2008). Do we really know what makes us happy? A review of the economic literature on the factors associated with subjective wellbeing. Journal of economic psychology, 29(1), 94-122. 81 Kahneman, D., Diener, E., & Schwarz, N. (Eds.). (1999). Wellbeing: Foundations of hedonic psychology. Russell Sage Foundation. 82 Van de Mortel, T. F. (2008). Faking it: social desirability response bias in self-report research. Australian Journal of Advanced Nursing, The, 25(4), 40. 83National Union of Students (2017). Further Education and Mental Health. [online] London: National Union of Students. Available at: https://nusdigital.s3-eu-west-1.amazonaws.com/document/documents/33620/Further_Education_and_Mental_Health_FINAL_2.pdf?AWSAccessKeyId=AKIAJKEA56ZWKFU6MHNQ&Expires=1515439090&Signature=9DtkubhNZNuE6Km6nqSuPUVvDBA%3D [Accessed 8 Jan. 2018].
71
2.3.1.3 Method
Learners were asked to participate in this study in November and December of 2016. In each class, the tutor gave an overview of the project, explaining the collaboration between the college, ASK, and the University of Pennsylvania. Learners were also shown a video about the project's background and aims, a clear explanation of participation and data security, and an emphasis that participation was voluntary.
After watching the video, learners went to their individual PCs to participate. Within a pop-up form, they typed their learner ID number, demographic information, and Twitter handle. They then clicked “Agree” to share their Facebook information. Upon indicating their consent, a Facebook app downloaded their likes, status updates, gender and birthday. No information that was not shared publicly could be collected (e.g. information from private messages was not collected). Users were then presented with a personalised word cloud.
Attendance and achievement data from students who chose to participate was collected in the Spring of 2017 and securely linked to their linguistic information gathered from Facebook and Twitter.
2.3.1.4 Analytical strategy
A number of analytical techniques were used to look at the language collected from the social media participation of those learners involved in the project. The techniques looked at everything from the complexity of language (e.g. single words vs phrases) to the topics that were discussed. These were then mapped onto different validated language models of words and phrases that match on to wellbeing and other psychological measures. Below is more detail of these analytical techniques.
Linguistic feature extraction: We transformed the language pulled from each learner's social media accounts into frequencies of simpler language features that extracted two types of language features: words and phrases, and topics.
Words and phrases: To extract words and phrases, we first split each of the users’ messages into single words. Words are defined by an emoticon-aware tokenizer,84 which is sensitive to conventional words, but also to non-word features like emoticons (for example, :-)), punctuation (for example, !!!), and non-conventional spellings and usages (for example, omg, wtf). In addition to single words, we extracted phrases - two- and three-word sequences that occur at rates much higher than chance (such as happy
84 Potts, C. (2011). happyfuntokenizer (Version 1.0) [computer software]. Retrieved from: http://sentiment.christopherpotts.net/code-data/happyfuntokenizing.py.
72
birthday, I love you). We normalised the frequency counts of words and phrases by each user’s total word count.
Topics: Topics are clusters of semantically related words created through latent Dirichlet allocation (LDA), a clustering method akin to factor analysis, but appropriate for the statistical distributions observed in natural language.8586 LDA assumes that a document (in this case, individual status updates) is a mixture of a fixed number of latent topics where each topic is a cluster of related words (this fixed number is specified in advance). Through an iterative procedure, LDA identifies and refines the specified number of clusters of words. An example of a topic identified by LDA includes the reading oriented words book, books, newspaper, stories, pages, review, articles, magazine, read, reading, reads, bible, pages, wikipedia. These words tend to co-occur with each other in status updates and are automatically identified by the LDA procedure. We fit an LDA model using an implementation provided in the Mallet package,87 setting the number of topics to 2,000. This produced naturally occurring topics, each consisting of many words with relative weights. The topics were defined purely on the basis of the distribution of language use across statuses without consideration of wellbeing or other outcome variables. We then calculated each individual’s use of each topic. For example, a person who mentions the words reads, books, and article would have a higher probability of using the reading topic described above as these three words are heavily weighted within that topic.
Measuring wellbeing from language: Once words, phrases, and topics were extracted, we applied language models previously developed by the World Wellbeing Project at the University of Pennsylvania. In its simplest form, these prediction models behave like lexica, within which each word has a weight. Wellbeing of the language user is then estimated based on how frequently certain words and phrases occur in the next. This allowed us to both measure wellbeing within learners from a certain school, as well as to compare aspects of wellbeing across schools. We also applied lexica to assess other variables of interest related to wellbeing, such as future orientation, depression, and personality also developed by WWBP. Finally, we included a set of psychological dictionaries provided by the Linguistic Inventory Word Count software (LIWC) in our analysis, a set of dictionaries widely used in the psychological literature.
85 Blei, David M., Andrew Y. Ng, and Michael I. Jordan. "Latent dirichlet allocation." the Journal of machine Learning research 3 (2003): 993-1022. 86 Atkins, D. C., Baldwin, S. A., Zheng, C., Gallop, R. J., & Neighbors, C. (2013). A tutorial on count regression and zero-altered count models for longitudinal substance use data. Psychology of Addictive Behaviors, 27(1), 166. 87 MacCallum, R. C., Zhang, S., Preacher, K. J., & Rucker, D. D. (2002). On the practice of dichotomization of quantitative variables. Psychological methods, 7(1), 19.
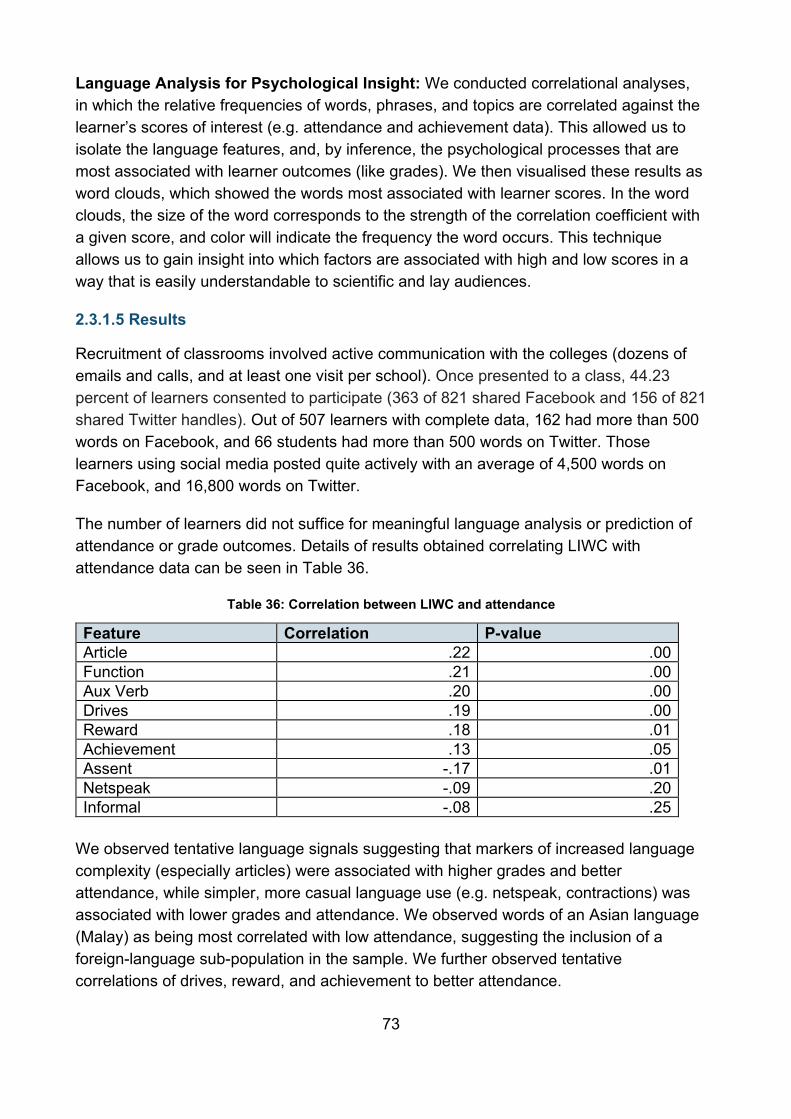
73
Language Analysis for Psychological Insight: We conducted correlational analyses, in which the relative frequencies of words, phrases, and topics are correlated against the learner’s scores of interest (e.g. attendance and achievement data). This allowed us to isolate the language features, and, by inference, the psychological processes that are most associated with learner outcomes (like grades). We then visualised these results as word clouds, which showed the words most associated with learner scores. In the word clouds, the size of the word corresponds to the strength of the correlation coefficient with a given score, and color will indicate the frequency the word occurs. This technique allows us to gain insight into which factors are associated with high and low scores in a way that is easily understandable to scientific and lay audiences.
2.3.1.5 Results
Recruitment of classrooms involved active communication with the colleges (dozens of emails and calls, and at least one visit per school). Once presented to a class, 44.23 percent of learners consented to participate (363 of 821 shared Facebook and 156 of 821 shared Twitter handles). Out of 507 learners with complete data, 162 had more than 500 words on Facebook, and 66 students had more than 500 words on Twitter. Those learners using social media posted quite actively with an average of 4,500 words on Facebook, and 16,800 words on Twitter.
The number of learners did not suffice for meaningful language analysis or prediction of attendance or grade outcomes. Details of results obtained correlating LIWC with attendance data can be seen in Table 36.
Table 36: Correlation between LIWC and attendance
Feature Correlation P-value Article .22 .00 Function .21 .00 Aux Verb .20 .00 Drives .19 .00 Reward .18 .01 Achievement .13 .05 Assent -.17 .01 Netspeak -.09 .20 Informal -.08 .25
We observed tentative language signals suggesting that markers of increased language complexity (especially articles) were associated with higher grades and better attendance, while simpler, more casual language use (e.g. netspeak, contractions) was associated with lower grades and attendance. We observed words of an Asian language (Malay) as being most correlated with low attendance, suggesting the inclusion of a foreign-language sub-population in the sample. We further observed tentative correlations of drives, reward, and achievement to better attendance.
74
While this study did not yield a significant sample, it may provide insights for future studies involving the collection of social media data for language analysis. Most importantly, collecting a sufficient sample size is critical. Based on comparable studies, we recommend a final sample of 1,500 or more learners to draw meaningful conclusions, which means that 4,000-5,000 learners need to be approached during the study.
When working with technology in colleges, the importance of piloting with existing facilities cannot be overstated. Before launching, it may be helpful to create an inventory of the types of computers and browsers available in each college, and ensuring that a field test is performed before introducing it to all learners. We observed noticeably lower consent rates in learners where technology did not function as expected.
One of the colleges in our sample chose to present an internet safety lesson on the same day as the study. This lesson discouraged learners from sharing their social media information with anyone, on the same day that we asked the learners to share their social media information in our study. The consent rate was considerably lower at this college. For this reason, we recommend providing a class lesson that teachers can use on the day of participation, which can help establish the appropriate scientific context for the research project and data collection. This may increase participation rates, and further standardize the conditions of the study across schools.
2.4 Impact and significance The trials run with the FE sector were some of the largest ever run in FE (or their equivalent) anywhere in the world. Producing a series of useful and positive findings, this work has garnered significant interest from colleges across England looking to implement the successful interventions.
The Study Supporter intervention was scaled up to 30 colleges in collaboration with the Education Endowment Foundation (EEF).
Other work has extended to the Education Training Foundation’s (ETF) ‘Outstanding Teaching and Learning Assessment’ training course which helps leaders in the FE sector to develop ideas to help make teaching and learning more effective. This work is a continuation of a series of webinars we ran for the ETF.
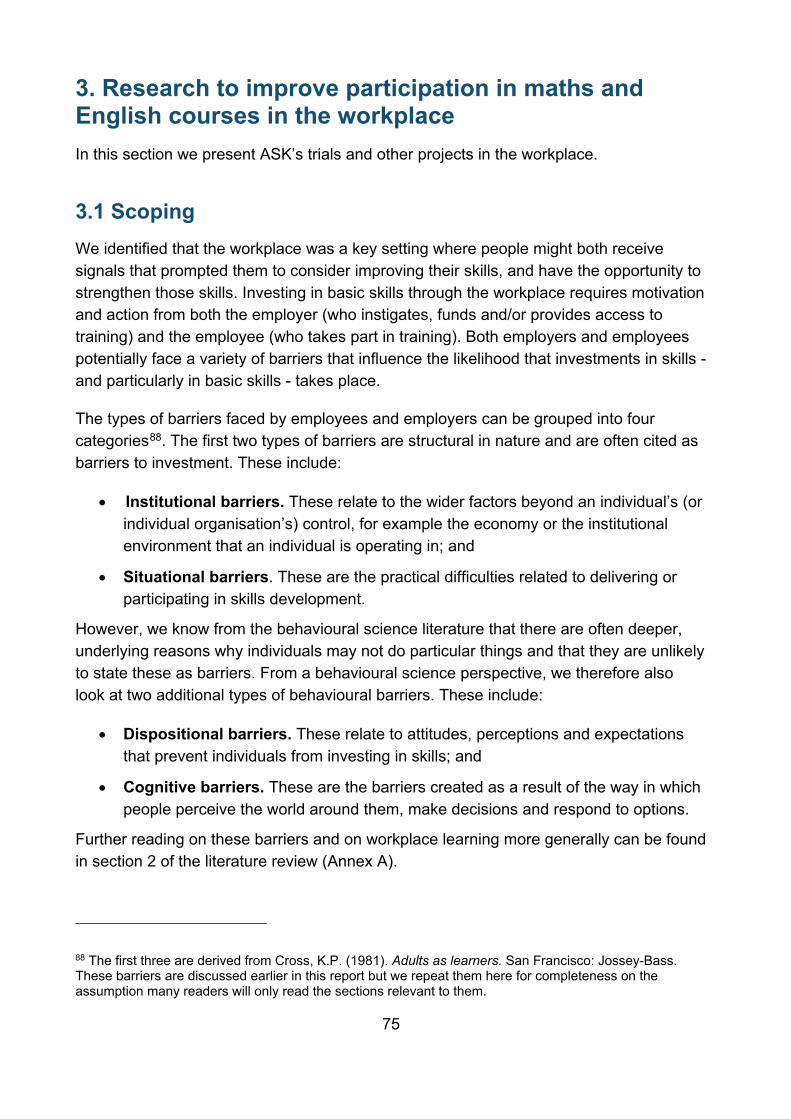
75
3. Research to improve participation in maths and English courses in the workplace In this section we present ASK’s trials and other projects in the workplace.
3.1 Scoping We identified that the workplace was a key setting where people might both receive signals that prompted them to consider improving their skills, and have the opportunity to strengthen those skills. Investing in basic skills through the workplace requires motivation and action from both the employer (who instigates, funds and/or provides access to training) and the employee (who takes part in training). Both employers and employees potentially face a variety of barriers that influence the likelihood that investments in skills - and particularly in basic skills - takes place.
The types of barriers faced by employees and employers can be grouped into four categories88. The first two types of barriers are structural in nature and are often cited as barriers to investment. These include:
• Institutional barriers. These relate to the wider factors beyond an individual’s (or individual organisation’s) control, for example the economy or the institutional environment that an individual is operating in; and
• Situational barriers. These are the practical difficulties related to delivering or participating in skills development.
However, we know from the behavioural science literature that there are often deeper, underlying reasons why individuals may not do particular things and that they are unlikely to state these as barriers. From a behavioural science perspective, we therefore also look at two additional types of behavioural barriers. These include:
• Dispositional barriers. These relate to attitudes, perceptions and expectations that prevent individuals from investing in skills; and
• Cognitive barriers. These are the barriers created as a result of the way in which people perceive the world around them, make decisions and respond to options.
Further reading on these barriers and on workplace learning more generally can be found in section 2 of the literature review (Annex A).
88 The first three are derived from Cross, K.P. (1981). Adults as learners. San Francisco: Jossey-Bass. These barriers are discussed earlier in this report but we repeat them here for completeness on the assumption many readers will only read the sections relevant to them.

76
We worked with a several employers who kindly gave us their time and allowed us visit their workplaces to speak to learning and development teams, managers, and employees. These included: both unionised and non-unionised workplaces, those with on-site learning provision and those without, public, public-interest and private sector organisations, and several meetings, workshops and focus groups. We also spoke to employer and employee representative organisations.
From these discussions, we identified a range of barriers for both learners and employees. For learners, we heard the following:
• Managers and peers identified that employees with low skills may be reluctant to identify themselves as lacking these skills as they perceived both social and occupational consequences.
• There was an acknowledgement from managers and others that limited maths and English skills may represent a barrier to further skills development and promotion, but that this was difficult to make concrete for both them and employees.
• However, in some cases, there was genuinely no prospect of career progression within the organisation or local area, which led to a “why bother” mindset around occupational skills development generally.
• Practical barriers were frequently raised, such as the lack of access to (paid) time off or financial support for study, especially where employees were unwilling or unable to take on the financial and time cost of training.
• Where employees started training, there was a risk that they would drop off the course, especially because of work pressures.
Regarding employers, we heard:
• Many employers do have a general interest in improving the skills and capacity of their workforce, for business reasons.
• They may also view staff learning as part of community responsibility, particularly for public or public-interest organisations.
• However, we heard frequently that this commitment to learning was not reflected in action at the organisational unit level, particularly where the business was dealing with high workload or budget cuts.
• Organisations were focused on mandatory (operational/ professional) training
• Low-skilled staff were often seen as marginal to the organisation, and therefore not a priority for development and retention.
• Many employers view it as government’s job to ensure people have basic maths and English skills.
77
From a behavioural perspective, we reflected that a major barrier to individuals undertaking maths and English training in the workplace is the link between those skills and their job performance. Feedback suggested it was difficult to engage employees in low-skilled jobs because they perceived (possibly correctly) that there were no prospects of progression in their workplace regardless of their skills. However, there was a view that the confidence boost of skills achievement could help people earn promotions. Some employers also noted that they would consider employees improving their maths and English as a signal of self-motivation that could lead to greater prospects; however, given the well-known gap between what people say and how they act, it would be difficult to argue compellingly to employees that this would be the case without further research.
We also saw union-supported learning, through learning centres and Union Learning Representatives (ULRs) as one of the few effective existing models of work-based support for maths and English. The ULRs emphasised that in their view this was because of the peer element: ULRs are colleagues and friends, rather than managers, and therefore employees were more willing to come to them about this type of training.
For both employees and employers, the costs of undertaking literacy and numeracy training are concentrated, and borne by the individual in the present (especially if they could not access paid time off), but the benefits are diffuse, difficult to imagine, and distributed into the future. It is generally not until after skills improvement that the benefits of this became clear.
A striking case study was reported by the manager of a union-run learning centre in a garbage collection depot on the south coast. Before the learning centre was established, nobody had thought that low maths and English skills were impacting the running of the organisation. However, over five or so years, the offer of maths and English was taken up by many of the drivers: only one or two at first, who then went back into their units and told their colleagues, who then went and did the training, and over time the skill-level of the entire workforce was raised, and this changed the entire way the depot ran. For example, before the learning centre was in place, drivers tended to only drive one route, because they were not confident reading and interpreting street maps. This caused significant disruption if someone was unable to do their shift, as it was difficult to flex routes across other drivers. In addition, managers used to fill out reporting paperwork for the drivers. As the drivers became more skilled, they were able to undertake multiple routes and complete their own paperwork, making the entire depot more productive and freeing up managers for other tasks.
From the scoping, we drew out a number of areas for further investigation: making salient the benefits of the qualification; influencing cues from managers; and leveraging peer messages.
78
3.2. Implemented projects or trials
3.2.1 Testing job-search benefits of Level 2 qualifications
3.2.1.1 Background
The aim of this study was not focussed on changing behaviour, but to investigate the effect on employability of various combinations of ‘qualifications’ and ‘voluntary work’ on a CV. This was used as a direct proxy for the employability effect of these qualifications and volunteering experiences for individuals who were unemployed and searching for a job at the time of the trial.
3.2.1.2 Theoretical motivation
Qualitative research with employers suggests that they may value GCSE qualificaitons above Functional Skills qualifiations.89 90 We therefore sought to test if employers routinely discriminate against learners with no qualification versus those with a Functional Skills qualification, versus those with a GCSE qualification. Evidence from the academic literature suggests that employers may be biased in their decisions to put forward an applicant for interview, and that this depends on the name of the applicant or other personal characteristics. For example, a study in the US showed that applicants with ‘white’ sounding names were more likely to attain a job interview than those with African American names.91 This project was partly funded by the ‘Capacity Building Grant for Understanding Charitable Giving’ at the University of Bristol. We varied the type of volunteering across CVs - altruistic volunteering (such as volunteering in a soup kitchen) or skilled volunteering (such a fundraising or managing the books for a charity). We do not focus on the effect of volunteering experience in this report as understanding the impact of different qualificaitons was the primary objective of this work. 3.2.1.3 Intervention
This project was not an intervention RCT, but was aimed at looking to better understand the labour market recognition of different maths and English qualifications.
The CVs contained various combinations of three levels of qualification for both maths and English; no qualifications, Functional Skills qualifications (Level 2), and GCSEs, and 89 The Education and Training Foundation (2015). Making maths and English work for all: The review of what employers and learners need from the maths and English qualifications taken by young people and adults. [online] London: The Education and Training Foundation. Available at: http://www.et-foundation.co.uk/wp-content/uploads/2015/03/Making-maths-and-English-work-for-all-25_03_2015001.pdf [Accessed 8 Jan. 2018]. 90 Watkin, B. (2016). GCSE vs functional skills: which English and maths resits should your students take?. FE Week. [online] Available at: http://feweek.co.uk/2016/09/11/gcses-vs-functional-skills-which-english-and-maths-resits-should-your-students-take/ [Accessed 8 Jan. 2018]. 91 Lavergne, M., & Mullainathan, S. (2004). Are Emily and Greg more employable than Lakisha and Jamal? A field experiment on labor market discrimination. The American Economic Review, 94(4), 991-1013.
79
three levels of volunteering – no volunteering, altruistic volunteering (non-functional), and skill-based (functional) volunteering. The names of two different charities were used for both the altruistic and skill-based volunteering.
This design aimed to test a number of hypotheses. First, to assess whether different types of qualifications send different signals about the employability of a job candidate. In particular, we were interested in understanding whether Functional Skills qualifications might actually have a negative impact on employability compared to what we expected to be a positive impact from the GCSE qualifications. We hypothesised this because there could be a perception that Functional Skills qualifications are basic and may send a negative signal to the employer about the maths and English capabilities of an applicant. Without this signal, employers may otherwise assume all candidates have a good level of maths and English.
Second, we sought to test whether volunteering experience on a CV increases employability and the likelihood of being invited to interview. We designed the volunteering experience to be part-time, occurring during the period of unemployment present on the last three months of the career history of all CVs. This made it possible to test if gaining unpaid volunteering experience when unemployed makes one more likely to find employment in the future. Volunteering occurred on a part time basis, so that the we could rule out any effect being driven simply by an extra period of employment.
We chose two different types of volunteering (“Pure Altruism” and “Skill based”) to attempt to separate out the effects of volunteering on employment outcomes into:
1. The signal of prosociality and positive personality traits.
2. The added experience/skills gained from the volunteering experience.
It may be that all gains derive from the direct experience and the pro-social aspect has little, to no impact. Or, it may be that the pro-sociality of volunteering is the main driver of its impact on employability as candidates already have these types of skills from prior employment. It may be a combination of the two. Another hypothesis is that the added skills/experience of the “skill building” volunteering might even have a negative impact as it dampens the signal of prosociality and altruism.
These interventions were combined as part of the three different format CVs so that CVs remained the same apart from the intervention, the contact details, and the location of work. The contact details and location of work varied by arm, to ensure companies did not receive applications from identical candidates with slightly different CVs.
3.2.1.4 Method
In advance of the trial, researchers randomly distributed the CVs across each day of the trial period. Three CVs were randomly assigned to each day of the working week (e.g.
80
Monday = CV1, CV7, CV10). Each morning one of three researchers applied to jobs in a specified city (e.g. Yorkshire, Leeds, Manchester) alternating between the three CVs. For each application, researchers recorded the job ID, job title and company.
The main outcome measure was the response rate the applicant (one of the 15 CVs) received (i.e. whether a phone call or email was received in response to the CV) versus the total number of jobs they applied to. The response rate was calculated as the number of callbacks received on the individual applicant’s mobile phone plus the number of successful email responses the applicant received.
This outcome measure was used as a proxy for employability and employment prospects. While this proxy did not directly indicate that the applicant was more likely to obtain a job or not, it did indicate whether they were more likely to be invited to interview. We believe it is a fair assumption to make that more invites to interview should be connected to more successful employment outcomes.
This outcome measure was limited by the fact that we could not answer the callbacks. This means that we did not know whether the call back was to indicate success, or failure. Willingness to use callbacks as an outcome measure for employability implicitly relies on the assumption that a firm receiving large numbers of applications each day only calls back successful applicants (i.e. those proceeding to the next stage of recruitment).
It is also limited by the fact that, while we did not disclose the mobile phone numbers to anybody other than the company to which we were applying, phones might be targeted by cold callers, PPI callers etc. While all phones should receive an equal number of such cold calls, we tried to ensure they have almost identical numbers so that they are equally likely to be targeted by these firms at the same time.
Data was collected on the 15 mobile phones and the 15 email accounts for each unique CV. Responses to treatment were recorded through the number of emails about job applications received, and the number of phone calls received to telephone numbers, each of which is assigned to a single treatment.
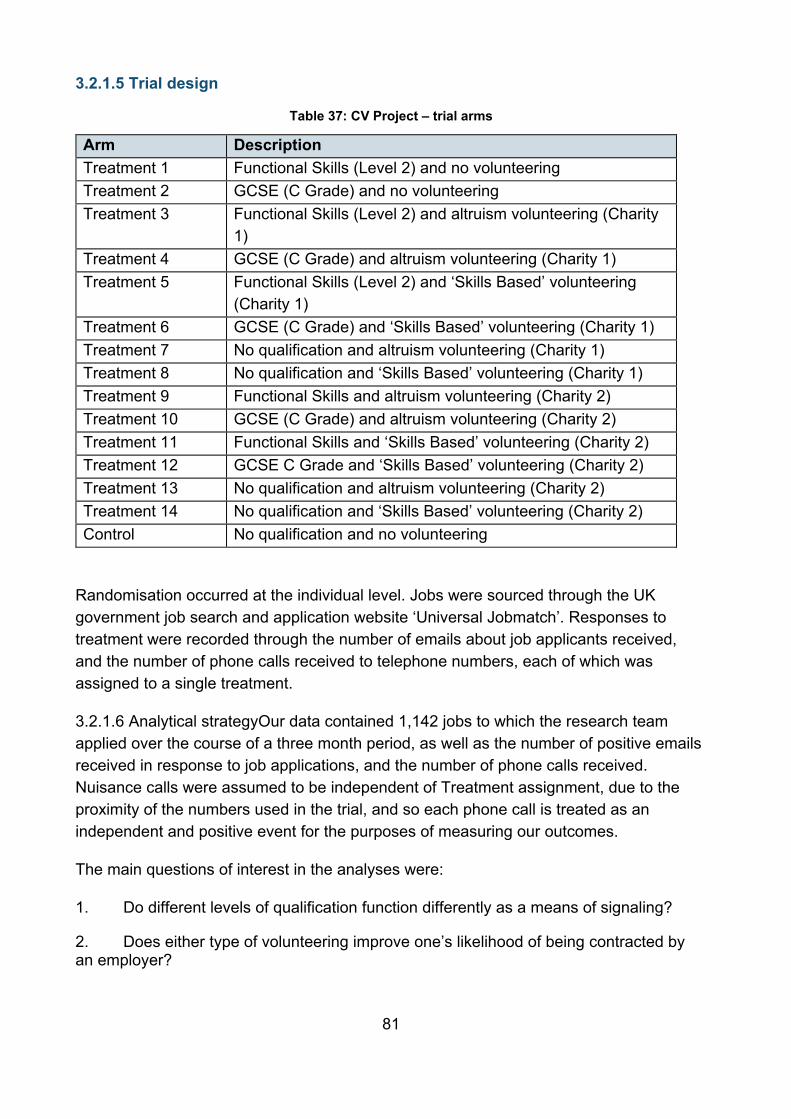
81
3.2.1.5 Trial design
Table 37: CV Project – trial arms
Arm Description Treatment 1 Functional Skills (Level 2) and no volunteering Treatment 2 GCSE (C Grade) and no volunteering Treatment 3 Functional Skills (Level 2) and altruism volunteering (Charity
1) Treatment 4 GCSE (C Grade) and altruism volunteering (Charity 1) Treatment 5 Functional Skills (Level 2) and ‘Skills Based’ volunteering
(Charity 1) Treatment 6 GCSE (C Grade) and ‘Skills Based’ volunteering (Charity 1) Treatment 7 No qualification and altruism volunteering (Charity 1) Treatment 8 No qualification and ‘Skills Based’ volunteering (Charity 1) Treatment 9 Functional Skills and altruism volunteering (Charity 2) Treatment 10 GCSE (C Grade) and altruism volunteering (Charity 2) Treatment 11 Functional Skills and ‘Skills Based’ volunteering (Charity 2) Treatment 12 GCSE C Grade and ‘Skills Based’ volunteering (Charity 2) Treatment 13 No qualification and altruism volunteering (Charity 2) Treatment 14 No qualification and ‘Skills Based’ volunteering (Charity 2) Control No qualification and no volunteering
Randomisation occurred at the individual level. Jobs were sourced through the UK government job search and application website ‘Universal Jobmatch’. Responses to treatment were recorded through the number of emails about job applicants received, and the number of phone calls received to telephone numbers, each of which was assigned to a single treatment.
3.2.1.6 Analytical strategyOur data contained 1,142 jobs to which the research team applied over the course of a three month period, as well as the number of positive emails received in response to job applications, and the number of phone calls received. Nuisance calls were assumed to be independent of Treatment assignment, due to the proximity of the numbers used in the trial, and so each phone call is treated as an independent and positive event for the purposes of measuring our outcomes.
The main questions of interest in the analyses were:
1. Do different levels of qualification function differently as a means of signaling?
2. Does either type of volunteering improve one’s likelihood of being contracted by an employer?
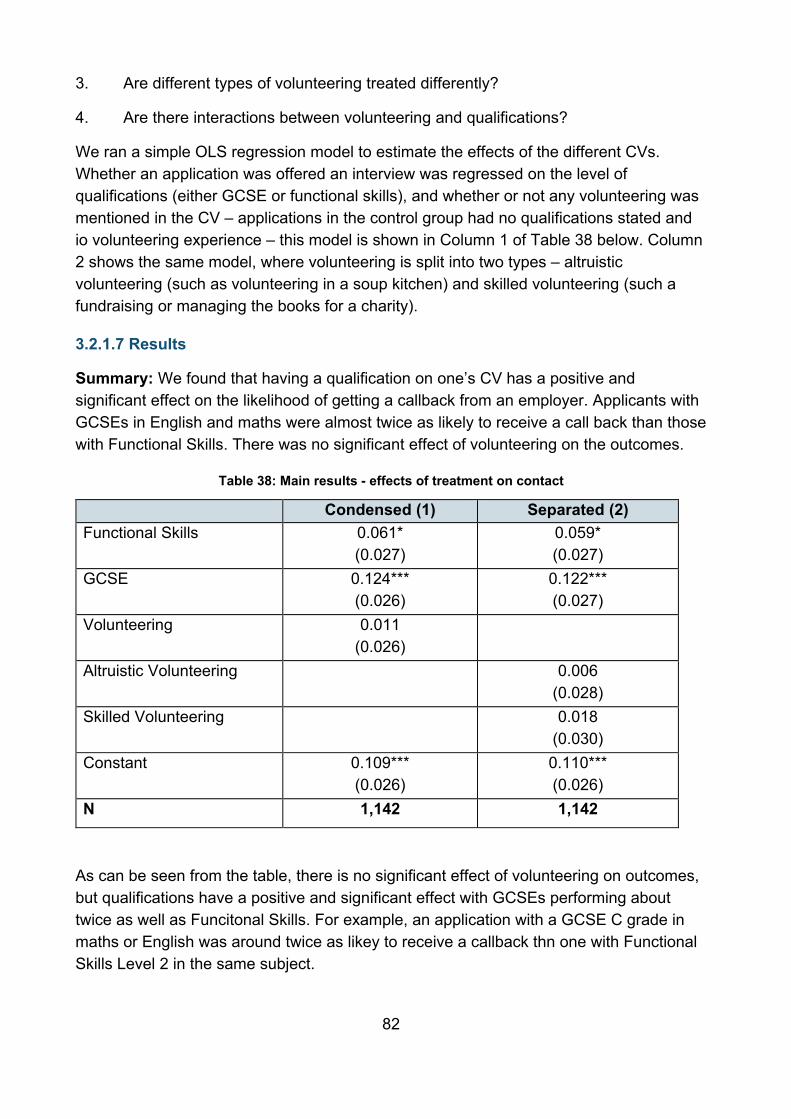
82
3. Are different types of volunteering treated differently?
4. Are there interactions between volunteering and qualifications?
We ran a simple OLS regression model to estimate the effects of the different CVs. Whether an application was offered an interview was regressed on the level of qualifications (either GCSE or functional skills), and whether or not any volunteering was mentioned in the CV – applications in the control group had no qualifications stated and io volunteering experience – this model is shown in Column 1 of Table 38 below. Column 2 shows the same model, where volunteering is split into two types – altruistic volunteering (such as volunteering in a soup kitchen) and skilled volunteering (such a fundraising or managing the books for a charity).
3.2.1.7 Results
Summary: We found that having a qualification on one’s CV has a positive and significant effect on the likelihood of getting a callback from an employer. Applicants with GCSEs in English and maths were almost twice as likely to receive a call back than those with Functional Skills. There was no significant effect of volunteering on the outcomes.
Table 38: Main results - effects of treatment on contact
Condensed (1) Separated (2) Functional Skills 0.061*
(0.027) 0.059* (0.027)
GCSE 0.124*** (0.026)
0.122*** (0.027)
Volunteering 0.011 (0.026)
Altruistic Volunteering 0.006 (0.028)
Skilled Volunteering 0.018 (0.030)
Constant 0.109*** (0.026)
0.110*** (0.026)
N 1,142 1,142
As can be seen from the table, there is no significant effect of volunteering on outcomes, but qualifications have a positive and significant effect with GCSEs performing about twice as well as Funcitonal Skills. For example, an application with a GCSE C grade in maths or English was around twice as likey to receive a callback thn one with Functional Skills Level 2 in the same subject.
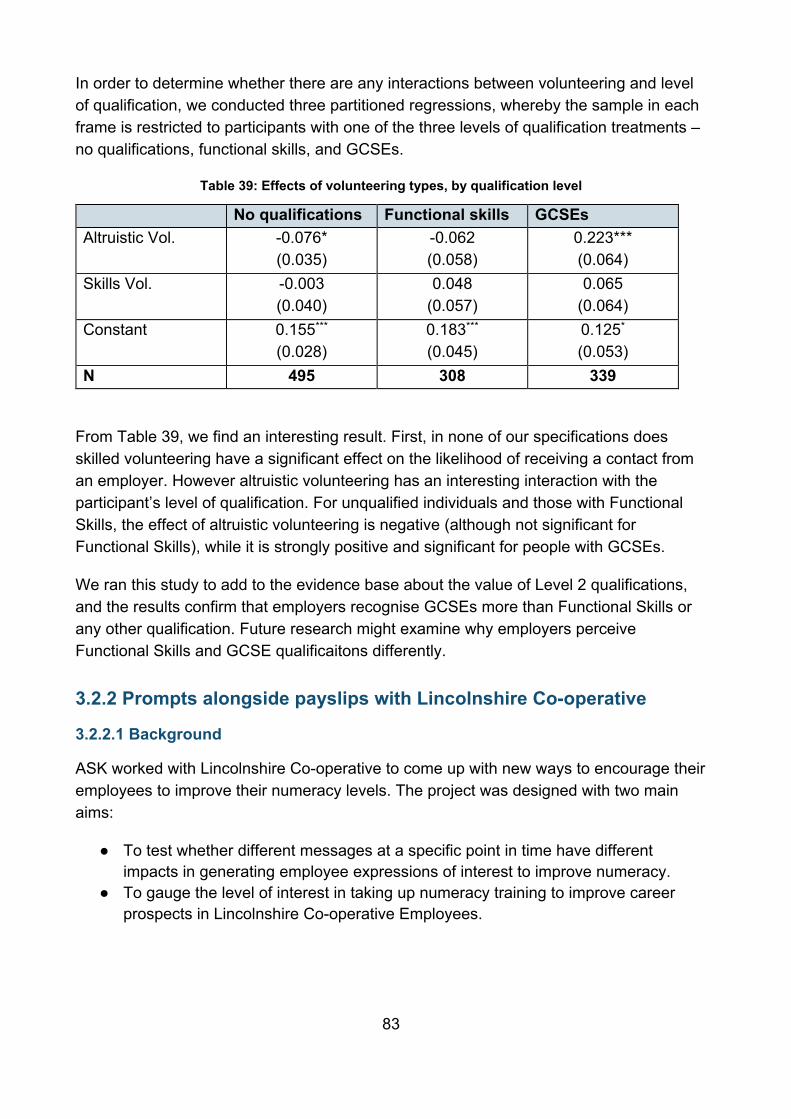
83
In order to determine whether there are any interactions between volunteering and level of qualification, we conducted three partitioned regressions, whereby the sample in each frame is restricted to participants with one of the three levels of qualification treatments – no qualifications, functional skills, and GCSEs.
Table 39: Effects of volunteering types, by qualification level
No qualifications Functional skills GCSEs Altruistic Vol. -0.076*
(0.035) -0.062 (0.058)
0.223*** (0.064)
Skills Vol. -0.003 (0.040)
0.048 (0.057)
0.065 (0.064)
Constant 0.155*** (0.028)
0.183*** (0.045)
0.125* (0.053)
N 495 308 339
From Table 39, we find an interesting result. First, in none of our specifications does skilled volunteering have a significant effect on the likelihood of receiving a contact from an employer. However altruistic volunteering has an interesting interaction with the participant’s level of qualification. For unqualified individuals and those with Functional Skills, the effect of altruistic volunteering is negative (although not significant for Functional Skills), while it is strongly positive and significant for people with GCSEs.
We ran this study to add to the evidence base about the value of Level 2 qualifications, and the results confirm that employers recognise GCSEs more than Functional Skills or any other qualification. Future research might examine why employers perceive Functional Skills and GCSE qualificaitons differently.
3.2.2 Prompts alongside payslips with Lincolnshire Co-operative
3.2.2.1 Background
ASK worked with Lincolnshire Co-operative to come up with new ways to encourage their employees to improve their numeracy levels. The project was designed with two main aims:
● To test whether different messages at a specific point in time have different impacts in generating employee expressions of interest to improve numeracy.
● To gauge the level of interest in taking up numeracy training to improve career prospects in Lincolnshire Co-operative Employees.
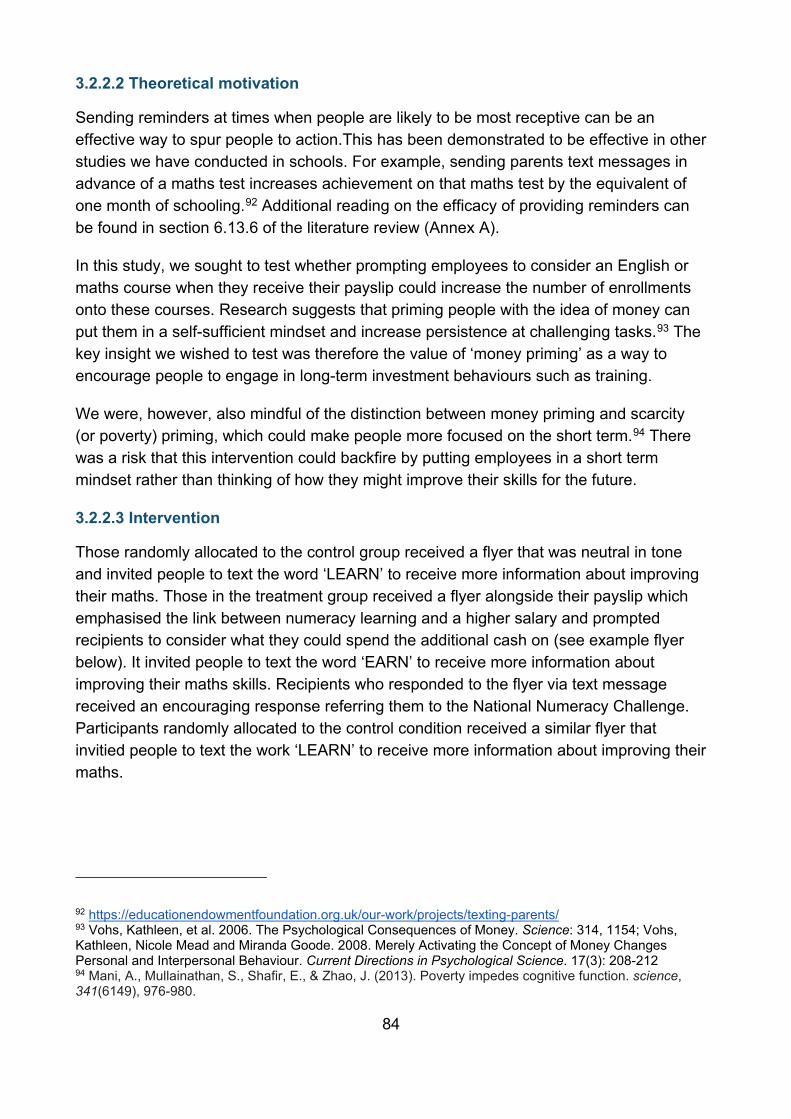
84
3.2.2.2 Theoretical motivation
Sending reminders at times when people are likely to be most receptive can be an effective way to spur people to action.This has been demonstrated to be effective in other studies we have conducted in schools. For example, sending parents text messages in advance of a maths test increases achievement on that maths test by the equivalent of one month of schooling.92 Additional reading on the efficacy of providing reminders can be found in section 6.13.6 of the literature review (Annex A).
In this study, we sought to test whether prompting employees to consider an English or maths course when they receive their payslip could increase the number of enrollments onto these courses. Research suggests that priming people with the idea of money can put them in a self-sufficient mindset and increase persistence at challenging tasks.93 The key insight we wished to test was therefore the value of ‘money priming’ as a way to encourage people to engage in long-term investment behaviours such as training.
We were, however, also mindful of the distinction between money priming and scarcity (or poverty) priming, which could make people more focused on the short term.94 There was a risk that this intervention could backfire by putting employees in a short term mindset rather than thinking of how they might improve their skills for the future.
3.2.2.3 Intervention
Those randomly allocated to the control group received a flyer that was neutral in tone and invited people to text the word ‘LEARN’ to receive more information about improving their maths. Those in the treatment group received a flyer alongside their payslip which emphasised the link between numeracy learning and a higher salary and prompted recipients to consider what they could spend the additional cash on (see example flyer below). It invited people to text the word ‘EARN’ to receive more information about improving their maths skills. Recipients who responded to the flyer via text message received an encouraging response referring them to the National Numeracy Challenge. Participants randomly allocated to the control condition received a similar flyer that invitied people to text the work ‘LEARN’ to receive more information about improving their maths.
92 https://educationendowmentfoundation.org.uk/our-work/projects/texting-parents/ 93 Vohs, Kathleen, et al. 2006. The Psychological Consequences of Money. Science: 314, 1154; Vohs, Kathleen, Nicole Mead and Miranda Goode. 2008. Merely Activating the Concept of Money Changes Personal and Interpersonal Behaviour. Current Directions in Psychological Science. 17(3): 208-212 94 Mani, A., Mullainathan, S., Shafir, E., & Zhao, J. (2013). Poverty impedes cognitive function. science, 341(6149), 976-980.
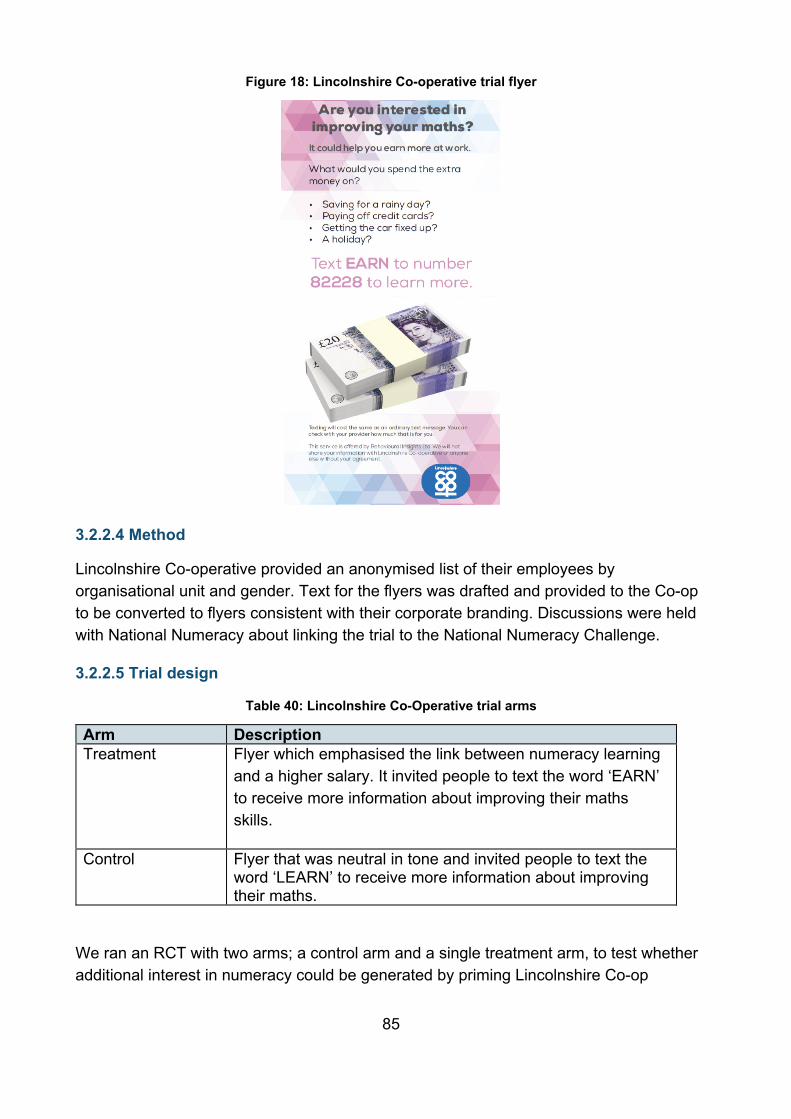
85
Figure 18: Lincolnshire Co-operative trial flyer
3.2.2.4 Method
Lincolnshire Co-operative provided an anonymised list of their employees by organisational unit and gender. Text for the flyers was drafted and provided to the Co-op to be converted to flyers consistent with their corporate branding. Discussions were held with National Numeracy about linking the trial to the National Numeracy Challenge.
3.2.2.5 Trial design
Table 40: Lincolnshire Co-Operative trial arms
Arm Description Treatment Flyer which emphasised the link between numeracy learning
and a higher salary. It invited people to text the word ‘EARN’ to receive more information about improving their maths skills.
Control Flyer that was neutral in tone and invited people to text the word ‘LEARN’ to receive more information about improving their maths.
We ran an RCT with two arms; a control arm and a single treatment arm, to test whether additional interest in numeracy could be generated by priming Lincolnshire Co-op
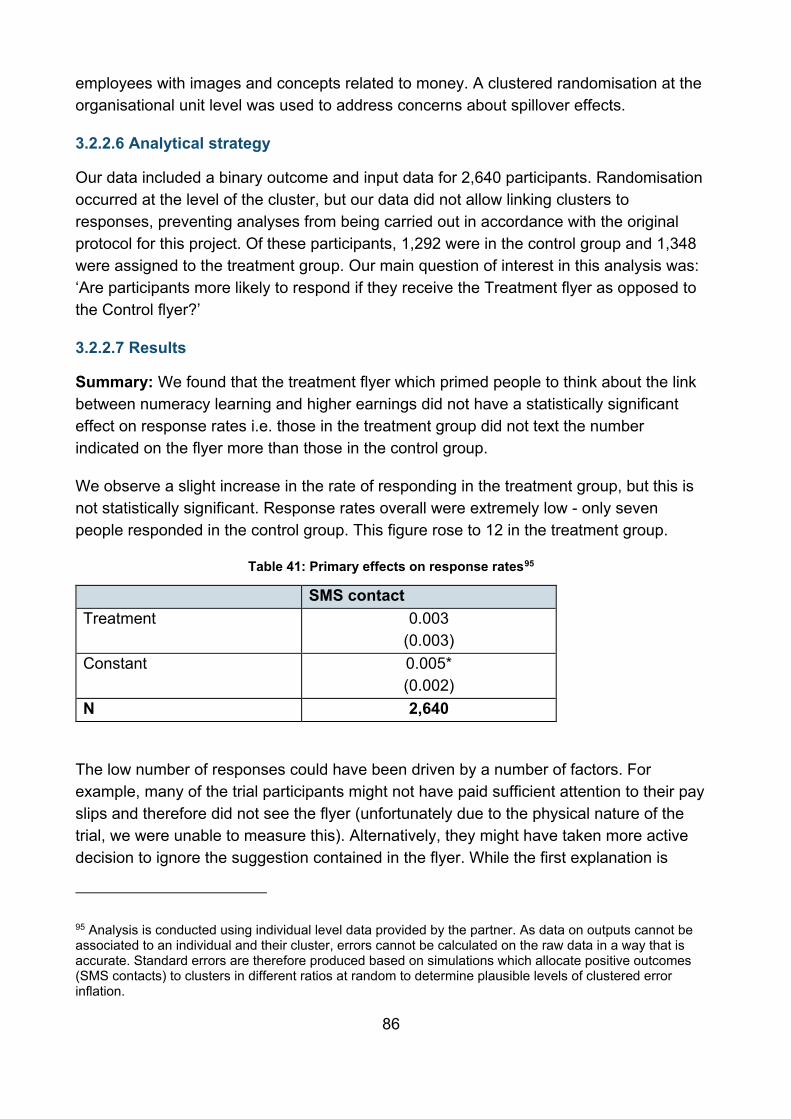
86
employees with images and concepts related to money. A clustered randomisation at the organisational unit level was used to address concerns about spillover effects.
3.2.2.6 Analytical strategy
Our data included a binary outcome and input data for 2,640 participants. Randomisation occurred at the level of the cluster, but our data did not allow linking clusters to responses, preventing analyses from being carried out in accordance with the original protocol for this project. Of these participants, 1,292 were in the control group and 1,348 were assigned to the treatment group. Our main question of interest in this analysis was: ‘Are participants more likely to respond if they receive the Treatment flyer as opposed to the Control flyer?’
3.2.2.7 Results
Summary: We found that the treatment flyer which primed people to think about the link between numeracy learning and higher earnings did not have a statistically significant effect on response rates i.e. those in the treatment group did not text the number indicated on the flyer more than those in the control group.
We observe a slight increase in the rate of responding in the treatment group, but this is not statistically significant. Response rates overall were extremely low - only seven people responded in the control group. This figure rose to 12 in the treatment group.
Table 41: Primary effects on response rates95
SMS contact Treatment 0.003
(0.003) Constant 0.005*
(0.002) N 2,640
The low number of responses could have been driven by a number of factors. For example, many of the trial participants might not have paid sufficient attention to their pay slips and therefore did not see the flyer (unfortunately due to the physical nature of the trial, we were unable to measure this). Alternatively, they might have taken more active decision to ignore the suggestion contained in the flyer. While the first explanation is
95 Analysis is conducted using individual level data provided by the partner. As data on outputs cannot be associated to an individual and their cluster, errors cannot be calculated on the raw data in a way that is accurate. Standard errors are therefore produced based on simulations which allocate positive outcomes (SMS contacts) to clusters in different ratios at random to determine plausible levels of clustered error inflation.
87
possible, given the shifting hours of much of the workforce there is a strong incentive to give close attention to pay slips (most were low skilled shift-workers so there would be variation between payslips). The second explanation of workers ignoring the flyer is consistent with the academic literature, which suggests that those already in employment -even in low skilled employment - are reluctant to engage in further skills development, even where this potentially offers financial gains. If this is the case, the low response rate could suggest that while a prompt such as the flyer may draw moment of attention, a more substantial intervention may be required to galvanise further consideration and action.
More research is required to understand whether simple ‘nudge’ type intervetnions like this can encourage those already in the workforce to think about their continuing skills development, even in fundamental areas such as numeracy.
3.2.3 Nudging managers in Cambridge University Hospitals Trust
3.2.3.1 Background
BIT worked with National Numeracy and Cambridge University Hospitals Foundation NHS Trust to build evidence on how employers can encourage their staff to take up numeracy training.
The project was targeted towards staff in Bands 1-4 which comprise Healthcare Assistants (HCAs), support staff, and other staff who are unregistered carers. These staff are responsible for around 60 percent of the patient contact, and assist nurses with a range of monitoring and care tasks.
Poor numeracy can impact on Band 1-4 healthcare workers’ abilities to carry out safe patient care, and also progress in their careers. For example, the Healthcare Commission Investigation into Mid Staffordshire Foundation NHS Trust pointed to poor observations, poor record-keeping of fluid intake and output, and incorrect medication administration as issues in that hospital.
Hospitals are increasingly requiring staff to demonstrate they have a certain Functional Skills Level in Numeracy (ranging from Entry Level 3 to Level 2) at the point of recruitment. Current staff are not usually subject to these requirements, but many hospitals offer training courses on-site, or signpost HCAs (through the Learning and Development function or the union) to courses elsewhere. Initial scoping work for this project demonstrated that HCAs face significant barriers to learning, such as time for study leave, financial cuts to healthcare services, and the difficulty of talking openly about skills and abilities when they are so integral to high quality patient care.
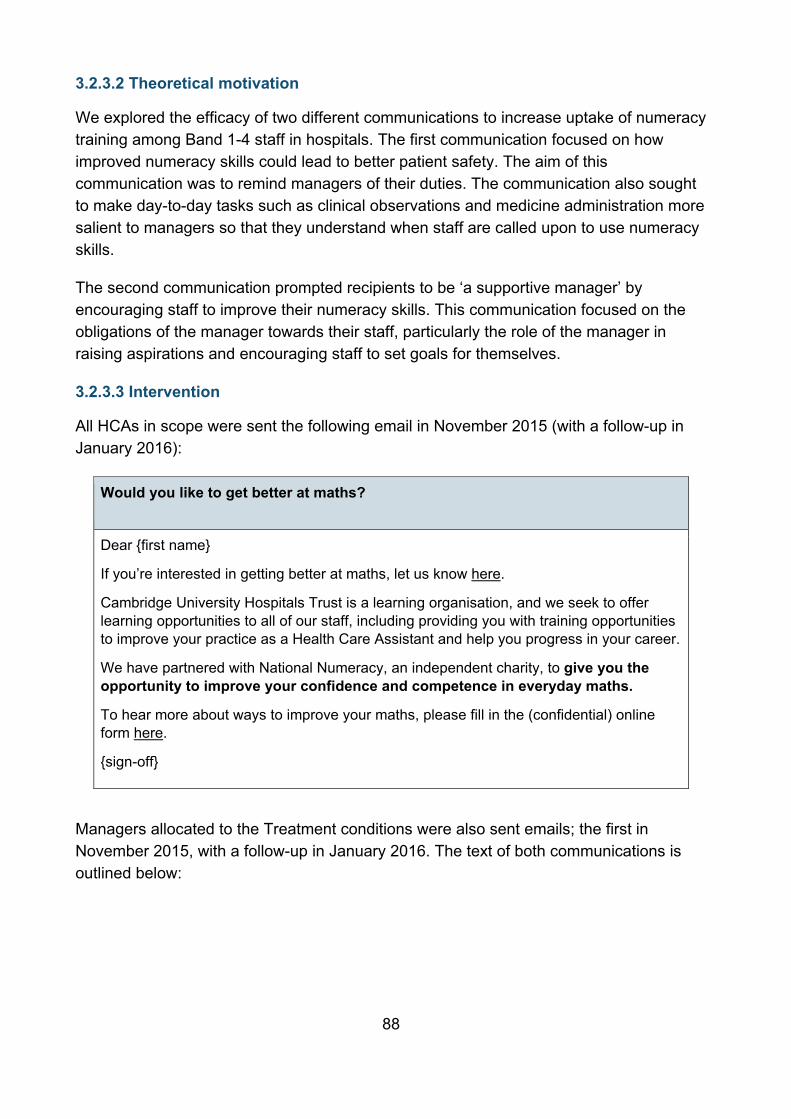
88
3.2.3.2 Theoretical motivation
We explored the efficacy of two different communications to increase uptake of numeracy training among Band 1-4 staff in hospitals. The first communication focused on how improved numeracy skills could lead to better patient safety. The aim of this communication was to remind managers of their duties. The communication also sought to make day-to-day tasks such as clinical observations and medicine administration more salient to managers so that they understand when staff are called upon to use numeracy skills.
The second communication prompted recipients to be ‘a supportive manager’ by encouraging staff to improve their numeracy skills. This communication focused on the obligations of the manager towards their staff, particularly the role of the manager in raising aspirations and encouraging staff to set goals for themselves.
3.2.3.3 Intervention
All HCAs in scope were sent the following email in November 2015 (with a follow-up in January 2016):
Would you like to get better at maths?
Dear {first name}
If you’re interested in getting better at maths, let us know here.
Cambridge University Hospitals Trust is a learning organisation, and we seek to offer learning opportunities to all of our staff, including providing you with training opportunities to improve your practice as a Health Care Assistant and help you progress in your career.
We have partnered with National Numeracy, an independent charity, to give you the opportunity to improve your confidence and competence in everyday maths.
To hear more about ways to improve your maths, please fill in the (confidential) online form here.
{sign-off}
Managers allocated to the Treatment conditions were also sent emails; the first in November 2015, with a follow-up in January 2016. The text of both communications is outlined below:
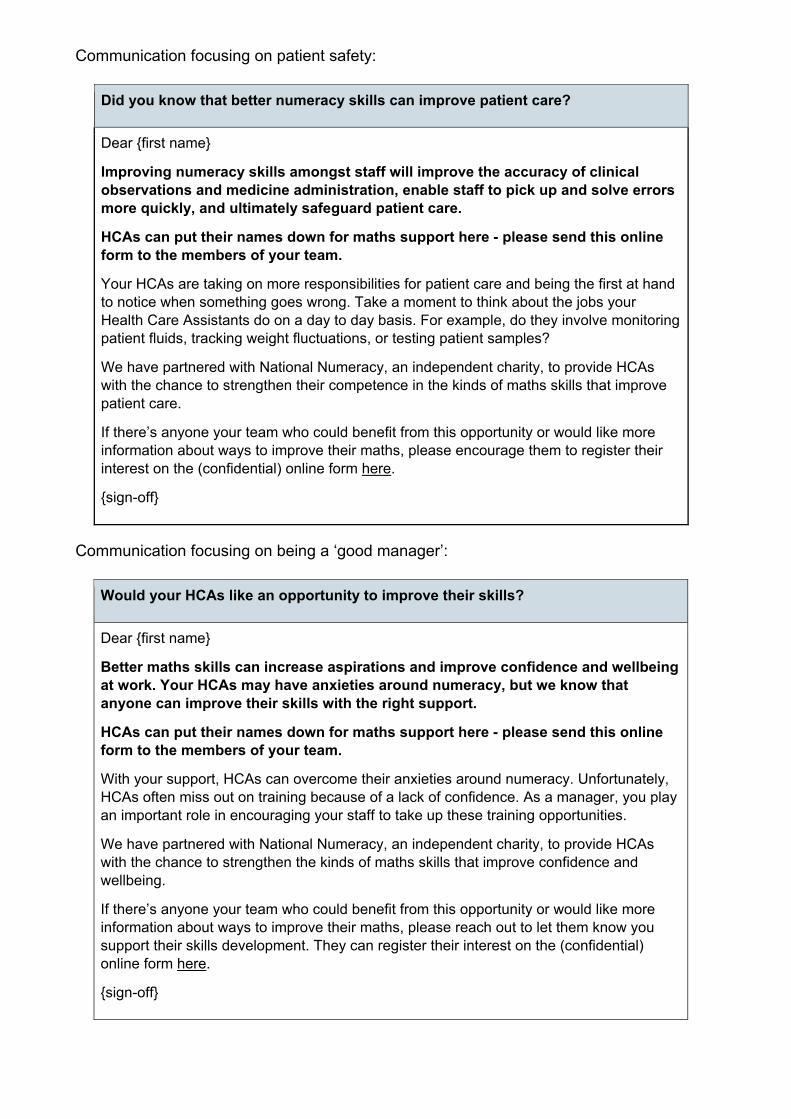
Communication focusing on patient safety:
Did you know that better numeracy skills can improve patient care?
Dear {first name}
Improving numeracy skills amongst staff will improve the accuracy of clinical observations and medicine administration, enable staff to pick up and solve errors more quickly, and ultimately safeguard patient care.
HCAs can put their names down for maths support here - please send this online form to the members of your team.
Your HCAs are taking on more responsibilities for patient care and being the first at hand to notice when something goes wrong. Take a moment to think about the jobs your Health Care Assistants do on a day to day basis. For example, do they involve monitoring patient fluids, tracking weight fluctuations, or testing patient samples?
We have partnered with National Numeracy, an independent charity, to provide HCAs with the chance to strengthen their competence in the kinds of maths skills that improve patient care.
If there’s anyone your team who could benefit from this opportunity or would like more information about ways to improve their maths, please encourage them to register their interest on the (confidential) online form here.
{sign-off}
Communication focusing on being a ‘good manager’:
Would your HCAs like an opportunity to improve their skills?
Dear {first name}
Better maths skills can increase aspirations and improve confidence and wellbeing at work. Your HCAs may have anxieties around numeracy, but we know that anyone can improve their skills with the right support.
HCAs can put their names down for maths support here - please send this online form to the members of your team.
With your support, HCAs can overcome their anxieties around numeracy. Unfortunately, HCAs often miss out on training because of a lack of confidence. As a manager, you play an important role in encouraging your staff to take up these training opportunities.
We have partnered with National Numeracy, an independent charity, to provide HCAs with the chance to strengthen the kinds of maths skills that improve confidence and wellbeing.
If there’s anyone your team who could benefit from this opportunity or would like more information about ways to improve their maths, please reach out to let them know you support their skills development. They can register their interest on the (confidential) online form here.
{sign-off}
3.2.3.4 Method
All HCAs received a standard email. In Control, managers were not contacted; in the Treatment conditions managers were contacted in addition to the HCAs themselves receiving the email.
3.2.3.5 Trial design
Table 42: Cambridge University Hospitals Foundation NHS Trust trial arms
Arm Description Treatment 1: ‘patient safety’
Email sent to managers highlighting how improved numeracy skills could lead to better patient safety.
Treatment 2: ‘supportive manager’
Email sent to managers prompting them to be ‘a supportive manager’ by encouraging staff to improve their numeracy skills.
Control No email was sent to managers.
Randomisation occurred at the department/ward level so that all HCAs in a particular ward would receive the encouragement by their Ward Manager/Team Leader. The intention was that this would minimise spillovers between individuals in each condition. Some managers supervised staff across multiple wards, which was why we chose the manager as the unit of randomisation.
3.2.3.6 Analytical strategy
Data were contained in two datasets - one which linked individual participants to their Treatment assignment via their employee ID, supervisor ID and organisational unit. The other included outcome data on each individual who signed up to numeracy courses during the trial period. We did not capture individual identifiers for these participants, only their organisational units. We can therefore identify, for each organisational unit, the number of participants in scope and the number that signed up, but cannot identify any of the characteristics of the participants in question.
In order to produce the dataset for analysis, we created a synthetic organisational unit/order within organisational unit indicator within each dataset, and merged the data according to these identifiers.
This produced a set of 12 participants who identified as having responded to the intervention but who were not contained in our data. Of these, six identified their organisational unit as either their division, or as “Other”. In both cases, it was not possible to map them back to specific units and hence to treatment groups. In the remaining six cases, one was a member of an organisational unit that did not exist in the original data, and the other five were in organisational units that were in our sample, but where they were at least the N+1th participant in that unit to appear in our outcome data, where N is
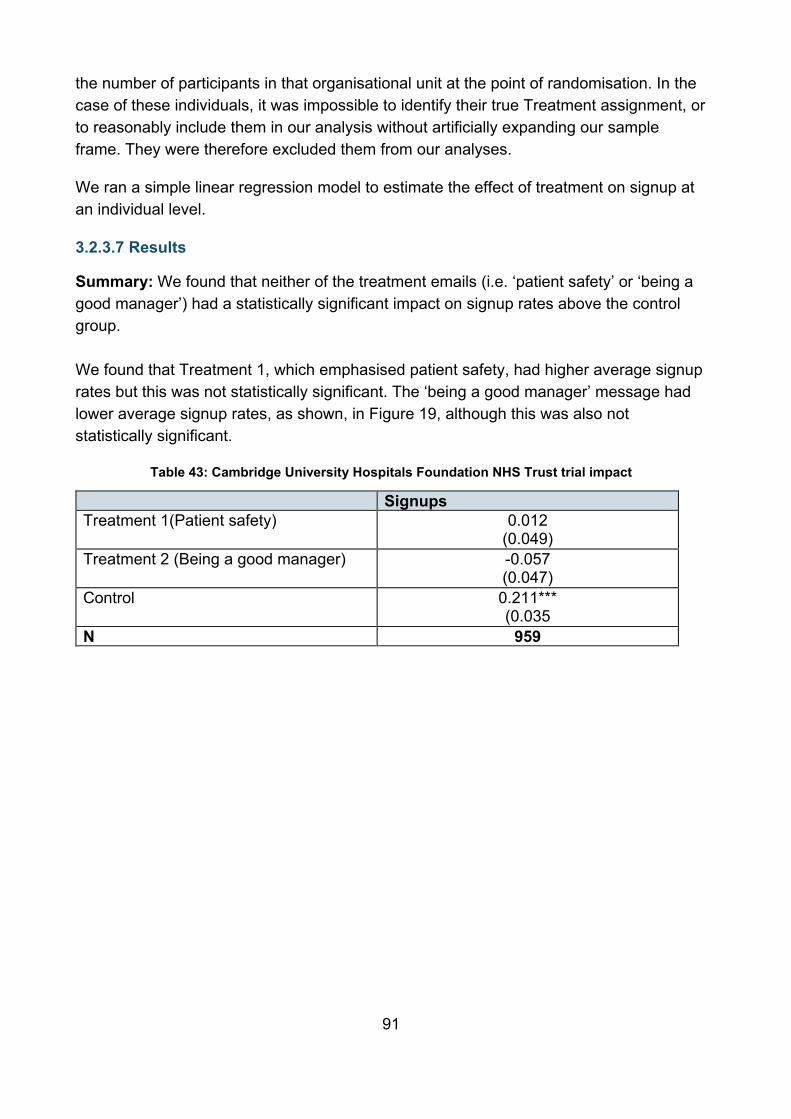
91
the number of participants in that organisational unit at the point of randomisation. In the case of these individuals, it was impossible to identify their true Treatment assignment, or to reasonably include them in our analysis without artificially expanding our sample frame. They were therefore excluded them from our analyses.
We ran a simple linear regression model to estimate the effect of treatment on signup at an individual level.
3.2.3.7 Results
Summary: We found that neither of the treatment emails (i.e. ‘patient safety’ or ‘being a good manager’) had a statistically significant impact on signup rates above the control group. We found that Treatment 1, which emphasised patient safety, had higher average signup rates but this was not statistically significant. The ‘being a good manager’ message had lower average signup rates, as shown, in Figure 19, although this was also not statistically significant.
Table 43: Cambridge University Hospitals Foundation NHS Trust trial impact
Signups Treatment 1(Patient safety) 0.012
(0.049) Treatment 2 (Being a good manager) -0.057
(0.047) Control 0.211***
(0.035 N 959
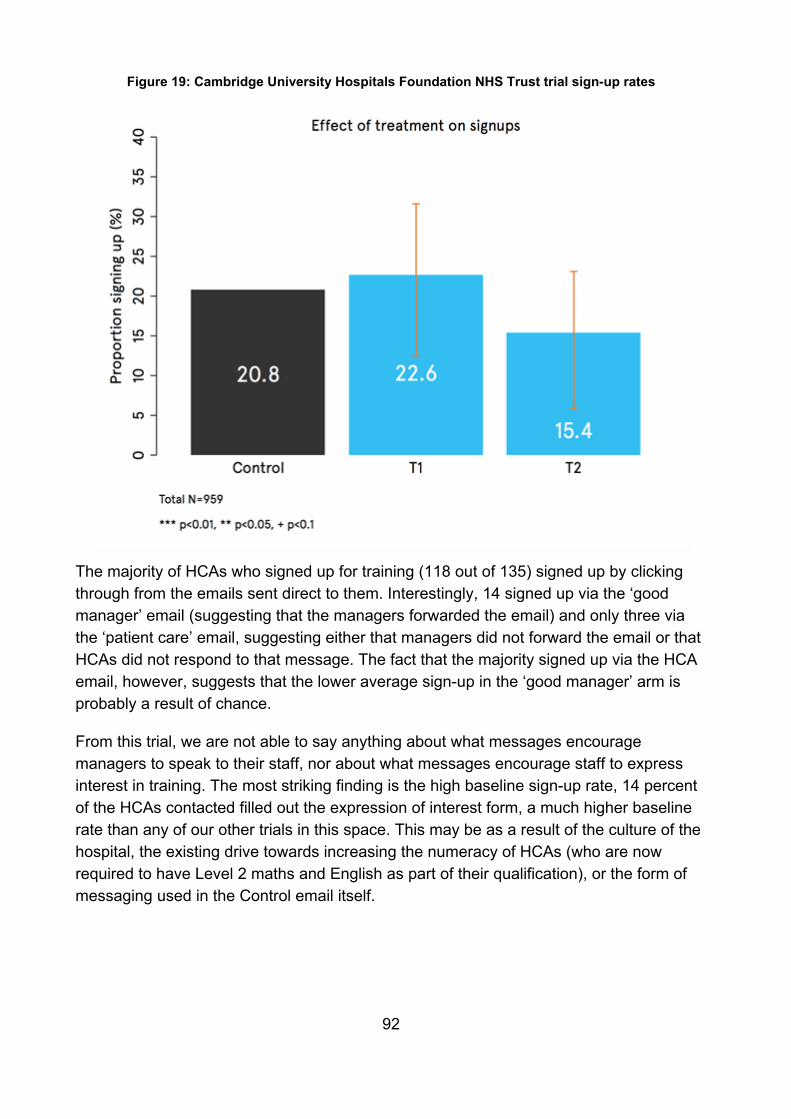
92
Figure 19: Cambridge University Hospitals Foundation NHS Trust trial sign-up rates
The majority of HCAs who signed up for training (118 out of 135) signed up by clicking through from the emails sent direct to them. Interestingly, 14 signed up via the ‘good manager’ email (suggesting that the managers forwarded the email) and only three via the ‘patient care’ email, suggesting either that managers did not forward the email or that HCAs did not respond to that message. The fact that the majority signed up via the HCA email, however, suggests that the lower average sign-up in the ‘good manager’ arm is probably a result of chance.
From this trial, we are not able to say anything about what messages encourage managers to speak to their staff, nor about what messages encourage staff to express interest in training. The most striking finding is the high baseline sign-up rate, 14 percent of the HCAs contacted filled out the expression of interest form, a much higher baseline rate than any of our other trials in this space. This may be as a result of the culture of the hospital, the existing drive towards increasing the numeracy of HCAs (who are now required to have Level 2 maths and English as part of their qualification), or the form of messaging used in the Control email itself.
93
3.2.3 Peer referrals to training in Transport for London
3.2.3.1 Background
Many people who have low basic literacy and numeracy skills are employed, often in shift-based, low-skilled jobs.96 There are several reasons why these individuals are unlikely to attend learning at formal institutions; they may not have the time, they may have irregular work patterns, or they could be deterred by negative previous experiences in learning at formal institutions. Workplace courses reach learners who would not normally be involved in continuous education, particularly older, male participants who tend to be less present in college classes. For this group, workplaces offer an opportunity, not only to reach those not engaged in learning, but to offer them provision that works for them.
At the time of this project, Transport for London (TfL) were keen to encourage their staff to develop their skills. The ‘Learning Zone’ is a service provided by TfL for their staff to develop their skills. Staff can avail of classes in English, maths, English as a second language and beginners’ IT, and can gain qualifications in these areas at a range of levels, from entry level up to level 2 and GCSEs. Staff with dyslexia and other learning difficulties can also avail of support in the zone. Learners can receive support either on a one-to-one basis or in group classroom sessions
3.2.3.2 Theoretical motivation
Early discussions between BIT and TfL identified three major challenges: sign-up rates, retention and achievement. As per the insights from our scoping phase, we were interested in the potential of peer referrals as a way of highlighting the benefits of the training in a non-threatening way. We tested whether a communication involving a ‘Network Nudge’ would improve these outcomes. Network nudges harness social networks - once one person in the network has been nudged, they are then encouraged to prompt others in their network to engage in a particular behaviour, causing a multiplier effect.97 Additional reading on peer support in adult education can be found in section 6.7 of the literature review (Annex A).
3.2.3.3 Intervention
There were three ‘Network Nudge’ emails tested as part of the trial, alongside a control group which received no email. These were sent out to TfL employees who previously completed a course at the Learning Zone. While each of the emails encouraged the recipient to refer a peer, they had three different framings, with one with just request to
96 Kuczera, M., Field, S., & Windisch, H. C. (2016). Building skills for all: a review of England. 97 Sanders, M. and Norton, M., (forthcoming) Network nudges: Field experiments in indirect social influences
94
refer the learning zone onto a colleague (the ‘Reach’ arm), one with the request, but also offering a chance to be entered into a prize draw if they successfully refer a colleague (the ‘Prize’ arm), and finally one that requested the recipient to refer a colleague, but also included a thank you in advance from the head of a Learning Zone (the ‘Thanks’ arm).
3.2.3.4 Method
The sample of the trial consisted of staff who sat within a group where at least one staff member had completed a qualification at the Learning Zone between 2 November 2013 and 30 September 2015 (95 in total). In order to do the randomisation, each of these staff members was assigned to a particular operational grouping (movement between groupings did not occur regularly). Where there were multiple former learners in a given Group, they received the same intervention email. Station staff could have worked across stations, but they remained within Station Groups. Drivers could only drive a particular line and were based at a particular depot on that line. There was little interaction between station staff and drivers. Staff based in non-station or non-driving roles were clustered normally by their ‘organisation unit’ - a specific field on TfL’s HR Database. In some cases, organisation units had been combined into clusters where we had been informed by TfL Learning Zone staff that such colleagues worked in close proximity, or were likely to regularly come into contact with one another.
For the purpose of the trial, ‘Groups’ (clusters) comprised of one of the following:
● Station Groups (29 of which have at least one former learner out of 37)
● Depots (11 of which have at least one former learner out of 28)
● Central functions (9 of which have at least one former learner out of 16). Some of these functions had been grouped together where we had been informed by TfL Learning Zone staff that staff worked in close proximity, or were likely to regularly come into contact with one another.
This gave us 49 Groups with at least one former learner located in each. All staff within these Groups were part of the trial, while those Groups without a past learner in them were out of scope (since presence in this category could have been non-random and therefore, they could not be included in Control).This provided a total sample size of 8,041. The sample was then randomised according to these groups into one of the three treatment arms or the no email Control.
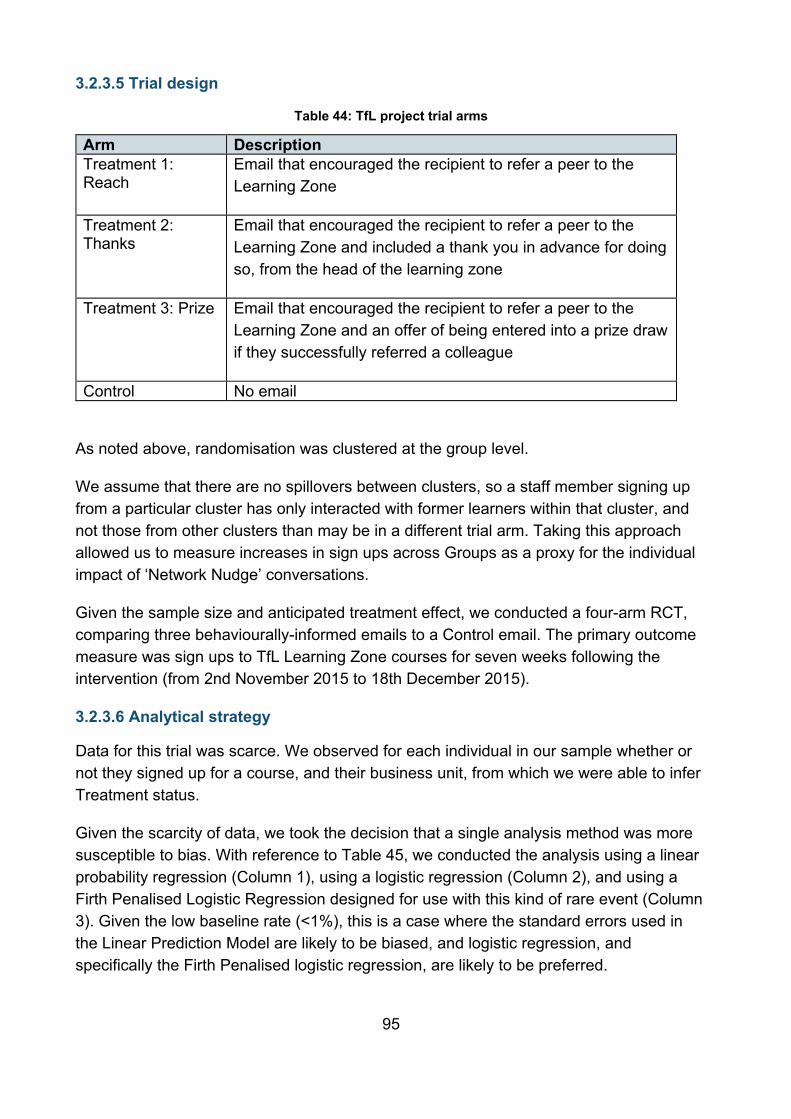
95
3.2.3.5 Trial design
Table 44: TfL project trial arms
Arm Description Treatment 1: Reach
Email that encouraged the recipient to refer a peer to the Learning Zone
Treatment 2: Thanks
Email that encouraged the recipient to refer a peer to the Learning Zone and included a thank you in advance for doing so, from the head of the learning zone
Treatment 3: Prize Email that encouraged the recipient to refer a peer to the Learning Zone and an offer of being entered into a prize draw if they successfully referred a colleague
Control No email
As noted above, randomisation was clustered at the group level.
We assume that there are no spillovers between clusters, so a staff member signing up from a particular cluster has only interacted with former learners within that cluster, and not those from other clusters than may be in a different trial arm. Taking this approach allowed us to measure increases in sign ups across Groups as a proxy for the individual impact of ‘Network Nudge’ conversations.
Given the sample size and anticipated treatment effect, we conducted a four-arm RCT, comparing three behaviourally-informed emails to a Control email. The primary outcome measure was sign ups to TfL Learning Zone courses for seven weeks following the intervention (from 2nd November 2015 to 18th December 2015).
3.2.3.6 Analytical strategy
Data for this trial was scarce. We observed for each individual in our sample whether or not they signed up for a course, and their business unit, from which we were able to infer Treatment status.
Given the scarcity of data, we took the decision that a single analysis method was more susceptible to bias. With reference to Table 45, we conducted the analysis using a linear probability regression (Column 1), using a logistic regression (Column 2), and using a Firth Penalised Logistic Regression designed for use with this kind of rare event (Column 3). Given the low baseline rate (<1%), this is a case where the standard errors used in the Linear Prediction Model are likely to be biased, and logistic regression, and specifically the Firth Penalised logistic regression, are likely to be preferred.
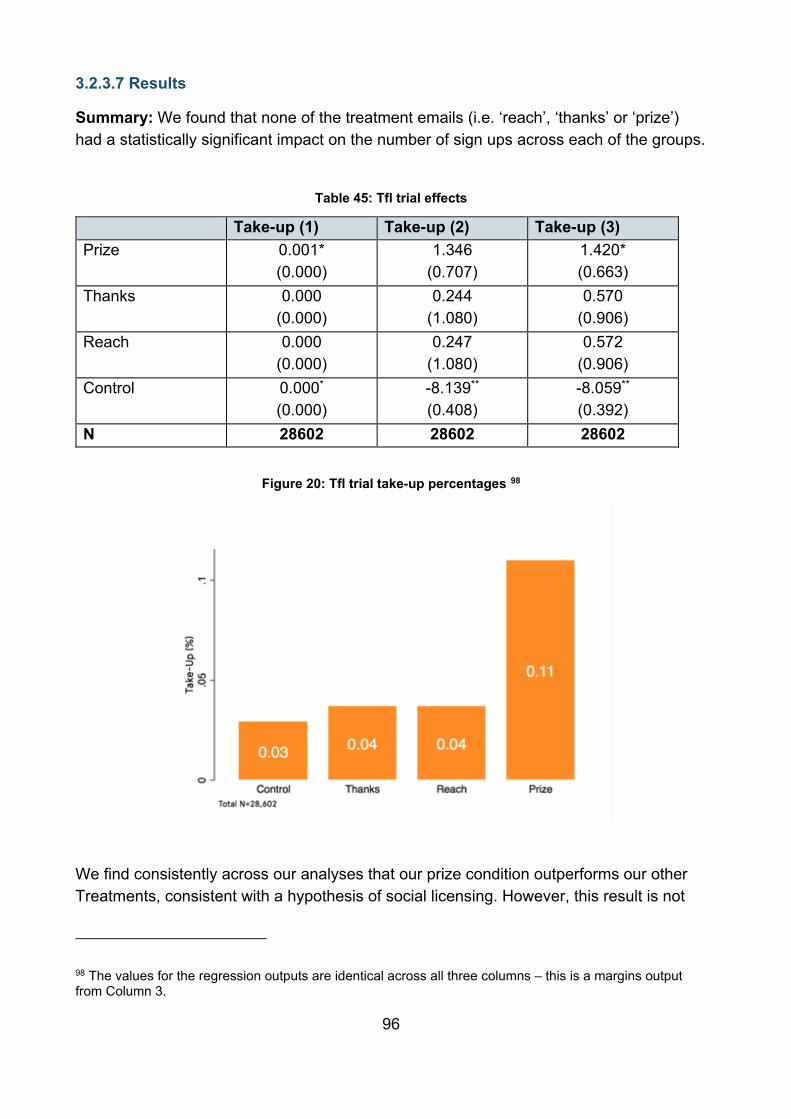
96
3.2.3.7 Results
Summary: We found that none of the treatment emails (i.e. ‘reach’, ‘thanks’ or ‘prize’) had a statistically significant impact on the number of sign ups across each of the groups.
Table 45: Tfl trial effects
Take-up (1) Take-up (2) Take-up (3) Prize 0.001*
(0.000) 1.346
(0.707) 1.420* (0.663)
Thanks 0.000 (0.000)
0.244 (1.080)
0.570 (0.906)
Reach 0.000 (0.000)
0.247 (1.080)
0.572 (0.906)
Control 0.000* (0.000)
-8.139** (0.408)
-8.059** (0.392)
N 28602 28602 28602
Figure 20: Tfl trial take-up percentages 98
We find consistently across our analyses that our prize condition outperforms our other Treatments, consistent with a hypothesis of social licensing. However, this result is not
98 The values for the regression outputs are identical across all three columns – this is a margins output from Column 3.
97
statistically significant, largely due to the low sign up rates across the trial arms. This result is in-keeping with that of the Lincolnshire Co-operative trial, where the overall interest in skills development of those already employed is critically low, and suggest more substantial interventions, beyond a ‘nudge’ may be required to shift behaviour in the workplace context.
3.2.4 Purpose for Learning
3.2.4.1 Background
We wanted to learn more about learners who complete maths and English courses not because they’re motivated to do so but because such qualifications are a requirement for promotion. Those involved in Army education observed that it can be a struggle to engage learners with the value of the courses, given that they are imposed as part of the promotion process.
The recruitment process into the Army partially selects recruits on their potential trainability across disciplines. Training is usually delivered through relatively short, intensive programmes (e.g. Functional Skills maths and English courses are each delivered as one- or two-week block programmes). Achievement on Level 2 maths and English courses in the Army is substantially above that in other adult populations. However, we believe that research with the Army is relevant for other contexts. Like many students in FE or adults in the wider population, soldiers who have not achieved their maths and English in secondary school may have had negative experiences in education. For further reading on the impact of previous educational experience for future study, refer to section 4.3.4 of the literature review (Annex A). For instance, one soldier in our pilot study told us:
“I joined the army because I couldn't do this stuff at school.”
In general, there was a lack of acknowledgement from the soldiers we spoke to that improving their maths and English skills could help them in their jobs and lives, even when this was directly illustrated to them via examples.
3.2.4.2 Theoretical motivation
To investigate soldiers’ motives for engaging in learning, we surveyed 84 service personnel at the Number 30 Army Education Centre (30 AEC) in Woolwich between January and March 2015. Survey results indicated that the vast majority of the respondents took a basic skills course for reasons related to extrinsic motivators: to qualify for promotion (65 percent), to transfer to an employment group demanding higher maths and English qualifications (5 percent), or to improve their job-finding opportunities on resettlement into civilian life (10 percent).
98
After discussing these issues with the Officer Commanding (OC) and the Basic Skills Development Manager at 30 AEC, we designed an intervention to improve soldiers’ perceptions of the importance of developing sound maths and English skills. The ‘Purpose for Learning’ intervention involved a short social-psychological exercise to improve soldiers’ intrinsic motivation to learn more deeply, their engagement with the course, and their exam performance.
3.2.4.3 Intervention
The intervention was adapted from educational psychology research conducted in the US with younger learners.99 It draws on a range of insights about the importance of intrinsic motivation and how it can be generated via two behavioural mechanisms, namely ‘social norming’, and ‘self-persuasion’.
Social norms are rules that are understood by members of a group which guide our behaviour. For example, researchers have found that people are more likely to litter if they see another person littering.100 Research has shown that describing what most people do in a particular scenario can encourage others to do the same. For example, one experiment found that hotel guests who were told that most people reuse their towels were 26 percent more likely to do so than those who were exposed to a message about environmental benefits.101
In addition to social norms, our intervention drew on the concept of self-persuasion - asking people to generate their own arguments in support of an issue is more effective than attempting to change their minds.102 For example, learners who were asked to write an essay about accepted scientific theory were more likely to change their incorrect scientific beliefs than those who were asked to take notes or to repeat facts they heard at a lecture.103 In another experiment, watching an inspirational leadership video and writing a short essay in support of a healthcare development project led to improved job performance among nurses.104
99 Yeager, D. S., Henderson, M. D., Paunesku, D., Walton, G. M., D’Mello, S., Spitzer, B. J., & Duckworth, A. L. (2014). Boring but important: A self-transcendent purpose for learning fosters academic self-regulation. Journal of Personality and Social Psychology, 107(4), 559. 100 Cialdini, R. B., Reno, R. R., & Kallgren, C. A. (1990). A focus theory of normative conduct: Recycling the concept of norms to reduce littering in public places. Journal of personality and social psychology, 58(6), 1015. 101 Goldstein, N. J., Cialdini, R. B., & Griskevicius, V. (2008). A room with a viewpoint: Using social norms to motivate environmental conservation in hotels. Journal of consumer Research, 35(3), 472-482. 102 Aronson, E. (1999). The power of self-persuasion. American Psychologist, 54(11), 875. 103 Miller, R. L., & Wozniak, W. (2001). Counter-attitudinal advocacy: Effort vs. self-generation of arguments. Current Research in Social Psychology, 6(4), 46-55. 104 Bellé, N. (2013). Leading to make a difference: A field experiment on the performance effects of transformational leadership, perceived social impact, and public service motivation. Journal of Public Administration Research and Theory, 24(1), 109-136.
99
3.2.4.4 Method
When the learners arrived in their course (typically one to two weeks in length), they were asked to sit down at a computer, and log on to a website using a unique ID. They were then randomly allocated to either the Purpose for Learning exercise, or a Control exercise. The control group did a similarly structured exercise that asked them to think about their transition to the Army – an issue that was personal and salient, but that we expected would not affect their motivation for learning. Learners completed the exercise once, and completed a post-course survey after completing the final exam.
3.2.4.5 Trial design
Table 46: Purpose for Learning trial arms
Arm Description Treatment Purpose for learning exercise Control Exercise similar in length to the Purpose for learning
exercise, but with a focus on the transition to the army
The trial was conducted as a computerised RCT with individual-level randomisation. Our participants were those soldiers who undertook maths and/or English Level 2 programmes at 19 AECs across the UK between May 2016 and March 2017. Over the course of the trial, the pre-course survey was completed more than 680 times; however, because some personnel studied both maths and English or were required to resit courses, this equates to 538 unique learners.105
Of these learners, 257 were randomly allocated to the treatment group, and 281 to the control group. We were able to collect attainment data for 396 of these learners, and unable to collect this data for the remaining 142 learners as (1) some participating AECs were unable to provide data due to staff constrains and (2) the final results were not yet published at the time of data collection. The final distribution of learners across subjects and trial arms is shown in Table 47 below.
Table 47: Purpose for Learning trial - allocation of participants to treatment arms
Treatment Control Total English 100 104 204 Maths 95 97 192 Total 195 201 396
105 Where learners completed the survey more than once, we excluded the second instance from our analysis.
100
188 of the total number of learners fully completed a post-course survey. The post-course survey included questions on wellbeing, meaning in life and intrinsic motivation as well as a range of demographic questions. The final sample, who completed the end of course survey, were predominantly male (87 percent) were male and between the ages of 20 and 29 (52 percent). The mean length of time spent in the army was approximately 10 years.
3.2.4.6 Analytical strategy
Logistic regressions examined the impact of the Purpose for Learning intervention on attainment. Therefore, the primary outcome measure was a binary pass/fail for each participant in the trial. Secondary analysis included an investigation of how the post-course survey outcome measures influenced the treatment effect. In addition, we analysed whether the Purpose for Learning intervention had an impact on within-person scores on wellbeing, meaning in life and intrinsic motivation.
3.2.4.7 Results
Summary: We found that course pass rates for learners who completed the short online self-reflection exercise were higher than those who completed a control exercise (4.9 % points), but this difference did not reach statistical significance. There is a lower than 10% probability that the difference in outcomes between the control and treatment groups is due to chance. We found that 91.5 percent of learners in the treatment group passed their Level 2 course, while in the control group 86.6 percent of learners passed: a difference of approximately five percent, or five percentage points (Figure 21).
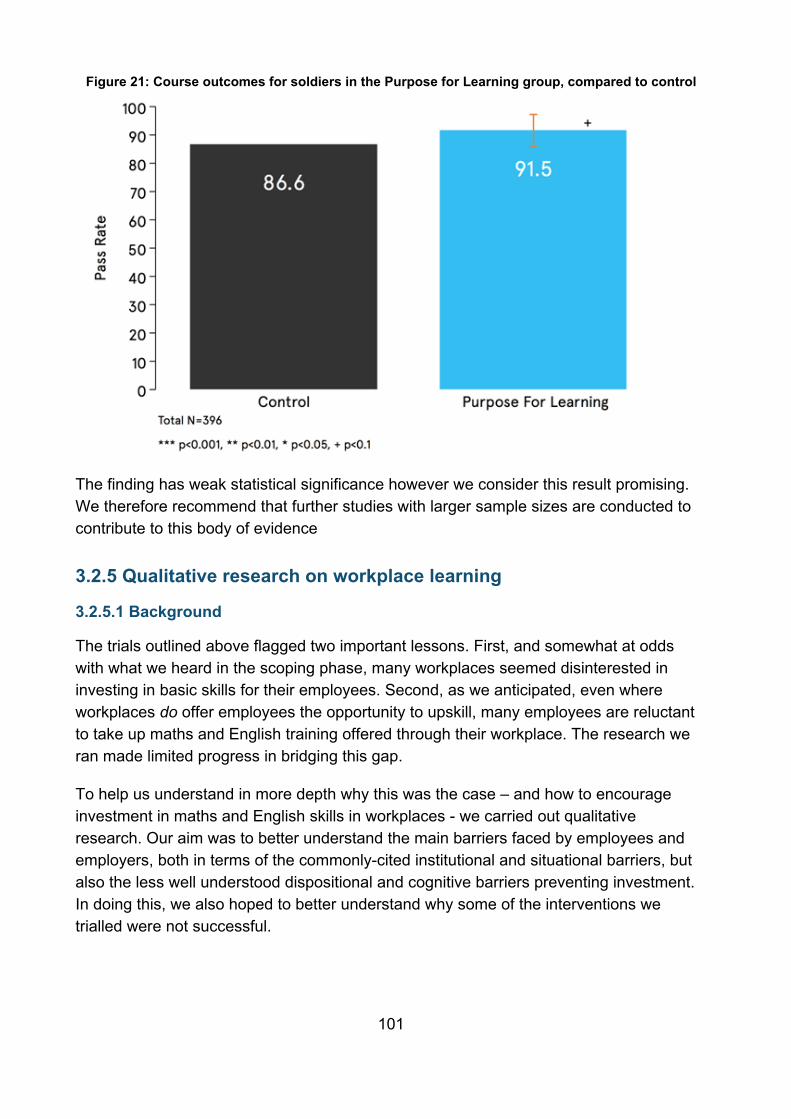
101
Figure 21: Course outcomes for soldiers in the Purpose for Learning group, compared to control
The finding has weak statistical significance however we consider this result promising. We therefore recommend that further studies with larger sample sizes are conducted to contribute to this body of evidence
3.2.5 Qualitative research on workplace learning
3.2.5.1 Background
The trials outlined above flagged two important lessons. First, and somewhat at odds with what we heard in the scoping phase, many workplaces seemed disinterested in investing in basic skills for their employees. Second, as we anticipated, even where workplaces do offer employees the opportunity to upskill, many employees are reluctant to take up maths and English training offered through their workplace. The research we ran made limited progress in bridging this gap.
To help us understand in more depth why this was the case – and how to encourage investment in maths and English skills in workplaces - we carried out qualitative research. Our aim was to better understand the main barriers faced by employees and employers, both in terms of the commonly-cited institutional and situational barriers, but also the less well understood dispositional and cognitive barriers preventing investment. In doing this, we also hoped to better understand why some of the interventions we trialled were not successful.
102
3.2.5.2 Theoretical motivation
The focus of the qualitative research was to explore in depth the institutional, situational, dispositional and cognitive barriers faced by both employers and employees in pursuing training.
3.2.5.3 Research design
The research had two primary elements to it: a focused literature review, to complement the in-depth literature review undertaken early in the life of ASK, and a set of qualitative interviews.
The literature review tied together research and evidence from several related areas including numeracy and literacy in the UK, employment patterns, and trends in training and workplace learning. This was supplemented with research on the institutional, situational, dispositional, and cognitive barriers facing employers and employees in skills development and a review of the evidence on employers’ attitudes to high performance work practices, including training and development.
A total of 38 interviews were carried out. These included 21 key informant interviews with experts and representatives of employers and employees, and semi-structured interviews with 10 employers and seven employees. The interviews were semi-structured and the questions were devised to collect background information on the employer, explore challenges they face as an organisation and understand their decision-making around skills investments and training. We focused on employers likely to employ at least some adults with low skills in their workforce. The employers interviewed represented a mix of different types of organisation, sectors, organisational size and geographic spread.
Semi-structured interviews were also carried out with employees of one of the large employers who took part in the programme of trials. These included a mix of employees who chose to opt into training offered by the employer and those who chose not to. We aimed to explore differences between the two groups in terms of their backgrounds, perceptions of their numeracy and literacy skills, decision-making and recommendations for workplace training.
3.2.5.4 Results
Figure 22 below indicates barriers to skills investments with key barriers from interviews highlighted in bold, while those that came up less frequently are in black text (not bolded) and those that did not come up, but emerged from the literature review and early scoping work shown in grey. Although some of these barriers are similar to those highlighted through the scoping work, this research gave us a broader and more in-depth picture of the significance of these barriers, and the interrelations between barriers facing employers and those facing employees.
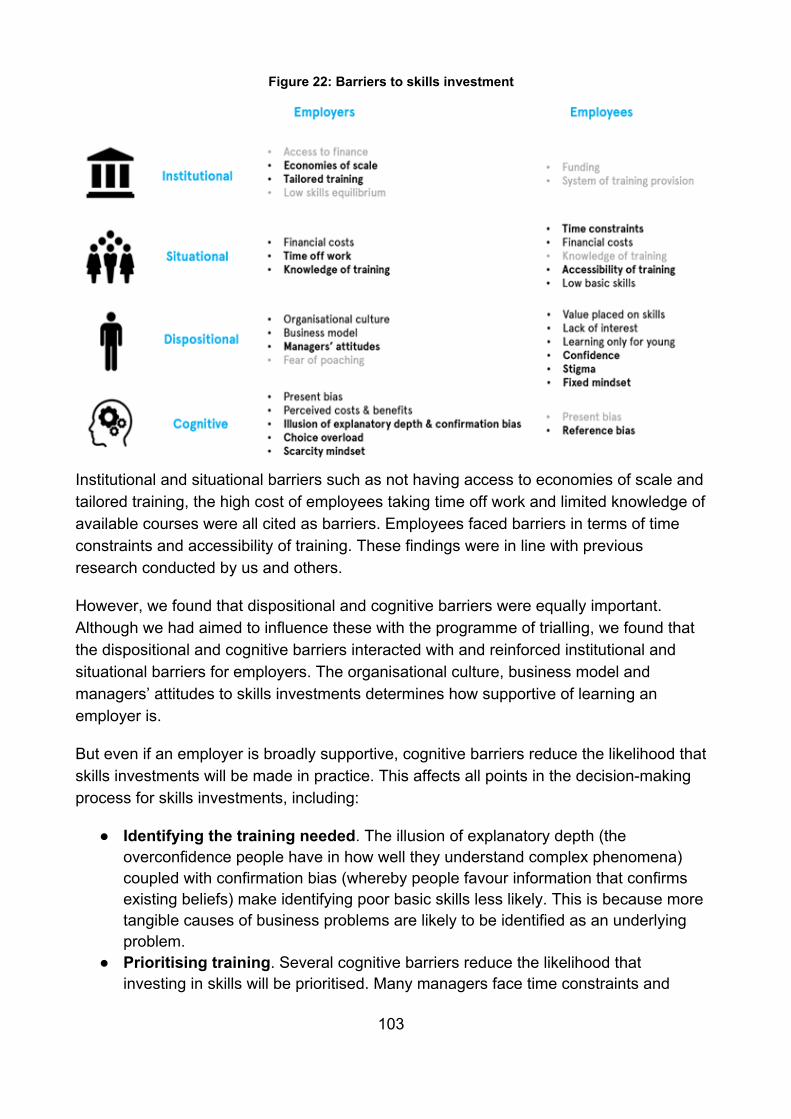
103
Figure 22: Barriers to skills investment
Institutional and situational barriers such as not having access to economies of scale and tailored training, the high cost of employees taking time off work and limited knowledge of available courses were all cited as barriers. Employees faced barriers in terms of time constraints and accessibility of training. These findings were in line with previous research conducted by us and others.
However, we found that dispositional and cognitive barriers were equally important. Although we had aimed to influence these with the programme of trialling, we found that the dispositional and cognitive barriers interacted with and reinforced institutional and situational barriers for employers. The organisational culture, business model and managers’ attitudes to skills investments determines how supportive of learning an employer is.
But even if an employer is broadly supportive, cognitive barriers reduce the likelihood that skills investments will be made in practice. This affects all points in the decision-making process for skills investments, including:
● Identifying the training needed. The illusion of explanatory depth (the overconfidence people have in how well they understand complex phenomena) coupled with confirmation bias (whereby people favour information that confirms existing beliefs) make identifying poor basic skills less likely. This is because more tangible causes of business problems are likely to be identified as an underlying problem.
● Prioritising training. Several cognitive barriers reduce the likelihood that investing in skills will be prioritised. Many managers face time constraints and
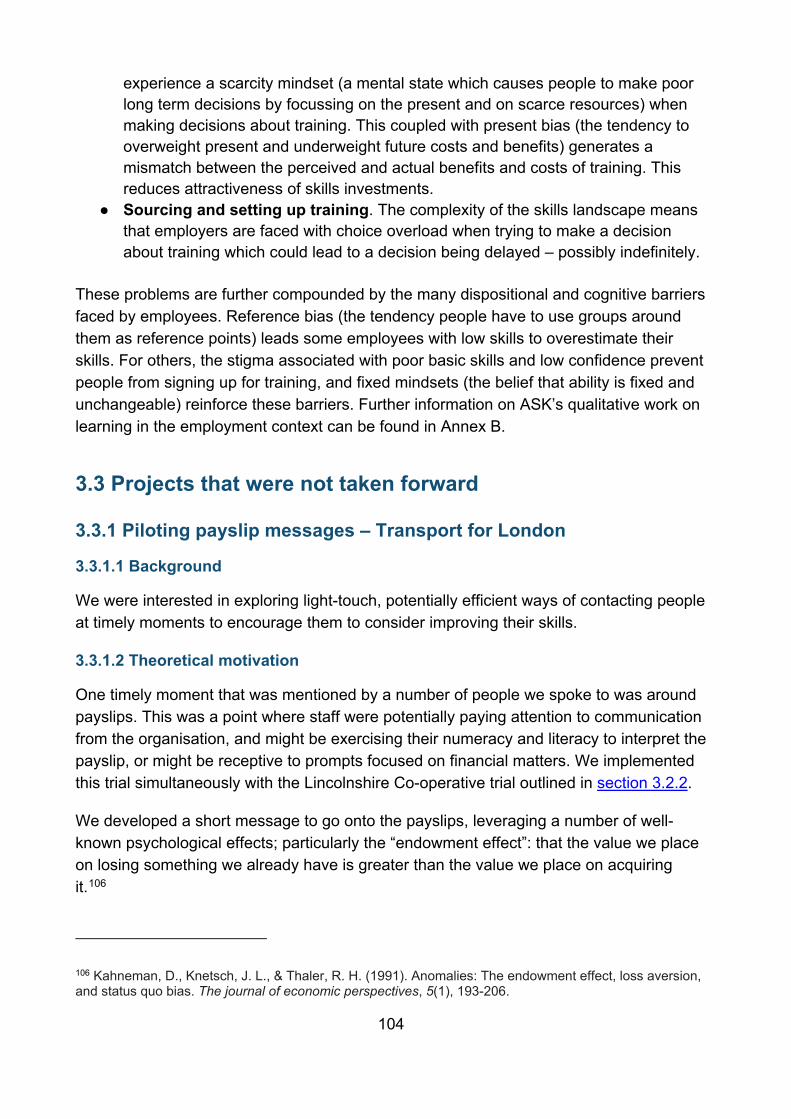
104
experience a scarcity mindset (a mental state which causes people to make poor long term decisions by focussing on the present and on scarce resources) when making decisions about training. This coupled with present bias (the tendency to overweight present and underweight future costs and benefits) generates a mismatch between the perceived and actual benefits and costs of training. This reduces attractiveness of skills investments.
● Sourcing and setting up training. The complexity of the skills landscape means that employers are faced with choice overload when trying to make a decision about training which could lead to a decision being delayed – possibly indefinitely.
These problems are further compounded by the many dispositional and cognitive barriers faced by employees. Reference bias (the tendency people have to use groups around them as reference points) leads some employees with low skills to overestimate their skills. For others, the stigma associated with poor basic skills and low confidence prevent people from signing up for training, and fixed mindsets (the belief that ability is fixed and unchangeable) reinforce these barriers. Further information on ASK’s qualitative work on learning in the employment context can be found in Annex B.
3.3 Projects that were not taken forward
3.3.1 Piloting payslip messages – Transport for London
3.3.1.1 Background
We were interested in exploring light-touch, potentially efficient ways of contacting people at timely moments to encourage them to consider improving their skills.
3.3.1.2 Theoretical motivation
One timely moment that was mentioned by a number of people we spoke to was around payslips. This was a point where staff were potentially paying attention to communication from the organisation, and might be exercising their numeracy and literacy to interpret the payslip, or might be receptive to prompts focused on financial matters. We implemented this trial simultaneously with the Lincolnshire Co-operative trial outlined in section 3.2.2.
We developed a short message to go onto the payslips, leveraging a number of well-known psychological effects; particularly the “endowment effect”: that the value we place on losing something we already have is greater than the value we place on acquiring it.106
106 Kahneman, D., Knetsch, J. L., & Thaler, R. H. (1991). Anomalies: The endowment effect, loss aversion, and status quo bias. The journal of economic perspectives, 5(1), 193-206.
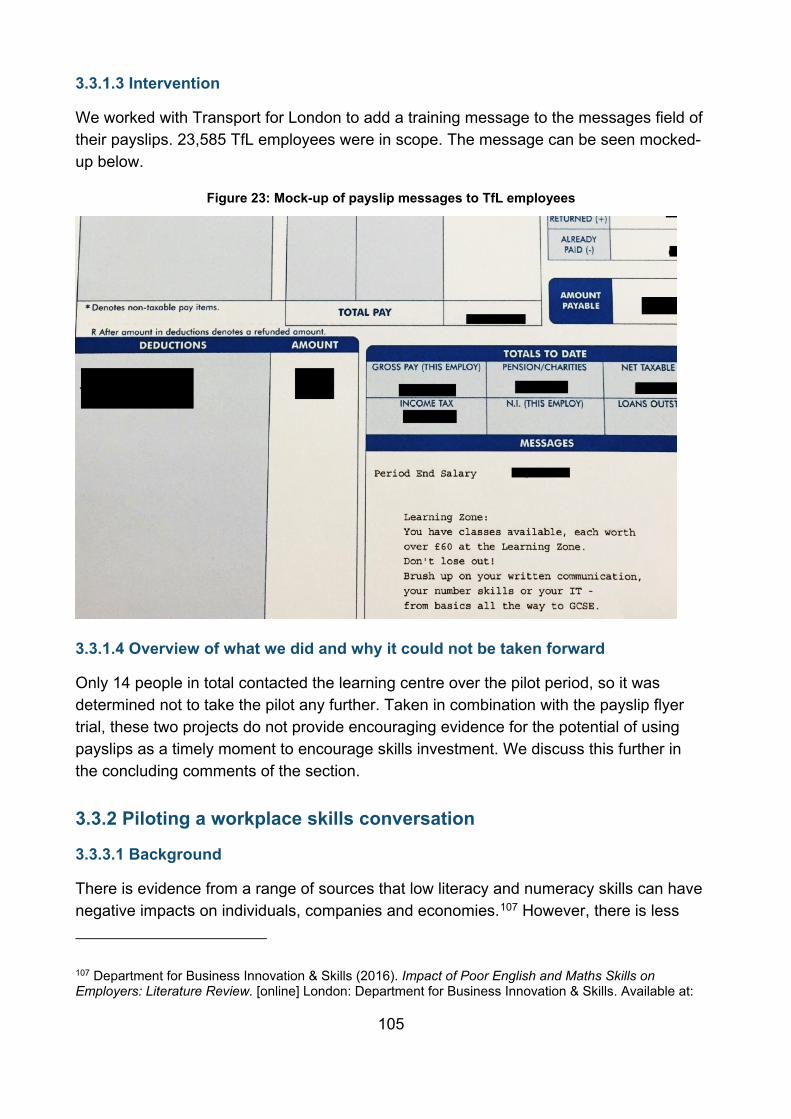
105
3.3.1.3 Intervention
We worked with Transport for London to add a training message to the messages field of their payslips. 23,585 TfL employees were in scope. The message can be seen mocked-up below.
Figure 23: Mock-up of payslip messages to TfL employees
3.3.1.4 Overview of what we did and why it could not be taken forward
Only 14 people in total contacted the learning centre over the pilot period, so it was determined not to take the pilot any further. Taken in combination with the payslip flyer trial, these two projects do not provide encouraging evidence for the potential of using payslips as a timely moment to encourage skills investment. We discuss this further in the concluding comments of the section.
3.3.2 Piloting a workplace skills conversation
3.3.3.1 Background
There is evidence from a range of sources that low literacy and numeracy skills can have negative impacts on individuals, companies and economies.107 However, there is less 107 Department for Business Innovation & Skills (2016). Impact of Poor English and Maths Skills on Employers: Literature Review. [online] London: Department for Business Innovation & Skills. Available at:
106
evidence that increasing employees literacy and numeracy skills leads to direct benefits to an individual employer (as opposed to more aggregate economic benefits caused by, for example, staff moving to more productive roles or organisations once their skills have improved). One rigorous study in Canada seemed to show positive impacts on productivity, workplace performance and employee retention.108 However, no similar study exists in the UK.
In this trial we hoped to pilot a new workplace skills conversation designed to help staff working in retail stores to self-identify and volunteer for literacy or numeracy training. Our goal was then to measure the impact of this training on the performance of the store they worked for, by randomising which stores took part in the new workplace conversation and subsequent offer of training.
3.3.3.2 Theoretical motivation
This trial sought to tackle two problems. First, many employers fear that if they train staff they will be ‘poached’ by competitors, although research suggests that employers view this risk as more likely than it actually is.109 Through encouraging employees to take part in employer provided training, and measuring the impact on clear measures of business productivity (store performance, individual employee morale etc), we hoped to overcome a clear employer barrier to investing in basic literacy and numeracy training for staff.
Second, many people do not take part in literacy or numeracy programmes because they are unaware that their skill levels are low.110 We designed a workbook, incorporating a light-touch skills assessment, which employees could complete privately and which would give them feedback on their skills level and whether they could benefit from training. The goal was to enable employees to consider their literacy and numeracy in a non-threatening, private exercise and then to provide a timely opportunity to act on their results and sign up for training.
3.3.3.3 Intervention
In the treatment arm, the intervention comprised the following:
1. Staff were given a short, behaviourally informed workbook to complete in advance of their normal annual Performance Assessment process. This included:
https://www.gov.uk/government/uploads/system/uploads/attachment_data/file/497550/BIS-16-48-impact-of-poor-english-and-maths-skills-on-employers-literature-review.pdf [Accessed 8 Jan. 2018]. 108 Gyarmati, et al. (2014). UPSKILL: A Credible Test of Workplace Literacy and Essential Skills Training. Summary report, August 2014. 109 Shury, J., Davies, B. & Riley, T. (2008). Skills for the Workplace: Employer Perspectives. UKCES. UK commission for Employment and Skills. 110 NRDC. (2006). Skills for Life Quality Initiative: Motivation and Persistence. London: National Research and Development Centre for Adult Literacy and Numeracy.
107
a. a growth mindset exercise, b. a short self-assessment in English, c. a short self-assessment in maths.
2. As part of their normal Performance Appraisal, staff would then discuss with their
manager whether they would like to take up a literacy or numeracy course, funded by Lincolnshire Co-operative and available for them to complete in work time. Managers would encourage staff who could benefit to do this and use the workbook as a starting point for this potentially difficult conversation. Managers received support and written guidance from BIT about how to have these conversations. In the vast majority of cases this was delivered during a one-to-one training session in which BIT staff visited Co-operative managers in their store to go through the process and explain the reasoning behind it.
3. Staff who indicated this interest would be booked onto a course by Lincolnshire Co-operative’s People and Performance team as they would be for any other development programme.
3.3.3.4 Overview of what we did and why it could not be taken forward
We worked with Lincolnshire Co-operative to develop and pilot a Skills Check workbook. We did this in 22 of their stores around Lincoln and Newark, involving 372 staff members.
Senior staff in the Co-operative were extremely supportive, as were the store managers in the 22 stores, with whom we met individually. In fact, during one-to-one training many store managers said that they could already think of members of their team who they felt would benefit from the approach. However, we faced some challenges in timing, with many of the stores not receiving and rolling out the workbooks until after performance discussions were already complete, as more managers than expected completed these discussions well in advance of the overall company deadline. Ultimately, fewer than five staff expressed interest in taking up the courses through the Co-operative. The decision was taken, therefore, not to continue the pilot through to trial.
However, owing to the importance of the workplace setting in people’s lives, and the likely impact that signals from management have on the perceived value of training, we consider this a challenging, but important, area to continue investigating.
3.4 Impact and significance Over the course of ASK, we scoped, piloted or ran over seven trials in workplaces, plus the qualitative capstone piece, exploring the ways that the workplace context interacts with motivations and opportunities to upskill. It is significant that our most promising trial in this workstream involved on-course learners who had been mandated into the training
108
(in the Army). There are some continuities here with the colleges workstream outlined previously.
On the recruitment side, there are three points to highlight. First, that there were many cases where what we tried had no effect. We did not hit on the right combination of moment and message that would give us confidence that this is the right way to approach people about their maths and English.
Second, even where the trials did significantly increase interest, and certainly where they did not, the baseline response rates (in the control groups) were incredibly low. From the 14 people in total who responded to the TfL payslip message, to the seven who responded in Control from the payslip flyer message, to the TfL network nudge approach, where an almost four-fold increase got us up to 0.11 percent expressing interest, this suggests the extreme difficulty of encouraging staff to sign up to employer-led training.
Third, the logistics of both engaging employers in these trials and then in delivering them, in many cases proved prohibitive. It is relevant that all of the trials we ran in this space were conducted with socially-oriented employers, either in the public sector or those with an element of public-motivation in their mission. Although we spoke to many mainly for-profit companies as part of this research, ultimately none were sufficiently interested in partnering with us to test other ways of increasing sign-up.
Qualitatively, one of the more effective models we saw was Union-led learning, but even this only seemed to work in particular cases, where there was engaged management, a motivated Union Learning Representative, and a relatively cohesive workforce. However, this approach will have its limitations, as a relatively small proportion of the working population are employed in sectors that are unionised.
From this research stream, we identified that the interaction of the various barriers to provision and uptake of training could form a vicious circle that would be difficult for a light-touch intervention to disrupt. This may in part explain the low effectiveness of the interventions we tested. Unsurprisingly, we did not identify a ‘silver bullet’ behavioural intervention that could increase provision or uptake of workplace-based maths and English training. It might also be that the format of the trials limited the approaches pursued, e.g. it is difficult to measure face to face nudges or effects over longer periodes of time e.g. if the message is on every payslip for a year.
Rather, the disruption of the cycle of non-provision and non-uptake would require systematic, holistic and ongoing intervention aimed at addressing multiple barriers at once. Behavioural insights could have a role to play in informing stages of these interventions, but strong and ongoing motivation from individual employers (such as that we saw in the British Army, mandating the qualification for promotion) appears to be an important factor in driving skills improvement.

109
Given that most adults with poor basic skills are in the workplace and we know very few do English and maths courses, even small increases across the whole working population would lead to a massive increase in uptake. Therefore if it is possible to discover effective interventions based on the lesson learned outlined, even with small effect sizes the potential for impact is substantial.
110
4. Community learning In this section, we outline work we completed with local authorities and charities to encourage adults into maths and English courses. We document scoping activities, implemented projects and projects that, for one reason or another, we were unable to take forward.
4.1 Scoping Community learning (provision that is not provided in a formal college setting) is an important element of the adult learning environment. It provides opportunities for those who would be unlikely to take a course in a college, and can act as a stepping stone into more formal learning environments. For this reason, we were interested in ways to increase retention in courses held in these settings. As a result, ASK met with a range of different community learning providers, in the hope of reaching learners who could benefit most from the education opportunity being provided. With this intention in mind, we ended up working with organisations that covered a spectrum of learners in community based skills education such as Resurgo Spear and Prince’s Trust (at risk unemployed young people), Crisis (those without steady housing) and Children’s Centres (new parents who might be reflecting on their own education). Refer to section 5.7 of the literature review (Annex A) for further reading on community learning.
4.2 Implemented projects In this section, we describe two projects we completed in Children’s Centres in England.
4.2.1 Children’s centres recruitment
4.2.1.1 Background
Children’s Centres are hubs, based in the community, which offer a range of services and support to parents of young children. These include running activities and classes, providing parenting support and often hosting clinics with midwives and health visitors. In recent years, many Children’s Centres have also started offering adult learning courses (including literacy and numeracy) to parents.
We were interested in these courses in Children’s Centres for two main reasons. We had a working hypothesis that courses offered in this environment might be more appealing to the parents of young children. Children’s Centres are often geographically much closer to people’s homes than the nearest FE college, they are places that parents visit regularly and so may feel comfortable there and importantly, childcare can be provided on-site. In
111
our qualitative fieldwork with parents, many mentioned the significance of being able to learn outside of an FE college.
We also hypothesised that parents using Children’s Centres might have specific motivations for wanting to improve their skills. Many parents said that they wanted to be able to help their children with schoolwork.111
We decided to conduct this RCT for a number of reasons. First, it was a low-cost opportunity to test several hypotheses about the types of communications that might attract learners into community learning. Second, many Children’s Centres struggle to attract enough learners into courses to make them viable. Courses are usually delivered by outside training partners (FE colleges or private firms) who need eight or more learners signed up to justify them travelling in the first place. This can mean that courses are cancelled at the last minute if not enough learners turn up which is frustrating for training providers and parents themselves.
Third, we wanted to minimise the risk that those courses selected to be part of our retention trial (see 4.3.2.2 Children’s Centres Retention) would be cancelled due to insufficient learners signing up.
4.2.1.2 Theoretical motivation
The aim of the intervention was to inform parents about courses and encourage them to sign up. The different communications focused on motivations that the parent would identify with (i.e., benefiting their child’s learning; learning with others) as well as emphasising the ease of the signup process.
In our qualitative fieldwork, many parents cited their children as their motivation for attending courses at the Children’s Centre (either because doing so would enable them to better support their children’s education or because it would help them find a job and better support their family). Course tutors and Children’s Centre staff also felt that this was a strong motivator for many learners.
Another common theme in our fieldwork was the importance that learners at the Children’s Centre placed on learning with ‘people like them’. In particular, many learners had either not attended school in the UK or had a poor past experience of education. Learning with peers, in an informal community setting, was appealing for them.
111 Rhys Warner, J., & Vorhaus, J. with Appleby, Y., Bathmaker, A., Brooks, G., Cole, P., Pilling, M., & Pearce, L. (2008). The Learner Study: The impact of the Skills for Life strategy on adult literacy, language and numeracy learners. London: National Research and Development Centre for Adult Literacy and Numeracy.
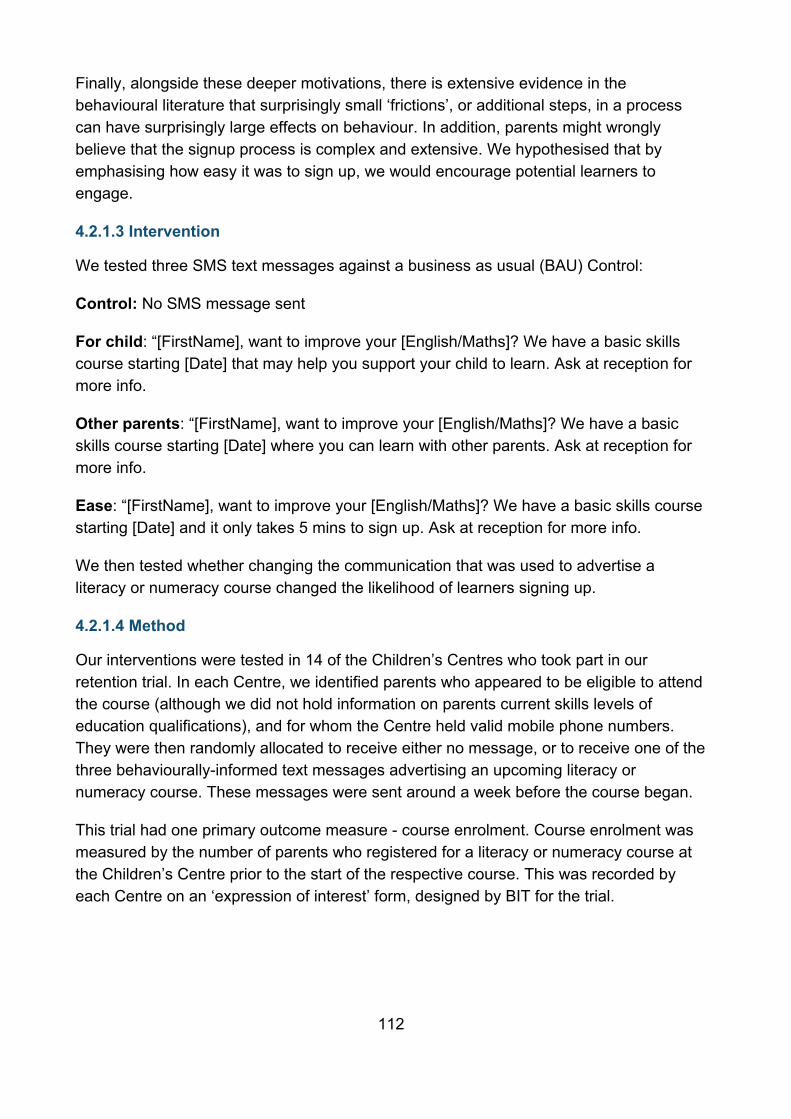
112
Finally, alongside these deeper motivations, there is extensive evidence in the behavioural literature that surprisingly small ‘frictions’, or additional steps, in a process can have surprisingly large effects on behaviour. In addition, parents might wrongly believe that the signup process is complex and extensive. We hypothesised that by emphasising how easy it was to sign up, we would encourage potential learners to engage.
4.2.1.3 Intervention
We tested three SMS text messages against a business as usual (BAU) Control:
Control: No SMS message sent
For child: “[FirstName], want to improve your [English/Maths]? We have a basic skills course starting [Date] that may help you support your child to learn. Ask at reception for more info.
Other parents: “[FirstName], want to improve your [English/Maths]? We have a basic skills course starting [Date] where you can learn with other parents. Ask at reception for more info.
Ease: “[FirstName], want to improve your [English/Maths]? We have a basic skills course starting [Date] and it only takes 5 mins to sign up. Ask at reception for more info.
We then tested whether changing the communication that was used to advertise a literacy or numeracy course changed the likelihood of learners signing up.
4.2.1.4 Method
Our interventions were tested in 14 of the Children’s Centres who took part in our retention trial. In each Centre, we identified parents who appeared to be eligible to attend the course (although we did not hold information on parents current skills levels of education qualifications), and for whom the Centre held valid mobile phone numbers. They were then randomly allocated to receive either no message, or to receive one of the three behaviourally-informed text messages advertising an upcoming literacy or numeracy course. These messages were sent around a week before the course began.
This trial had one primary outcome measure - course enrolment. Course enrolment was measured by the number of parents who registered for a literacy or numeracy course at the Children’s Centre prior to the start of the respective course. This was recorded by each Centre on an ‘expression of interest’ form, designed by BIT for the trial.
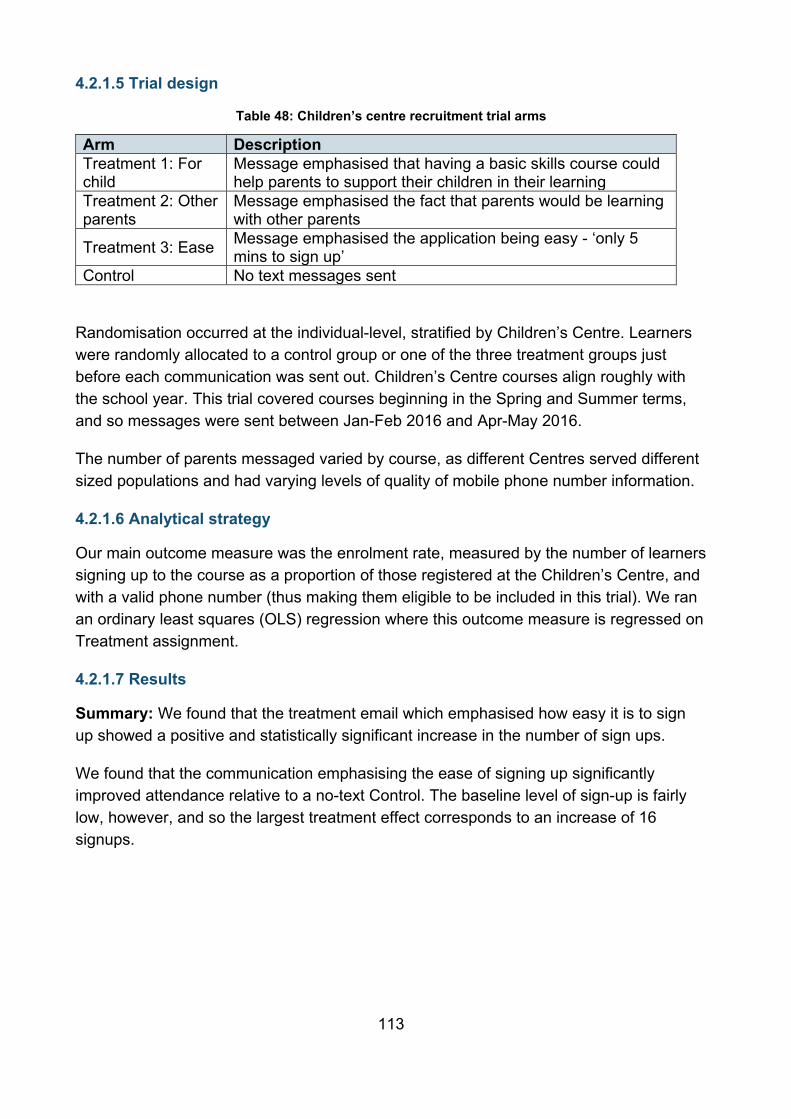
113
4.2.1.5 Trial design
Table 48: Children’s centre recruitment trial arms
Arm Description Treatment 1: For child
Message emphasised that having a basic skills course could help parents to support their children in their learning
Treatment 2: Other parents
Message emphasised the fact that parents would be learning with other parents
Treatment 3: Ease Message emphasised the application being easy - ‘only 5 mins to sign up’
Control No text messages sent
Randomisation occurred at the individual-level, stratified by Children’s Centre. Learners were randomly allocated to a control group or one of the three treatment groups just before each communication was sent out. Children’s Centre courses align roughly with the school year. This trial covered courses beginning in the Spring and Summer terms, and so messages were sent between Jan-Feb 2016 and Apr-May 2016.
The number of parents messaged varied by course, as different Centres served different sized populations and had varying levels of quality of mobile phone number information.
4.2.1.6 Analytical strategy
Our main outcome measure was the enrolment rate, measured by the number of learners signing up to the course as a proportion of those registered at the Children’s Centre, and with a valid phone number (thus making them eligible to be included in this trial). We ran an ordinary least squares (OLS) regression where this outcome measure is regressed on Treatment assignment.
4.2.1.7 Results
Summary: We found that the treatment email which emphasised how easy it is to sign up showed a positive and statistically significant increase in the number of sign ups.
We found that the communication emphasising the ease of signing up significantly improved attendance relative to a no-text Control. The baseline level of sign-up is fairly low, however, and so the largest treatment effect corresponds to an increase of 16 signups.
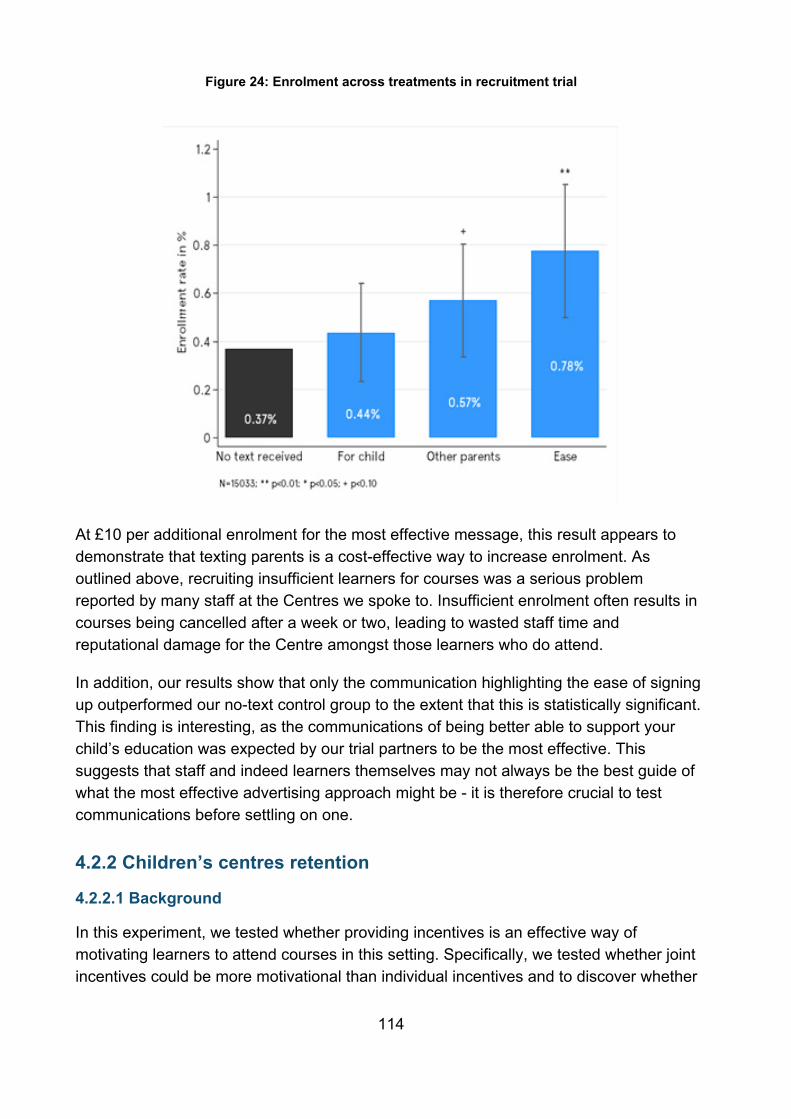
114
Figure 24: Enrolment across treatments in recruitment trial
At £10 per additional enrolment for the most effective message, this result appears to demonstrate that texting parents is a cost-effective way to increase enrolment. As outlined above, recruiting insufficient learners for courses was a serious problem reported by many staff at the Centres we spoke to. Insufficient enrolment often results in courses being cancelled after a week or two, leading to wasted staff time and reputational damage for the Centre amongst those learners who do attend.
In addition, our results show that only the communication highlighting the ease of signing up outperformed our no-text control group to the extent that this is statistically significant. This finding is interesting, as the communications of being better able to support your child’s education was expected by our trial partners to be the most effective. This suggests that staff and indeed learners themselves may not always be the best guide of what the most effective advertising approach might be - it is therefore crucial to test communications before settling on one.
4.2.2 Children’s centres retention
4.2.2.1 Background
In this experiment, we tested whether providing incentives is an effective way of motivating learners to attend courses in this setting. Specifically, we tested whether joint incentives could be more motivational than individual incentives and to discover whether
115
social commitments between classmates could increase engagement and effort towards the shared goal. In addition we had hoped to test these against a ‘behaviourally-informed’ intervention in which no incentive was offered. Unfortunately, we struggled to deliver this intervention in a timely fashion (it had to be delivered on paper to learners) and also struggled to recruit enough classes onto the trial to test an additional intervention while retaining the required statistical power. We therefore dropped this mid-way through the trial, re-allocating these learners to our control group (and creating a ‘new Control’ which was implemented from this point on).
4.2.2.2 Theoretical motivation
People’s social preferences and emotions can be powerful motivators. Social preferences encompass a range of different constructs, such as reciprocity, altruism, envy and guilt. These ‘moral sentiments’ motivate people to take into account others’ interests.112 For example, someone might be inclined to show up to a session in the gym because they agreed to go with a friend and they would feel guilty if they stood them up. Alternatively, the person might feel good for attending the gym because their friend has done them a favour recently. In both of these cases, social preferences strengthen the person’s motivation to go to the gym through guilt (first example) and reciprocity (second example).
In this project, we sought to test the power of fostering learning related commitments between learners and their existing social support networks. However, there was also opportunity to foster supportive commitments between classmates. The literature on social networks suggests that people who are similar to us, or with whom we share a similar identity with can be particularly influential.113 Adult learners, who often have fragile learner identities,114 could benefit from having a ‘buddy’ within the classroom who shares their experience.115 The use of peers to reach a shared but individual goal is not new: we see it in self-help groups such as Alcoholics Anonymous or informal groups like study or running groups.
In the classroom setting, this could take different forms. Having reciprocal interactions with a classmate (buddy) can help learners stay on track. For example, if the learner missed two classes in a row, they might feel inclined to drop out of the class because they are unsure if they would be able to catch up. By having a buddy in the class, the
112 De Hooge, I. E., Breugelmans, S. M., & Zeelenberg, M. (2008). Not so ugly after all: when shame acts as a commitment device. Journal of personality and social psychology, 95(4), 933. 113 Cialdini, R. B., & Garde, N. (1987). Influence (Vol. 3). 114 Gallacher, J., Crossan, B., Field, J., & Merrill, B. (2002). Learning careers and the social space: exploring the fragile identities of adult returners in the new further education. International journal of lifelong education, 21(6), 493-509. 115 Kast, F., Meier, S., & Pomeranz, D. (2012). Under-savers anonymous: Evidence on self-help groups and peer pressure as a savings commitment device (No. w18417). National Bureau of Economic Research.
116
learner knows where they can go to for resources and advice without the barrier of having to face the tutor.
Additionally, peer influence can be a powerful phenomenon.116 Being observed by others, and observing the behaviours of others, holding each other accountable and receiving feedback can help both members of the peer group achieve better self-control, and ultimately follow through with their goals.
Another area of research that shows strong and convincing effects on people’s effort and goal-completion, is that of financial incentives.117 In the context of education, several intervention studies have found positive effects of incentives on learner performance.118 119 For example, Barrow and colleagues rewarded college learners for maintaining a pass grade throughout the academic year, and found that those assigned to the performance-based incentive programme achieved on average 40 percent more course credits.120 For additional information on the use of incentives in education, refer to page 34 of the literature review.
Given the evidence base supporting both the impact of peer influence and financial incentives, we hypothesised that if we were to combine these two powerful motivators, peers as commitment devices and financial incentives, we may be able to magnify the positive effects of each. Team-based incentives have not been tested widely, but initial evidence shows team compensation can increase the likelihood that individuals engage in the desired behaviour,121 such as attending class.
There is also research suggesting that providing monetary rewards might not have the desired effect as it removes a person’s intrinsic motivation to do something or signals that others do not find the action worthwhile. This phenomenon is known as ‘crowding out’.122
116 Kast, F., Meier, S., & Pomeranz, D. (2012). Under-savers anonymous: Evidence on self-help groups and peer pressure as a savings commitment device (No. w18417). National Bureau of Economic Research. 117 Lazear, E. P. (2000). The power of incentives. The American Economic Review, 90(2), 410-414. 118 Angrist, J., Lang, D., & Oreopoulos, P. (2009). Incentives and services for college achievement: Evidence from a randomized trial. American Economic Journal: Applied Economics, 1(1), 136-163. 119 Kremer, M., Miguel, E., & Thornton, R. (2009). Incentives to learn. The Review of Economics and Statistics, 91(3), 437-456. 120 Barrow, L., Richburg-Hayes, L., Rouse, C. E., & Brock, T. (2014). Paying for performance: The education impacts of a community college scholarship programme for low-income adults. Journal of Labor Economics, 32(3), 563-599. 121 Babcock, P., Bedard, K., Charness, G., Hartman, J., & Royer, H. (2015). Letting down the team? Social effects of team incentives. Journal of the European Economic Association, 13(5), 841-870. 122 Bowles, S., & Polania-Reyes, S. (2012). Economic incentives and social preferences: substitutes or complements?. Journal of Economic Literature, 50(2), 368-425; Gneezy, U., Meier, S., & Rey-Biel, P. (2011). When and why incentives (don't) work to modify behavior. The Journal of Economic Perspectives, 25(4), 191-209.
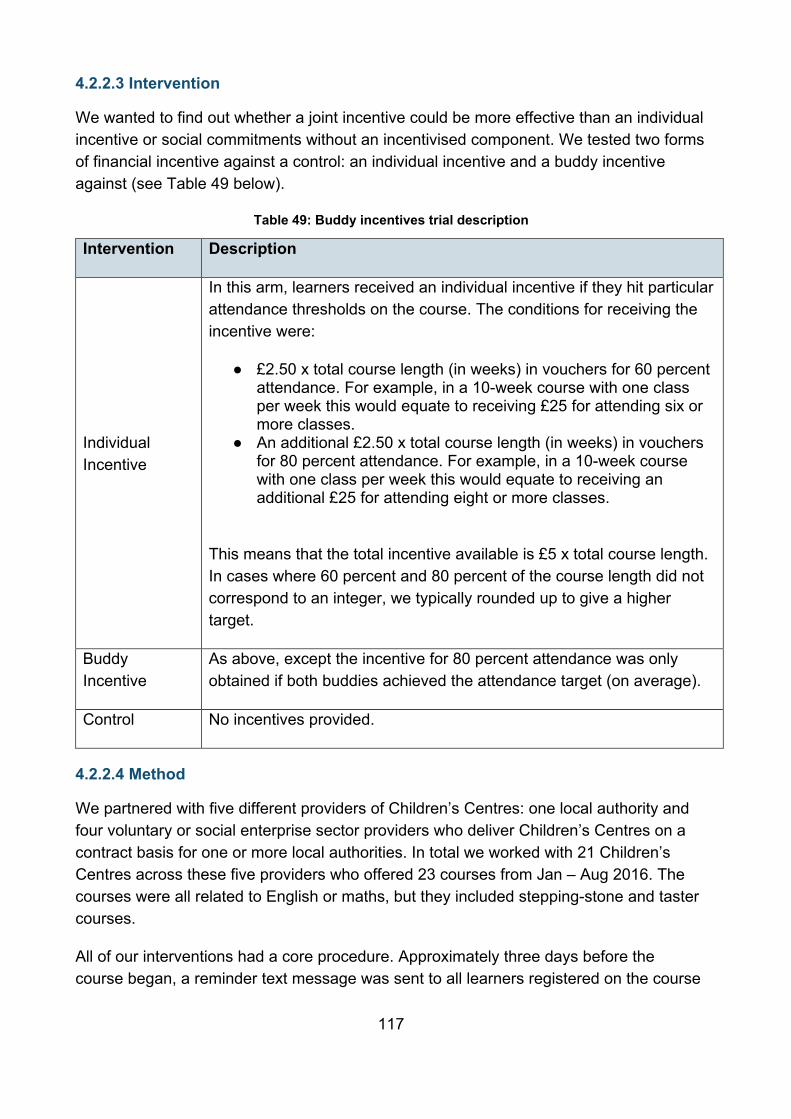
117
4.2.2.3 Intervention
We wanted to find out whether a joint incentive could be more effective than an individual incentive or social commitments without an incentivised component. We tested two forms of financial incentive against a control: an individual incentive and a buddy incentive against (see Table 49 below).
Table 49: Buddy incentives trial description
Intervention Description
Individual Incentive
In this arm, learners received an individual incentive if they hit particular attendance thresholds on the course. The conditions for receiving the incentive were:
● £2.50 x total course length (in weeks) in vouchers for 60 percent attendance. For example, in a 10-week course with one class per week this would equate to receiving £25 for attending six or more classes.
● An additional £2.50 x total course length (in weeks) in vouchers for 80 percent attendance. For example, in a 10-week course with one class per week this would equate to receiving an additional £25 for attending eight or more classes.
This means that the total incentive available is £5 x total course length. In cases where 60 percent and 80 percent of the course length did not correspond to an integer, we typically rounded up to give a higher target.
Buddy Incentive
As above, except the incentive for 80 percent attendance was only obtained if both buddies achieved the attendance target (on average).
Control No incentives provided.
4.2.2.4 Method
We partnered with five different providers of Children’s Centres: one local authority and four voluntary or social enterprise sector providers who deliver Children’s Centres on a contract basis for one or more local authorities. In total we worked with 21 Children’s Centres across these five providers who offered 23 courses from Jan – Aug 2016. The courses were all related to English or maths, but they included stepping-stone and taster courses.
All of our interventions had a core procedure. Approximately three days before the course began, a reminder text message was sent to all learners registered on the course
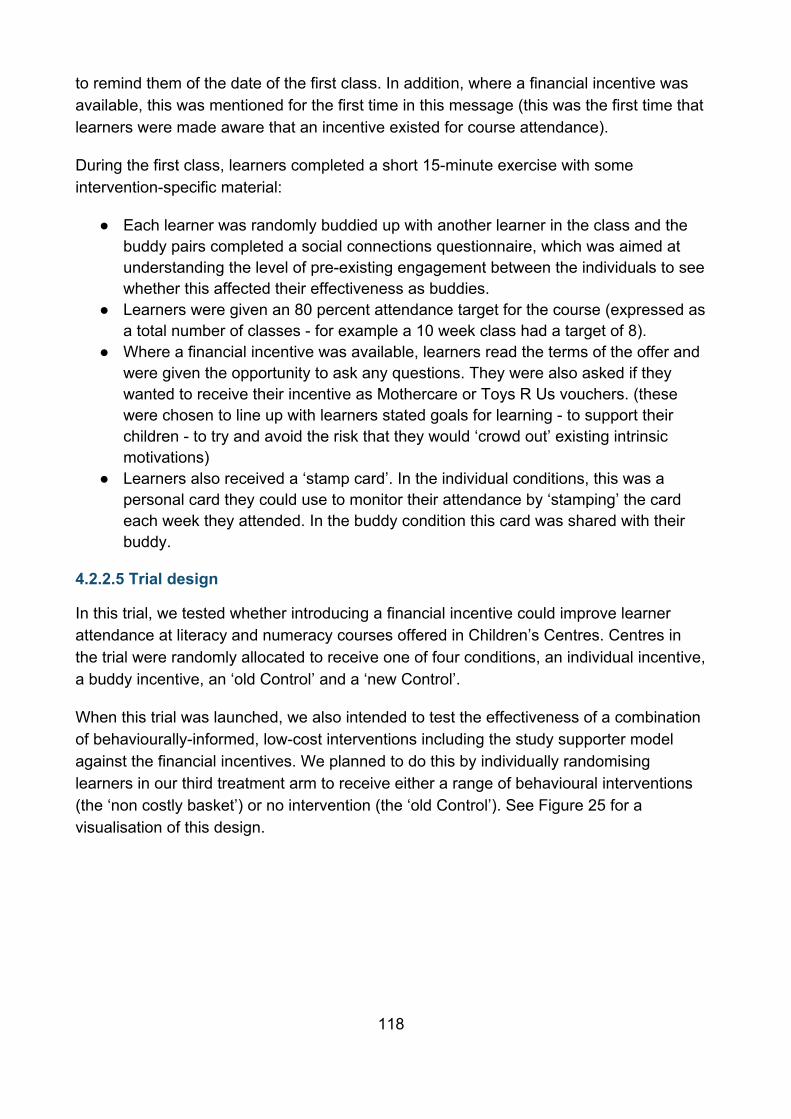
118
to remind them of the date of the first class. In addition, where a financial incentive was available, this was mentioned for the first time in this message (this was the first time that learners were made aware that an incentive existed for course attendance).
During the first class, learners completed a short 15-minute exercise with some intervention-specific material:
● Each learner was randomly buddied up with another learner in the class and the buddy pairs completed a social connections questionnaire, which was aimed at understanding the level of pre-existing engagement between the individuals to see whether this affected their effectiveness as buddies.
● Learners were given an 80 percent attendance target for the course (expressed as a total number of classes - for example a 10 week class had a target of 8).
● Where a financial incentive was available, learners read the terms of the offer and were given the opportunity to ask any questions. They were also asked if they wanted to receive their incentive as Mothercare or Toys R Us vouchers. (these were chosen to line up with learners stated goals for learning - to support their children - to try and avoid the risk that they would ‘crowd out’ existing intrinsic motivations)
● Learners also received a ‘stamp card’. In the individual conditions, this was a personal card they could use to monitor their attendance by ‘stamping’ the card each week they attended. In the buddy condition this card was shared with their buddy.
4.2.2.5 Trial design
In this trial, we tested whether introducing a financial incentive could improve learner attendance at literacy and numeracy courses offered in Children’s Centres. Centres in the trial were randomly allocated to receive one of four conditions, an individual incentive, a buddy incentive, an ‘old Control’ and a ‘new Control’.
When this trial was launched, we also intended to test the effectiveness of a combination of behaviourally-informed, low-cost interventions including the study supporter model against the financial incentives. We planned to do this by individually randomising learners in our third treatment arm to receive either a range of behavioural interventions (the ‘non costly basket’) or no intervention (the ‘old Control’). See Figure 25 for a visualisation of this design.

119
Figure 25: Intended retention trial design
Unfortunately we faced a range of challenges in implementing this RCT. Many learners did not provide valid contact details (for example listing a classmate or the course tutor) suggesting that the intervention was not delivered with high fidelity. In addition, because of the intervention design we had no way of monitoring the delivery of the planned exercises. Finally, Centres did not provide contact and registration information in a timely manner and a proportion of posted materials were lost or received with a significant delay.
For these reasons, and in light of challenges recruiting sufficient Centres onto the trial, we decided to abandon this design. Instead, we opted to compare the two incentive arms against a Control. Learners were still buddied, encouraged to attend at least 80% of the classes and given a stamp card, but no longer received the study supporter exercise from the ‘old’ control condition. From this point on, Centres were cluster randomised to receive either the individual incentive, the buddy incentive or a ‘new Control’ (which was the Control exercise delivered to learners and was simpler than the old Control as it did not require the inclusion of exercises to allow individual randomisation to the non-costly basket’).
Figure 26: Revised trial design after changes
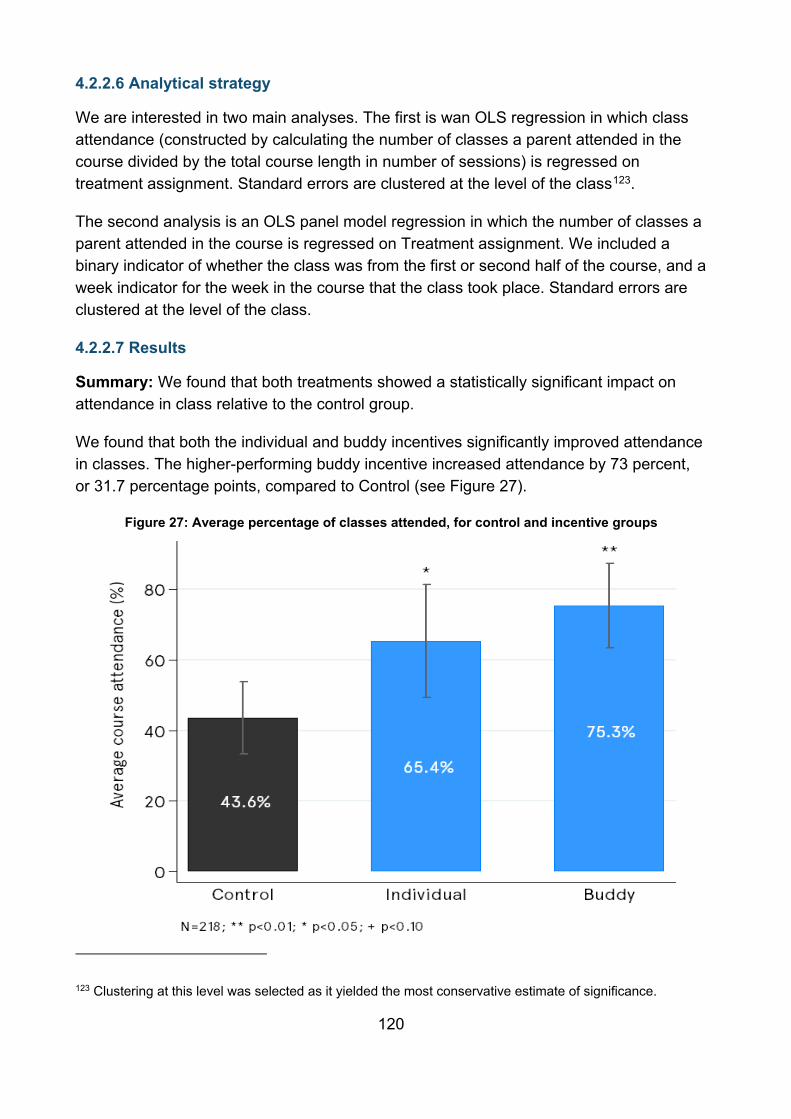
120
4.2.2.6 Analytical strategy
We are interested in two main analyses. The first is wan OLS regression in which class attendance (constructed by calculating the number of classes a parent attended in the course divided by the total course length in number of sessions) is regressed on treatment assignment. Standard errors are clustered at the level of the class123.
The second analysis is an OLS panel model regression in which the number of classes a parent attended in the course is regressed on Treatment assignment. We included a binary indicator of whether the class was from the first or second half of the course, and a week indicator for the week in the course that the class took place. Standard errors are clustered at the level of the class.
4.2.2.7 Results
Summary: We found that both treatments showed a statistically significant impact on attendance in class relative to the control group.
We found that both the individual and buddy incentives significantly improved attendance in classes. The higher-performing buddy incentive increased attendance by 73 percent, or 31.7 percentage points, compared to Control (see Figure 27).
Figure 27: Average percentage of classes attended, for control and incentive groups
123 Clustering at this level was selected as it yielded the most conservative estimate of significance.
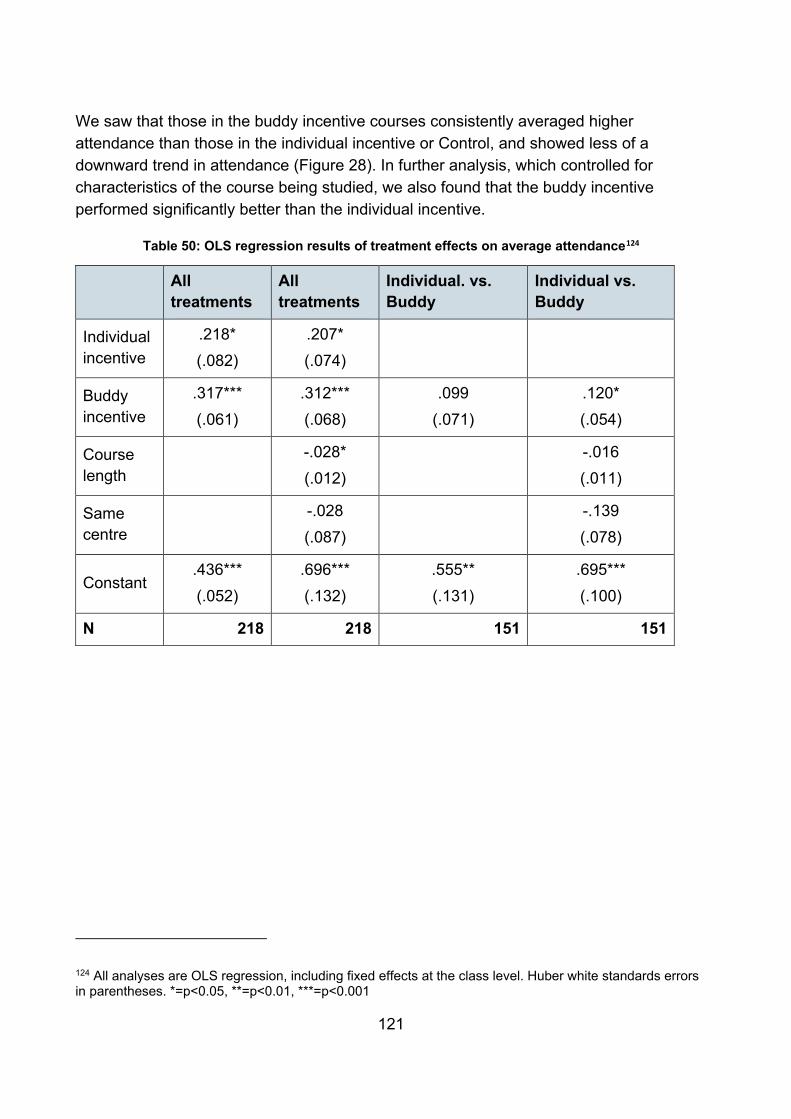
121
We saw that those in the buddy incentive courses consistently averaged higher attendance than those in the individual incentive or Control, and showed less of a downward trend in attendance (Figure 28). In further analysis, which controlled for characteristics of the course being studied, we also found that the buddy incentive performed significantly better than the individual incentive.
Table 50: OLS regression results of treatment effects on average attendance124
All treatments
All treatments
Individual. vs. Buddy
Individual vs. Buddy
Individual incentive
.218* (.082)
.207* (.074)
Buddy incentive
.317*** (.061)
.312*** (.068)
.099 (.071)
.120* (.054)
Course length
-.028* (.012)
-.016 (.011)
Same centre
-.028 (.087)
-.139 (.078)
Constant .436*** (.052)
.696*** (.132)
.555** (.131)
.695*** (.100)
N 218 218 151 151
124 All analyses are OLS regression, including fixed effects at the class level. Huber white standards errors in parentheses. *=p<0.05, **=p<0.01, ***=p<0.001
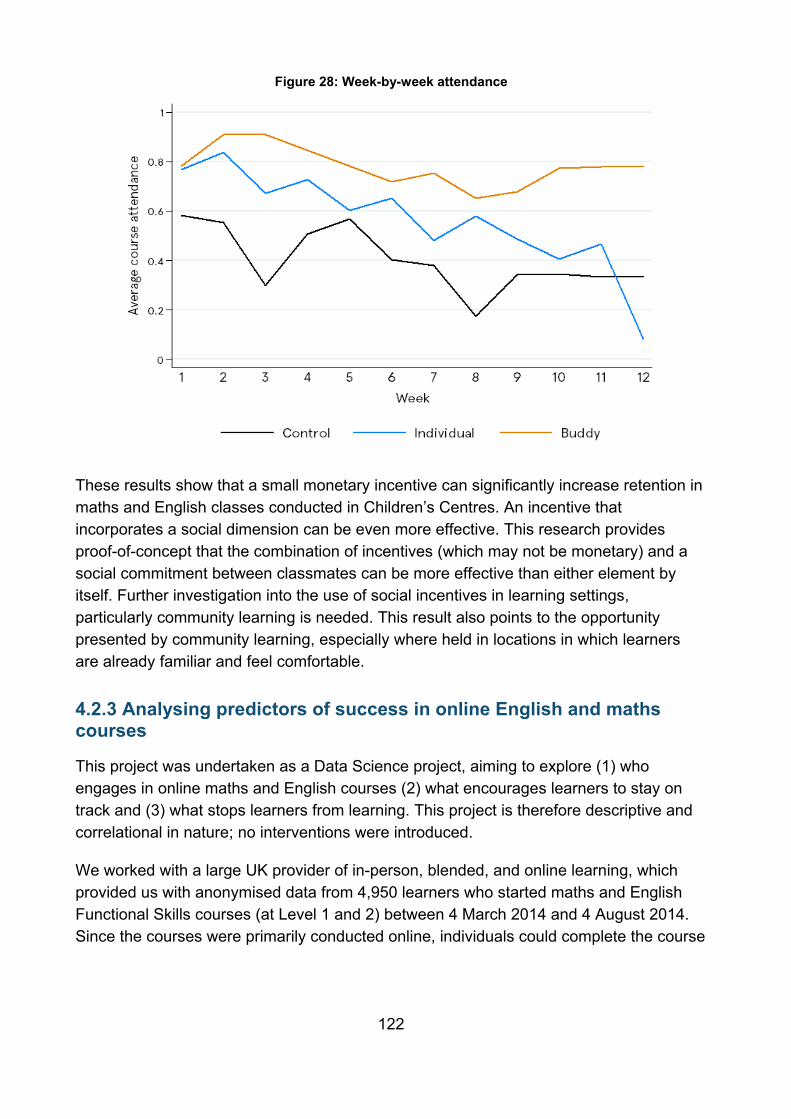
122
Figure 28: Week-by-week attendance
These results show that a small monetary incentive can significantly increase retention in maths and English classes conducted in Children’s Centres. An incentive that incorporates a social dimension can be even more effective. This research provides proof-of-concept that the combination of incentives (which may not be monetary) and a social commitment between classmates can be more effective than either element by itself. Further investigation into the use of social incentives in learning settings, particularly community learning is needed. This result also points to the opportunity presented by community learning, especially where held in locations in which learners are already familiar and feel comfortable.
4.2.3 Analysing predictors of success in online English and maths courses
This project was undertaken as a Data Science project, aiming to explore (1) who engages in online maths and English courses (2) what encourages learners to stay on track and (3) what stops learners from learning. This project is therefore descriptive and correlational in nature; no interventions were introduced.
We worked with a large UK provider of in-person, blended, and online learning, which provided us with anonymised data from 4,950 learners who started maths and English Functional Skills courses (at Level 1 and 2) between 4 March 2014 and 4 August 2014. Since the courses were primarily conducted online, individuals could complete the course
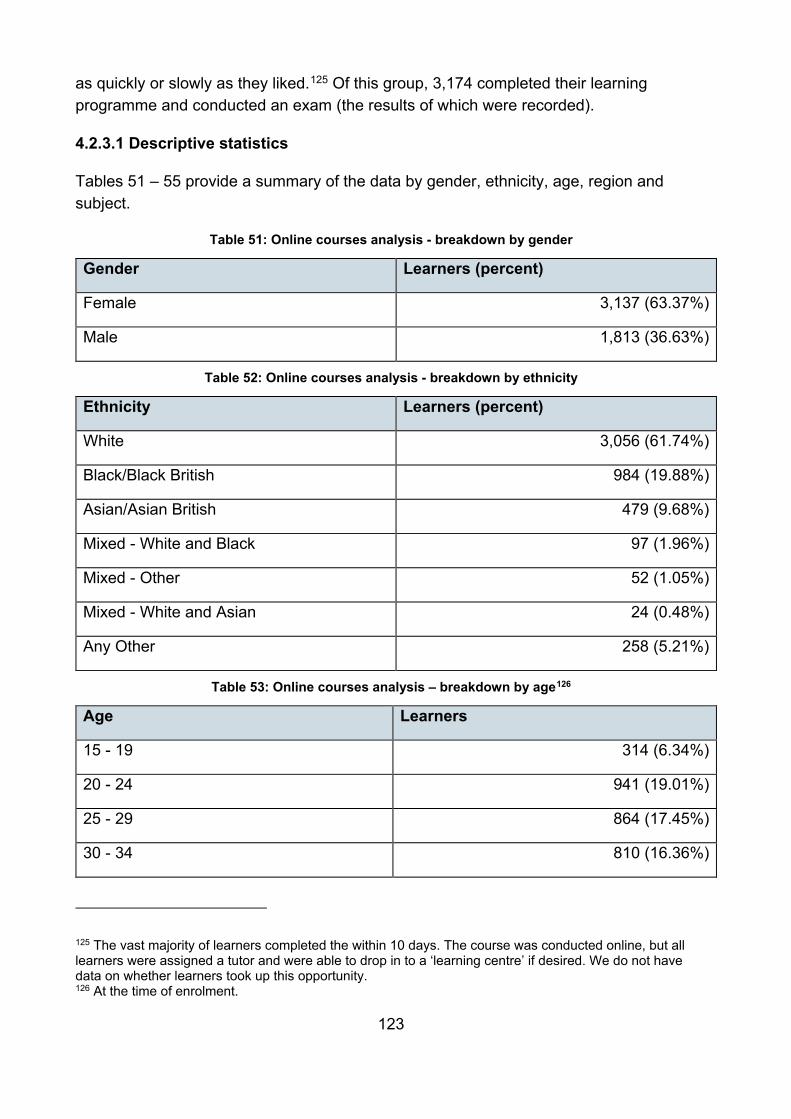
123
as quickly or slowly as they liked.125 Of this group, 3,174 completed their learning programme and conducted an exam (the results of which were recorded).
4.2.3.1 Descriptive statistics
Tables 51 – 55 provide a summary of the data by gender, ethnicity, age, region and subject.
Table 51: Online courses analysis - breakdown by gender
Gender Learners (percent)
Female 3,137 (63.37%)
Male 1,813 (36.63%)
Table 52: Online courses analysis - breakdown by ethnicity
Ethnicity Learners (percent)
White 3,056 (61.74%)
Black/Black British 984 (19.88%)
Asian/Asian British 479 (9.68%)
Mixed - White and Black 97 (1.96%)
Mixed - Other 52 (1.05%)
Mixed - White and Asian 24 (0.48%)
Any Other 258 (5.21%)
Table 53: Online courses analysis – breakdown by age126
Age Learners
15 - 19 314 (6.34%)
20 - 24 941 (19.01%)
25 - 29 864 (17.45%)
30 - 34 810 (16.36%)
125 The vast majority of learners completed the within 10 days. The course was conducted online, but all learners were assigned a tutor and were able to drop in to a ‘learning centre’ if desired. We do not have data on whether learners took up this opportunity. 126 At the time of enrolment.
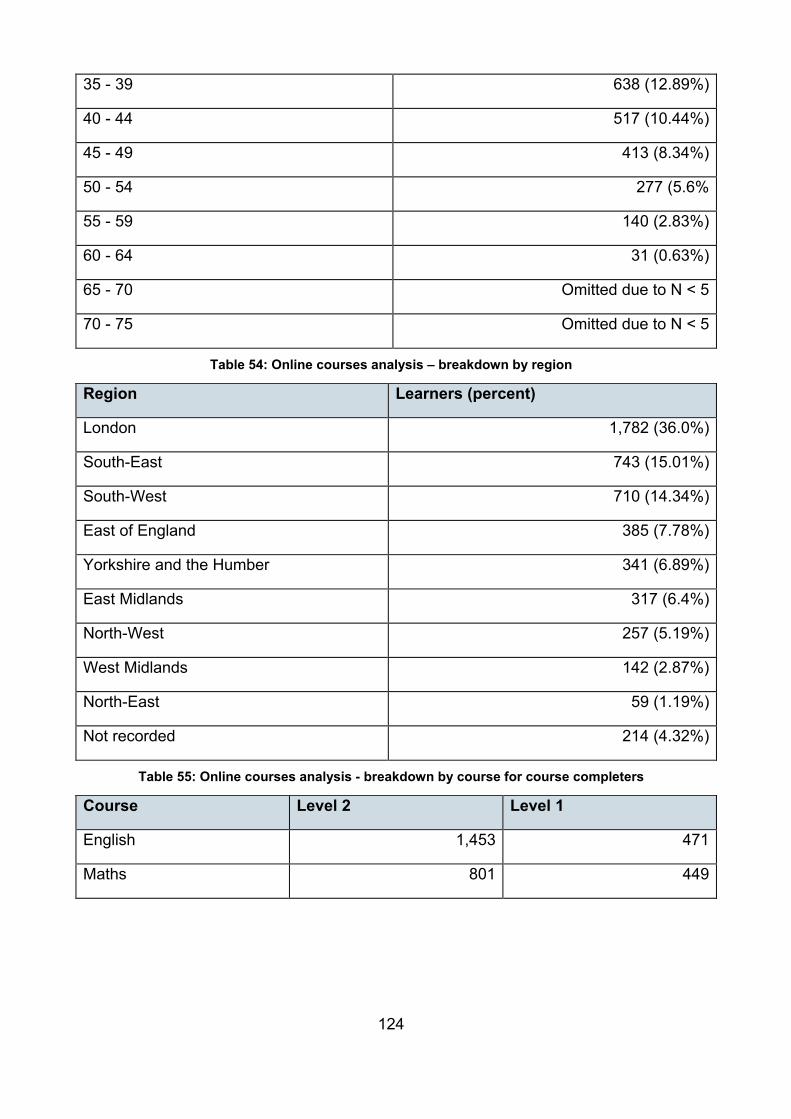
124
35 - 39 638 (12.89%)
40 - 44 517 (10.44%)
45 - 49 413 (8.34%)
50 - 54 277 (5.6%
55 - 59 140 (2.83%)
60 - 64 31 (0.63%)
65 - 70 Omitted due to N < 5
70 - 75 Omitted due to N < 5
Table 54: Online courses analysis – breakdown by region
Region Learners (percent)
London 1,782 (36.0%)
South-East 743 (15.01%)
South-West 710 (14.34%)
East of England 385 (7.78%)
Yorkshire and the Humber 341 (6.89%)
East Midlands 317 (6.4%)
North-West 257 (5.19%)
West Midlands 142 (2.87%)
North-East 59 (1.19%)
Not recorded 214 (4.32%)
Table 55: Online courses analysis - breakdown by course for course completers
Course Level 2 Level 1
English 1,453 471
Maths 801 449
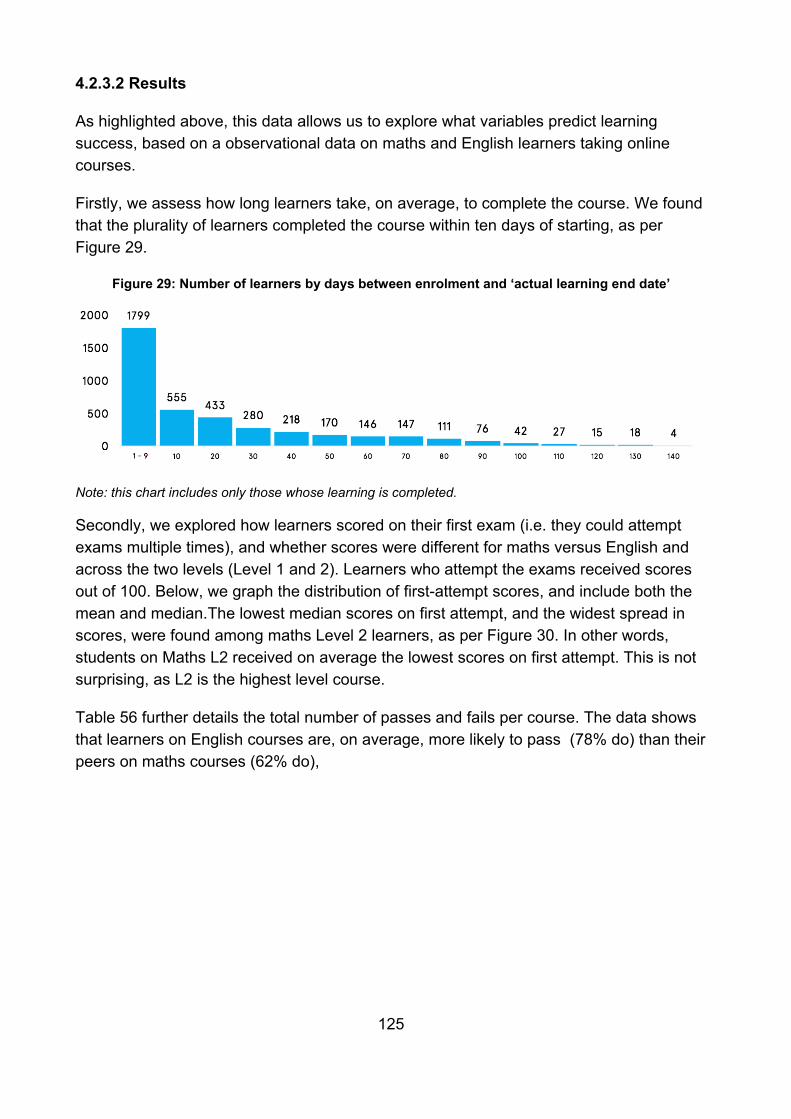
125
4.2.3.2 Results
As highlighted above, this data allows us to explore what variables predict learning success, based on a observational data on maths and English learners taking online courses.
Firstly, we assess how long learners take, on average, to complete the course. We found that the plurality of learners completed the course within ten days of starting, as per Figure 29.
Figure 29: Number of learners by days between enrolment and ‘actual learning end date’
Note: this chart includes only those whose learning is completed.
Secondly, we explored how learners scored on their first exam (i.e. they could attempt exams multiple times), and whether scores were different for maths versus English and across the two levels (Level 1 and 2). Learners who attempt the exams received scores out of 100. Below, we graph the distribution of first-attempt scores, and include both the mean and median.The lowest median scores on first attempt, and the widest spread in scores, were found among maths Level 2 learners, as per Figure 30. In other words, students on Maths L2 received on average the lowest scores on first attempt. This is not surprising, as L2 is the highest level course.
Table 56 further details the total number of passes and fails per course. The data shows that learners on English courses are, on average, more likely to pass (78% do) than their peers on maths courses (62% do),
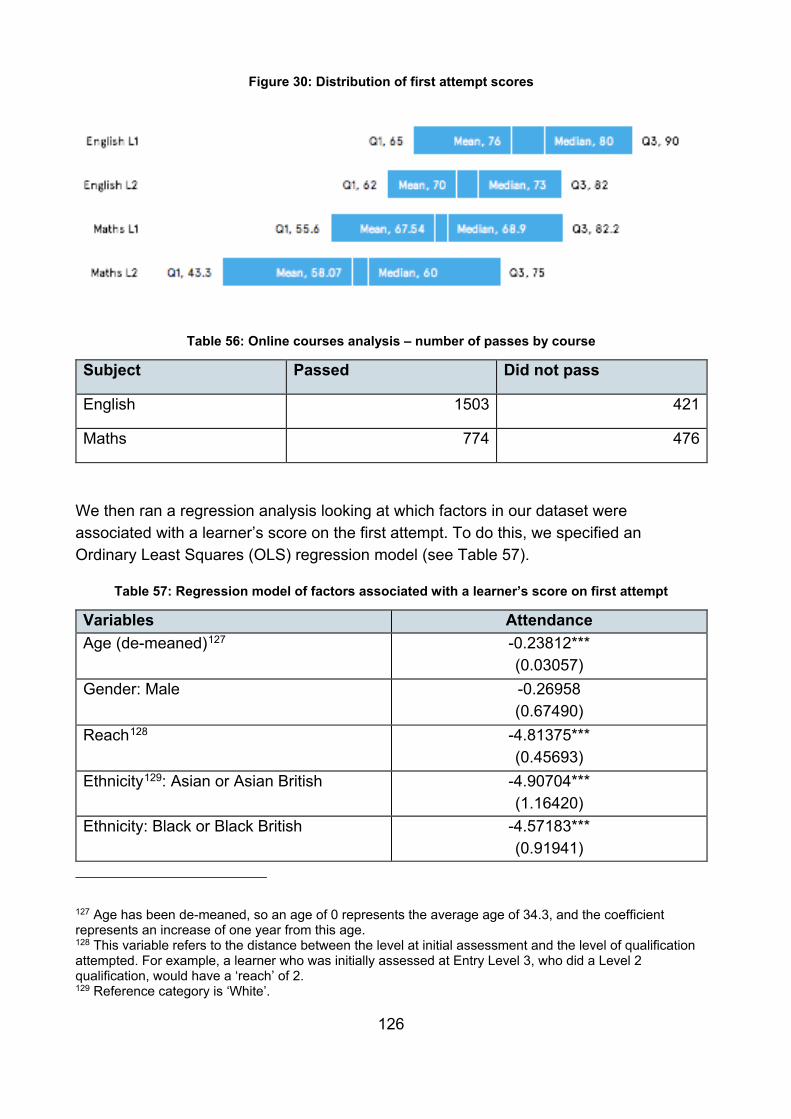
126
Figure 30: Distribution of first attempt scores
Table 56: Online courses analysis – number of passes by course
Subject Passed Did not pass
English 1503 421
Maths 774 476
We then ran a regression analysis looking at which factors in our dataset were associated with a learner’s score on the first attempt. To do this, we specified an Ordinary Least Squares (OLS) regression model (see Table 57).
Table 57: Regression model of factors associated with a learner’s score on first attempt
Variables Attendance Age (de-meaned)127 -0.23812***
(0.03057) Gender: Male -0.26958
(0.67490) Reach128 -4.81375***
(0.45693) Ethnicity129: Asian or Asian British -4.90704***
(1.16420) Ethnicity: Black or Black British -4.57183***
(0.91941)
127 Age has been de-meaned, so an age of 0 represents the average age of 34.3, and the coefficient represents an increase of one year from this age. 128 This variable refers to the distance between the level at initial assessment and the level of qualification attempted. For example, a learner who was initially assessed at Entry Level 3, who did a Level 2 qualification, would have a ‘reach’ of 2. 129 Reference category is ‘White’.
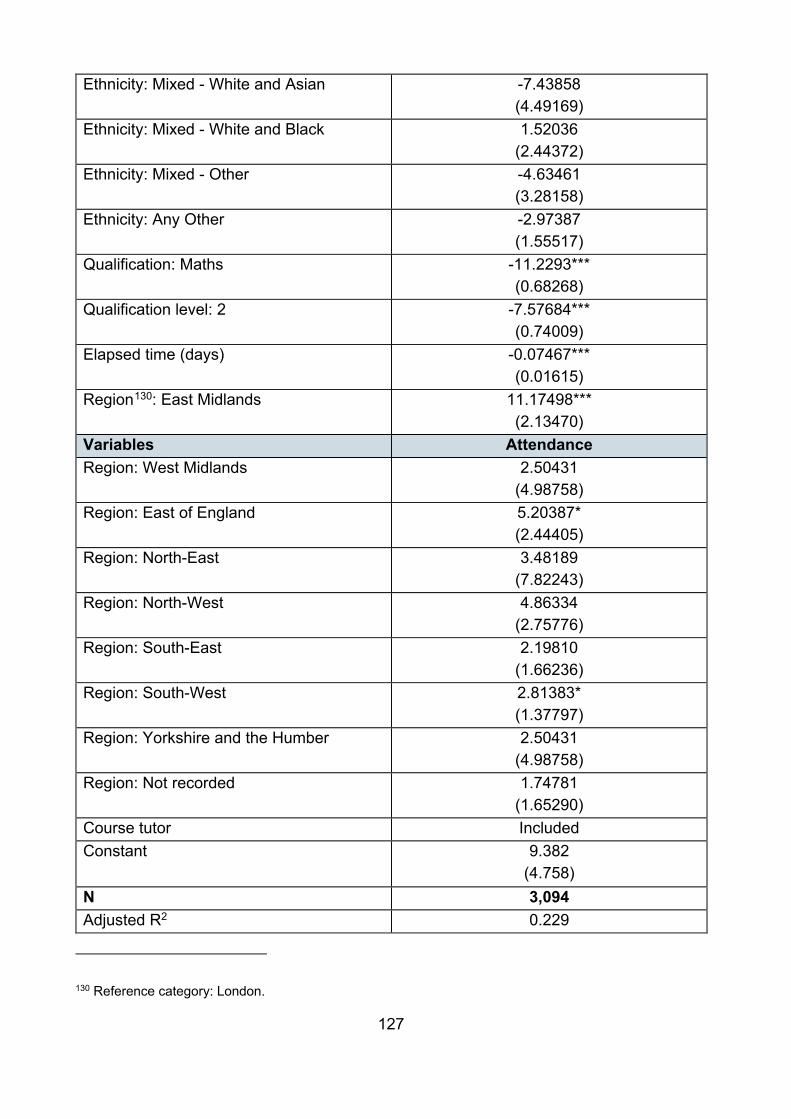
127
Ethnicity: Mixed - White and Asian -7.43858 (4.49169)
Ethnicity: Mixed - White and Black 1.52036 (2.44372)
Ethnicity: Mixed - Other -4.63461 (3.28158)
Ethnicity: Any Other -2.97387 (1.55517)
Qualification: Maths -11.2293*** (0.68268)
Qualification level: 2 -7.57684*** (0.74009)
Elapsed time (days) -0.07467*** (0.01615)
Region130: East Midlands 11.17498*** (2.13470)
Variables Attendance Region: West Midlands 2.50431
(4.98758) Region: East of England 5.20387*
(2.44405) Region: North-East 3.48189
(7.82243) Region: North-West 4.86334
(2.75776) Region: South-East 2.19810
(1.66236) Region: South-West 2.81383*
(1.37797) Region: Yorkshire and the Humber 2.50431
(4.98758) Region: Not recorded 1.74781
(1.65290) Course tutor Included Constant 9.382
(4.758) N 3,094 Adjusted R2 0.229
130 Reference category: London.
128
The results in Table 57 show that:
• Increasing age is associated with lower predicted scores.
• Unsurprisingly, greater “reach” from diagnostic level to level attempted is associated with lower predicted scores .
• We have not seen a significant “gender gap” in predicted scores: male and female learners perform equally well.
• Learners from minority groups perform, on average, less well than white learners. Holding all else constant, Asian/Asian British, Black/Black British and Mixed(White/Asian) learners perform on average less well than White participants.
• Longer elapsed time between learning start and end date is associated with lower predicted score, particularly for maths; however this does not take into account intensity of learning.
We also plotted the predicted effect of a particular tutor on first attempt scores. This analysis reveals that there is a strong correlation between students’ predicted first-attempt exam score and the tutor who taught them. This is consistent with literature in school education, which suggests that teachers explain about 30% of the variance in student performance - the second-biggest influence after idiosyncratic characteristics of the student.131
It’s important to note, however, that it is likely that this finding is partly being driven by other factors not captured by our model, such as unobservable characteristics of learners (such as personality, motivation), contact time with tutor (this data was not available), the amount of self-led study undertaken, or the mode of delivery (students were encouraged to drop in to learning centres, but whether they did is not recorded), the mode of referral (e.g. some tutors focus on Job Centre learners, others on workplace referrals or self-referrals), or local differences (as the data is broken down by large region, which may mask sub-regional variations).
This research yielded a number of key findings:132
• Based on attendance, more women were engaged in learning than men. We found no significant133 difference in women’s and men’s achievement.
131 Hattie, J. (2008). Visible learning: A synthesis of over 800 meta-analyses relating to achievement. Routledge. 132 The courses were primarily delivered online, and the key findings are therefore not easily transferable to other learning settings, such as full-year face-toface courses in Further Education Colleges. 133 For brevity, we will often use the term ‘significant’ instead of the technically correct term ‘statistical significance’. Please note that unless specified, we are only referring to the p-value of the associated coefficient, not not the size of the treatment effect. Therefore in this instance, we found no statistical significant difference between the achievement of men and women.

129
• The plurality of learners finished their course of learning in less than ten days with this provider. Longer learning duration was associated with lower exam scores (but this does not take into account course intensity).
• In our model, who the learner’s tutor is, is associated with some of the largest differences we see in predicted student achievement. However, as noted above, other, non-observed variables might have influenced observations. The regressions in this section are limited by the varuables included; we present associations rather than causations.
130
4.3 Projects that were not taken forward
4.3.1 Boosting maths and English engagement of the homeless: Crisis
4.3.1.1 Background
Crisis is the national charity for homeless people in the UK, offering education, employment, housing and wellbeing support services from their ‘Skylight Centres’ in London and across the country. Crisis offer a wide range of educational services, including numeracy and literacy courses, which play a vital role in helping their members develop the skills they need to secure stable employment and housing in the long run. Crisis observed that many members would often sign up for such courses but then either attend just the first class, or none at all. Crisis approached ASK to see if behavioural interventions could help their members translate their initial motivation into consistent attendance.
4.3.1.2 Theoretical motivation
Even for those with stable housing, sustaining initial motivations to improve skill levels by consistently attending courses can be challenging. Motivation levels can be especially fragile at the start of a course as a learner’s identity and routine is still being established. These challenges are likely amplified for those who are homeless and may face unanticipated obstacles in their daily lives.
ASK and Crisis discussed how behavioural science interventions could overcome these obstacles and support their members to organise and motivate themselves for their first class. The literature on ‘mental contrasting’ and ‘implementation intentions’ proposed interventions which seemed appropriate for the behavioural barriers involved and so we developed an intervention on that basis.134
4.3.1.3 Intervention
ASK and Crisis developed an intervention comprising two text messages sent to their members who had enrolled in a course, before the first class. The first text prompted the Crisis member to plan their journey to their first class. The second text prompted them to reflect on why they signed up for the course in the first place (members had told us their primary motivation in their enrollment forms).
134 Oettingen, G., & Gollwitzer, P. (2010). Strategies of setting and implementing goals: Mental contrasting and implementation intentions (pp. 114-135).
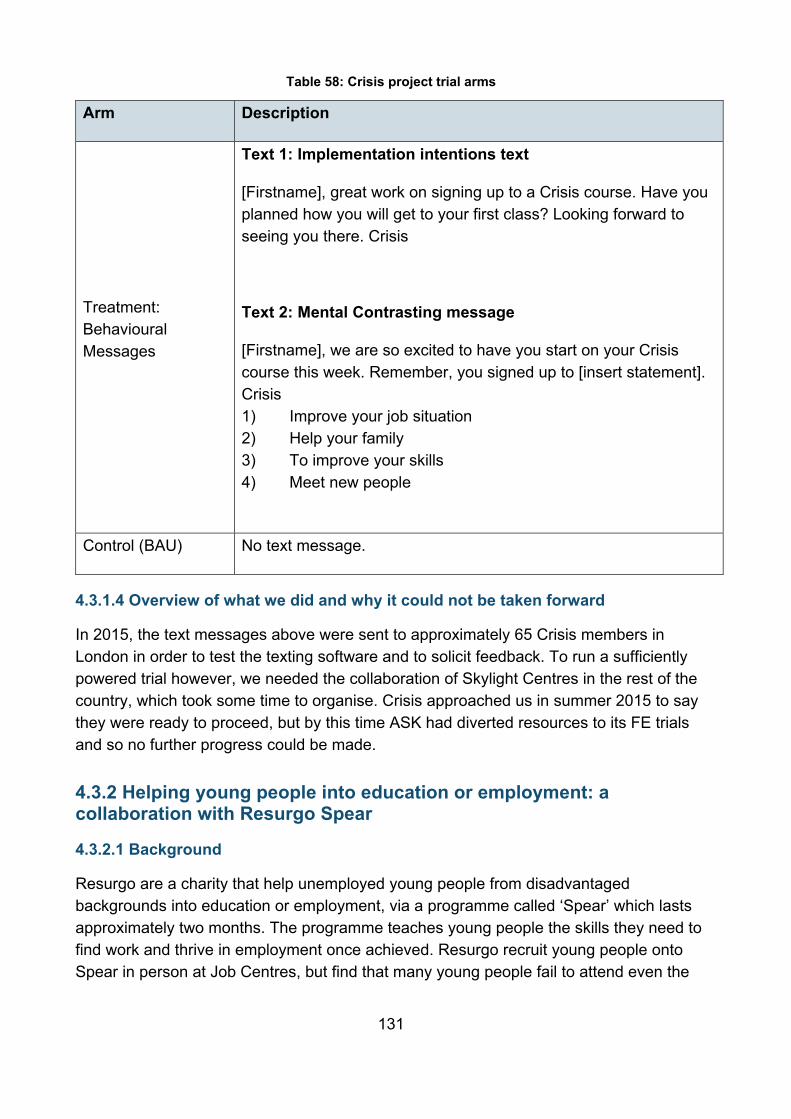
131
Table 58: Crisis project trial arms
Arm Description
Treatment: Behavioural Messages
Text 1: Implementation intentions text
[Firstname], great work on signing up to a Crisis course. Have you planned how you will get to your first class? Looking forward to seeing you there. Crisis
Text 2: Mental Contrasting message
[Firstname], we are so excited to have you start on your Crisis course this week. Remember, you signed up to [insert statement]. Crisis 1) Improve your job situation 2) Help your family 3) To improve your skills 4) Meet new people
Control (BAU) No text message.
4.3.1.4 Overview of what we did and why it could not be taken forward
In 2015, the text messages above were sent to approximately 65 Crisis members in London in order to test the texting software and to solicit feedback. To run a sufficiently powered trial however, we needed the collaboration of Skylight Centres in the rest of the country, which took some time to organise. Crisis approached us in summer 2015 to say they were ready to proceed, but by this time ASK had diverted resources to its FE trials and so no further progress could be made.
4.3.2 Helping young people into education or employment: a collaboration with Resurgo Spear
4.3.2.1 Background
Resurgo are a charity that help unemployed young people from disadvantaged backgrounds into education or employment, via a programme called ‘Spear’ which lasts approximately two months. The programme teaches young people the skills they need to find work and thrive in employment once achieved. Resurgo recruit young people onto Spear in person at Job Centres, but find that many young people fail to attend even the
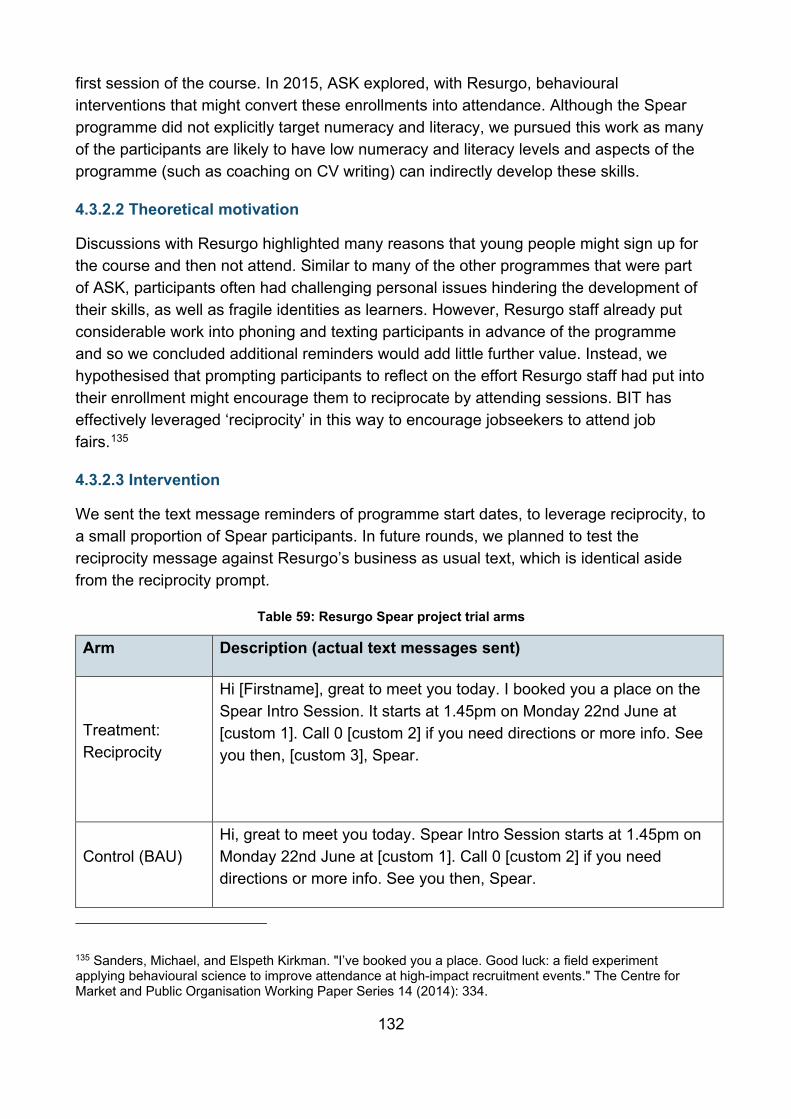
132
first session of the course. In 2015, ASK explored, with Resurgo, behavioural interventions that might convert these enrollments into attendance. Although the Spear programme did not explicitly target numeracy and literacy, we pursued this work as many of the participants are likely to have low numeracy and literacy levels and aspects of the programme (such as coaching on CV writing) can indirectly develop these skills.
4.3.2.2 Theoretical motivation
Discussions with Resurgo highlighted many reasons that young people might sign up for the course and then not attend. Similar to many of the other programmes that were part of ASK, participants often had challenging personal issues hindering the development of their skills, as well as fragile identities as learners. However, Resurgo staff already put considerable work into phoning and texting participants in advance of the programme and so we concluded additional reminders would add little further value. Instead, we hypothesised that prompting participants to reflect on the effort Resurgo staff had put into their enrollment might encourage them to reciprocate by attending sessions. BIT has effectively leveraged ‘reciprocity’ in this way to encourage jobseekers to attend job fairs.135
4.3.2.3 Intervention
We sent the text message reminders of programme start dates, to leverage reciprocity, to a small proportion of Spear participants. In future rounds, we planned to test the reciprocity message against Resurgo’s business as usual text, which is identical aside from the reciprocity prompt.
Table 59: Resurgo Spear project trial arms
Arm Description (actual text messages sent)
Treatment: Reciprocity
Hi [Firstname], great to meet you today. I booked you a place on the Spear Intro Session. It starts at 1.45pm on Monday 22nd June at [custom 1]. Call 0 [custom 2] if you need directions or more info. See you then, [custom 3], Spear.
Control (BAU) Hi, great to meet you today. Spear Intro Session starts at 1.45pm on Monday 22nd June at [custom 1]. Call 0 [custom 2] if you need directions or more info. See you then, Spear.
135 Sanders, Michael, and Elspeth Kirkman. "I’ve booked you a place. Good luck: a field experiment applying behavioural science to improve attendance at high-impact recruitment events." The Centre for Market and Public Organisation Working Paper Series 14 (2014): 334.
133
4.3.2.4 Overview of what we did and why it could not be taken forward
We did not proceed to an RCT because the data matching processes involved were more time consuming than initially forecasted and resources were judged to be more impactful invested in other ASK trials. The intensity of Resurgo’s efforts to convert sign ups into attendance (including personal phone calls) also became clearer during our collaboration and we concluded that modifications to the syntax of our text reminders were unlikely to deliver the effect sizes detectable with our expected sample.
4.3.3 Prince’s Trust
4.2.5.1 Background
The Prince’s Trust is a charity founded by HRH the Prince of Wales to help young people from disadvantaged backgrounds find employment or a place in formal education. The Trust hosts numerous programmes, one of which is called ‘Team’, a 12-week course developing its participants skills via work experience, a community project, practical skills training, numeracy and literacy development and a residential week. In 2015, Prince’s Trust approached ASK to help them improve attendance levels on Team, which tends to drop over the 12 weeks of the programme. The programme is provided in groups of 15 by various providers (including the Fire and Rescue Service, who we worked with in this instance) across the country.
4.2.5.2 Theoretical motivation
Farrington et al (2012) hypothesise that the four beliefs listed below underpin persistence in education.136
• Learning is important
• I can be a successful learner
• Practice is important
• Learning is for people like me
After discussions with the Prince’s Trust, we concluded that an exercise targeting these beliefs, adapted to the context of the Team programme, might plausibly improve attendance.
136 Farrington, Camille A., et al. Teaching Adolescents to Become Learners: The Role of Noncognitive Factors in Shaping School Performance--A Critical Literature Review. Consortium on Chicago School Research. 1313 East 60th Street, Chicago, IL 60637, 2012.
134
4.2.5.3 Intervention
We designed a short exercise to be completed with pen and paper where learners write their reflections on the applicability of those beliefs to them, guided by programme providers. The intervention involved first prompting participants to articulate these beliefs and subsequently by providing resources which programme staff could use to motivate them.
4.2.5.4 Overview of what we did and why it could not be taken forward
We tested the intervention on a small subset of participants, but found that implementation was at best sporadic. The pen and paper format of the intervention meant we had no way to monitor whether the exercise was actually completed and we eventually abandoned the exercise once it became clear that local programme providers were implementing the intervention only sporadically.
4.3 Impact and significance While we were not able to take forward all of the trials we were hoping to in the community learning space, the results from those we were able to run provide evidence of how to encourage those who otherwise might not engage in education to do so. For example the Children’s Centre trials offer a number of useful insights. From the recruitment trial we learnt what is effective in attracting parents back into education. The results showed us while other factors such as supporting your child or being with other parents are no doubt contributing factors, emphasising the ease of signing up is potentially the final bit of encouragement that can lead to enrolment. Likewise we learnt from the retention trial how social support networks can be used in conjunction with financial incentives to help learners persist in their learning. While these findings have direct implications on how we recruit people into education and how we design incentives in education, the lessons are potentially more broadly applicable to areas such as employment support services and health treatment adherence.
Even from the trials that did not go ahead, we were able to discern a number of valuable insights from the initial work undertaken. For example, while we were not able to proceed with the full trial with homelessness charity Crisis we were able to test out the mechanism of texting the homeless or sleeping rough as an avenue for engagement in learning. Similarly, with Resurgo Spear we were able to learn more about current outreach initiatives to encourage young people at-risk of becoming NEET to re-enter education. The same can be said for the initial exploration work with the Prince’s Trust. They helped lay the foundation for more substantial work in the community learning sphere.
135
5. Laboratory and online experiments
5.1 Scoping Laboratory and online experiments provide useful environments for testing behavioural effects and their mechanisms. Labs offer researchers a higher level of control than field experiments, with the ability to screen participants according to eligibility criteria, to implement and monitor experiments with precision and fidelity, and to minimise the impact of undue influences in the environment. Online experiments also allow screening of participants and more precise implement.ation than field experiments, although the researcher has control over fewer undue influences when the participant is doing the experiment remotely than when they are in the lab. However, both lab experiments and online experiments can act as an initial testing point when developing a new intervention, allowing results to be gathered and the experiment to be refined or adjusted. This approach can generate the necessary data to initially understand and validate an intervention before transferring it into the field for further testing.
The pipeline from lab experiment or online experiment to field experiment (and potentially on to larger-scale field trial) is of great interest to both BIT and given this is an area of expertise at LSE, we felt both organisations would profit from a potential collaboration.
BIT worked with Associate Professor Barbara Fasolo, the head of LSE's Behavioural Research Lab, to consider potential avenues of research that could be developed in the lab or online and then transferred an educational setting to be further tested in a field experiment. Given BIT’s existing close connections with FE colleges, we were looking to develop interventions that could be used in college classrooms to improve outcomes for students.
Ultimately, we developed a lab experiment in collaboration with Dr Jeroen Nieboer, looking at task performance following different types of feedback. We wanted to understand whether specific types of feedback improved performance on a task, as this could potentially inform the way students are given feedback on their academic performance in college.
Leading on from this, we worked with Assistant Professor Heather Barry Kappes to run online experiments looking at how implicitly conveyed information about other students’ performance influences task performance, particularly in relation to perceptions of effort. We were interested in the effect of showing participants bad or mediocre quality work from other students, rather than just examples of good work (as teachers would usually show their students to demonstrate how something should be done). Additionally, we examined the effects of presenting the work messily or neatly, with the reasoning that messy work might convey that the student was struggling more than someone who had
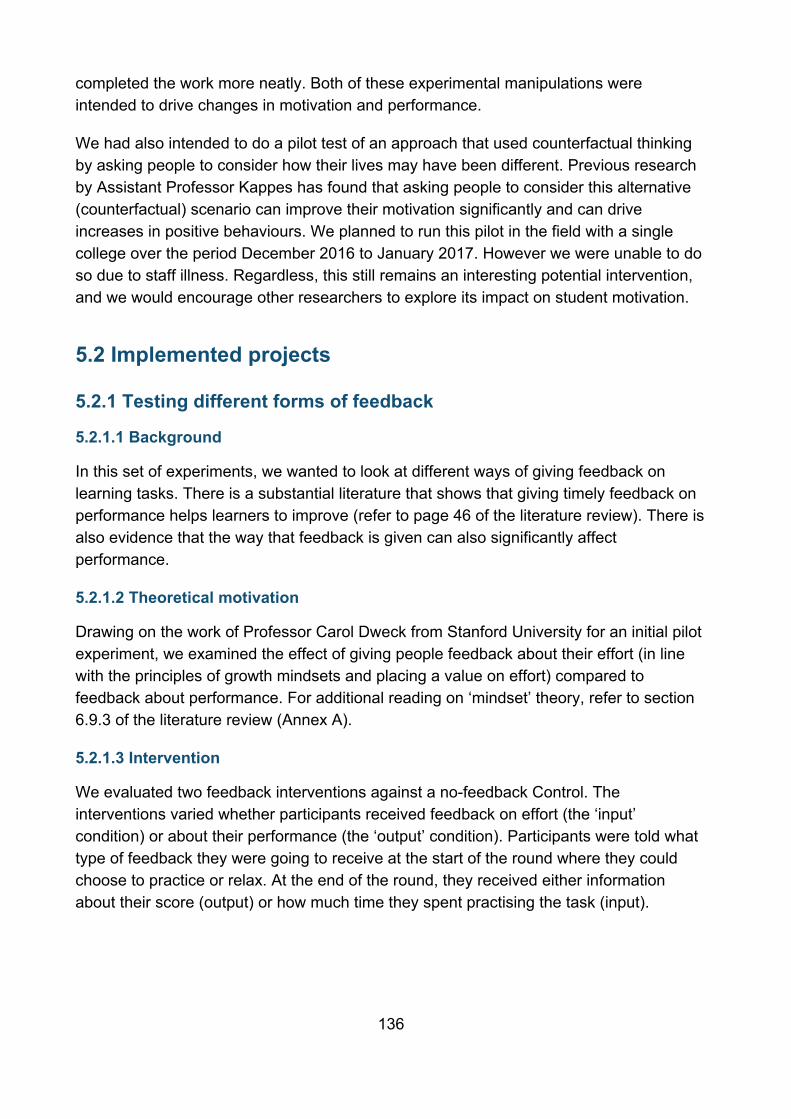
136
completed the work more neatly. Both of these experimental manipulations were intended to drive changes in motivation and performance.
We had also intended to do a pilot test of an approach that used counterfactual thinking by asking people to consider how their lives may have been different. Previous research by Assistant Professor Kappes has found that asking people to consider this alternative (counterfactual) scenario can improve their motivation significantly and can drive increases in positive behaviours. We planned to run this pilot in the field with a single college over the period December 2016 to January 2017. However we were unable to do so due to staff illness. Regardless, this still remains an interesting potential intervention, and we would encourage other researchers to explore its impact on student motivation.
5.2 Implemented projects
5.2.1 Testing different forms of feedback
5.2.1.1 Background
In this set of experiments, we wanted to look at different ways of giving feedback on learning tasks. There is a substantial literature that shows that giving timely feedback on performance helps learners to improve (refer to page 46 of the literature review). There is also evidence that the way that feedback is given can also significantly affect performance.
5.2.1.2 Theoretical motivation
Drawing on the work of Professor Carol Dweck from Stanford University for an initial pilot experiment, we examined the effect of giving people feedback about their effort (in line with the principles of growth mindsets and placing a value on effort) compared to feedback about performance. For additional reading on ‘mindset’ theory, refer to section 6.9.3 of the literature review (Annex A).
5.2.1.3 Intervention
We evaluated two feedback interventions against a no-feedback Control. The interventions varied whether participants received feedback on effort (the ‘input’ condition) or about their performance (the ‘output’ condition). Participants were told what type of feedback they were going to receive at the start of the round where they could choose to practice or relax. At the end of the round, they received either information about their score (output) or how much time they spent practising the task (input).
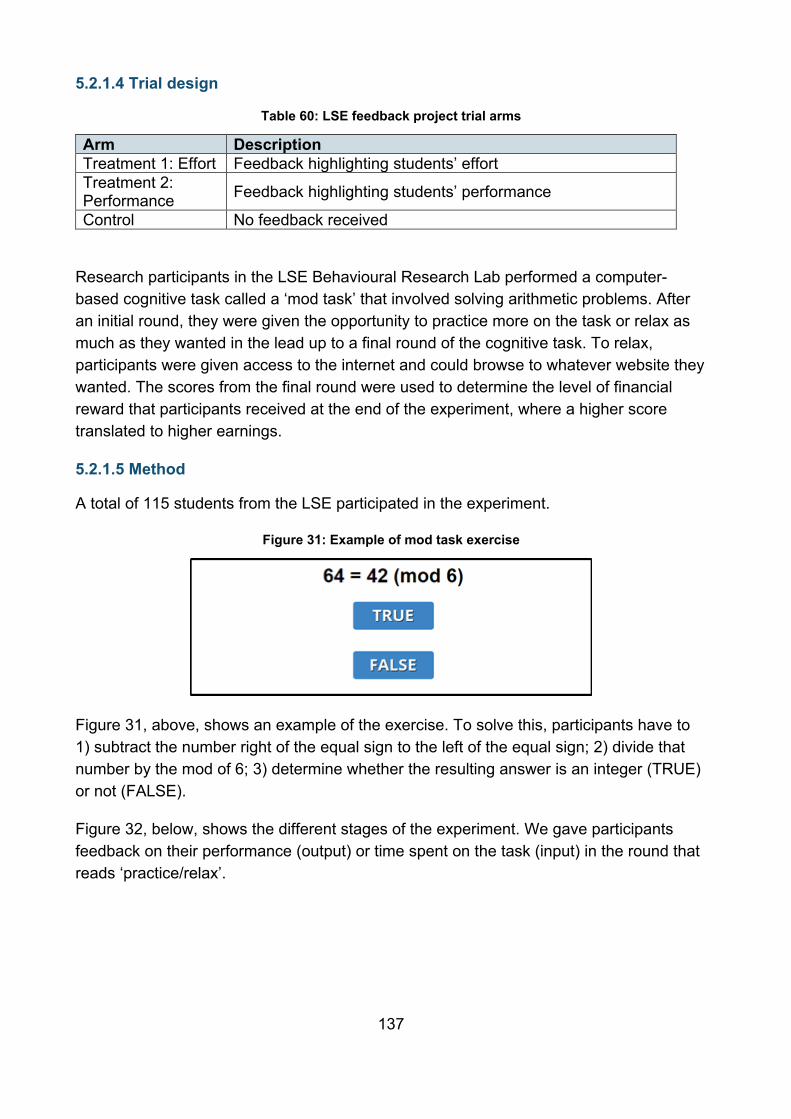
137
5.2.1.4 Trial design
Table 60: LSE feedback project trial arms
Arm Description Treatment 1: Effort Feedback highlighting students’ effort Treatment 2: Performance Feedback highlighting students’ performance
Control No feedback received
Research participants in the LSE Behavioural Research Lab performed a computer-based cognitive task called a ‘mod task’ that involved solving arithmetic problems. After an initial round, they were given the opportunity to practice more on the task or relax as much as they wanted in the lead up to a final round of the cognitive task. To relax, participants were given access to the internet and could browse to whatever website they wanted. The scores from the final round were used to determine the level of financial reward that participants received at the end of the experiment, where a higher score translated to higher earnings.
5.2.1.5 Method
A total of 115 students from the LSE participated in the experiment.
Figure 31: Example of mod task exercise
Figure 31, above, shows an example of the exercise. To solve this, participants have to 1) subtract the number right of the equal sign to the left of the equal sign; 2) divide that number by the mod of 6; 3) determine whether the resulting answer is an integer (TRUE) or not (FALSE).
Figure 32, below, shows the different stages of the experiment. We gave participants feedback on their performance (output) or time spent on the task (input) in the round that reads ‘practice/relax’.
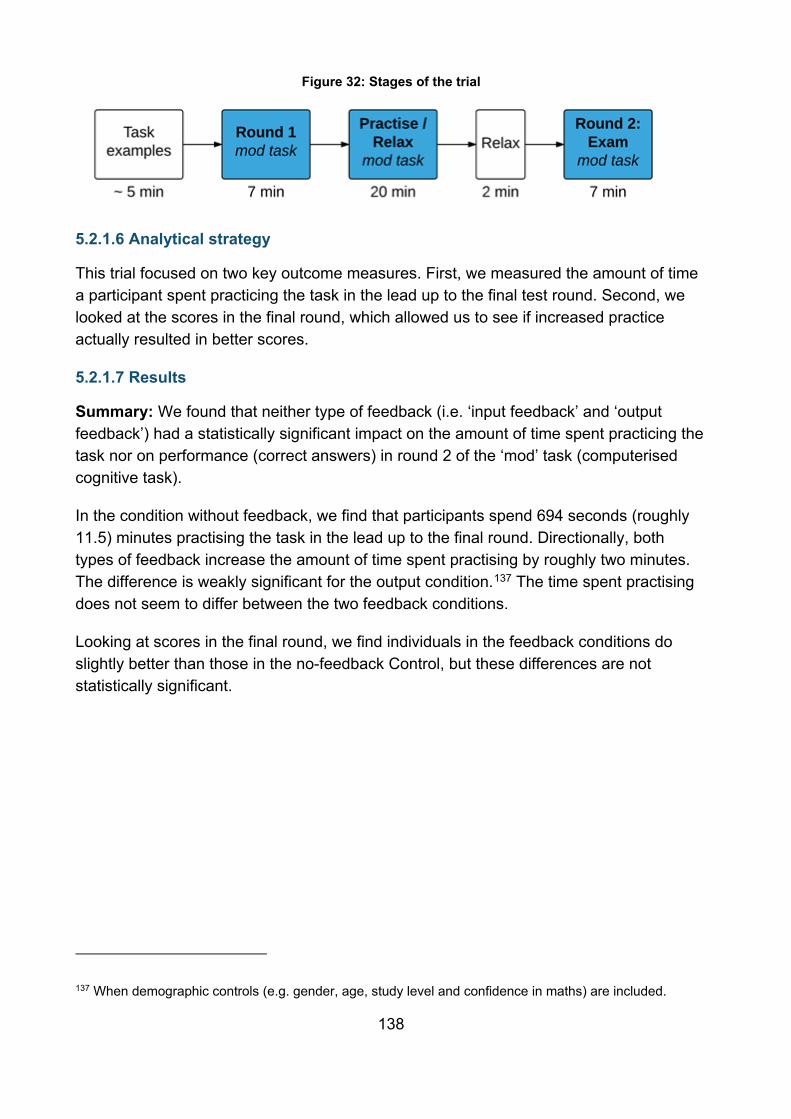
138
Figure 32: Stages of the trial
5.2.1.6 Analytical strategy
This trial focused on two key outcome measures. First, we measured the amount of time a participant spent practicing the task in the lead up to the final test round. Second, we looked at the scores in the final round, which allowed us to see if increased practice actually resulted in better scores.
5.2.1.7 Results
Summary: We found that neither type of feedback (i.e. ‘input feedback’ and ‘output feedback’) had a statistically significant impact on the amount of time spent practicing the task nor on performance (correct answers) in round 2 of the ‘mod’ task (computerised cognitive task).
In the condition without feedback, we find that participants spend 694 seconds (roughly 11.5) minutes practising the task in the lead up to the final round. Directionally, both types of feedback increase the amount of time spent practising by roughly two minutes. The difference is weakly significant for the output condition.137 The time spent practising does not seem to differ between the two feedback conditions.
Looking at scores in the final round, we find individuals in the feedback conditions do slightly better than those in the no-feedback Control, but these differences are not statistically significant.
137 When demographic controls (e.g. gender, age, study level and confidence in maths) are included.
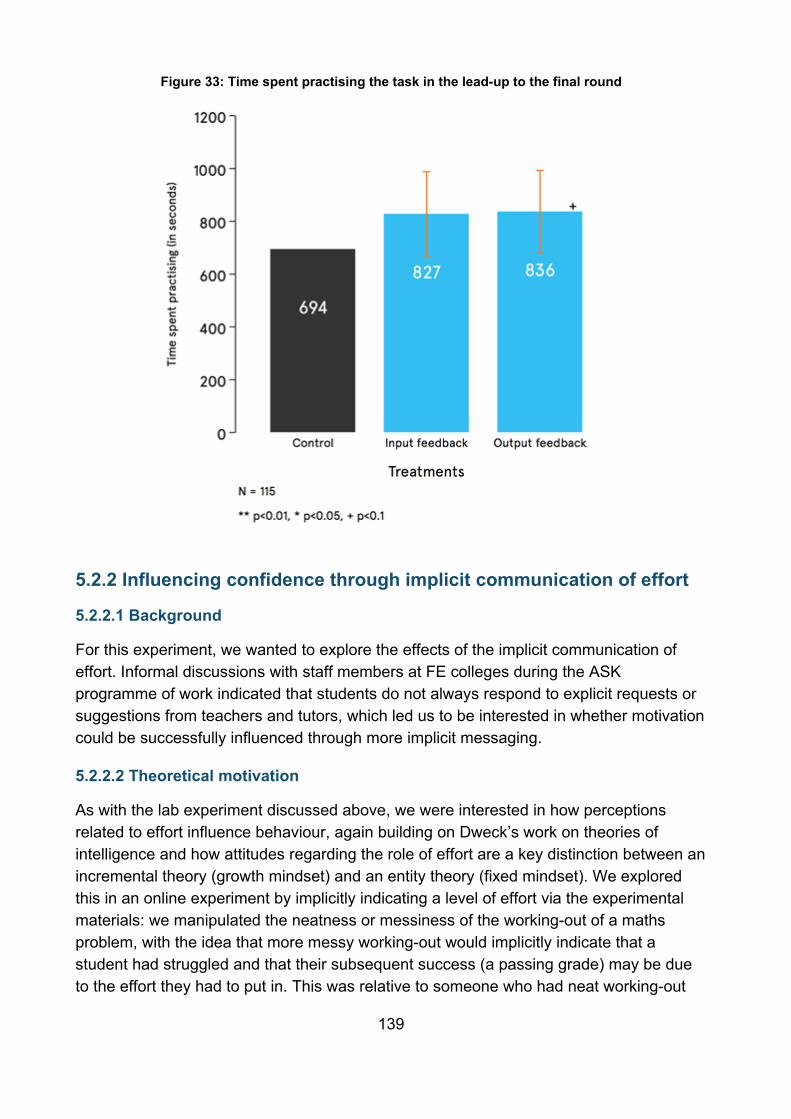
139
Figure 33: Time spent practising the task in the lead-up to the final round
5.2.2 Influencing confidence through implicit communication of effort
5.2.2.1 Background
For this experiment, we wanted to explore the effects of the implicit communication of effort. Informal discussions with staff members at FE colleges during the ASK programme of work indicated that students do not always respond to explicit requests or suggestions from teachers and tutors, which led us to be interested in whether motivation could be successfully influenced through more implicit messaging.
5.2.2.2 Theoretical motivation
As with the lab experiment discussed above, we were interested in how perceptions related to effort influence behaviour, again building on Dweck’s work on theories of intelligence and how attitudes regarding the role of effort are a key distinction between an incremental theory (growth mindset) and an entity theory (fixed mindset). We explored this in an online experiment by implicitly indicating a level of effort via the experimental materials: we manipulated the neatness or messiness of the working-out of a maths problem, with the idea that more messy working-out would implicitly indicate that a student had struggled and that their subsequent success (a passing grade) may be due to the effort they had to put in. This was relative to someone who had neat working-out
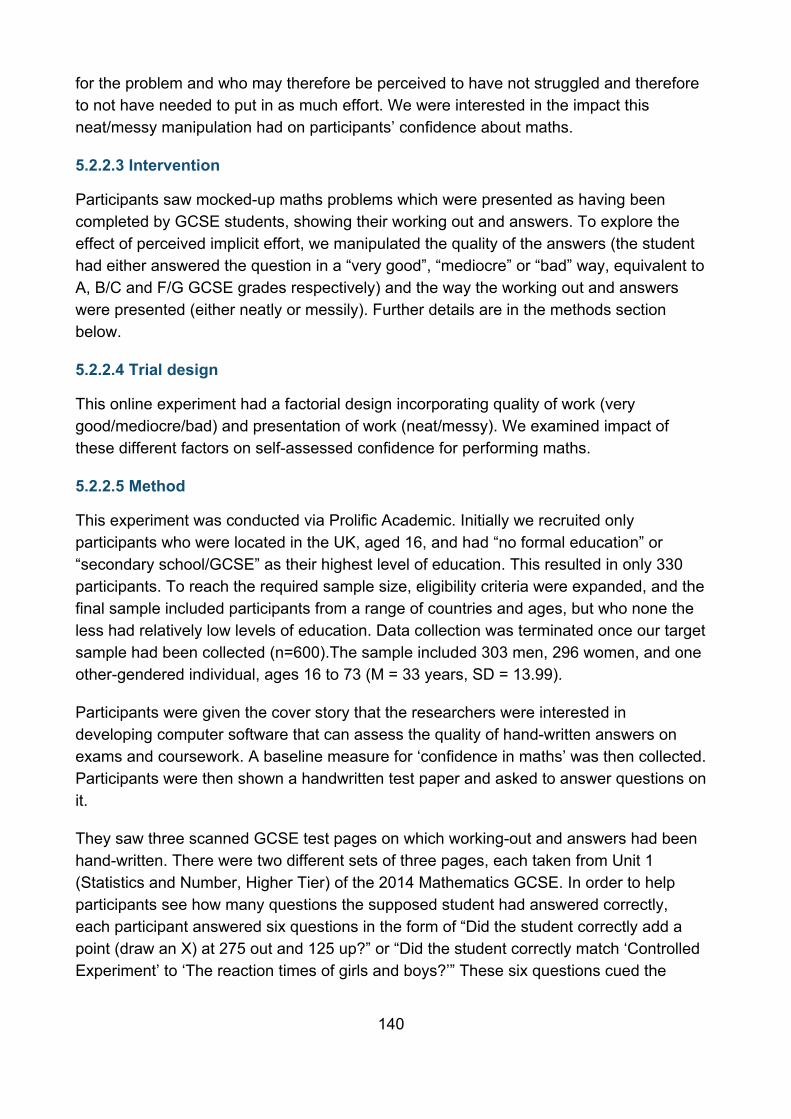
140
for the problem and who may therefore be perceived to have not struggled and therefore to not have needed to put in as much effort. We were interested in the impact this neat/messy manipulation had on participants’ confidence about maths.
5.2.2.3 Intervention
Participants saw mocked-up maths problems which were presented as having been completed by GCSE students, showing their working out and answers. To explore the effect of perceived implicit effort, we manipulated the quality of the answers (the student had either answered the question in a “very good”, “mediocre” or “bad” way, equivalent to A, B/C and F/G GCSE grades respectively) and the way the working out and answers were presented (either neatly or messily). Further details are in the methods section below.
5.2.2.4 Trial design
This online experiment had a factorial design incorporating quality of work (very good/mediocre/bad) and presentation of work (neat/messy). We examined impact of these different factors on self-assessed confidence for performing maths.
5.2.2.5 Method
This experiment was conducted via Prolific Academic. Initially we recruited only participants who were located in the UK, aged 16, and had “no formal education” or “secondary school/GCSE” as their highest level of education. This resulted in only 330 participants. To reach the required sample size, eligibility criteria were expanded, and the final sample included participants from a range of countries and ages, but who none the less had relatively low levels of education. Data collection was terminated once our target sample had been collected (n=600).The sample included 303 men, 296 women, and one other-gendered individual, ages 16 to 73 (M = 33 years, SD = 13.99).
Participants were given the cover story that the researchers were interested in developing computer software that can assess the quality of hand-written answers on exams and coursework. A baseline measure for ‘confidence in maths’ was then collected. Participants were then shown a handwritten test paper and asked to answer questions on it.
They saw three scanned GCSE test pages on which working-out and answers had been hand-written. There were two different sets of three pages, each taken from Unit 1 (Statistics and Number, Higher Tier) of the 2014 Mathematics GCSE. In order to help participants see how many questions the supposed student had answered correctly, each participant answered six questions in the form of “Did the student correctly add a point (draw an X) at 275 out and 125 up?” or “Did the student correctly match ‘Controlled Experiment’ to ‘The reaction times of girls and boys?’” These six questions cued the
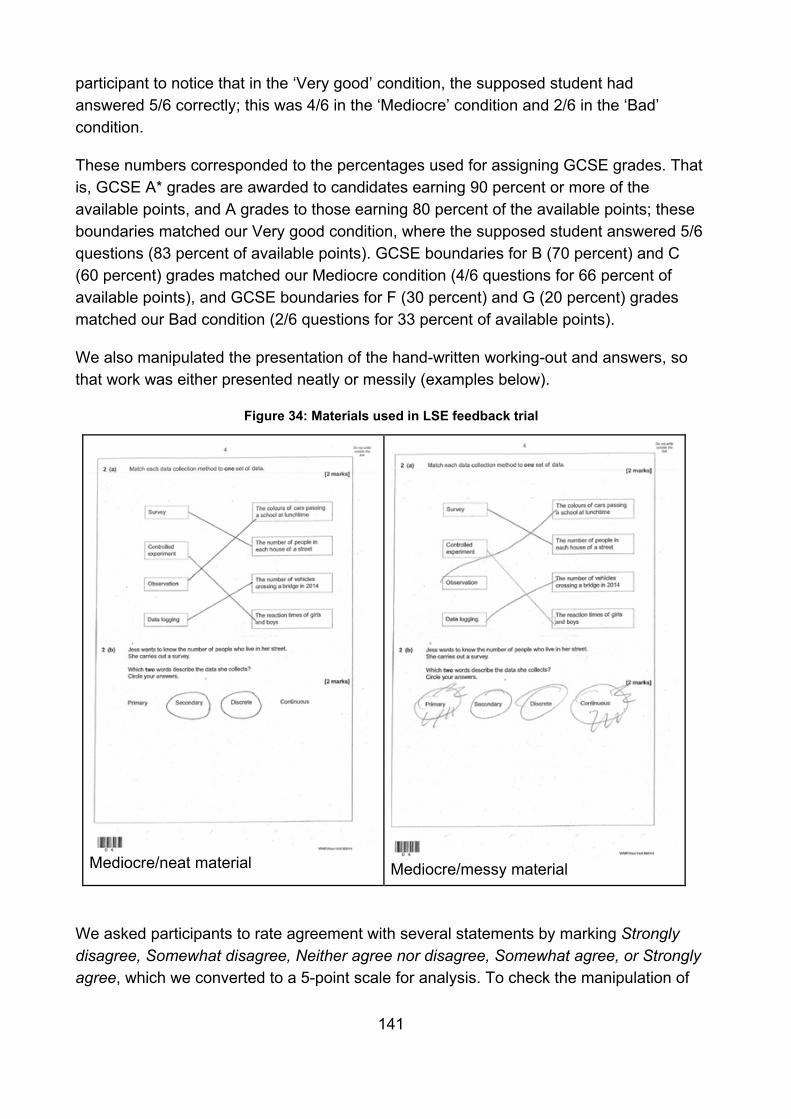
141
participant to notice that in the ‘Very good’ condition, the supposed student had answered 5/6 correctly; this was 4/6 in the ‘Mediocre’ condition and 2/6 in the ‘Bad’ condition.
These numbers corresponded to the percentages used for assigning GCSE grades. That is, GCSE A* grades are awarded to candidates earning 90 percent or more of the available points, and A grades to those earning 80 percent of the available points; these boundaries matched our Very good condition, where the supposed student answered 5/6 questions (83 percent of available points). GCSE boundaries for B (70 percent) and C (60 percent) grades matched our Mediocre condition (4/6 questions for 66 percent of available points), and GCSE boundaries for F (30 percent) and G (20 percent) grades matched our Bad condition (2/6 questions for 33 percent of available points).
We also manipulated the presentation of the hand-written working-out and answers, so that work was either presented neatly or messily (examples below).
Figure 34: Materials used in LSE feedback trial
Mediocre/neat material
Mediocre/messy material
We asked participants to rate agreement with several statements by marking Strongly disagree, Somewhat disagree, Neither agree nor disagree, Somewhat agree, or Strongly agree, which we converted to a 5-point scale for analysis. To check the manipulation of
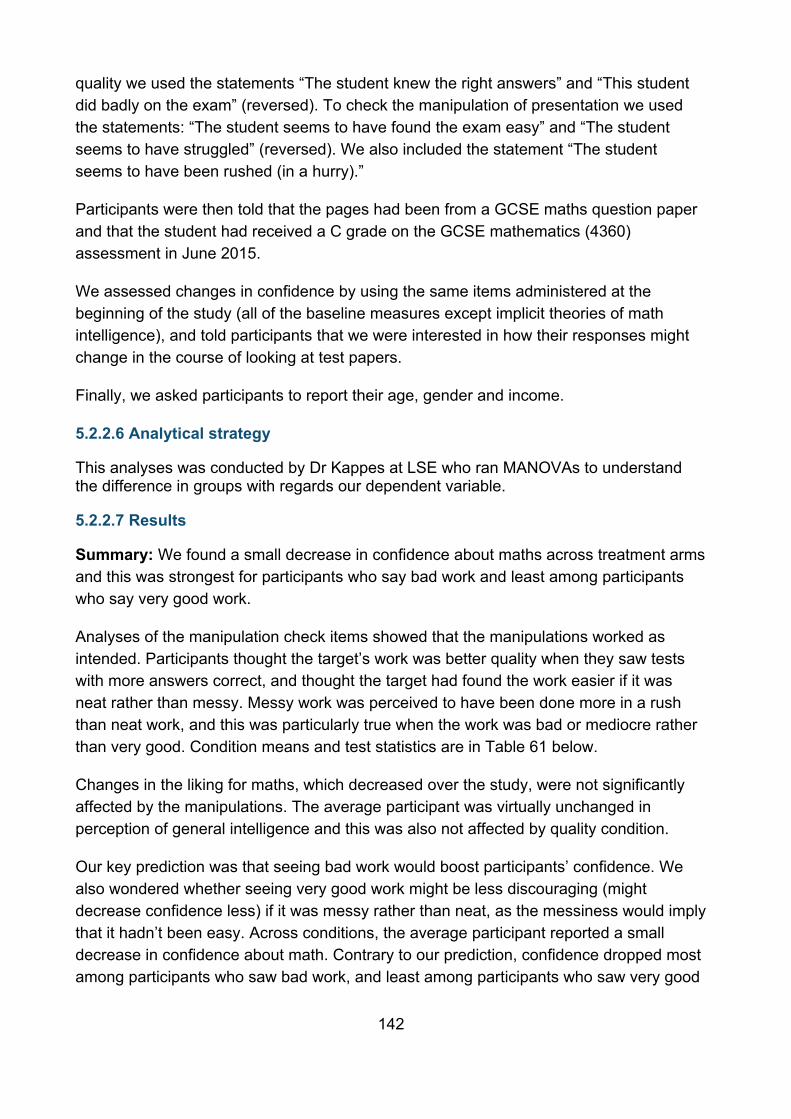
142
quality we used the statements “The student knew the right answers” and “This student did badly on the exam” (reversed). To check the manipulation of presentation we used the statements: “The student seems to have found the exam easy” and “The student seems to have struggled” (reversed). We also included the statement “The student seems to have been rushed (in a hurry).”
Participants were then told that the pages had been from a GCSE maths question paper and that the student had received a C grade on the GCSE mathematics (4360) assessment in June 2015.
We assessed changes in confidence by using the same items administered at the beginning of the study (all of the baseline measures except implicit theories of math intelligence), and told participants that we were interested in how their responses might change in the course of looking at test papers.
Finally, we asked participants to report their age, gender and income.
5.2.2.6 Analytical strategy
This analyses was conducted by Dr Kappes at LSE who ran MANOVAs to understand the difference in groups with regards our dependent variable.
5.2.2.7 Results
Summary: We found a small decrease in confidence about maths across treatment arms and this was strongest for participants who say bad work and least among participants who say very good work.
Analyses of the manipulation check items showed that the manipulations worked as intended. Participants thought the target’s work was better quality when they saw tests with more answers correct, and thought the target had found the work easier if it was neat rather than messy. Messy work was perceived to have been done more in a rush than neat work, and this was particularly true when the work was bad or mediocre rather than very good. Condition means and test statistics are in Table 61 below.
Changes in the liking for maths, which decreased over the study, were not significantly affected by the manipulations. The average participant was virtually unchanged in perception of general intelligence and this was also not affected by quality condition.
Our key prediction was that seeing bad work would boost participants’ confidence. We also wondered whether seeing very good work might be less discouraging (might decrease confidence less) if it was messy rather than neat, as the messiness would imply that it hadn’t been easy. Across conditions, the average participant reported a small decrease in confidence about math. Contrary to our prediction, confidence dropped most among participants who saw bad work, and least among participants who saw very good
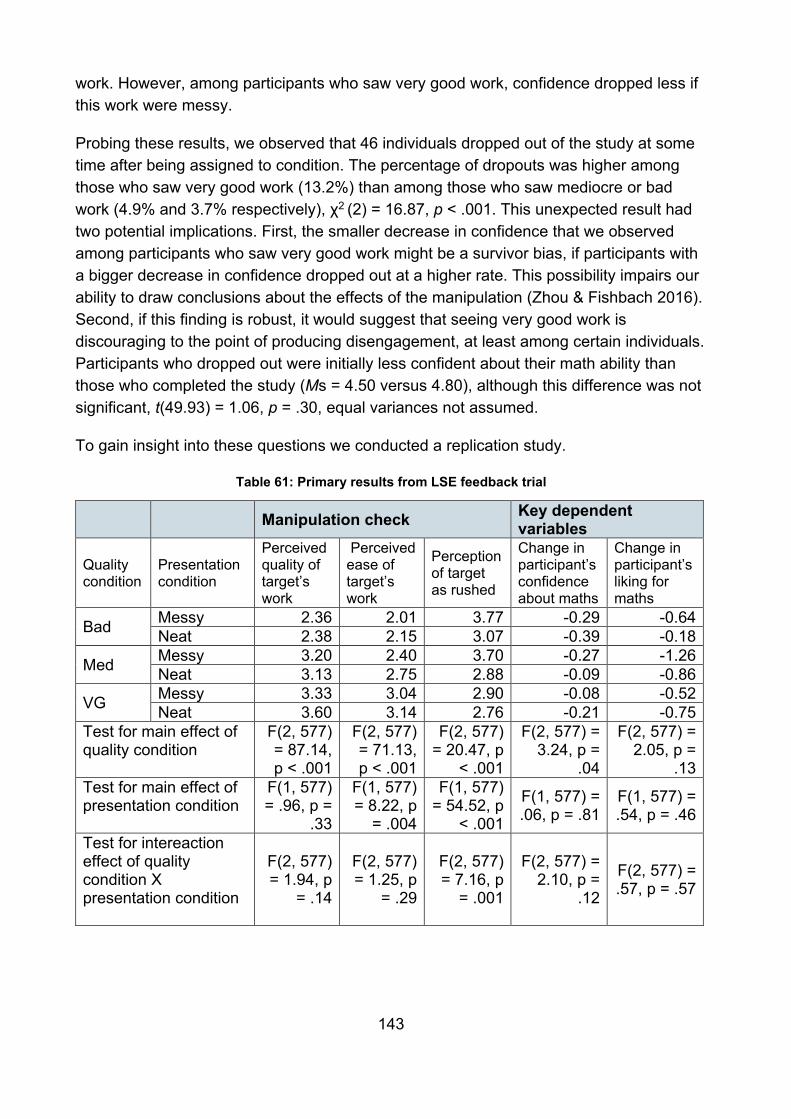
143
work. However, among participants who saw very good work, confidence dropped less if this work were messy.
Probing these results, we observed that 46 individuals dropped out of the study at some time after being assigned to condition. The percentage of dropouts was higher among those who saw very good work (13.2%) than among those who saw mediocre or bad work (4.9% and 3.7% respectively), χ2 (2) = 16.87, p < .001. This unexpected result had two potential implications. First, the smaller decrease in confidence that we observed among participants who saw very good work might be a survivor bias, if participants with a bigger decrease in confidence dropped out at a higher rate. This possibility impairs our ability to draw conclusions about the effects of the manipulation (Zhou & Fishbach 2016). Second, if this finding is robust, it would suggest that seeing very good work is discouraging to the point of producing disengagement, at least among certain individuals. Participants who dropped out were initially less confident about their math ability than those who completed the study (Ms = 4.50 versus 4.80), although this difference was not significant, t(49.93) = 1.06, p = .30, equal variances not assumed.
To gain insight into these questions we conducted a replication study.
Table 61: Primary results from LSE feedback trial
Manipulation check Key dependent variables
Quality condition
Presentation condition
Perceived quality of target’s work
Perceived ease of target’s work
Perception of target as rushed
Change in participant’s confidence about maths
Change in participant’s liking for maths
Bad Messy 2.36 2.01 3.77 -0.29 -0.64 Neat 2.38 2.15 3.07 -0.39 -0.18
Med Messy 3.20 2.40 3.70 -0.27 -1.26 Neat 3.13 2.75 2.88 -0.09 -0.86
VG Messy 3.33 3.04 2.90 -0.08 -0.52 Neat 3.60 3.14 2.76 -0.21 -0.75
Test for main effect of quality condition
F(2, 577) = 87.14, p < .001
F(2, 577) = 71.13, p < .001
F(2, 577) = 20.47, p
< .001
F(2, 577) = 3.24, p =
.04
F(2, 577) = 2.05, p =
.13 Test for main effect of presentation condition
F(1, 577) = .96, p =
.33
F(1, 577) = 8.22, p
= .004
F(1, 577) = 54.52, p
< .001
F(1, 577) = .06, p = .81
F(1, 577) = .54, p = .46
Test for intereaction effect of quality condition X presentation condition
F(2, 577) = 1.94, p
= .14
F(2, 577) = 1.25, p
= .29
F(2, 577) = 7.16, p
= .001
F(2, 577) = 2.10, p =
.12
F(2, 577) = .57, p = .57
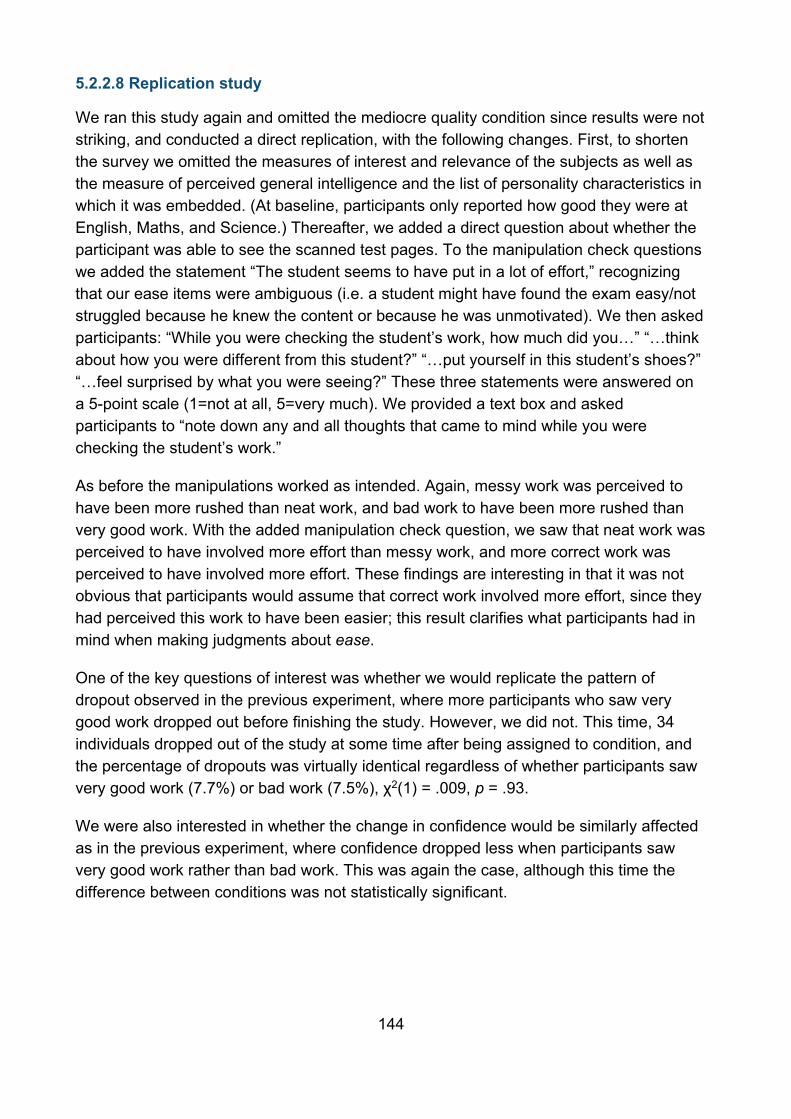
144
5.2.2.8 Replication study
We ran this study again and omitted the mediocre quality condition since results were not striking, and conducted a direct replication, with the following changes. First, to shorten the survey we omitted the measures of interest and relevance of the subjects as well as the measure of perceived general intelligence and the list of personality characteristics in which it was embedded. (At baseline, participants only reported how good they were at English, Maths, and Science.) Thereafter, we added a direct question about whether the participant was able to see the scanned test pages. To the manipulation check questions we added the statement “The student seems to have put in a lot of effort,” recognizing that our ease items were ambiguous (i.e. a student might have found the exam easy/not struggled because he knew the content or because he was unmotivated). We then asked participants: “While you were checking the student’s work, how much did you…” “…think about how you were different from this student?” “…put yourself in this student’s shoes?” “…feel surprised by what you were seeing?” These three statements were answered on a 5-point scale (1=not at all, 5=very much). We provided a text box and asked participants to “note down any and all thoughts that came to mind while you were checking the student’s work.”
As before the manipulations worked as intended. Again, messy work was perceived to have been more rushed than neat work, and bad work to have been more rushed than very good work. With the added manipulation check question, we saw that neat work was perceived to have involved more effort than messy work, and more correct work was perceived to have involved more effort. These findings are interesting in that it was not obvious that participants would assume that correct work involved more effort, since they had perceived this work to have been easier; this result clarifies what participants had in mind when making judgments about ease.
One of the key questions of interest was whether we would replicate the pattern of dropout observed in the previous experiment, where more participants who saw very good work dropped out before finishing the study. However, we did not. This time, 34 individuals dropped out of the study at some time after being assigned to condition, and the percentage of dropouts was virtually identical regardless of whether participants saw very good work (7.7%) or bad work (7.5%), χ2(1) = .009, p = .93.
We were also interested in whether the change in confidence would be similarly affected as in the previous experiment, where confidence dropped less when participants saw very good work rather than bad work. This was again the case, although this time the difference between conditions was not statistically significant.
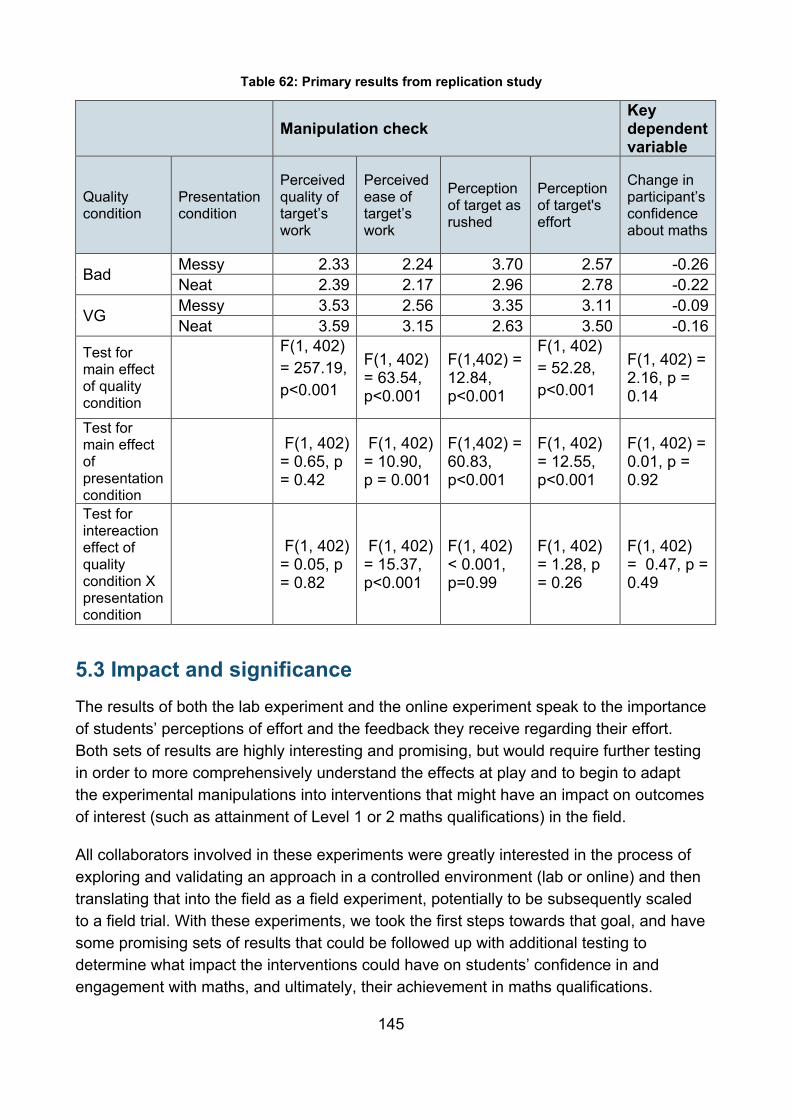
145
Table 62: Primary results from replication study
Manipulation check
Key dependent variable
Quality condition
Presentation condition
Perceived quality of target’s work
Perceived ease of target’s work
Perception of target as rushed
Perception of target's effort
Change in participant’s confidence about maths
Bad Messy 2.33 2.24 3.70 2.57 -0.26 Neat 2.39 2.17 2.96 2.78 -0.22
VG Messy 3.53 2.56 3.35 3.11 -0.09 Neat 3.59 3.15 2.63 3.50 -0.16
Test for main effect of quality condition
F(1, 402) = 257.19, p<0.001
F(1, 402) = 63.54, p<0.001
F(1,402) = 12.84, p<0.001
F(1, 402) = 52.28, p<0.001
F(1, 402) = 2.16, p = 0.14
Test for main effect of presentation condition
F(1, 402) = 0.65, p = 0.42
F(1, 402) = 10.90, p = 0.001
F(1,402) = 60.83, p<0.001
F(1, 402) = 12.55, p<0.001
F(1, 402) = 0.01, p = 0.92
Test for intereaction effect of quality condition X presentation condition
F(1, 402) = 0.05, p = 0.82
F(1, 402) = 15.37, p<0.001
F(1, 402) < 0.001, p=0.99
F(1, 402) = 1.28, p = 0.26
F(1, 402) = 0.47, p = 0.49
5.3 Impact and significance The results of both the lab experiment and the online experiment speak to the importance of students’ perceptions of effort and the feedback they receive regarding their effort. Both sets of results are highly interesting and promising, but would require further testing in order to more comprehensively understand the effects at play and to begin to adapt the experimental manipulations into interventions that might have an impact on outcomes of interest (such as attainment of Level 1 or 2 maths qualifications) in the field.
All collaborators involved in these experiments were greatly interested in the process of exploring and validating an approach in a controlled environment (lab or online) and then translating that into the field as a field experiment, potentially to be subsequently scaled to a field trial. With these experiments, we took the first steps towards that goal, and have some promising sets of results that could be followed up with additional testing to determine what impact the interventions could have on students’ confidence in and engagement with maths, and ultimately, their achievement in maths qualifications.
146
6. Conclusion ASK has been on a journey trialing a variety of interventions in different areas of post-16 maths and English learning, which have historically been scarce. The research conducted has provided some valuable insights about areas that seem to be most receptive for behavioural intervention. The most successful trials were those directed at individuals who were already in education, particularly those enrolled in a more traditional education programmes, such as at a FE college. In contrast, the population that has proven to be more challenging for behavioural interventions are those in employment, but who could benefit from further participation in maths and English education.
Through the research outlined in this report, we have learned a considerable amount both in terms of what works in shifting the outcomes of adult learners, but also how to run trials in the area of adult education. We have learnt lessons not only from one area of adult learning, but in a number of contexts, ranging from the more traditional FE college classroom (section 2) to community learning (section 4) and in the workplace environment (section 3). In particular, we have learnt the power of prompts that encourage and remind learners (section 2.2.1), as well as how impactful mobilising social networks can be in supporting learning (section 2.2.2.7.3). Furthermore, we have found that interventions that promote a sense of belonging in the classroom can have an impact on engagement in learning, including boosting attendance and attainment levels (section 2.2.2.7.1). Beyond these elements, we’ve also learnt that it can also be beneficial to build other skills besides those being taught in students’ main programme of study. Building non-cognitive skills alongside a course can also have an impact on whether individual succeeds in education (section 2.2.2.7.2).
For those already in a skills programme, they seem to be the most receptive of interventions, with several ASK interventions having an impact on attendance and attainment rates. Based on the qualitative work that was conducted with employers and employees, one conclusion that could be drawn from this is that for behavioural interventions to have an impact, there must be some base level of engagement in learning already (already being enrolled in a formal programme serves as a proxy for this). For those that don’t have this (for example, those already in employment), behavioural interventions are less likely to gain traction and overcome the institutional, situational, dispositional and cognitive barriers faced by individuals, even in situations where the gains of further education are known. This is not to say all behavioural interventions can’t or won’t have an impact on this population, but perhaps other components are required, such as greater involvement from management in the workplace or having the right incentives in place for both employers and employees. Given the focus on increasing workforce productivity in the UK, this insight can beuseful in how we think about future interventions, and could be interesting area for researchers to pursue further.
147
Another point of reflection relates to the generally higher effects of interventions on learners studying maths and/or English at the Functional Skills level than those studying GCSEs. This may be driven by a lower baseline pass rate. However, another explanation may be that behavioural interventions are having a different and more powerful impact on lower level learners. Interventions like those tested might be having a disproportionate effect on lower level learners because they introduce elements that for many lower level learners, are more greatly needed, whether it is social support or an intervention to help combat anxieties about education or their ability to persist in learning. Further exploration of this is required though to be definitive in this conclusion.
The medium of the interventions is also worth reflecting on. While there are a number of new age communication channels, text messages still appear to be an effective mechanism for reaching learners whether directly or indirectly (as with the ‘study supporter’ interventions). This may change over time, but the principle of contacting a learner through a channel that is personal and meaningful to them remains. Although face-to-face interaction is almost always preferable, it is not always feasible. Text messages, which are more scalable and cost effective, could be a suitable alternative when in-person communication is not possible.
Using online modules also proved to be a potentially effective medium for intervention, with both the ‘grit’ and ‘values affirmation’ interventions using this channel. While it presented some logistical challenges in terms IT infrastructure in the colleges, it proved to be an effective way of introducing an intervention at scale. This should be of note to researchers, providers and policymakers as it presents a new avenue for introducing an intervention either for testing or for broader rollout.
Another reflection of the work of ASK is the challenge around running empirical research in the post-16 maths and English educational environment. Much of this is derived from the availability and quality of data that is collected and held. For example, for many institutions, in order to help overcome the situational barriers many learners face, provision is often made as flexible as possible, with learners changing classes temporarily or permanently without this necessarily flowing through the data in the required time. Similarly, in a number of settings, we observed classes changing after the initial few weeks as students moved around in accordance with their ability or their personal situations. While perfectly sensible in terms of helping to address the needs of learners, it can make running RCTs and other forms of empirical research difficult as changing circumstances impacts the robustness of a trial design. Even at a more basic level, how courses are named in the data, the use of different learner numbers (IDs) as well as differences in how attendance data is recorded proved challenging. These challenges were even greater in our work with various community learning organisations. While we were able to overcome most of these once we were aware of them, having a

148
more consistent and standardised way of managing data in the skills area could help transform the ability to run robust empirical research in this field.
As is evident from the array of projects outlined above, ASK has accomplished much since its commissioning in 2014. We have done so by working closely with several different organisations form the adult education sector in England, as well as with leading experts from some of the top universities around the world. The results included in this report are the product of a true collaboration, where organisations came together to help unpick educational barriers that learners face not only in the UK, but around the world. While there were challenges throughout, some of which are outlined above, it was the commitment to developing new approaches and empirically testing their efficacy to improve seemingly intractable problems that has made this collaboration a success. It is our hope that one of the legacies of ASK will be a continuation of this sort of collaboration long into the future. .
149
© Behavioural Insights Team
Reference: DFE-RR756
ISBN: 978-1-78105-867-1
This research was commissioned under the 2010 to 2015 Conservative and Liberal Democrat coalition government. As a result the content may not reflect current Government policy. The views expressed in this report are the authors’ and do not necessarily reflect those of the Department for Education.
Any enquiries regarding this publication should be sent to us at: [email protected] or www.education.gov.uk/contactus
This document is available for download at www.gov.uk/government/publications