Improving the quality of operative notes by implementing a ...
Tero Tiainen
Improving Customer Value Proposition for Operative Market Analysis Department
Helsinki Metropolia University of Applied Sciences
Master’s Degree
Industrial Management
Master’s Thesis
8 May 2014
PREFACE
In autumn 2014, while examining the opportunities for the subject of the thesis, I was
pleased to notice the numerous opportunities in the case company. For the profes-
sional challenge, I wished and was considered with a subject which gave the personal
growth opportunities to learn new aspects of the case company, as well as, consider
customer approach to view the topic beyond my current work responsibilities.
The subject of the thesis was demanding but turned out to be a great journey. As a
whole, I greatly enjoyed the aspiration and willingness for contribution by my company
instructor, nearest colleagues and all the new people I came across during the numer-
ous discussions. I was truly impressed on their ideas for the improvements, deep
knowledge, drive for change and helpful spirit to gain the new learning.
Throughout the studies, I also admired the way of creating the positive atmosphere in
the Industrial Management program among the lecturers and students to enable a
good learning experience. Thus, I would like to express thankfulness to my instructor,
Dr Thomas Rohweder, for his crystallizations to the thesis work and the great overall
discussions. I also wish to show my gratitude to Dr Marjatta Huhta and Zinaida
Grabovskaia for their deep commitment and helpfulness in all the challenges faced dur-
ing the studies.
Finally, without the excessive support, flexibility and patience from my wife, Anne, to
make the whole opportunity possible, I would not have any means to accomplish the
journey. For my children, Tinja and Aleksi, I wish to thank you for helping daddy with
your infinite love, numerous hugs and endless forbearance.
Tero Tiainen
Helsinki, 8 May 2014
ABSTRACT
Author Title Number of Pages Date
Tero Tiainen Improving Customer Value Proposition for Operative Market Analysis Department 78 pages + 10 appendices 8 May 2014
Degree Master in Engineering (MEng)
Degree Programme Industrial Management
Instructors Thomas Rohweder, Principal Lecturer, Dr (Econ)
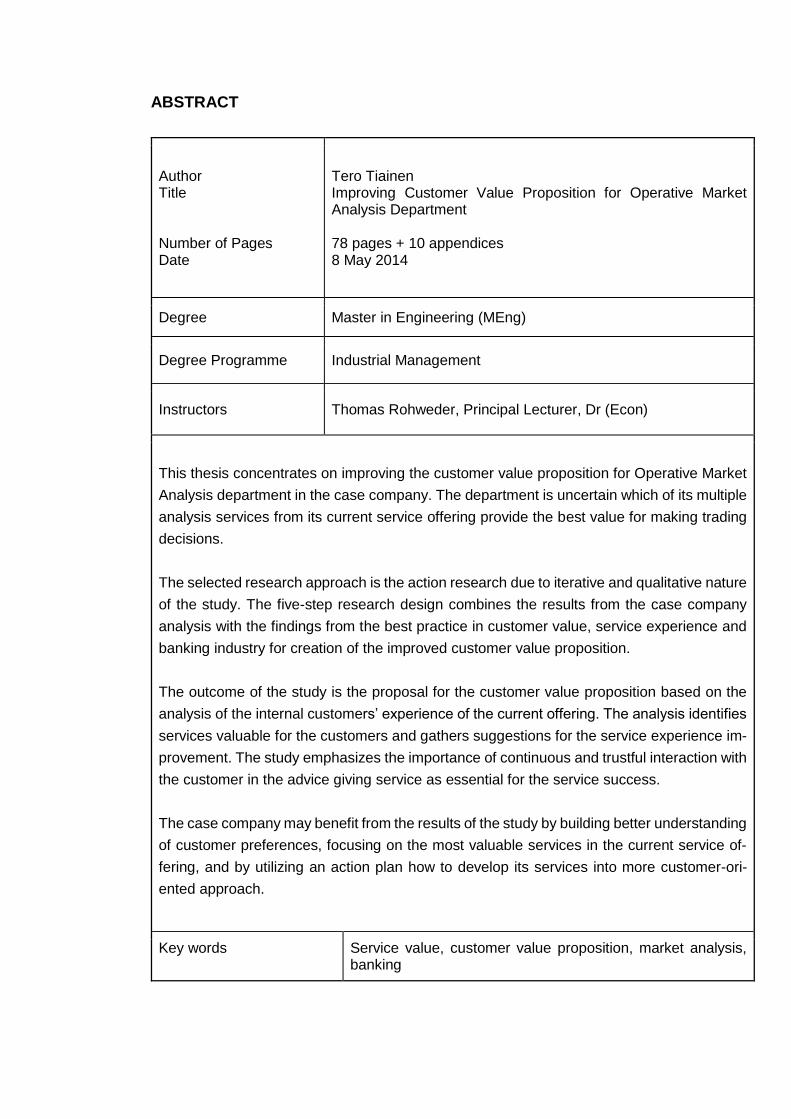
This thesis concentrates on improving the customer value proposition for Operative Market
Analysis department in the case company. The department is uncertain which of its multiple
analysis services from its current service offering provide the best value for making trading
decisions.
The selected research approach is the action research due to iterative and qualitative nature
of the study. The five-step research design combines the results from the case company
analysis with the findings from the best practice in customer value, service experience and
banking industry for creation of the improved customer value proposition.
The outcome of the study is the proposal for the customer value proposition based on the
analysis of the internal customers’ experience of the current offering. The analysis identifies
services valuable for the customers and gathers suggestions for the service experience im-
provement. The study emphasizes the importance of continuous and trustful interaction with
the customer in the advice giving service as essential for the service success.
The case company may benefit from the results of the study by building better understanding
of customer preferences, focusing on the most valuable services in the current service of-
fering, and by utilizing an action plan how to develop its services into more customer-ori-
ented approach.
Key words Service value, customer value proposition, market analysis, banking
TIIVISTELMÄ
Tekijä Työn nimi Sivumäärä Päivämäärä
Tero Tiainen Improving Customer Value Proposition for Operative Market Analysis Department 78 sivua + 10 liitettä 8. toukokuuta 2014
Tutkinto Ins. (ylempi AMK)
Koulutusohjelma Industrial Management
Työn ohjaaja
Thomas Rohweder, KTT
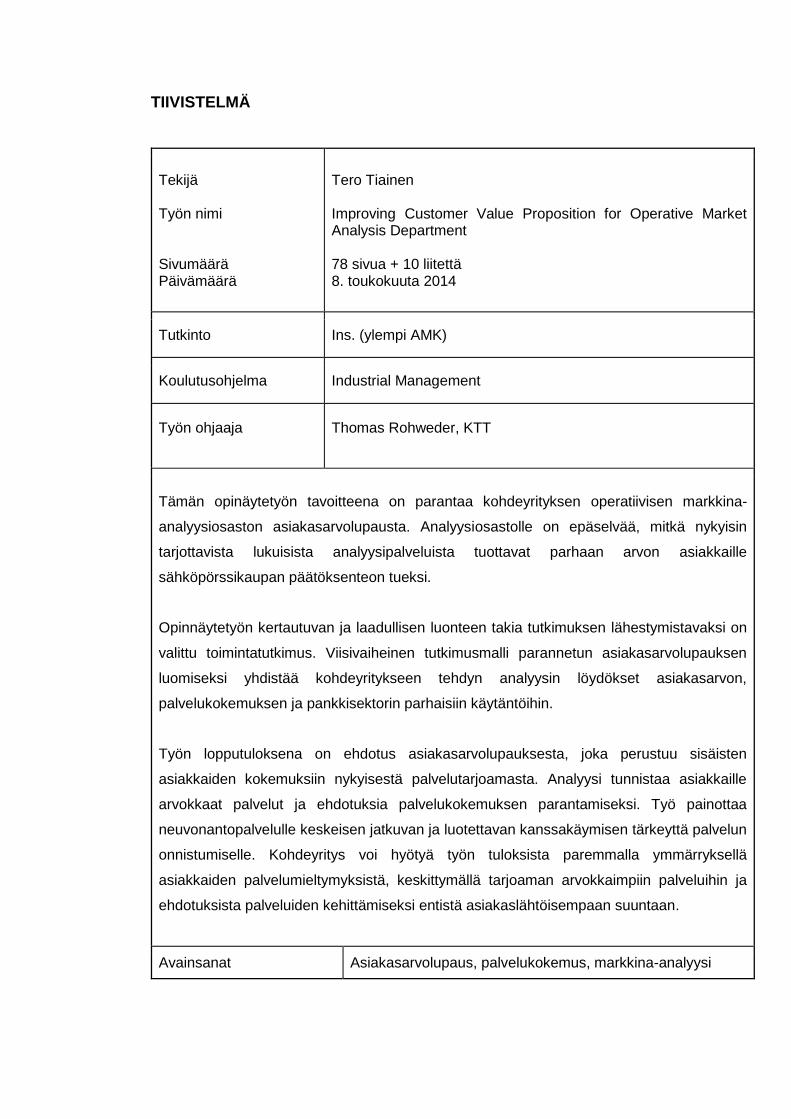
Tämän opinäytetyön tavoitteena on parantaa kohdeyrityksen operatiivisen markkina-
analyysiosaston asiakasarvolupausta. Analyysiosastolle on epäselvää, mitkä nykyisin
tarjottavista lukuisista analyysipalveluista tuottavat parhaan arvon asiakkaille
sähköpörssikaupan päätöksenteon tueksi.
Opinnäytetyön kertautuvan ja laadullisen luonteen takia tutkimuksen lähestymistavaksi on
valittu toimintatutkimus. Viisivaiheinen tutkimusmalli parannetun asiakasarvolupauksen
luomiseksi yhdistää kohdeyritykseen tehdyn analyysin löydökset asiakasarvon,
palvelukokemuksen ja pankkisektorin parhaisiin käytäntöihin.
Työn lopputuloksena on ehdotus asiakasarvolupauksesta, joka perustuu sisäisten
asiakkaiden kokemuksiin nykyisestä palvelutarjoamasta. Analyysi tunnistaa asiakkaille
arvokkaat palvelut ja ehdotuksia palvelukokemuksen parantamiseksi. Työ painottaa
neuvonantopalvelulle keskeisen jatkuvan ja luotettavan kanssakäymisen tärkeyttä palvelun
onnistumiselle. Kohdeyritys voi hyötyä työn tuloksista paremmalla ymmärryksellä
asiakkaiden palvelumieltymyksistä, keskittymällä tarjoaman arvokkaimpiin palveluihin ja
ehdotuksista palveluiden kehittämiseksi entistä asiakaslähtöisempaan suuntaan.
Avainsanat Asiakasarvolupaus, palvelukokemus, markkina-analyysi
Table of Contents
Preface
Abstract
Table of Contents
List of Figures
List of Tables
1 Introduction 1
1.1 Business Context and Company Background 1
1.2 Current Market Offering 2
1.3 Business Problem, Research Objective, Outcome and Scope 4
2 Methods and Material 7
2.1 Research Approach, Design and Process in This Study 7
2.2 Data Collection and Data Analysis Techniques 10
2.3 Validity and Reliability Plan 14
3 Best Practice in Building CVP’s 16
3.1 Definition of Value 16
3.2 Building Blocks of CVP 18
3.3 Conceptual Framework for CVP in This Study 27
4 Current State Analysis 30
4.1 Analysis Approach and Methods for Documenting Results 30
4.2 Strategy and Environment 35
4.3 Customer Segment 37
4.4 Customer Needs and Value Experience 40
4.5 Customer Offering 42
4.6 Key Resources 46
4.7 Key Activities 47
4.8 Summary of Strengths and Weaknesses in the Current CVP 47
5 Building the Improved Service Offering 49
5.1 Parts of the Improved Service Offering 49
5.2 Theme Discussions 52
5.3 Service Offering for OPMA as Customer Value Proposition 56
5.4 Recommendations for Service Experience and Quality Improvement 58
5.5 Summary of the Improved Service Offering for OPMA 66
6 Feedback to Outcomes of the Study 67
6.1 Description of Feedback Arrangements 67
6.2 Summary of the Feedback 68
6.3 Final Proposal Based on the Feedback 69
7 Discussion and Conclusions 73
7.1 Executive Summary 73
7.2 Next Steps 75
7.3 Evaluation 76
7.3.1 Objectives and Outcome 76
7.3.2 Reliability and Validity 78
References 79
Appendices
Appendix 1: Customer questions in interviews
Appendix 2: Supplier Questions in Interview
Appendix 3: Management Questions in Interview
Appendix 4: Strengths and Weaknesses by Service Offering (Full Map)
Appendix 5: Strengths in service and value experience by service experience element
(Detailed mapping)
Appendix 6: Weaknesses in service and value experience by service experience element
(Detailed mapping)
Appendix 7: Theme session – Management 1
Appendix 8: Theme session – Customer 1, 2, 3
Appendix 9: Theme session – Management 2
Appendix 10: Theme session – Analysts 1
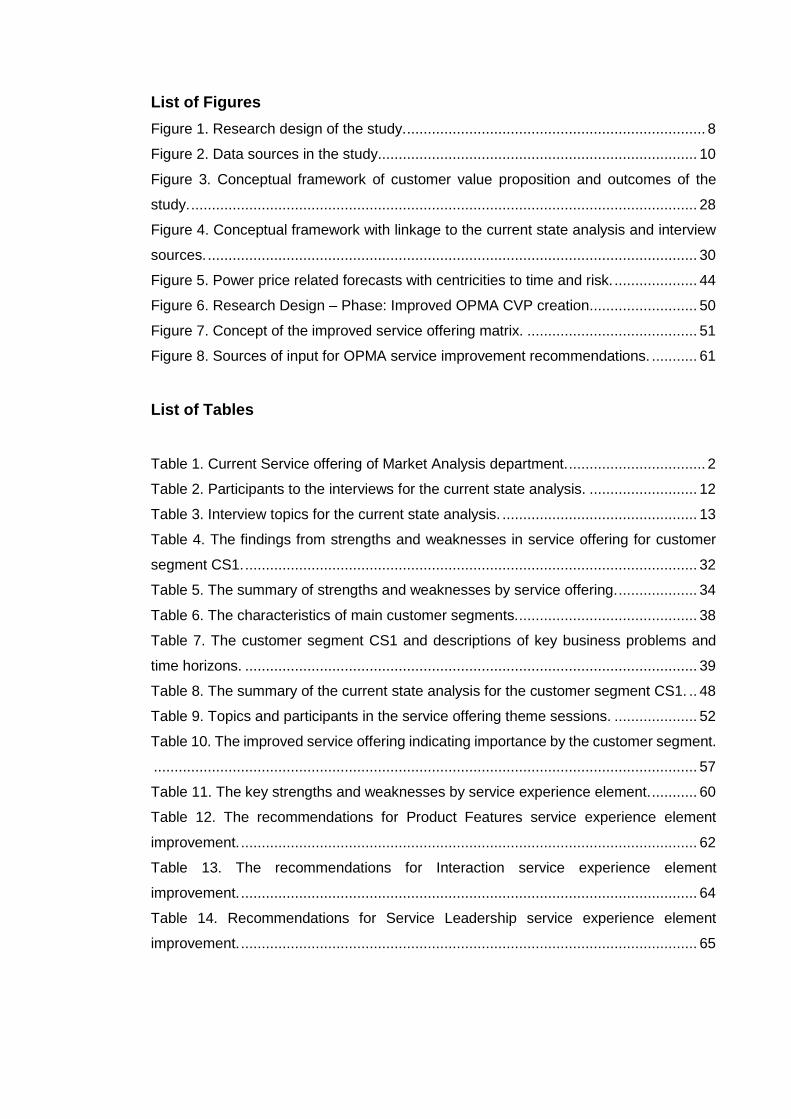
List of Figures
Figure 1. Research design of the study. ........................................................................ 8
Figure 2. Data sources in the study............................................................................. 10
Figure 3. Conceptual framework of customer value proposition and outcomes of the
study. .......................................................................................................................... 28
Figure 4. Conceptual framework with linkage to the current state analysis and interview
sources. ...................................................................................................................... 30
Figure 5. Power price related forecasts with centricities to time and risk. .................... 44
Figure 6. Research Design – Phase: Improved OPMA CVP creation .......................... 50
Figure 7. Concept of the improved service offering matrix. ......................................... 51
Figure 8. Sources of input for OPMA service improvement recommendations. ........... 61
List of Tables
Table 1. Current Service offering of Market Analysis department. ................................. 2
Table 2. Participants to the interviews for the current state analysis. .......................... 12
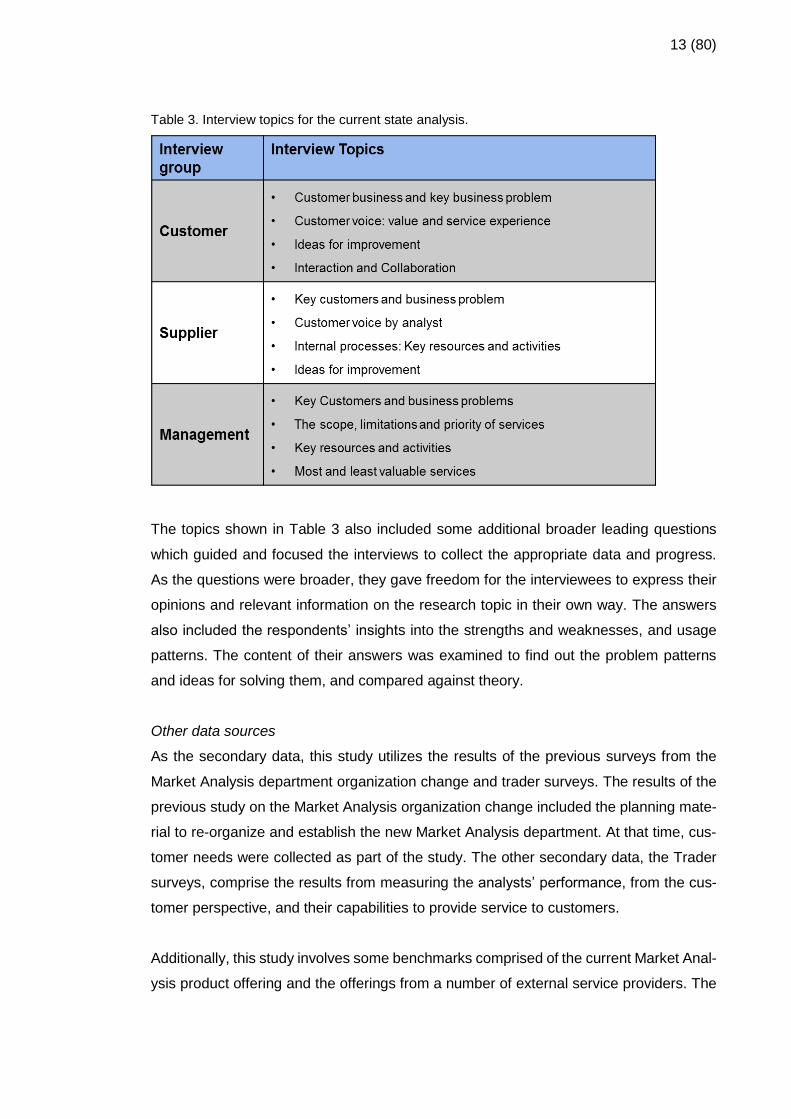
Table 3. Interview topics for the current state analysis. ............................................... 13
Table 4. The findings from strengths and weaknesses in service offering for customer
segment CS1. ............................................................................................................. 32
Table 5. The summary of strengths and weaknesses by service offering. ................... 34
Table 6. The characteristics of main customer segments. ........................................... 38
Table 7. The customer segment CS1 and descriptions of key business problems and
time horizons. ............................................................................................................. 39
Table 8. The summary of the current state analysis for the customer segment CS1. .. 48
Table 9. Topics and participants in the service offering theme sessions. .................... 52
Table 10. The improved service offering indicating importance by the customer segment.
................................................................................................................................... 57
Table 11. The key strengths and weaknesses by service experience element. ........... 60
Table 12. The recommendations for Product Features service experience element
improvement. .............................................................................................................. 62
Table 13. The recommendations for Interaction service experience element
improvement. .............................................................................................................. 64
Table 14. Recommendations for Service Leadership service experience element
improvement. .............................................................................................................. 65

Table 15. The improved Service Offering indicating importance’s by customer segment,
Final proposal. ............................................................................................................ 70
Table 16. Recommendations for Interaction service experience element improvement,
final proposal. ............................................................................................................. 71
Table 17. Recommendations for Product Features service experience element
improvement, final proposal. ....................................................................................... 71
Table 18. Recommendations for Service Leadership service experience element
improvement, final proposal. ....................................................................................... 72

1 (80)
1 Introduction
This study focuses on developing a customer value proposition for Operative Market
Analysis department of the case company. The case company is acting in the utility sec-
tor for energy production, sales and distribution in the Nordic, Russian and European
countries.
1.1 Business Context and Company Background
The case company is a Finnish-based corporation that has divisions for power and heat
production as well as retail power sales. The main operations of the company concen-
trate on the production and wholesale of power and heat. Additionally, the company
serves and sells energy to over one and half million retail customers in the Nordic coun-
tries. The case company also owns, operates and develops the regional power distribu-
tion networks.
Energy production is by nature a weather related industry, from both the production and
consumption perspectives. Especially the renewables related production methods rely
heavily on the weather conditions. Since electricity is usually not possible to produce in
advance and store for later use, consumption patterns follow temperature conditions.
Additionally, since production facilities and distribution networks are connected to each
other not only inside countries but also between countries, any unexpected interruptions
in production and restrictions in network capacity add additional even more complexity
to decision making. All these factors force the energy producers continuously update
both the planning of production and forecasting of consumption. In the case company,
these needs are supported by the Market Analysis department.
Market Analysis department collects the data on energy market prices, production, con-
sumption and other related market information from various sources, creates analyses,
and based on them, forecasts and provides value-added insights, market outlooks and
suggestions to decision makers in the company. Market Analysis also supports trading
operations related to physical and financial power trading. Another customer group for
Market Analysis department is made by the company top management, strategic corpo-
rate functions as well as the company divisions’ management teams.
2 (80)
Physical trading means, when concentrating on the wholesale energy spot market, that
market participants send their bids and offers to a market pool which then forms supply-
demand curves, and the intersection of those is locked for a day-ahead market price
(Fresis & Infield 2008: 219). In the case company, Physical Trading unit focuses on of-
fering the available company’s production capacity to the wholesale electricity spot mar-
ket, as well as acting in the power balancing market and delivering sold energy to the
power network.
In addition, Financial Trading unit hedges production assets against price volatility by
using such financial instruments as forwards and futures, and simultaneously creates
additional value for the company. Buying and selling financial contracts are traditional
hedging instruments, which fix the price of demand and generation of electricity for a
certain period of time in the future (Fresis & Infield 2008: 220). In financial trading, power
is applied as main commodity but supported by other related commodities, such as car-
bon emissions (CO2), coal, oil and environmental certificates.
In all these functions, part of Market Analysis department is the Operative Market Anal-
ysis (OPMA) team which concentrates on supporting the Financial and Physical Trading
business units in operative time horizon. This time horizon can last from the current day
to three to six years ahead. This study focuses on improving the CVP proposal for OPMA.
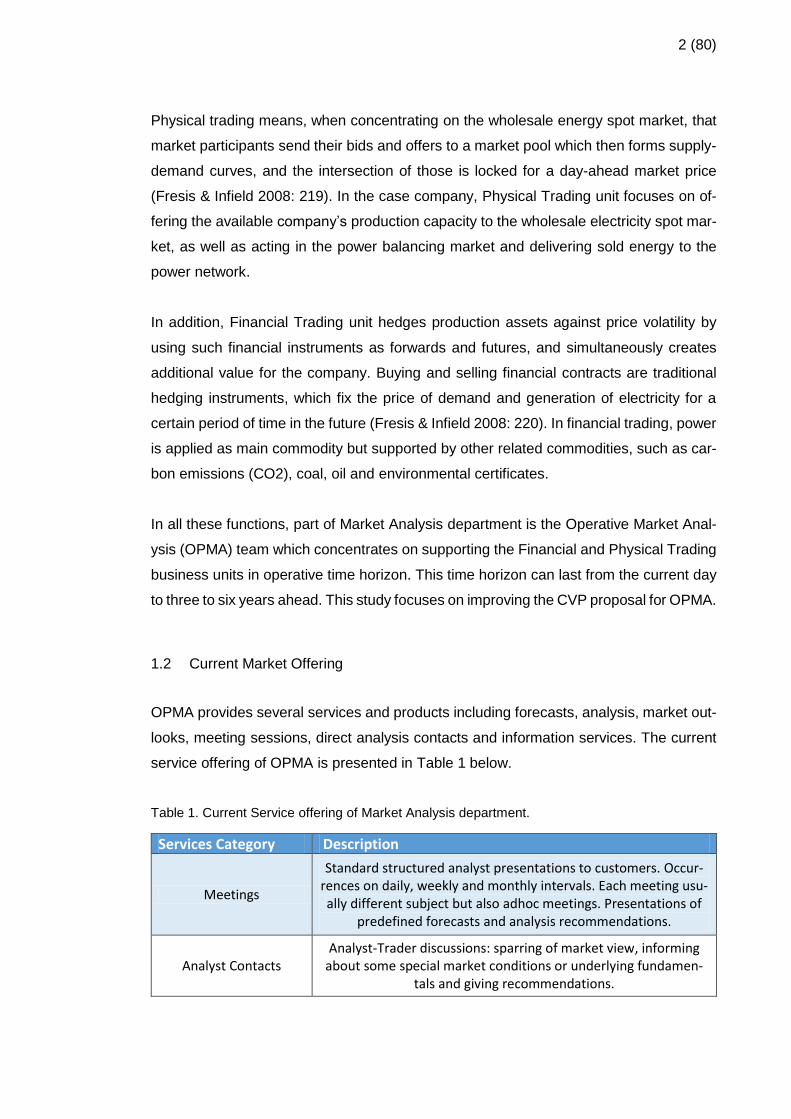
1.2 Current Market Offering
OPMA provides several services and products including forecasts, analysis, market out-
looks, meeting sessions, direct analysis contacts and information services. The current
service offering of OPMA is presented in Table 1 below.
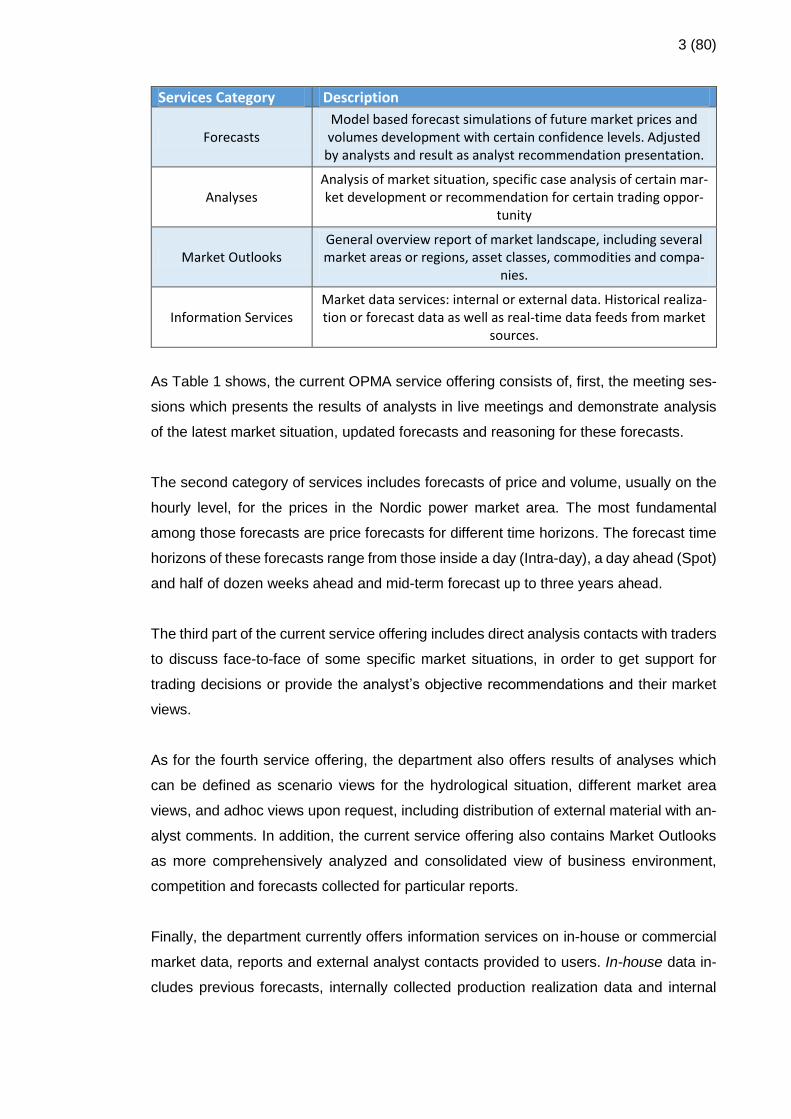
Table 1. Current Service offering of Market Analysis department.
Services Category Description
Meetings
Standard structured analyst presentations to customers. Occur-rences on daily, weekly and monthly intervals. Each meeting usu-ally different subject but also adhoc meetings. Presentations of
predefined forecasts and analysis recommendations.
Analyst Contacts Analyst-Trader discussions: sparring of market view, informing
about some special market conditions or underlying fundamen-tals and giving recommendations.
3 (80)
Services Category Description
Forecasts Model based forecast simulations of future market prices and volumes development with certain confidence levels. Adjusted
by analysts and result as analyst recommendation presentation.
Analyses Analysis of market situation, specific case analysis of certain mar-ket development or recommendation for certain trading oppor-
tunity
Market Outlooks General overview report of market landscape, including several market areas or regions, asset classes, commodities and compa-
nies.
Information Services Market data services: internal or external data. Historical realiza-tion or forecast data as well as real-time data feeds from market
sources.
As Table 1 shows, the current OPMA service offering consists of, first, the meeting ses-
sions which presents the results of analysts in live meetings and demonstrate analysis
of the latest market situation, updated forecasts and reasoning for these forecasts.
The second category of services includes forecasts of price and volume, usually on the
hourly level, for the prices in the Nordic power market area. The most fundamental
among those forecasts are price forecasts for different time horizons. The forecast time
horizons of these forecasts range from those inside a day (Intra-day), a day ahead (Spot)
and half of dozen weeks ahead and mid-term forecast up to three years ahead.
The third part of the current service offering includes direct analysis contacts with traders
to discuss face-to-face of some specific market situations, in order to get support for
trading decisions or provide the analyst’s objective recommendations and their market
views.
As for the fourth service offering, the department also offers results of analyses which
can be defined as scenario views for the hydrological situation, different market area
views, and adhoc views upon request, including distribution of external material with an-
alyst comments. In addition, the current service offering also contains Market Outlooks
as more comprehensively analyzed and consolidated view of business environment,
competition and forecasts collected for particular reports.
Finally, the department currently offers information services on in-house or commercial
market data, reports and external analyst contacts provided to users. In-house data in-
cludes previous forecasts, internally collected production realization data and internal

4 (80)
statistical data. Commercial data comprises all kinds of forecasts and realization data
from the market environment offered by external data providers either as real-time data
feed or historical data loads. The department also enables access to the internal and
external sources of market data for business users.
These services are consumed by the traders who are acting in both the power spot and
the commodity markets to buy and sell power in different profitable time horizons, hedge
against market volatility and create value from the market changes. Another, internal,
customer group of the current service offering is the case company top management.
Analysis services are used also by the internal corporate departments such as Strategy,
Interest Promotion and Mergers & Acquisitions. Finally, the current OPMA service offer-
ing is also utilized by different other business divisions and their investment projects.
1.3 Business Problem, Research Objective, Outcome and Scope
Business problem of this study concerns the delivery and quality of OPMA service offer-
ing. Presently, it seems unclear which analysis services provide the best information
value for individual trading decisions. Thus, OPMA cannot concentrate its analyst efforts
on producing the most value providing services and create a focused CVP. As a result,
multiple information dimensions affect the quality and outcome of analysis and forecast-
ing. On the other hand, several operative analysis services and their combinations can
provide the required information to support a considerable part of trading and other busi-
ness decisions. Thus, it becomes essential to understand better what analyses are
mostly used, how used and for what purpose they are used by the internal customers.
Currently, the demand for different analyses from the customers exceeds the possibilities
of OPMA to meet all the needs. Analysts are not capable to expand the current offering
to each individual customer and therefore not serving all existing needs.
The objective of this study is therefore to build a proposal for the improved customer
value proposition (CVP) for OPMA. The final outcomes of the study will include:
1) Improved service offering for OPMA
2) Recommendations for service experience improvement.
Taken together, these two outcomes of the study form the improved customer value
proposition for OPMA.
5 (80)
The improved customer value proposition is significant for OPMA since it would enable
the improved service offering and better alignment of the service offering by OPMA with
the demand from the customers. Additionally, the recommendations for service experi-
ence improvement would facilitate OPMA’s detailed action planning, implementation and
continuous improvement of the customer experience. This study and its outcomes can
help indicate where to concentrate the efforts of the analysis resources and how to pro-
duce the most valued services. It can also help to identify the most effective channels to
deliver the analysis in each case and recognize what factors represent the current chal-
lenges in OPMA’s analysis services.
The scope of this study is limited to the following areas. First, the study addresses the
issues in operative analysis only within the OPMA team scope, leaving out other teams
in the Market Analysis department. Second, this study only slightly touched the topic of
customer segmentation. Since this study concentrates on building the customer value
proposition for the company internal service provider, OPMA, it aims to develop the CVP
for the pre-defined internal target customer groups. These groups include physical and
financial traders, business line management, corporate strategy and communication –
all those customers who are currently served by OPMA. Therefore, the task of customer
segmenting is not addressed in full scale in this study. Instead segmentation is taken as
an input to the study and defined in a lighter way, as user profiles based on the existing
data and briefly commented on. Third, the customer value proposition is finalized for one
segment only, CS-1 “Operative”, taken as an example for which the CVP building pro-
cess developed in this study is applied. Value propositions for other segments lie outside
the scope for this study.
The main approach for investigating the subject in this study comprises the following
steps. First, building a conceptual model of how to create the customer service offering,
second, applying that model to the current state analysis of OPMA service offering, and
third, documenting the improved customer offering and proposing recommendations for
improvements. To achieve its objective, the study analyzes which of the current services
provide the best information value for individual trading decisions and point to improve-
ment possibilities in the service delivery and quality.
This thesis is written in 7 sections. The section 1 introduces the business context and it
defines the business problem. Section 2 overviews the research approach and methods
and material used. Section 3 discusses the best practices of building customer value

6 (80)
proposition and ends by introducing the conceptual framework used in this research.
Section 4 describes the steps and results of the current state analysis aligned to concep-
tual framework. Section 5 presents the building of improved customer value proposition.
Section 6 discusses the feedback to improved customer value proposition proposal, pre-
sent final version and gives recommendations for implementation. Last section con-
cludes the research and summarizes its results.
7 (80)
2 Methods and Material
This section overviews the research approach and each step in it. This section also de-
scribes the data collection sources and their characteristics. Last, this section clarifies
the methods used for data analysis.
2.1 Research Approach, Design and Process in This Study
General approach used in this study is action research. Action research is a deliberate,
cyclical process of planning, taking action and evaluating. The planning stage concen-
trates on diagnosing the problem, including for example, the articulation of the working
theme, key issues, and theoretical foundations. In action research, all these elements
may be subject to a change after later iterations. The planning also involves development
of an action plan. The action plan is made up of all the steps in the action research cycle,
and the next step in the cycle is to take action. Last, once the actions are taken, they are
evaluated by assessing if the actions were correct based on the diagnosis and what
inputs are available for the next cycle of diagnosis, planning and taking action (Coghlan
& Brannick 2006: 15). The same logic and steps are applied in this study as there are
several rounds of research when results from the previous steps are evaluated and dis-
cussed with the key stakeholders, and then fed in at the next step of action research
cycle as further input. Based on the feedback received, the proposed solutions are eval-
uated and improved.
Additionally, action research is remarkable as a research approach since action re-
searchers hold a dual role of being the investigators and members in the organization
and research. Action research is “the concern of practitioners who want to improve or-
ganizations and communities.” (Coghlan & Brannick 2006: 15). Researcher in this con-
text is part of the organization, and research has an aim of organizational improvement
making the initiative to start happening.
The research process in this study is divided into several phases. It includes, first, diag-
nosing of the existing situation based on the theoretical building blocks; this phase is
followed by action planning based on the findings from the previous stage; the, action
taking occurs in terms of proposing solution and improvements to the company; and the
8 (80)
final phase is reflecting and evaluating with the management on the agreed solutions.
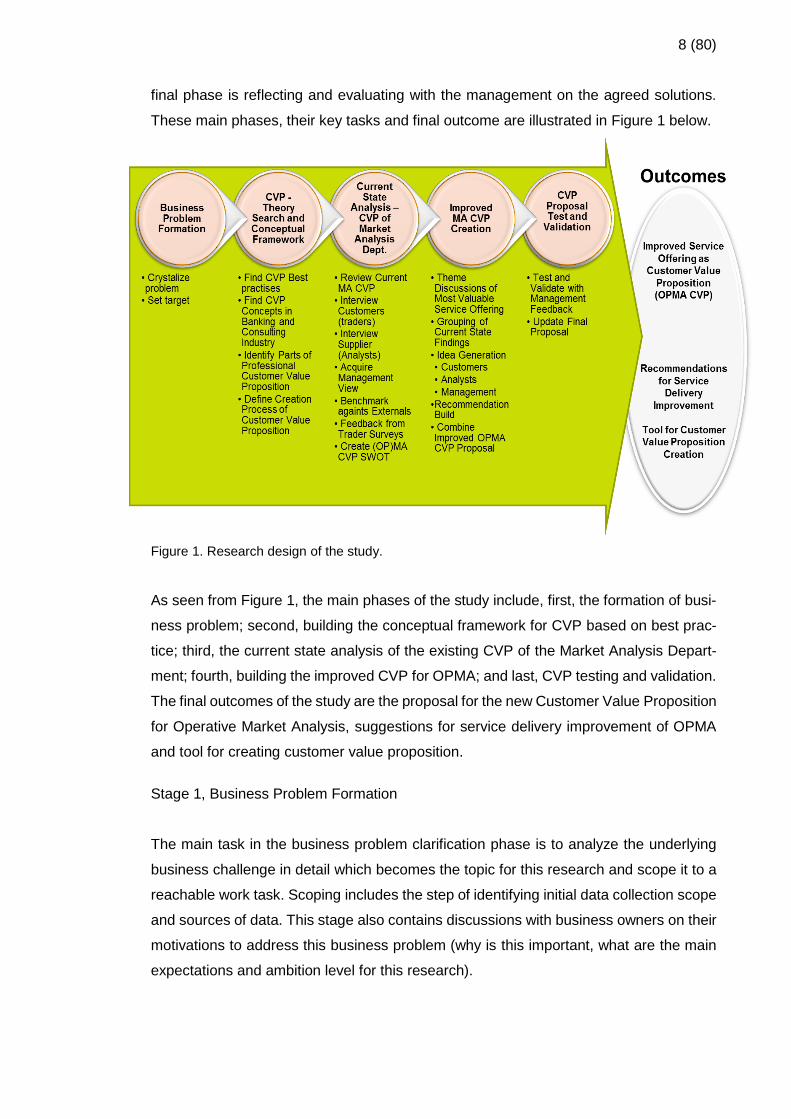
These main phases, their key tasks and final outcome are illustrated in Figure 1 below.
Figure 1. Research design of the study.
As seen from Figure 1, the main phases of the study include, first, the formation of busi-
ness problem; second, building the conceptual framework for CVP based on best prac-
tice; third, the current state analysis of the existing CVP of the Market Analysis Depart-
ment; fourth, building the improved CVP for OPMA; and last, CVP testing and validation.
The final outcomes of the study are the proposal for the new Customer Value Proposition
for Operative Market Analysis, suggestions for service delivery improvement of OPMA
and tool for creating customer value proposition.
Stage 1, Business Problem Formation
The main task in the business problem clarification phase is to analyze the underlying
business challenge in detail which becomes the topic for this research and scope it to a
reachable work task. Scoping includes the step of identifying initial data collection scope
and sources of data. This stage also contains discussions with business owners on their
motivations to address this business problem (why is this important, what are the main
expectations and ambition level for this research).
9 (80)
Stage 2, CVP - Theory Search and Conceptual Framework
Theoretical data search is utilized to support the research in the next phase where the
conceptual framework is constructed. First, search is to find theoretical different defini-
tions for CVP and models to craft it. This involves extensive academic literature search,
both for business guide books and academic publications. Second, the search is focused
on to find general best practices for CVP construction in different business-to-business
(B-to-B) and business-to-customer (B-to-C) publications and case studies. Last, the the-
oretical search is concentrated specifically on the consulting, finance sector and banking
industry, including investment banks and financial institutions, to find out what, if any,
there are insights to customer value proposition concepts and their creation.
Stage 3, Current State Analysis – CVP of Market Analysis Department
After the relevant theoretical background has been gathered, the research concentrates
on collecting data on the current situation from different perspectives. Those are mainly
the customer and supplier perspectives but they also include data from management,
external environment and other minor sources. External environment provides bench-
mark from other suppliers’ offerings. Data collection conducted to find both strengths and
weaknesses of the current CVP. The outcome of this phase is a summary and analysis
of the strengths and weaknesses in the OPMA current CVP and offering.
Stage 4, Improved OPMA CVP Creation
This part of research concentrates on building the improved Customer Value Proposition
for Operative Market Analysis. Main tasks here are to arrange theme discussions, gen-
erate ideas and build a CVP. Theme discussions concentrate on the results of the current
state analysis and generating potential ideas for the improved CVP and offering. Target
groups for discussions are customers (traders, portfolio managers, top management)
and suppliers (both analysts and their management).
Stage 5, CVP Proposal Test and Validation
Building a CVP includes merging the most relevant ideas into a proposal, iteratively test-
ing and validating the proposal with management until a favorable final solution is
10 (80)
reached. This phase finalize the whole thesis outcomes which are the proposal for im-
proved customer value proposition for Operative Market Analysis and suggestions for
work practices changes.
2.2 Data Collection and Data Analysis Techniques
Strategy in this research is to produce a qualitative research analysis based on the in-
sight from a small group of key stakeholders who are interviewed, which does not make
quantitative approach feasible. There are multiple sources of data utilized in this study.
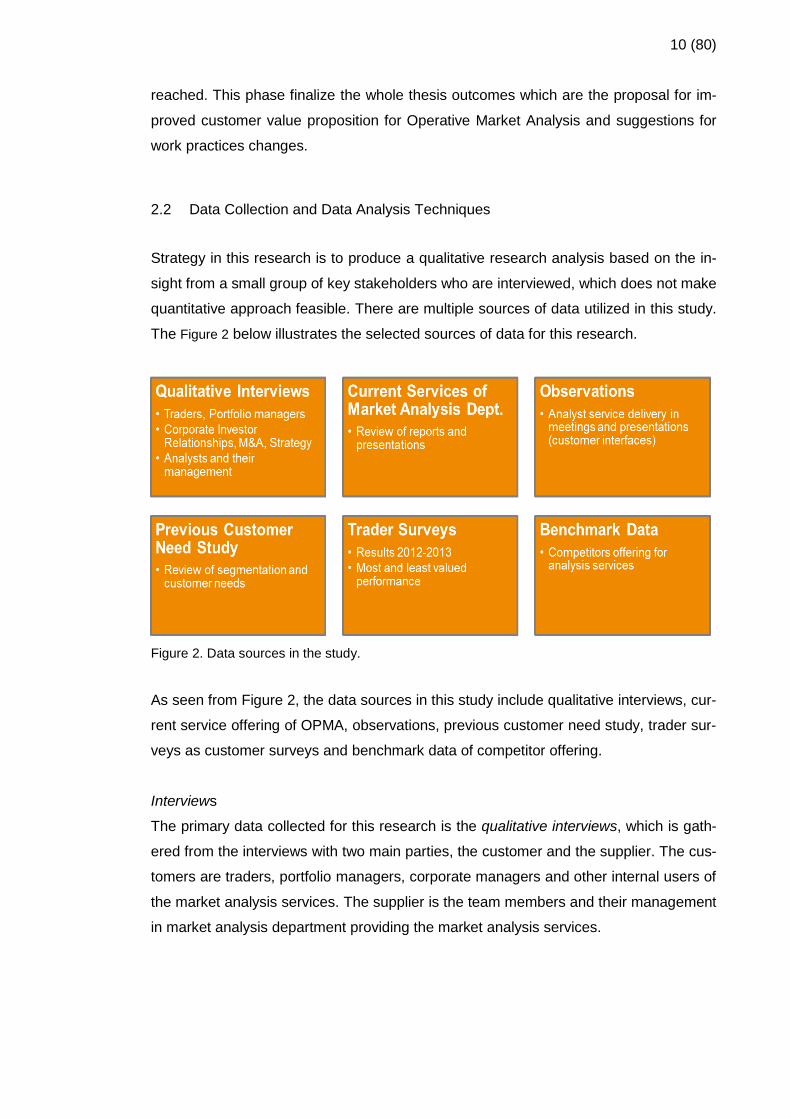
The Figure 2 below illustrates the selected sources of data for this research.
Figure 2. Data sources in the study.
As seen from Figure 2, the data sources in this study include qualitative interviews, cur-
rent service offering of OPMA, observations, previous customer need study, trader sur-
veys as customer surveys and benchmark data of competitor offering.
Interviews
The primary data collected for this research is the qualitative interviews, which is gath-
ered from the interviews with two main parties, the customer and the supplier. The cus-
tomers are traders, portfolio managers, corporate managers and other internal users of
the market analysis services. The supplier is the team members and their management
in market analysis department providing the market analysis services.
11 (80)
In qualitative analysis, in-depth interviews enable the researcher to interact directly with
people and help to collect more insights from the examples which can help to understand
problems and performance more holistically. Further on, observations can help to un-
derstand in practice and holistically, the underlying phenomenon which may come up in
in-depth interviews with individuals (Russ-Eft & Preskill 2001: 200). This is the reason
why the interview data needs to be supported and completed by observations. To collect
observations, researcher follows the analysts work when interacting with customers. Ob-
servations are used to witness if the phenomena discussed in the interviews truly hap-
pen, what is the context for them and if observation can provide more in-depth explana-
tions.
Qualitative interviews in this study comprise the interviews with the following groups.
Customer interviews are used to collect the data about the customer key business prob-
lems and how analysis is applied to help solve their problems. Additionally, the custom-
ers are asked about the strengths and weaknesses of the current service offering and
delivery. Finally, possible best practice suggestions how OPMA can serve them better
or improve service quality are collected from the customers in the interviews.
Analyst interviews collects the data of the key resources and activities needed to deliver
the analysis services. The analysts are also asked to identify the strengths and weak-
nesses of the key resources and activities in Market Analysis department. These data
are complemented with analysts’ observations of the customer usage behavior related
to the analysis services in their own usage setting. The data also included service expe-
rience comments. These two data help to recognize the problems to serve and to detect
unaddressed customer needs. Finally, the analysts are asked to share their insights how
to provide better analysis services to customers.
Management interviews from the Market Analysis department collect information on the
strategy and plans for providing services. This information is used to understand busi-
ness vision of the department, the priorities in serving its customers and possible bound-
aries in business environment when providing services. In these interviews, manage-
ment is asked to give their view on the key activities and resources in providing the ser-
vices, as well as the weaknesses and strengths in those.
All three groups of interviews - the customer, supplier and management interviews - were
based on open-ended questions. The selected list of the traders as customers, analysts
12 (80)
as suppliers and management as business owners who were interviewed for the study
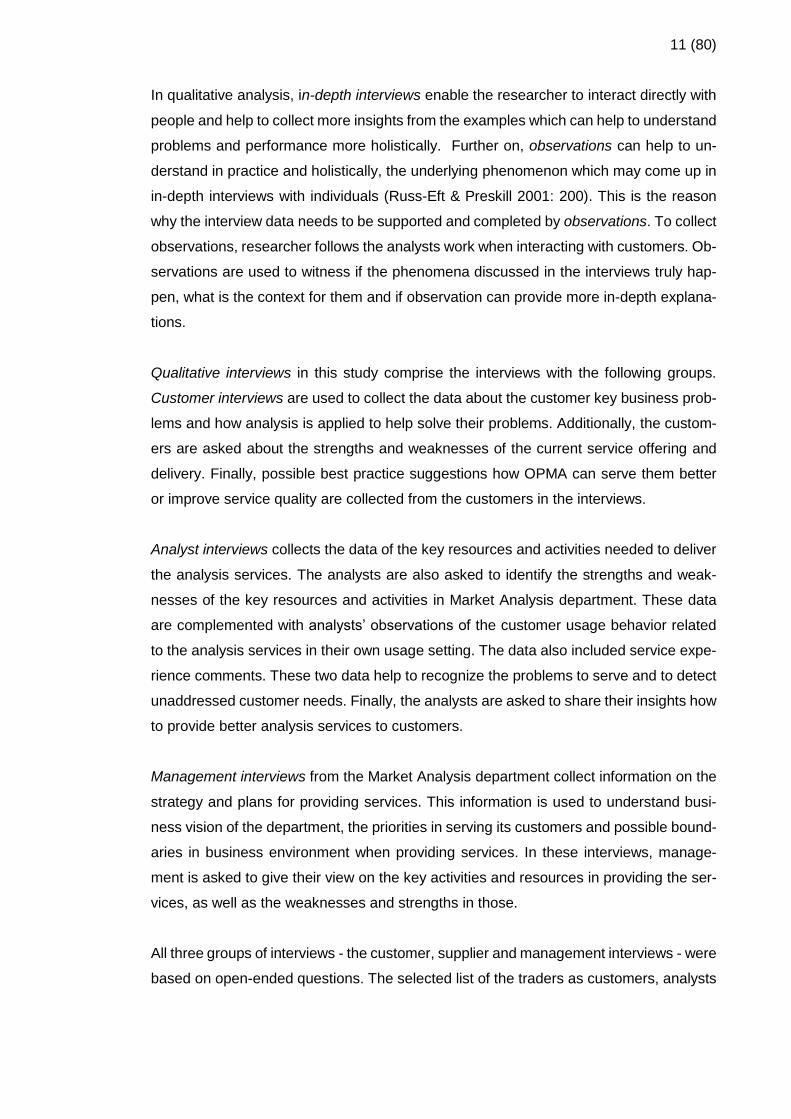
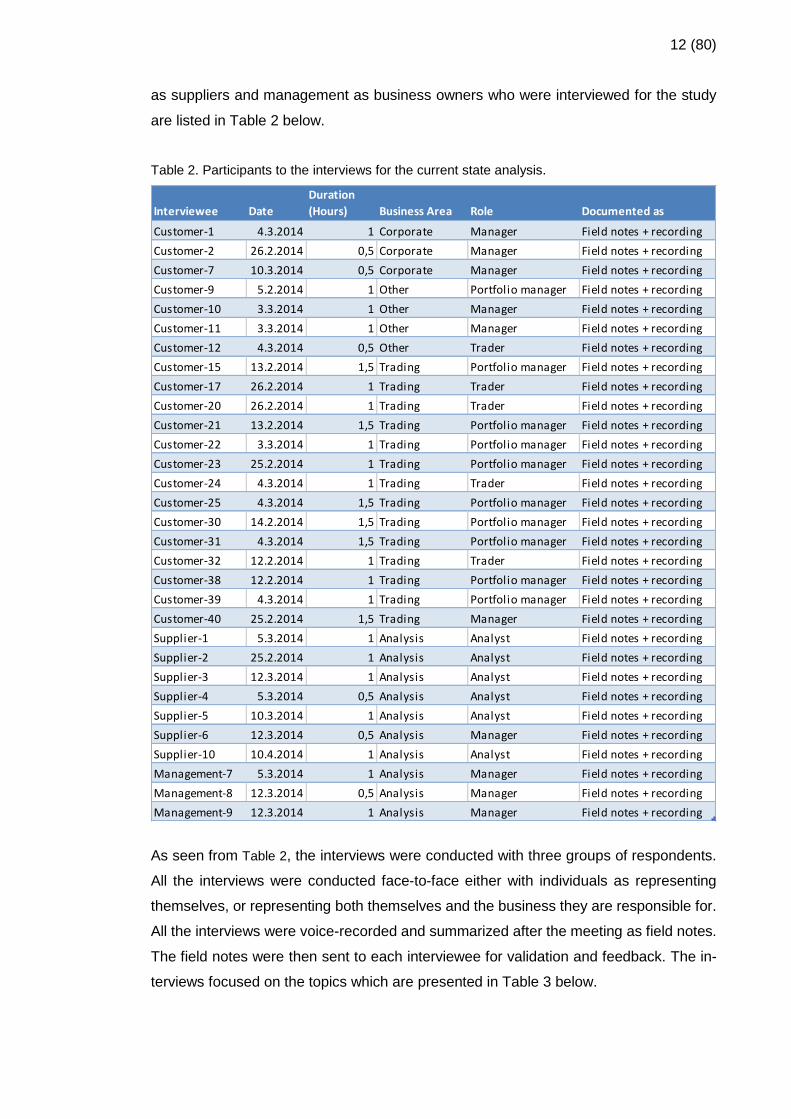
are listed in Table 2 below.
Table 2. Participants to the interviews for the current state analysis.
As seen from Table 2, the interviews were conducted with three groups of respondents.
All the interviews were conducted face-to-face either with individuals as representing
themselves, or representing both themselves and the business they are responsible for.
All the interviews were voice-recorded and summarized after the meeting as field notes.
The field notes were then sent to each interviewee for validation and feedback. The in-
terviews focused on the topics which are presented in Table 3 below.
Interviewee Date
Duration
(Hours) Business Area Role Documented as
Customer-1 4.3.2014 1 Corporate Manager Field notes + recording
Customer-2 26.2.2014 0,5 Corporate Manager Field notes + recording
Customer-7 10.3.2014 0,5 Corporate Manager Field notes + recording
Customer-9 5.2.2014 1 Other Portfolio manager Field notes + recording
Customer-10 3.3.2014 1 Other Manager Field notes + recording
Customer-11 3.3.2014 1 Other Manager Field notes + recording
Customer-12 4.3.2014 0,5 Other Trader Field notes + recording
Customer-15 13.2.2014 1,5 Trading Portfolio manager Field notes + recording
Customer-17 26.2.2014 1 Trading Trader Field notes + recording
Customer-20 26.2.2014 1 Trading Trader Field notes + recording
Customer-21 13.2.2014 1,5 Trading Portfolio manager Field notes + recording
Customer-22 3.3.2014 1 Trading Portfolio manager Field notes + recording
Customer-23 25.2.2014 1 Trading Portfolio manager Field notes + recording
Customer-24 4.3.2014 1 Trading Trader Field notes + recording
Customer-25 4.3.2014 1,5 Trading Portfolio manager Field notes + recording
Customer-30 14.2.2014 1,5 Trading Portfolio manager Field notes + recording
Customer-31 4.3.2014 1,5 Trading Portfolio manager Field notes + recording
Customer-32 12.2.2014 1 Trading Trader Field notes + recording
Customer-38 12.2.2014 1 Trading Portfolio manager Field notes + recording
Customer-39 4.3.2014 1 Trading Portfolio manager Field notes + recording
Customer-40 25.2.2014 1,5 Trading Manager Field notes + recording
Supplier-1 5.3.2014 1 Analysis Analyst Field notes + recording
Supplier-2 25.2.2014 1 Analysis Analyst Field notes + recording
Supplier-3 12.3.2014 1 Analysis Analyst Field notes + recording
Supplier-4 5.3.2014 0,5 Analysis Analyst Field notes + recording
Supplier-5 10.3.2014 1 Analysis Analyst Field notes + recording
Supplier-6 12.3.2014 0,5 Analysis Manager Field notes + recording
Supplier-10 10.4.2014 1 Analysis Analyst Field notes + recording
Management-7 5.3.2014 1 Analysis Manager Field notes + recording
Management-8 12.3.2014 0,5 Analysis Manager Field notes + recording
Management-9 12.3.2014 1 Analysis Manager Field notes + recording
13 (80)
Table 3. Interview topics for the current state analysis.
The topics shown in Table 3 also included some additional broader leading questions
which guided and focused the interviews to collect the appropriate data and progress.
As the questions were broader, they gave freedom for the interviewees to express their
opinions and relevant information on the research topic in their own way. The answers
also included the respondents’ insights into the strengths and weaknesses, and usage
patterns. The content of their answers was examined to find out the problem patterns
and ideas for solving them, and compared against theory.
Other data sources
As the secondary data, this study utilizes the results of the previous surveys from the
Market Analysis department organization change and trader surveys. The results of the
previous study on the Market Analysis organization change included the planning mate-
rial to re-organize and establish the new Market Analysis department. At that time, cus-
tomer needs were collected as part of the study. The other secondary data, the Trader
surveys, comprise the results from measuring the analysts’ performance, from the cus-
tomer perspective, and their capabilities to provide service to customers.
Additionally, this study involves some benchmarks comprised of the current Market Anal-
ysis product offering and the offerings from a number of external service providers. The
14 (80)
current product offering is used to complement the view to the current OPMA CVP, while
the external service providers’ offerings are used as external benchmark.
Data analysis method
The analysis methods applied to the qualitative data in this research is content analysis.
Lasswell (1976) defines content analysis in the following way, using the core questions
to demonstrate its logic: "Who says what, to whom, why, to what extent and with what
effect?” (Lasswell 1976). In a broader context, it can be said that content analysis is a
practice of making conclusions from the collected qualitative, textual data in an objective
and systematic manner. The aim of the content analysis is to recognize the relevant
features and characteristics in the data and make them obvious by categorizing into
meaningful groups (Holsti 1969). Especially the interviews and documents such as stud-
ies and surveys dealing with qualitative data call for using this analysis method, which
employs various ways of contemplation and analysis to conclude and summarize the
data into the findings. There practices may not always be obvious but they lead to more
content related insights which are combined together.
2.3 Validity and Reliability Plan
In general, when conducting a study of any subject, problem or phenomena, and pro-
ducing results, there are always concerns how to evaluate if research has been any good
and are the results trustworthy. Especially in qualitative research there seems to be a
debate among the scholars because similar kind of methods to ensure credibility in quan-
titative research cannot be applied to the realm of qualitative methods (Shenton 2004:
63). Nevertheless, scholars have demonstrated multiple approaches how to increase the
validity and reliability of a study.
Validity and reliability have several various definitions. Cho and Trent (2006) state that
“the validity in qualitative research involves determining the degree to which researchers
claims about knowledge correspond to the reality” (Cho & Trent 2006: 320). Therefore,
in this study, the validity may be interpreted to mean rightness and credibility of
knowledge as descriptions, interpretations and conclusions made in the study and how
closely those connect to real life without letting the researcher’s own bias interfere. Va-
lidity also means confirmation that the research question originally asked in the study is
rightly addressed meaning to ensure that the research has been uniform and holistic
from the beginning to the end (Quinton & Smallbone 2006: 126).
15 (80)
Further on, reliability of the study concerns its trustworthiness and authenticity. The issue
of reliability should demonstrate the evidence that, if the work were repeated, in the same
context, with the same methods and by the same participants, similar results could be
obtained (Shenton 2004: 71). Therefore, authenticity of the person, phenomenon, or sit-
uation becomes an important criterion for validity (Whittemore et al. 2001: 530) by en-
suring that the same results may be reached if the research was repeated. Based on
these definitions, it can be concluded that focusing attention and addressing validity and
reliability in a study should contribute to its quality especially in qualitative research.
To increase validity in this study, the following measures are planned. First, the study
will include detailed descriptions of the processes for data collection, analysis and appli-
cation of the results. Second, the data collected from interviews is returned to the inter-
viewees for checking and comments. Third, the key stakeholders, customers and man-
agement, will be involved into the development, discussions and interpretations of the
proposal and results several times during the study. To further support this point, multiple
sources of evidence will be includes to reach a multi-dimensional, summarized view.
Fourth, data is reported in detail and its analysis will be supported with direct quotes,
when possible.
To increase the reliability of the study, several procedures will be utilized. First, the study
will employ different data sources and approaches to collect data to increase its credibil-
ity and transferability. Second, only well-established theories on the subject are selected,
investigated and applied in the study. Third, to promote verisimilitude, the outcomes are
presented to different counterparties to challenge the solutions created. Finally, as there
will be possibilities for interpretation, the researcher will also use his own critical self-
awareness to re-evaluate the input and outcomes.
This plan for validity and reliability is evaluated again in Section 7.3.2 at the end of study
against the actual results of the Thesis.
16 (80)
3 Best Practice in Building CVP’s
This section discusses the existing and best practice for building a CVP in general and
with provided possibilities in the financial and advisory services sector. The section is
divided into two sub-sections. First, it introduces and defines the key terms related to
customer value proposition. Second, it discusses the selected best practice to create a
customer value proposition in the financial sector, with the key related points merged to
serve as the conceptual framework in this study.
3.1 Definition of Value
Customer Value Proposition (CVP) has several meanings defined in literature, broadly
covering different aspects of promise of benefits from the market offering to the custom-
ers in certain groups. First of all, Osterwalder and Pigneur (2010) stress that with value
propositions organizations seek to solve customer problems and satisfy the customer
needs (Osterwalder & Pigneur 2010: 22). Kotler and Armstrong (2010) add to this vision
stating that by defining that “value proposition is a set of benefits or value which the
company promises to deliver” (Kotler & Armstrong 2010: 33).
Earlier, definitions of value propositions concentrated on the customer benefits gained
from the product or service compared to its price (Lanning & Michaels 1988: 53). These
approaches exercised purely economic ways to define the product’s value to the cus-
tomer. Value was defined as the benefits of service or product to the customer in terms
of how much they are willing to pay for it, reduced with the price or service or product
(Lanning & Michaels 1988: 53). This approach implied that in the offering had certain
built-in features that created value for the customer, and the customer was passively
receiving this value.
This approach is further developed by Andersson and Narus (Anderson & Narus 2004:
5) who use value in the context of monetary benefits for the functionalities and perfor-
mance of the market offering for business markets. The same approach what also used
by Kotler and Armstrong as the competitor comparison perspective when they defined
the term superior value for customer (Kotler & Armstrong 2010: 217). According to An-
derson and Narus (2004), value has economic, technical, service and social benefits
received by the customer for the exchange of price they pay. As such, changes in the
offerings price should not change the value for the customer but rather impact on the
17 (80)
customer willingness to acquire the offering. This may be also very typical in business
market environment, where the price only can rather be the prime nominator for the value
of offering. Taken more generally, the customer usually wants lower prices all the time,
along with higher service quality and broader offering. Supplier, on the other hand, can
at some point claim that without adding costs, the customer value is on the limit what can
be reasonably expected. Further on, Anderson and Narus (2004) claim that it cannot be
assumed that the customer is accurately perceiving or understanding all the value of the
supplier’s offering. Therefore, the company needs to translate the features of the offering
to what they are worth in the customer own set-up (Anderson & Narus 2004: 7). This
may move value thinking further to the customer side, even though the supplier is still
the one who is expected to find, define and promote value to the customer.
Andersson et al. (2006) continue this discussion by comparing value experience to the
next best alternative, mainly meaning the competitor offering or solving the customer’s
problem by other means (Anderson et al. 2006: 94). However, it is interesting to recog-
nize that the other means includes the customer possibility to solve the problem without
the assistance from the supplier or even leave the problem unsolved. This leads to think-
ing that value needs to be considered more broadly than just against comparing it to
other competitors. To add to this discussion, Wouters (2010) emphasizes thinking that
value can be different and worth differently to different customers. (Wouters 2010: 1103).
These earlier approaches to defining value based on the monetary and competitor logic,
later expanded with the view on the customers’ next best alternatives, has led to a more
recent discussion of value within the foundational premises of the service-dominant (S-
D) logic. There, value could be co-created between the customer and the supplier in the
service interaction, compared to goods-dominant (G-D) logic where value is imbedded
in the product and delivered to the customer (Vargo & Lusch 2004: 4) (Vargo & Lusch
2008: 3). In S-D logic, value can be measured in financial terms but there is also included
some attitudinal component, “feeling the value”. This happens especially in service inter-
actions between the customer and the supplier (Grönroos 2008: 303). Based on this,
Grönroos (2008) concludes that adoption of service-dominant logic makes a strategic
decision. If the customer buys products and services as resources and does not expect
the customer-supplier interaction to happen, the development of the market offering
should be based on G-D logic (Grönroos 2008: 310), meaning that the interaction cannot
improve the offering in this context. On the other hand, if services are bought according
to S-D logic and their delivery makes part of the value creation processes, the supplier
18 (80)
gets involved in the interaction with the customer and become a co-creator of the cus-
tomer value through this interaction.
In the context of this study, this means that to resolve the uncertainties of what are the
most valuable OPMA services to its customers, the search for value needs to focus not
only on the expenses and monetary values, but also on the service experience as a
whole. Although the features of products and services contribute to value experience, it
is the interaction between the analyst and the customer that may have a especially im-
portant impact on the service quality and value creation. Thus, it makes a criterion that
may help to identify the most valuable services and adjust OPMA service offering ac-
cordingly.
The next sub-sections will utilize the previous value definition and the most recent views
on value creation to discuss the building blocks of CVP for OPMA.
3.2 Building Blocks of CVP
As building blocks for customer value proposition are outlined in the definitions of cus-
tomer value and value proposition discussed above, they can be broadly identified out
of these definitions. Kotler and Armstrong (2010) conclude their thinking of value propo-
sition with the statement that “to target segment and need our offering is the solution that
have these points-of-differences” (Kotler & Armstrong 2010: 240). It can be seen that
their statement is approaching value from the supplier perspective, and as such, this
statement points to the ultimate elements, in their views, of customer value proposition.
If broken down to the building blocks of customer value proposition, it can be interpreted
as distinguishing the strategy and environment, customer segment, customer needs and
value experience, customer offering, key resources and key activities as building blocks
of a CVP. Next, all these building blocks are separately defined and discussed to see
their link to customer value proposition.
Strategy and Environment
Referring to the earlier statement, when the company decides to target some customers
with its offering and some particular value meaningful to them, the company is taking a
strategic decision, or a series of strategic decisions. According to Porter (1996), strategic
decisions are made to choose what to do and especially what not to do (Porter 1996:
19 (80)
12). He continues that strategy itself means differentiation, in a sense of choosing and
combining a set of different distinctive activities. He continues by saying that “operational
effectiveness is not strategy. Strategic positioning means performing different activities
from rivals or performing similar activities in a different way.” This differentiation is typi-
cally visible in a business model which demonstrates how the company operates in the
market, provide its offering to create value or benefits for its customers and earn its prof-
its to be successful. There can be several ways to define a business model. According
to Osterwalder & Pigneur (2010), “a business model describes the rationale of how an
organization creates, delivers, and captures value”.
Further on, competitive environment creates another foundation of the strategy, business
model and eventually makes a key building block in customer value proposition. Com-
petitive environment, or surroundings, of the supplier is needed to understand and ad-
dress the possibilities where the supplier can provide superior value for the customer,
where it needs to partner with someone or where it should or should not compete (An-
derson & Narus 2004). This thinking is also related to Porter’s (2008) logic of forces
which shape the strategy (Porter 2008: 25). As customers always have the possibility to
choose, direct competitors are at least one relevant field to observe but there are also
other areas to address. These areas can include the customers itself or the supplier’s
suppliers. Additionally, new entrants or a new offering can shape the competitive envi-
ronment, attract customers elsewhere and force the supplier to change its strategy and,
eventually, its customer value proposition.
In this study, Market Analysis department, and OPMA as its sub-unit, is the internal ser-
vice supplier in the company. As a supplier, they have always an element of some ex-
ternal competition because its customers can choose not to use, in terms of ignoring, the
supplier’s services or acquire the required services, especially information, outside. Ad-
ditionally, competitive environment in this study can also be extended to include the com-
pany internal environment. So far, the management of the Market Analysis department
has received a mandate and limitations from company top management to arrange and
provide services internally. Therefore the supplier is affected by decisions and changes
happening in that environment, especially in terms of the guidance to the scope of cus-
tomers being served, the resources available, and the supplier’s efforts allocation. When
talking about the mandate, it describes the target of what to deliver and who to deliver it
20 (80)
to, but it does not relate to how the service is delivered. This gives freedom to the man-
agement of the Market analysis department to organize the service delivery to their best
view as long as it delivers the required quality of service.
The Market Analysis department can be considered as a company of its own, which
needs to justify its existence and earns its profits. This also calls for identifying their
strategy and differentiation. There needs to be certain activities that they either do differ-
ently or activities which are not done by others. If they cannot demonstrate this happen-
ing, the customers and management can, and most likely will, look for other options. For
these reasons, even though the strategy review is not the main focus in this study, it is
included and helps to understand the strengths and weaknesses of current CVP. Espe-
cially from the management side, it is important to gain an understanding of the choices
made when creating the organization and specifying its services. These choices may
have certain impact on value creation which makes it necessary to identify, define pos-
sible consequences, and find ways to strengthen, or limit or remove their impact.
Based on the definitions in this sub-section, Strategy and Environment as a building
block of CVP needs to be examined, especially from the point of view of the strategic
decisions taken by the Market Analysis department management to deliver the services.
As it will be demonstrated, these strategic decisions include targeting and setting the
scope of department, selection of the key resources and activities, both as own capabil-
ities and via partners, and the forces of competition (in a larger extent) to be aware of.
Later in the study, understanding of these forces is revealed through the management
interviews, and possible consequences and the impact of these forces are identified in
the discussions on the service delivery improvements.
Customer Segment
The statement by Kotler & Armstrong (2010: 240) cited above that points to the content
of CVP as offering the solution that have “points-of-differences” means that something
valuable, with offering some valuable points-of-difference, is served to someone (Ander-
son & Narus 2004: 156). It is here that value can take different shapes, for example,
value-in-exchange or value-in-use, discussed earlier. In the ideal situation, in the end
that somebody receiving value is satisfied. This someone can be defined as representing
customer segments. In general, customer segments relate to the groups of customers
21 (80)
the company serves. These customers have usually a certain similar kind of needs, char-
acteristics and behaviors which require its own market mix or separate marketing strat-
egies (Kotler & Armstrong 2010: 215).
Segmented customers need to be profitable for the supplier, and the supplier need to
have required activities to create value for them. In the external market environment,
supplier can usually choose which customers to serve and also have a possibility to
exclude certain customer groups. As value proposition defines how the company will
create superior value for customers, it also means that in some cases same value prop-
osition can serve several different segments. But typically value propositions are sepa-
rated for different segments (Kotler & Armstrong 2010: 222).
In this study, all customers are predefined and they cannot be excluded. Market Analysis
department can only influence the service level and the scope of services they provide,
but all customers will be served in one way or another. In the same way, the internal
customers themselves have different service quality levels they may want from the ser-
vice. Therefore, the customer segment is needed as a building block of CVP for OPMA,
because the current service offering needs the customer segmentation as a logical ele-
ment of CVP (Anderson & Narus 2004: 185). Thus, in this study the main utilization of
customer segmentation is to illustrate customers as consumers of particular types of
services. It can be done through their user profiles to identify if the offering somehow
varies between these profiles. Additionally, customer segmentation will be used to map
the customer needs and value experience statements based on the findings from the
interviews. Thus, in this study, customer segmentation will mostly serve the purpose of
determining the service improvement points.
Customer Needs and Value Experience
When targeting greater performance and better customer satisfaction, companies have
a danger fall in the trap of serving almost all the needs of customer. Porter pointed this
out with Japanese companies who traditionally tried satisfy all the customer needs and
ended up blurring their positioning (Porter 1996: 5). Therefore, company has to under-
stand what are the real customer needs out of all the needs they have and where com-
pany can serve them profitable.
22 (80)
Customer are not actually interested what they buy or consume but what they can do
with it when in use or available (Grönroos 2008: 303). In this study, customer offering as
analyses, recommendations and forecasts may not be interesting alone but the value in
the information content, when available and properly communicated, creates the differ-
ence. It may not even be interesting where the information is coming and how con-
structed, as long as it provides support for decision making and the reasoning provides
experiences of trust and convincement. The forecasts and analyses are more in-direct
advices but especially recommendations, as more direct advices, may have a great in-
fluence to decision maker. According to Bonaccio & Dalal (2006), decision makers are
sensitive to trust on advices if quality of advice varies or decreases. The trust or good
reputation is far more difficult to gain than loose (Bonaccio & Dalal 2006: 130). Thus, the
analysts need to constantly perform without larger quality decreases or longer periods of
inferior quality advices. Otherwise they have to take great effort to earn the trust back.
To continue, it is possible to find similarities in the work of financial analyst and manage-
ment consultants. Greiger & Metzner (1983) have defined management consulting as an
advisory service where qualified and trained persons help with objective and independ-
ent manner customer. The consultants help to identify, analyze and if needed, even solve
the problem of client (Greiger & Metzner 1983). In the same manner financial analysts,
who are specifically trained to possess analytical and modeling skills, help customer by
analyzing market environment in financial or commodity industry. They must be able
communicate a rational and independent view of market situation to support decision
making and, to succeed fully, provide reasoned recommendations to money managers
with positive success rate. Especially success rate is separating good and bad analysis
from each other.
In her research of analysts and emotions in financial organizations, Nekrassova (2010)
categorizes following key features for good analyst: independency and rationality, com-
munication skills, business understanding, originality and trustworthy selling. There
needs to be both the actual analysis and recommendation (outcome), as well as com-
munication of convincing own view with supporting arguments (Nekrassova 2010: 9).
She adds that this must happen on the right time and right place. Thus, the general
customer needs for analysis services can be expressed in this study as “effectively com-
municated differentiated views and advices which are objective, packed with knowledge
and supported by experience and therefore can be trusted”. However, the trust may not
23 (80)
appear immediately but might need consistent building of relationship with customer and
evidence, the track record of success of analyses.
In the case of analyst and trader, value is co-created together when views and advices
are provided. Prahalad & Ramaswamy (2004) suggest that, if value is co-created to-
gether with customer, focus needs to be in quality of interaction (Prahalad &
Ramaswamy 2004: 5). When thinking analysis services to decisions making and reflect
were the value is created, it may occur mostly in two places. First, it can appear in direct
interaction with analyst and customer or, second, deeper in customer’s own decision
making process as one or several of inputs. Thus, we can expect also the value experi-
ence mostly happening in that occasion.
In order to achieve understanding of the success of service delivery and quality of inter-
action in it, it is not enough to think of how customer may appreciate value of the ser-
vices. According to Anderson & Narus (2004), normal customer satisfaction survey
captures supplier’s performance what is expected, not what the services are worth to
customer (Anderson & Narus 2004: 187). Further, to build up true customer insight,
Manning & Bodine (2012) suggest not only to ask customer needs for business prob-
lems, which are also important, but also gain understanding what are the usage situa-
tion where offered services are used (Manning & Bodine 2012: 67). This helps to un-
derstand also the problems in wider scope and may reveal more insights. Therefore, it
can be summarized that the more the supplier understands the customer’ usage of ser-
vice or products, the greater potential the supplier has to adjust offering to create supe-
rior value for the customer.
Additionally, customers themselves are not the only ones who can reveal insights to the
value experience. Usually the supplier has several touch points where they interact with
the customer and in many of these touch points, the supplier’ persons are co-operating
directly with the customers. These touch points can be valuable source for further in-
sights (Manning & Bodine 2012: 95). Therefore, while interviewing analysts, it may be
important to get employees views of how the customers experience the service, both the
positive and negative experiences.
Thus, it can be summarized that customer needs drive the customer value proposition
building. Not all the customer needs are to be served but the ones which are the most
valuable for them. When investigating customer needs for the services where advice
24 (80)
giving and interaction are in central role, most likely the communication of convincing
analysis and recommendations are the primary needs from customers. Convincement
as a service quality may happen both with the accuracy of actual forecast but most likely
in the interaction between the analyst and the customer. Hence, the value experience in
other forms than pure product features may be the source for good analysis and source
of findings for improved customer value proposition. For these reasons, the customer
needs and value experience are included in the building blocks of customer value prop-
osition.
Customer Offering
Customer offering, in general terms, means the enabler of customer value proposition.
Customer offering enables it either proactively, when some totally new approaches of
meeting customer needs are invented, or reactively, when the key customer needs are
known, and the supplier reviews its existing offering and combines it in such a way that
it would meet the identified customer needs. Andersson and Narus (2004) use the term
market offering to represent the customer offering and define it as the offering which
includes the core product or service that the supplier offers. This offer can include sup-
plementary parts such as services, programs and systems. These supplementary parts
helps to adjust the offering to the particular customer needs and gives flexibility to offer-
ing formation.
According to Andersson and Narus (2004), customer offering also includes functionali-
ties and performance. Functionality describes what the product or service does, and per-
formance describes what it provides to the customer (Anderson & Narus 2004: 34). Sim-
ilarly, Kambil et al. (1996) argue that value is created when the product attributes, which
they define as features, design, service and support, match the specific customer needs.
They also suggest that product performance relates to the number of customer needs
which the product fulfills and the degree to which the product fulfills them (Kambil et al.
1996: 24). As a conclusion from their studies it can be stated that by improving product
performance of those four previously mentioned attributes, namely, the features, design,
service and it support, a greater customer value can be created.
This approach, however, may have some implications, if transferred from the G-D logic
to S-D logic. Grönroos (2008) expands the definitions of offerings to S-D logic by saying
25 (80)
that the service-based business logic (S-D logic) includes products, services and inter-
actions. Products and services are believed to support customer in every day practices,
while interactions enable to the supplier to step into the customers’ every day activities,
influence them and thus give additional potential to co-create value with the customer
(Grönroos 2008: 306). Therefore, in S-D logic the actual offering becomes extended be-
yond the point of initial exchange. Additionally, Kambil et al. (1996) suggest that value
propositions define the relationship between what a supplier offers and what a customer
purchases by identifying how the supplier fulfills the customer's needs across different
customer roles (Kambil et al. 1996: 31). Consequently, this ties together the customer
offering and the customer segments.
In this study, when looking at the analysis services provided by OPMA, one can see both
services and products delivered to the customers. The products are typically the fore-
casts and written analyses presented as reports and graphs; and the services can imply
either direct communications with the customers in order to present and discuss fore-
casts provided with some reasoning, or recommendations of certain type of actions to-
wards market by the trader. Forecasts can be easily seen either as the direct model
output or otherwise hard values based on the defined inputs. It can also be said, along
the communication, interaction is happening all the time as the analysts are closely in-
volved in the customer’s daily activities and influence them. Thus, it can be concluded
that the OPMA customer offering needs both hard and soft values for value creation and
value proposition fulfillment. This is in line with Clarke’s (2006) comment when he is
emphasizing the importance of soft skills when doing forecasting. Additionally he
stresses the significance of good skills for uncertainty assessment and risk management
(Clarke 2006: 25). In the context of this study, this means even more that the analysis
service offering is about communicating and interacting with the customers and the sur-
rounding environment.
Thus, customer offering makes an important building block for CVP because it is used
to define the key products and the services offered to the customer, as well as points to
the features needed to fulfill these needs. Once customer offering is clarified for each
customer segment and matched to the customer needs, the actual performance of those
customer offering features can be looked at and deviations found in the customer value
creation. The deviations can be worked on to the proposals of improvements of service
experience.
26 (80)
Key Resources
When looking further into the position statement, the brand and solution may be seen to
as referring to the capabilities and processes of the supplier to create value for the cus-
tomer. From the supplier perspective, these capabilities usually mean the key resources
and the key activities, either existing or acquired.
Supplier needs to have certain key resources which would enable the delivery of ser-
vices. This does not mean such resources which are the basic enablers, needed by every
supplier, for the delivery according a business model, but those key resources which are
selected because they are the most valuable and create superior value to customers.
Individually these resources may not make the difference; but combining them in a
unique ways creates a competitive advantage. Additionally, the supplier needs to choose
which areas they need to be better in compared how others are doing. Usually to make
this choice and become better in one area means to give up the capabilities in another
area (Porter 1996: 63). This trade-off needs to be carefully considered and balanced by
the supplier, in order to succeed in the service delivery.
When the key resources are recognized, evaluation of their performance can be done.
As management has identified and selected, with their best knowledge, certain resources
to become key value enablers, they can be evaluated as for how they satisfy the require-
ments for the delivery of service. Thus, it can be concluded that in order to improve and
the customer value proposition, the performance of key resources must be reviewed and
evaluated by both customers and management, and further on even by employees. Cus-
tomers and management usually are able to say how they those are performing in prac-
tice. Employees can support by giving strengthening or weakening signals of perfor-
mance. Based on that, it may also be possible to see if there was a proper selection or
balance of key resources done, which would enable the competitive advantage against
the competition.
In this study, key resources for OPMA could be expected to be the people and their
expertise. Usually gaining and improving expert knowledge requires person to learn the
27 (80)
specifics of the subject and time to experience different situations where the actual ap-
plication of this knowledge is refined into real expertise in the subject. In the case com-
pany, this knowledge enables advice giving. Advice is perceived as supporting decision
making when the knowledgeable person shares this knowledge as the one holding “ex-
pert power” (Bonaccio & Dalal 2006: 130). To conclude, to be able to gain expert power,
the person needs to possess certain expert capacities and have invested enough time
to learn and experience in order to gain this knowledge. These characteristics determine
the key resources in the case company and specifically in OPMA.
Key Activities
Key activities are processes and practice which can make customer value proposition
repeatable and scalable. As with key resources, according to Johnson (2008), there is
tight relationship between customer value proposition and key activities (Johnson 2008:
62). They also notice that key activities in people and knowledge related business are
usually training and competence development. Thus, this suggests that two aspects of
the key activities as a building block for CVP needs to be examined. First, the key activ-
ities connected to organization learning and managing people development might be the
most relevant. Second, the issues related to challenges for repetition and scaling of these
previously mentioned key activities is of interest in this study. The challenges can be in
the poor performance or, in the worst case, in the absence of these key activities. Most
likely the analysts are the key data source to reveal the performance. Therefore, the key
activities are needed as a building block for CVP.
3.3 Conceptual Framework for CVP in This Study
In this study, several key approaches identified as significant from the existing knowledge
and best practice make the building blocks of its conceptual framework. These building
blocks were discussed in the sub-sections and their importance to this study was argued
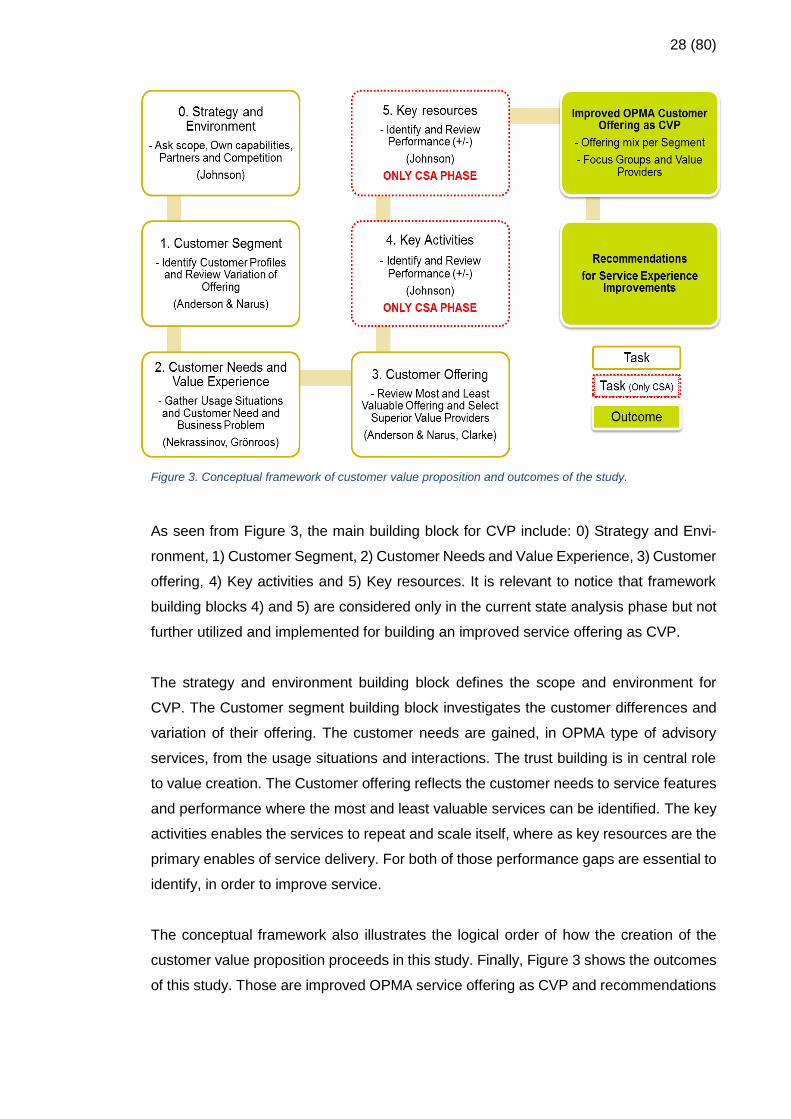
for. Figure 3 below, shows the building blocks merged into the framework. Same Figure
3 also visualizes the order and linkage between the framework parts.
28 (80)
Figure 3. Conceptual framework of customer value proposition and outcomes of the study.
As seen from Figure 3, the main building block for CVP include: 0) Strategy and Envi-
ronment, 1) Customer Segment, 2) Customer Needs and Value Experience, 3) Customer
offering, 4) Key activities and 5) Key resources. It is relevant to notice that framework
building blocks 4) and 5) are considered only in the current state analysis phase but not
further utilized and implemented for building an improved service offering as CVP.
The strategy and environment building block defines the scope and environment for
CVP. The Customer segment building block investigates the customer differences and
variation of their offering. The customer needs are gained, in OPMA type of advisory
services, from the usage situations and interactions. The trust building is in central role
to value creation. The Customer offering reflects the customer needs to service features
and performance where the most and least valuable services can be identified. The key
activities enables the services to repeat and scale itself, where as key resources are the
primary enables of service delivery. For both of those performance gaps are essential to
identify, in order to improve service.
The conceptual framework also illustrates the logical order of how the creation of the
customer value proposition proceeds in this study. Finally, Figure 3 shows the outcomes
of this study. Those are improved OPMA service offering as CVP and recommendations

29 (80)
for service experience improvement. Each of the blocks also presents the analysis
method needed to create an improved customer value proposition for OPMA in this study
which would help to respond and solve the business problem of this study. All the building
blocks are applied in the current state analysis presented in the next section.
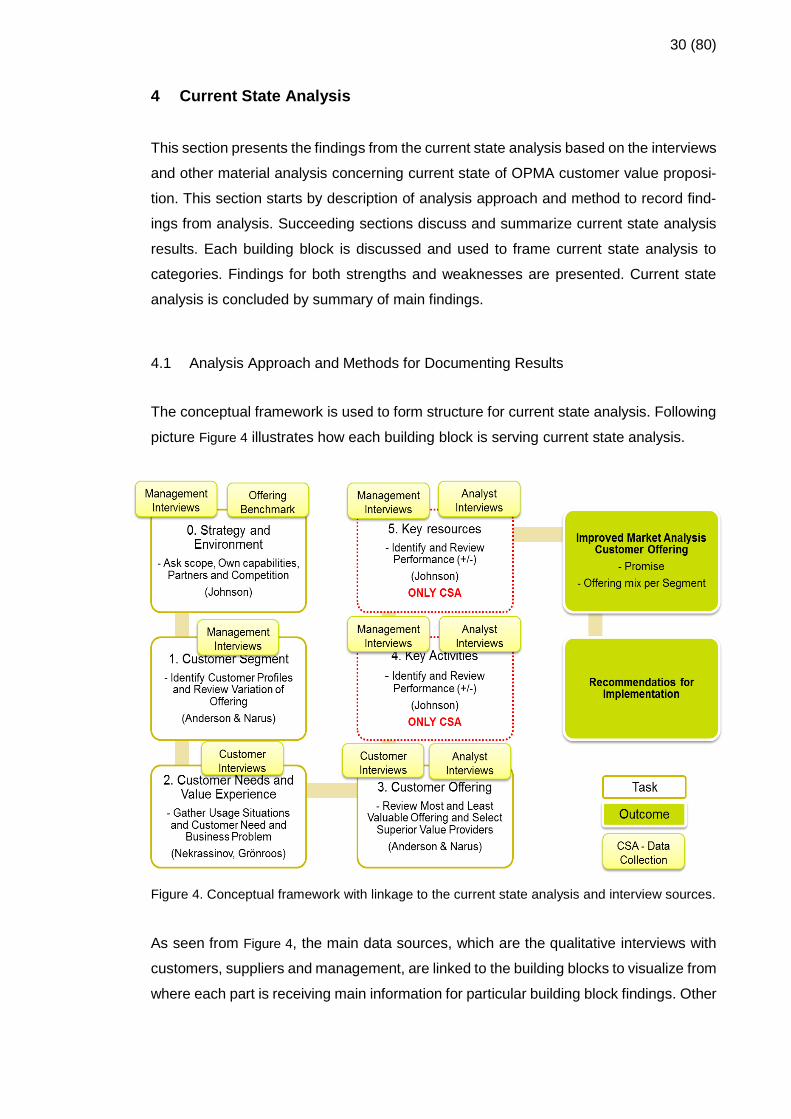
30 (80)
4 Current State Analysis
This section presents the findings from the current state analysis based on the interviews
and other material analysis concerning current state of OPMA customer value proposi-
tion. This section starts by description of analysis approach and method to record find-
ings from analysis. Succeeding sections discuss and summarize current state analysis
results. Each building block is discussed and used to frame current state analysis to
categories. Findings for both strengths and weaknesses are presented. Current state
analysis is concluded by summary of main findings.
4.1 Analysis Approach and Methods for Documenting Results
The conceptual framework is used to form structure for current state analysis. Following
picture Figure 4 illustrates how each building block is serving current state analysis.
Figure 4. Conceptual framework with linkage to the current state analysis and interview sources.
As seen from Figure 4, the main data sources, which are the qualitative interviews with
customers, suppliers and management, are linked to the building blocks to visualize from
where each part is receiving main information for particular building block findings. Other
31 (80)
interviews and building blocks may also provide useful information, or the actual finding
may reveal itself only after combining the information from several blocks. Figure 4 also
informs that the key resources and activities are explored for the current state analysis
purposes but not further developed in this study.
For further studies one customer segment was selected to identify in detail their most
valued services and weaknesses. Limiting the study to one of the main customer seg-
ments was due to the fact that the customer segment CS1 was the largest segment that
OPMA is serving. The segment was also expected to give the most colorful comments
about the current performance of services. Additionally, it would have required more time
to implement the study to all the customer segments. However, a selection of customers
from other segments was interviewed to receive general feedback on their service expe-
rience. The purpose was to see if any common service quality issues between customer
segments existed and if some issues could set the customer segments in conflict with
each other.
The current state analysis was conducted in the form of interviews, observations and
evaluations of different materials. The findings from these sources where gathered to-
gether and organized in two different ways. First, by using the pre-defined customer seg-
mentation and, second, by collecting and summarizing the main findings to reveal the
strengths and weaknesses. The summary of the main strengths and weaknesses in each
individual customer segment is presented in Table 4 below.
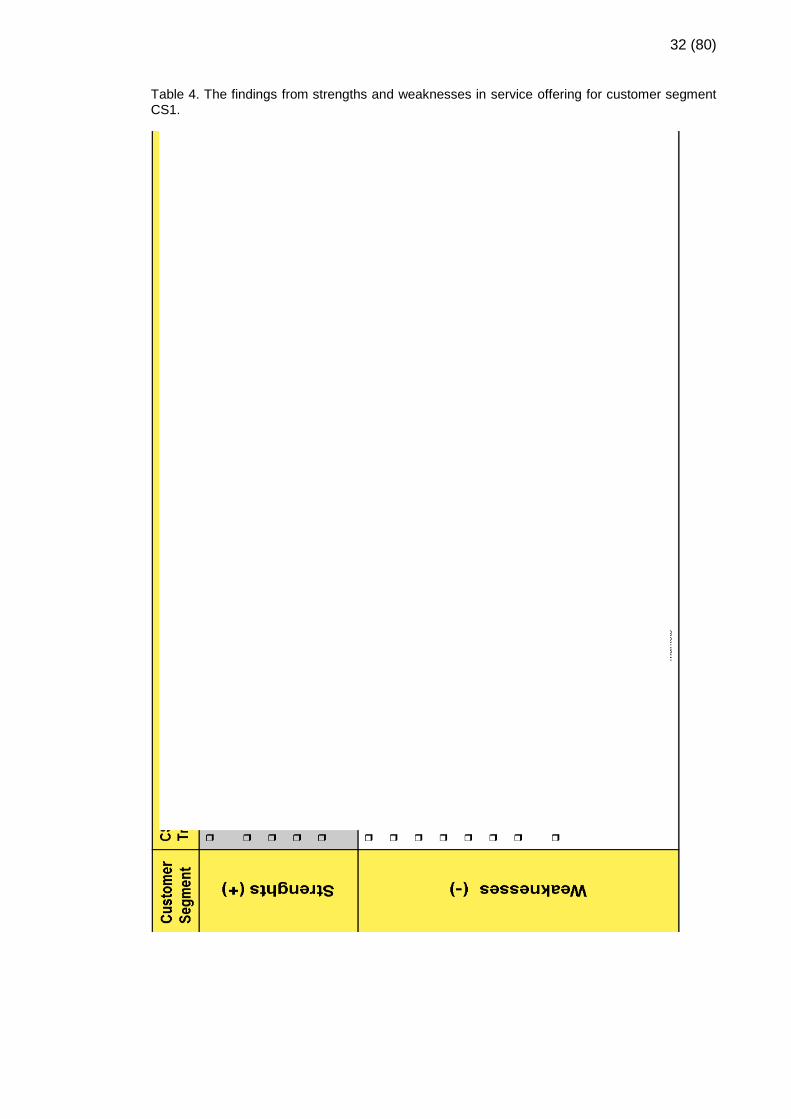
32 (80)
Table 4. The findings from strengths and weaknesses in service offering for customer segment CS1.

33 (80)
As seen from Table 4, each summarized finding is encoded in the manner of Sx and Wx,
where S stands for strength and W for weakness. Attribute x is indicated as running
number for both strengths and weaknesses individually, starting from 1. Each customer
segment has a separately started numbering for encoding their strengths and weak-
nesses. Same kind of strengths and weakness appeared in different customer segments
but those were not summarized together but rather allowed show repeatedly again in
different segments. This way none of the findings were missed. Second, the encoded
strengths and weaknesses were mapped to the customer offering. This way it was pos-
sible to find which offering had most of the strengths and weaknesses. The summary of
the strengths and weaknesses mapped to the service offering is shown in Table 5 below.
The complete mapping of relations is presented in APPENDIX 4.

34 (80)
Table 5. The summary of strengths and weaknesses by service offering.
Services category OfferingWeaknesses -
# Remarks
Strenghts -
# Remarks
- Continous view - Presense in trading desk (face-to-face - immediate resp.) 6 5
- Ad hoc questions (mail, messaging, etc. - when available) 1
- Daily short term meeting at 8.20 CET 5 3
- Financial weekly tactical meeting (participation) 1
- Weekly follow-up meeting (analysis performance, development ideas) 3
- Physical Tactics meeting (participation) 2
- Daily meeting for ad hoc issues and cases mid term horizon 11:00 CET
- Weather updates and blog 2
- Mid term price forecast + fundamentals (base and ranges) 12
- CO2 forecast 1
- Area spot price forecasts (base and ranges) 1
- Spot and four week price forecasts + fundamentals 3 1
- Front month spot forecast
- Inflow forecast (fundamentals, part of price fcst)
- Intraday price sensitivities 1
- Intraday signal forecast 4
- Fuel forecasts - Gas and Other
- Fuel forecasts - Coal 2 1
- Price spread to adjacent markets (EEX)
- Intra day volume indications & price forecasts
- Price forecast EEX
- Case analysis (Commitment, conviction case analysis) 3 6
- Elcert analysis (market view) 1
- Continental European power market
- Distribution of relevant external market analyses reports
- System price sensitivity analysis
- Forward analysis (journey to realization) 2
- Market follow-up and patterns
- GoO analysis 1
- Monthly market Outlook (future)
- Daily market outlook letter
- Macro-economic outlook
- External market data, weather and price forecast
- System access to fundamental data on Europe/Nordic markets
- News services
- Detailed power system info - map
- Real-time market prices
Direct Consultancy
Scheduled
analyses
Forecasts
Analyses
Market Outlooks
Information
Services
35 (80)
Table 5Table 5 shows that all the encoded findings were labeled and targeted to different
service offerings whenever possible. There were few findings which did not belong nat-
urally to any service offering category. Additionally there were some findings which had
both meaning towards the service offering but also reflection in the wider service delivery
context. There was one such a finding for weaknesses: CS1-E W2. Similar findings for
strengths were CS1-E S1, CS1-D S2, CS1-B S3, CS1-A S3 and CS1-B S5. These were
included in the current state analysis to general service management findings.
These two categories and summaries were used to identify the strengths and weak-
nesses more in detail. This method also helped to illustrate, discuss and communicate
the findings with relevant counterparties and provide more insights to the meanings be-
hind. Next sections will connect the findings to the conceptual framework and discuss
them in more detail.
4.2 Strategy and Environment
In this section, the findings for strategy and environment building block are discussed in
three separate sections. First, there is discussion about the findings for scope. Second,
discussion is continued to priorities. Last, the findings are reported for follow-up issues.
Scope
According to management service, the scope helps to organize and deliver centralized
analysis services to serve two main overall customer needs. First, it helps to gain inde-
pendent status outlook of competitive environment to support strategic decision making
and communication. Second, it helps to receive neutral and analytical view of market
development in different time horizons to support operative decision making. The second
one in particular is making the service scope for OPMA. In OPMA, the service is orga-
nized in the way to maximally fulfill the customers’ needs, and as one customer with
previous experience from other corporations expressed it: “I was very positively surprised
how well coordinated and continuous analysis is provided here compared to my previous
corporate environments” (Customer-7).
One customers’ concern mentioned in the interviews was a potential risk of mixed anal-
ysis messages when serving two different customer groups. Operative customers re-
quire “a real good and bad view of current market situation” (Customer-10), whereas
36 (80)
strategic customers want to have analysis which supports the company’s best interest
for the future. This is related to neutrality of the analyst’s view which was emphasized by
management to be the objective of the analysis outcomes and a preferred style of com-
munication. Based on the results, there seems to be some issue which impacts the ser-
vice experience for “operative” segment customers, especially the customer segments
CS1-E and onwards. This may be due to the fact that in this segment the analyst view is
more based on uncertainty of the market environment rather than the actual power sys-
tem. This may create different points of view as the external market environment is more
heavily involved.
Management mentioned that the service offering scope is not carved in stone but “the
market analysis offering can include whatever analysis where we can see it making ad-
ditional value for business” (Management-9). Positively, this implies the given flexibility
to explore and organize the service delivery and offering freely to meet the customer
needs. On the hand, this may indicate that management has not considered enough the
trade-offs they have to make, and there is a danger of confusing the actual service offer-
ing scope. This may have implications on how easy it is to communicate priorities and
balance the development efforts to correct service areas. Other implication may include
that service offering may grow more on ad-hoc basis rather than based on a consistent
strategy. Finally, as flexibility is highlighted, the focus areas may change quickly and
earlier started initiatives compete with the new ones. This may make it difficult for the
customers and analysts to understand which tasks to concentrate on and even who is
doing those.
The management emphasized heavily that the service should not include any decision
making on behalf of the customers but instead provide focus areas, recommendations
and suggestions. The results of the customer interviews support this, as interviewees
highlight their accountability of Profit and Loss (PnL) and require only a neutral partner
to provide analysis.
Priorities
The management expressed that OPMA prioritizes lie in the operative customers. Inside
this customer segment, the priorities currently are placed according to current value cre-
ation and not by the highest potential of it; even if management sees the need for it. The
37 (80)
main reason is on-going development to improve intra-day and short term analysis ser-
vice. On the management level, the customers share this priority view. At the same time
for the analysts, portfolio managers and traders, who witness this happening, this natu-
rally raises some concern. They have difficulties to understand priorities and therefore
there seems to be a communication challenge for both the customer and analysts’ man-
agement.
Follow-up and Measures
The customers are concerned about the visibility to the service measures and their fol-
low-up. Mid-term forecasting services are not measured and benchmarked in a similar
detailed manner as the short term analysis services. This was considered to decrease
the service quality of forecasting accuracy and to lower the trust for the analysis in sev-
eral different ways. First, the customers accept the fact that the forecasts cannot ever be
exactly correct. Thus, they would like to have more information of the range of forecast
error and the direction of error. This would help them to adjust their own decision making
further. Second, as currently the follow-up is based more on the feelings of correctness
rather than numbers, the trust for the analysts is also lower. As a result, the customers
were more interested to see than feel what the track record of each analyst’s recommen-
dations is. Third, the possibilities to find systematic errors in the forecasts are narrowed
when such a follow-up info is not available.
Additionally, alignment to customer value creation target is mentioned also as a weak-
ness for the service quality. The customers in segments CS1-E and CS1-F feel that there
was not enough discussion about the common target setting between the customers and
the analysts. This decreases the customers’ trust to get support from the analyst, and
enables the customers to argue that not all of the customers are served in a proper
manner. They may also say that even if they are served, the business drivers for analysts
are coming from other target settings.
4.3 Customer Segment
The main customer segments for OPMA are CS1: “Operative”, CS2: “Strategic planning”
and CS3: “Standard”. These segments are illustrated in Table 6 below. Both the cus-
tomer segments and customer groups are used to mean the same thing in this study.
38 (80)
Table 6. The characteristics of main customer segments.
As seen from Table 6, all the segments are briefly presented, but further analysis con-
centrated on customer segment CS1. If some issues were noticed from the other seg-
ment influencing to segment CS1, those were added to the analysis results.
Presently, the management has clear view of the target customer groups. Their intention
is to serve with half-and-half resource allocation two customers segments: operative (CS
1) and strategic (CS 2). Additionally, analysis outcomes are made available and acces-
sible to a larger group of standard customers (CS 3) who receives non-tailored analysis.
Out of these segments, the update of continuous strategic outlook was elevated when
the management was asked about the most valuable service. This implied that mentally
emphasis seemed to be more on the strategic customers than the operative customers.
The operative customers’ interviews indicated the same experience for both resourcing
and the analysts’ efforts allocation. It was stressed in the expressions like: “…clever an-
alysts are noticed quickly but allocated to serve corporate needs…“ and “…for the ana-
lyst it is far more tempting to create a nice strategic market outlook presentation to the

39 (80)
top management than recommend a certain buy or sell decision which may result a mil-
lion loss in a short notice” (Customer-30). This is naturally makes a leadership issue and
derived from chosen service strategy but degrades the customer experience if the value
and importance of the other customer segments are not addressed in the management
communication.
Customer Segment CS 1 – Operative
The focus on the current state analysis was in customer segment CS1 “Operative”, which
is introduced and described in Table 7 below with all related sub-segments.
Table 7. The customer segment CS1 and descriptions of key business problems and time hori-zons.
As seen from Table 7, there are several sub-customer segments in this group. One of
the findings was that it seems natural to divide the customers into sub-segments based
40 (80)
on the time horizons in the focus. This is the way how the customers have organized
their business lines and organizations.
There are different emphases on analysis in different time horizons. The short-term anal-
ysis has the main focus on the power system and behaviors in that environment. On the
other end, mid-term analysis needs to concentrate on uncertainties in the power markets
and global drivers such as commodity prices and political decisions. This leaves it, of
course, to the analysts working for customer segments CS1-C and CS1-E as their most
demanding task since they have to combine the views based on both short- and mid-
term trends.
One additional finding was that some of the analysts are rotating to different tasks and
between different segments. This may be helpful to gain an overall view of different areas
but it also creates several problems or challenges. First, the analyst time for specializa-
tion in the subject is limited. Second, the accountability, commitment and concentration
to certain customers’ targets and results may be weak. Third, segmentation may get
distorted, because the same resources are serving different customers all the time. This
at least requires high concentration to change efficiently and show different behavior to
different roles when the customer segment is changing.
4.4 Customer Needs and Value Experience
There were several needs which were expressed and recorded in analysis. As expected,
the customers expressed a great need for the analysts to express their own view of the
analysis and not just repeat the produced results of calculations and the forecast pro-
cess. Thus, the customers were looking for a more consistent message and view from
analysts.
There are also two newer customer segments growing: CS1-A and CS1-G. Both have
the same typical feature that they do not naturally fall into the same categories with the
needs of the other customer segments. Especially the customer segment CS1-A requires
new skills and tools from the analysts to be able to serve this segment as required. As a
specific feature, this segment requires an extensive level of automation of data flows,
continuous update of forecasts and even minute level response times to the customer
needs.
41 (80)
The customer segment CS1-G is a new business area and may require combination of
efforts from different analyst teams. The customer for this segment expressed also the
unawareness which of the analyst teams should serve them. Nevertheless, the main
need was to receive the case analysis instead of a structured and scheduled analysis
because the business opportunities occur occasionally rather than in a continuous man-
ner. Further on, to serve the customers’ needs in this segment would require dedication
of some analyst resources to the customer business problem. This would enable the
analysts to understand what kind of market behaviors are relevant and later release the
pressure for full-time involvement in the subject.
The mid-term forecasting accuracy as a product feature was the most widely expressed
weakness by the customer segments. However, the customers were not requesting ex-
act individual numbers of prices in the forecast but rather the trends and ranges.
Another main area of frustration was the reachability of the analysts to communicate and
discuss with the customers. On the other hand, there were also positive signs of this
happening occasionally but even further pro-activity was requested. In general, experi-
ences of the morning meeting were positive by the intra-day and short-term customers
but the other customers were not particularly satisfied with the service.
More or less all the customers requested more business understanding from the ana-
lysts. The intra-day customer recognized that the analysts were already in the learning
curve but asked for more activity to learn their new business area and fundamentals
behind. The short-term customers requested further development of the analysts under-
standing of the impact from their forecasts as system inputs to the customer planning
process. The mid-term customers were concerned about the analysts’ knowledge of the
forward markets and requested more market based forecasting instead of relying on
model based methods.
Additionally, there were comments about variation of analysts’ capabilities to communi-
cate their message. However, it was largely appreciated if the analysts showed willing-
ness and proactively suggested something. Then the customers were able to witness
that the analyst had put efforts into the analysis. Therefore, the customers referred sev-
eral times to the case analysis which was seen valuable and would like to occur more
often. On the other hand, the customers experienced that the case analysis still needed
further development by OPMA. Last, the need to visualize and see the track record of
42 (80)
analysis performance was considered useful and could further help to develop the ser-
vice quality and performance.
4.5 Customer Offering
One of the general findings in the customer offering was that the standard service offer-
ing description was difficult to find by the customers and also to describe as content. In
the customer interviews, the persons discussed the same service offering with different
terms, but mixed the terms they used or were somehow unaware of what offering is
available at all. Another general finding was that the customers were unaware of the
offering as a whole. They were looking for more possibilities to easily find what is offered,
what the features of the offering are, who are the contact persons for further information
and where all the material is located.
The short-term customers also required more transparency to the development done by
OPMA. By transparency they meant two issues; the priorities between development
items and the interaction to discuss what certain accomplished development helped.
Direct consultancy
The direct consultancy service in general was considered as one the most important
services by almost all the customer groups. OPMA, however, seems to have a narrow
competence pool for providing this kind of service. This is due to the fact that this is the
most resource intensive and requires certain type of persons for the role. This conclusion
is taken from the current feedback which comes two-folded. First, the amount of current
competent resources is only sufficed for the customer groups for the shorter term trading.
They also provided good feedback for the service such as “it easy to ask for quick com-
ment or question (as they are nearby), they can do small analysis and return shortly”.
Second, there are dedicated analyst resources for the mid-term customers but the com-
petencies, communication possibilities and distance to the analysts were considered as
not fulfilling the current needs of the customers.
Scheduled analyses
Daily morning analysis was offered to all customer segments and produced by the ana-
lyst team working in weekly shifts. This service had a stabilized concept and also track
43 (80)
record of good performance. All customer segments rated it at least on some level as
the strengths of OPMA, some more and some less. It was considered the strongest ser-
vice and the most valuable to the shorter term trading. Their only concern was for incon-
sistency in the forecast message continuation between the analyst shifts.
The mid-term customer segments did not see enough value with morning analysis to
participate actively. Their interest towards the forward markets was not served enough
and they considered receiving the same information from some externally provided daily
reports in a more convenient way. All customers requested more view taking from the
analysts instead of purely information sharing.
The weekly follow-up meeting for analysis performance and development ideas has
something to develop further. Only the short term trading, however, considered it im-
portant; other customer groups were not elevating this service, although the customers
provided feedback on other occasions that they would like to receive more performance
reporting for benchmarking of analysis forecasting accuracy and uncertainties around it.
The weather analysis was seen as an important service. Good characteristics were that
it collected the analysis and forecasts in one place and was easily available without the
need to look from different sources. For improvement, more in-depth own view was re-
quested for weather analysis.
Observations of the scheduled analyses revealed that most of the issues raised by the
customers were indeed relevant. The analysts were maybe rushing too much through
the results and interaction was missing between the analysts and customers. The cus-
tomers were not active either, even though they were having mini-discussions with other
customers about the quality of analysis and the results of forecasts. The analysts
stressed that any feedback would help them to concentrate their analysis on the needed
questions and help to provide more insight into it. As a conclusion, the feedback culture
seemed to have potential for further development.
Forecasts
Presently, OPMA is providing several forecasts to multiple customers groups. This cre-
ates challenges to OPMA to concentrate on each of those with the required intensity.
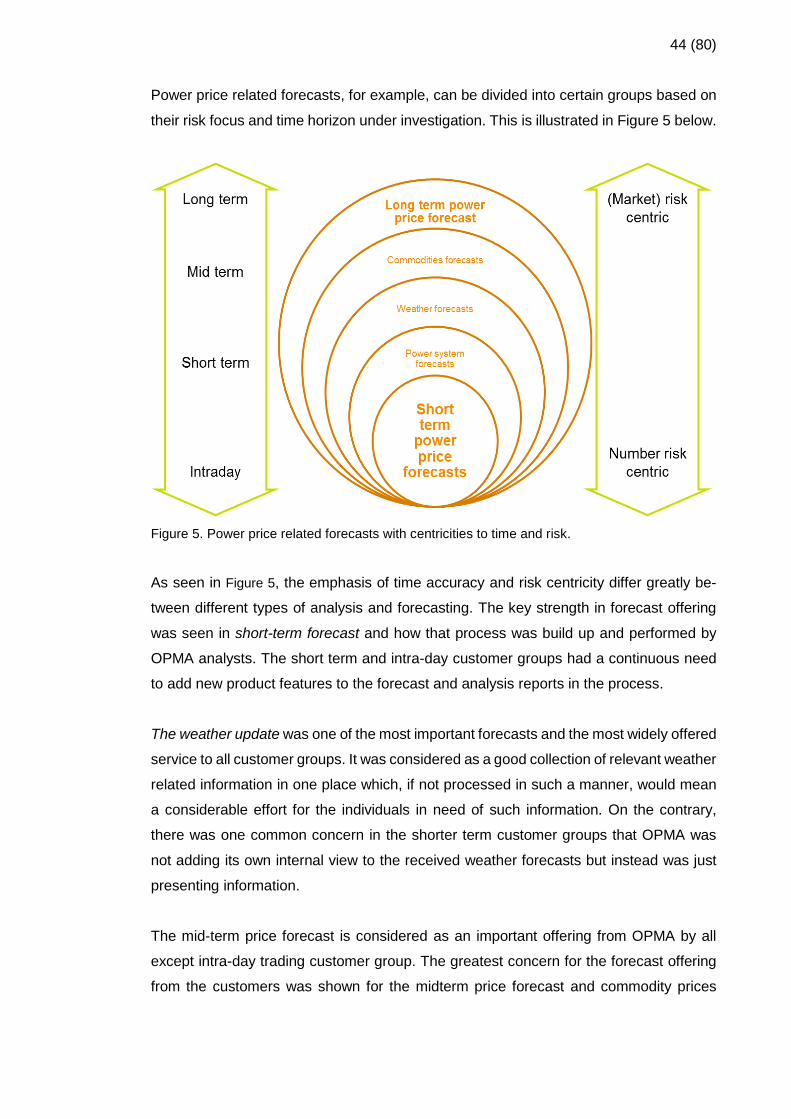
44 (80)
Power price related forecasts, for example, can be divided into certain groups based on
their risk focus and time horizon under investigation. This is illustrated in Figure 5 below.
Figure 5. Power price related forecasts with centricities to time and risk.
As seen in Figure 5, the emphasis of time accuracy and risk centricity differ greatly be-
tween different types of analysis and forecasting. The key strength in forecast offering
was seen in short-term forecast and how that process was build up and performed by
OPMA analysts. The short term and intra-day customer groups had a continuous need
to add new product features to the forecast and analysis reports in the process.
The weather update was one of the most important forecasts and the most widely offered
service to all customer groups. It was considered as a good collection of relevant weather
related information in one place which, if not processed in such a manner, would mean
a considerable effort for the individuals in need of such information. On the contrary,
there was one common concern in the shorter term customer groups that OPMA was
not adding its own internal view to the received weather forecasts but instead was just
presenting information.
The mid-term price forecast is considered as an important offering from OPMA by all
except intra-day trading customer group. The greatest concern for the forecast offering
from the customers was shown for the midterm price forecast and commodity prices
45 (80)
forecasts. The challenges included: difficulties to connect the short-term and mid-term
forecasts together, deviations for the market prices, inadequate transparency of bench-
mark performance follow-up for the customers, the current forecast model infeasibility
and inability to from OPMA to provide a reasoned own view for mid-term forecasts.
The commodity price forecasts are not provided by OPMA but by another analyst team.
Consequently, co-operation between these teams may have something to improve be-
cause now it was seen to impact the OPMA mid-term forecasting results in a negative
way.
Finally, the intra-day trading customer group was separate and newer than the other
customer segments and it had multiple development activities for analysis. These devel-
opment activities were related typically to product features with the need to visualize
information and automate forecasting to provide a more continuous flow of information.
Analyses
The need for case analysis was expressed by the short-term and mid-term customer
groups as one of the most valuable service offerings out of all the analyses provided.
However, there were also concerns for these analyses as for the too low activity and
even the availability of it for the customers. Proactive behavior with case analyses was
seen to improve analysis performance as it shower the analysts’ concentration on the
topic and customer targets. To compare, the other provided analyses were considered
as secondary or used by only a single customer segment. The new needs for analyses
were also expressed in relation to the intra-day market follow-up and forward analysis.
To conclude, these findings may indicate the need to re-evaluate service offering profit-
ability and possibly adjust and lean it, if confirmed.
Market Outlooks and Information Service
The monthly market outlook product was considered relevant for the mid-term customer
segment. However, the outlook may have less of importance to the customer segment
than what OPMA emphasized. The analysts considered it as adding significant work load
but the customers expressed some need for the product. Otherwise, there were not rel-
evant concerns for the service offering in this group.
46 (80)
Out of the information services provided by OPMA, the external benchmark forecast was
considered important for the customers and used actively. This forecast was a valuable
source to benchmarking between different forecasts and enabled the customers to eval-
uate decision making from various perspectives. The analysts were advised to concen-
trate more attention on explaining the differences between the forecasts and reason their
own views more.
4.6 Key Resources
The key resources to enable the service delivery were identified as people, models, data
and IT. The importance of the people and models as the key resources varied based on
the time horizon for analyses. The people, meaning the analysts, were considered to
have greater value for the service delivery in the mid-term time horizon, whereas the
models were seen as the key enablers to create short term analyses. Correctness and
access to the timely data was considered relevant in all time horizons. IT was considered
as the key resource to provide the service.
The analysts had the key strengths in modeling and engineering skills which are unique
to the company and a result of significant development effort. When these skills were
combined with the experience and company internal network, it was considered to pro-
vide a unique set of resources which were difficult to imitate by competitors. The man-
agement also emphasized the need to have better networks to the external environment.
The analysts were lacking economic skills which would enable them to be more market
driven. Additionally, more emphasis on clear communication and soft skills were consid-
ered as an additional development area. Even though the analysts had these skills, there
was variance in their level, which showed in the customer survey results when the indi-
vidual analyst performance was evaluated.
More weaknesses for the key resources were noticed in the in-house analysis tools
which were old and not considerable easy to maintain and change. This may be due to
several persons developing these tools over the time period and their lack of IT skills to
concentrate on creating a robust IT architecture. As there is a great need for market data
to enable analysis, stability of data platform was considered an issue which significantly
hindered performance of analysis. It was considered to take time from the analyst work
47 (80)
since information was not immediately available or the systems were too slow. As a re-
sult, the quality issues with data led to deviations in the trust for information and created
frustration for the analysts to deliver their work.
4.7 Key Activities
The key activities consist of the processes and practices which make the customer value
proposition repeatable and scalable. The analysts and management particularly stressed
the importance of the short term analysis service as one of the key activities. This was
seen as a unique combination of activities which, when together, created the repetitive
and scalable practices for performance. The performance of these activities was consid-
ered to be on a good level. There were some concerns for the process efficiency as more
steps were included over the time and granularity of the outcomes was scaled on a more
detailed level.
The HR processes of developing the people and rewarding and compensation were con-
sidered to have challenges. The analysts expressed the need for rotation of competen-
cies to maintain the interest to work and not remain in the same position over the time.
There were seen siloes for knowledge about different models, tools and system compe-
tencies also due to the rotation issue. Another issue related to more a robust rotation
process in place was to secure enough competent persons for the key activities.
Development process for the service changes was considered as the key activity, and a
more simple IT structure was specifically requested. Simplicity would enable faster
changes to the existing tools and data. Continuous change in the landscape of analysis
was pointed to as one particular driver in the development. This also had close relation-
ship to how management wanted to see Market Analysis as an organization to develop
further. The organization was considered as the one based on meetings, even though
its customers and market environment were more event based.
4.8 Summary of Strengths and Weaknesses in the Current CVP
The summary of the current state analysis for customer segment CS1 is presented in
Table 8 below.
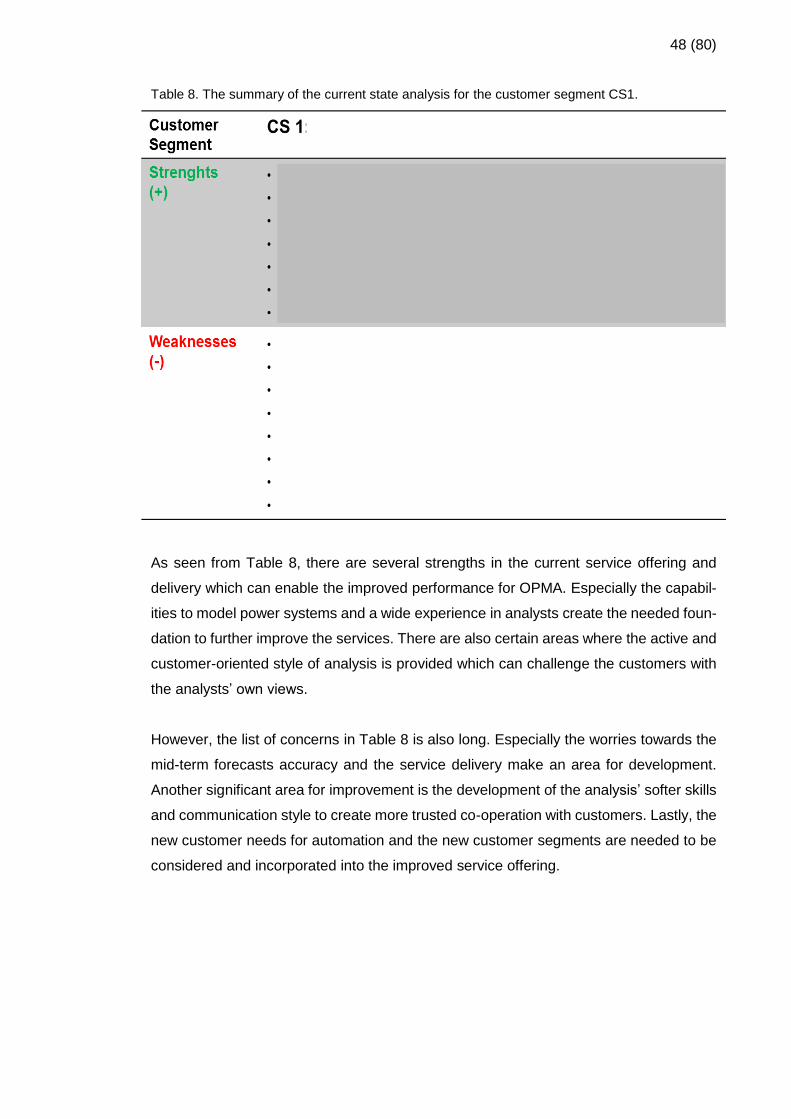
48 (80)
Table 8. The summary of the current state analysis for the customer segment CS1.
As seen from Table 8, there are several strengths in the current service offering and
delivery which can enable the improved performance for OPMA. Especially the capabil-
ities to model power systems and a wide experience in analysts create the needed foun-
dation to further improve the services. There are also certain areas where the active and
customer-oriented style of analysis is provided which can challenge the customers with
the analysts’ own views.
However, the list of concerns in Table 8 is also long. Especially the worries towards the
mid-term forecasts accuracy and the service delivery make an area for development.
Another significant area for improvement is the development of the analysis’ softer skills
and communication style to create more trusted co-operation with customers. Lastly, the
new customer needs for automation and the new customer segments are needed to be
considered and incorporated into the improved service offering.
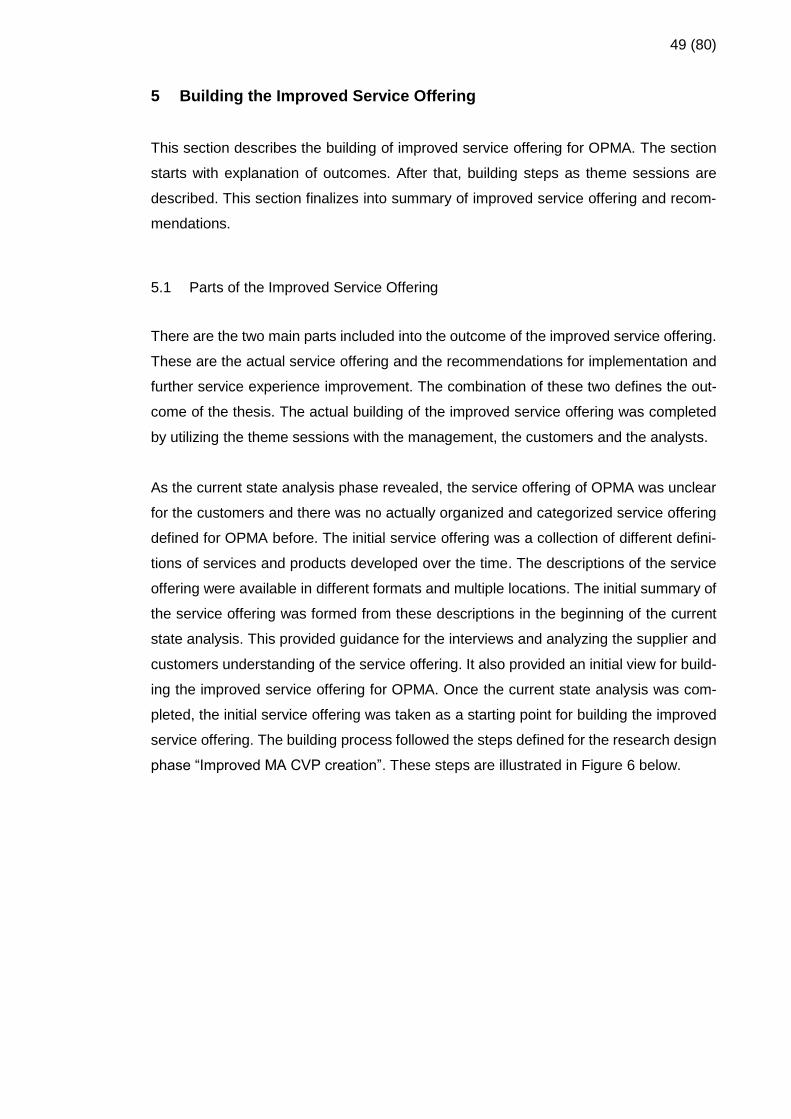
49 (80)
5 Building the Improved Service Offering
This section describes the building of improved service offering for OPMA. The section
starts with explanation of outcomes. After that, building steps as theme sessions are
described. This section finalizes into summary of improved service offering and recom-
mendations.
5.1 Parts of the Improved Service Offering
There are the two main parts included into the outcome of the improved service offering.
These are the actual service offering and the recommendations for implementation and
further service experience improvement. The combination of these two defines the out-
come of the thesis. The actual building of the improved service offering was completed
by utilizing the theme sessions with the management, the customers and the analysts.
As the current state analysis phase revealed, the service offering of OPMA was unclear
for the customers and there was no actually organized and categorized service offering
defined for OPMA before. The initial service offering was a collection of different defini-
tions of services and products developed over the time. The descriptions of the service
offering were available in different formats and multiple locations. The initial summary of
the service offering was formed from these descriptions in the beginning of the current
state analysis. This provided guidance for the interviews and analyzing the supplier and
customers understanding of the service offering. It also provided an initial view for build-
ing the improved service offering for OPMA. Once the current state analysis was com-
pleted, the initial service offering was taken as a starting point for building the improved
service offering. The building process followed the steps defined for the research design
phase “Improved MA CVP creation”. These steps are illustrated in Figure 6 below.
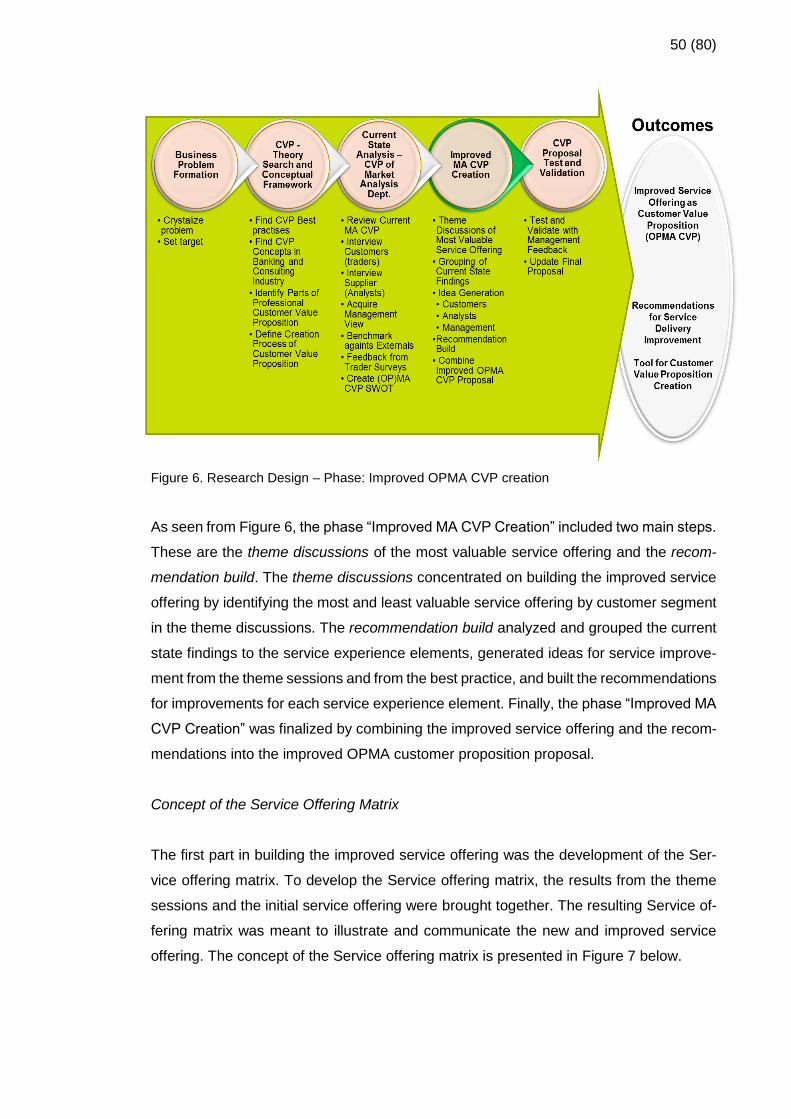
50 (80)
Figure 6. Research Design – Phase: Improved OPMA CVP creation
As seen from Figure 6, the phase “Improved MA CVP Creation” included two main steps.
These are the theme discussions of the most valuable service offering and the recom-
mendation build. The theme discussions concentrated on building the improved service
offering by identifying the most and least valuable service offering by customer segment
in the theme discussions. The recommendation build analyzed and grouped the current
state findings to the service experience elements, generated ideas for service improve-
ment from the theme sessions and from the best practice, and built the recommendations
for improvements for each service experience element. Finally, the phase “Improved MA
CVP Creation” was finalized by combining the improved service offering and the recom-
mendations into the improved OPMA customer proposition proposal.
Concept of the Service Offering Matrix
The first part in building the improved service offering was the development of the Ser-
vice offering matrix. To develop the Service offering matrix, the results from the theme
sessions and the initial service offering were brought together. The resulting Service of-
fering matrix was meant to illustrate and communicate the new and improved service
offering. The concept of the Service offering matrix is presented in Figure 7 below.

51 (80)
Figure 7. Concept of the improved service offering matrix.
The concept of the service offering matrix, presented in Figure 7, is developed from the
best practice of Anderson & Narus (2004) to visualize the service offering by showing
the base product and complementary product. Instead of illustrating the service features
provided to each customer segment, the created matrix presents the most and least val-
uable service offering by segment.
The matrix has several features. First, matrix helps to organize services and products
(Service) into meaningful categories (Service Categories) which can hold similar type of
services or services with applicable logic arranged. Second, all customers (Customer
Segment) are presented in the same matrix. This allows OPMA to identify relevant cus-
tomer groups with their needs and respond to possible changes. Third, the most valuable
parts of matrix may be the value importance indicators and service focus groups.
The value importance indicator expresses the customer view point on a particular service
importance according to their own business needs. Additionally, it holds information
about the least valuable service, the service which are not used at, all and possible new
needs indicated by the customer.
The service focus groups illustrate service targeting meant by OPMA as service provider
in two ways. When the customer belongs to a focus group of the particular service, it
means that the service features and performance is optimized for that customer. The
same service can be served to the other customers as optional focus. This is due to the
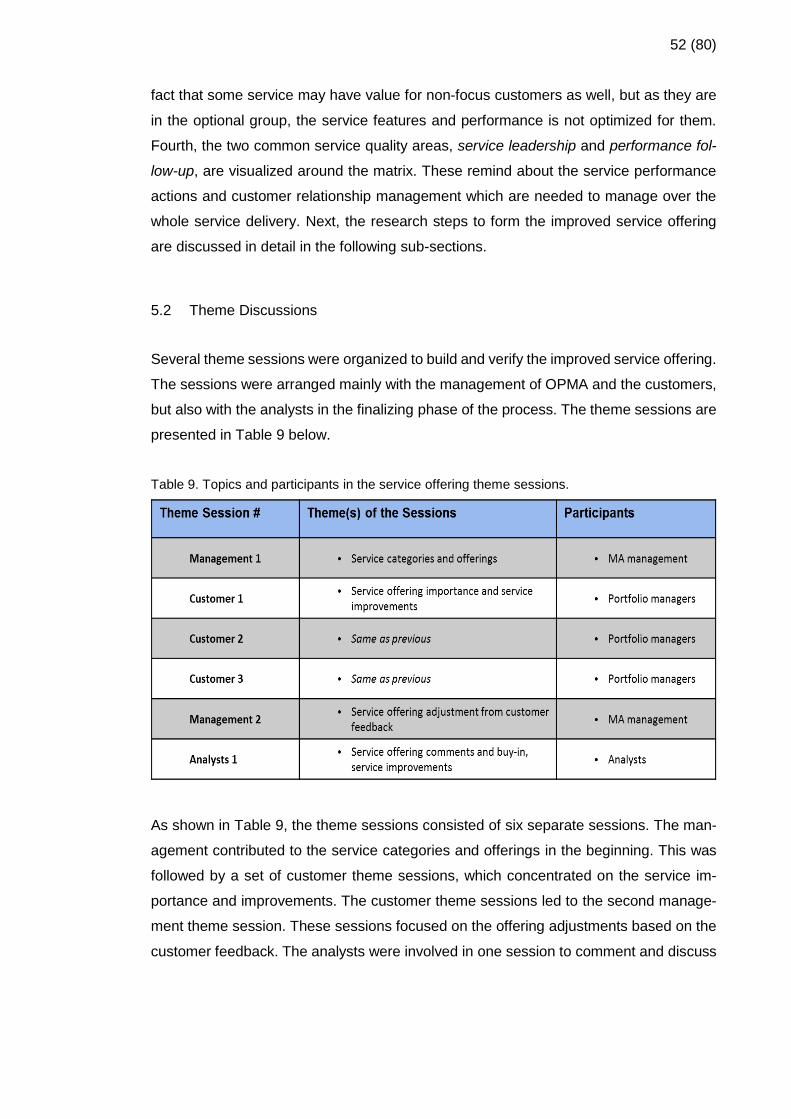
52 (80)
fact that some service may have value for non-focus customers as well, but as they are
in the optional group, the service features and performance is not optimized for them.
Fourth, the two common service quality areas, service leadership and performance fol-
low-up, are visualized around the matrix. These remind about the service performance
actions and customer relationship management which are needed to manage over the
whole service delivery. Next, the research steps to form the improved service offering
are discussed in detail in the following sub-sections.
5.2 Theme Discussions
Several theme sessions were organized to build and verify the improved service offering.
The sessions were arranged mainly with the management of OPMA and the customers,
but also with the analysts in the finalizing phase of the process. The theme sessions are
presented in Table 9 below.
Table 9. Topics and participants in the service offering theme sessions.
As shown in Table 9, the theme sessions consisted of six separate sessions. The man-
agement contributed to the service categories and offerings in the beginning. This was
followed by a set of customer theme sessions, which concentrated on the service im-
portance and improvements. The customer theme sessions led to the second manage-
ment theme session. These sessions focused on the offering adjustments based on the
customer feedback. The analysts were involved in one session to comment and discuss
53 (80)
of the offering and improvements. Next, each of the theme sessions are described and
discussed in the following sub-sections.
Theme Session - Management 1
The first supplier session focused on identifying the key services categories and the of-
fering bundles from the supplier perspective. The service categories generally remained
as in initial service offering because those were considered logical groups for offering.
The changes were introduced to continuously happening analysts’ sessions which earlier
were called “Meetings”. Those services were introduced in the new offering as “Sched-
uled Analyses”. This was more descriptive expression to the offering. Service category
“Direct Contacts” was also re-introduced as “Direct Consultancy” to better describe the
nature of offering as advisory service.
The offering bundles were scrutinized in two ways. First, the offering bundles for the
forecasts were cleaned to include only final customer product which was the forecast
outcome and not presenting underlying sub-forecasts as service offering. This change
was influenced by analyzing that the service offering in that particular category was wide
and difficult to communicate to the customers. Additionally, when the customers utilized
the main forecast product, they also needed to use all the related sub-forecasts. Second,
all the offering naming were checked to be more descriptive and capturing the essence
of value to customer. Some changes were made to further unify the naming.
The customer sub-segments were concluded to be as defined earlier with the time-based
segmentation. That segmentation was seen to distinct separate customer groups in a
proper way. The segments were also in line with the customer business processes,
OPMA team structures, responsibilities and systems. There was not seen necessity to
change the segmentation.
Mapping of the customer offering to the customer segments was updated according to
the new offering with fewer products. In the same mapping exercise, both the focus and
optional groups for the offering were introduced. In the matrix, when the customer was
included to the focus group of the offering, it illustrated that the offering features and
delivery were adjusted mainly for them. The optional group demonstrated that the offer-
ing is served to those customers too, but the offering may not be fine-tuned for their
purposes.
54 (80)
As the outcome, the service offering with the pruned service categories and identified
customer segments was created. Additionally, with the focus groups identified, this sum-
mary served as an input to the customer theme sessions.
Theme Sessions - Customer 1, 2 and 3
After Supplier theme session 1, the customer’s feedback was requested for two main
themes. These themes were the verification of the service offering importance and the
ideation of the service improvements. The latter served as an input to the recommenda-
tion outcome of this study. Three separate theme sessions were organized for the cus-
tomers with the same agenda as not all the customers were not possible to meet at the
same time.
The customers were asked to provide their comments and confirmation to the previously
updated service offering. The customers needed to indicate from their perspective the
most and least valuable offering, the not used offering, and the possible new needs which
may not have been noticed earlier in the current state analysis. Based on the results
from the current state analysis, there were pre-indications in the theme session material
of the most valued offerings. This helped the customers to focus on those without need-
ing to start their commenting in the session from the blank initial offering. This session
provided a good overview of both the most important service offerings to each customer
and a view of the most widely used services. The customers also looked at the focus
groups. None of the focus group markings were removed but instead some areas re-
ceived more markings. For example, the customers ranked the weather analyses as
more broadly needed and more important than it was expected initially. Also the mid-
term forecast offering focus was required to expand to cover also the short term custom-
ers.
Additionally, the customers were asked to review the reported strengths and weaknesses
by the customer segment from the current state analysis. The purpose was to collect
further customer ideas to improve the service offering. These customer reflections were
later used to build the recommendations for the service experience improvements. The
ideation was arranged as a shared round table discussion and ideation. The customers
commented on some of the strengths and weaknesses by requiring either to move more
strengths to weaknesses or remove some strengths at all. It was possible, however, to
recognize some bias behind some of their motivations. Therefore not all of the customer

55 (80)
comments were accepted in their initial form, but they were later discussed and evalu-
ated against the whole study. The main ideas concentrated on the improvements for the
mid-term forecast and input data to that forecasting process. Additionally, suggestions
for a more systematic statistical follow-up reporting on the forecast accuracy were high-
lighted. Last, the customers proposed some options for the development of priority and
communication of the achievements.
Finally, the customers were presented with the map of strengths and weaknesses to the
service offering. The target was to collect the customer reflection and evaluate if the
correct areas in the service offering were highlighted. As there were small groups of
interviews made within each sub-segment, some areas may have become over or un-
deremphasized. As a result of this task, the importance of fuel forecasting in the service
offering was raised. This was accompanied with the requirements for the mid-term fore-
cast to include more focus on the market price levels and averages instead of individual
prices.
As a summary, the three customer theme sessions reported the importance of the ser-
vice offering to each customer segment and provided several suggestions for the service
experience improvement.
Theme Session - Management 2
The second management theme session focused on reviewing and adjusting the service
offering based on the customer feedback for the importance. The backgrounds and mo-
tivations for the importances indicated by the customers were clarified for the manage-
ment. Additionally, the new customer needs were introduced and discussed with the
management. As a decision, the new needs were taken to the service offering but indi-
cated separately as those needed further definitions and discussions with the customers.
Another topic for the theme session was to discuss and decide how to integrate more
generic findings from the current state analysis to the improved service offering. The
main subjects were the performance follow-up and service leadership. The performance
follow-up included reporting to the customers on the service offering performance and
the internal OPMA service quality reporting. The conclusions from the discussion were
that the performance follow-up was added as a general exercise to cover all the service
offering parts because each of them has influence to the customers. Additionally, this
way the performance follow-up was able to provide feedback to customers both on the
56 (80)
quality features of the service offering and the overall service experience level. There
was noticed the need for further development of the content of the customer follow-up
sessions which earlier had not been enough popular. Last, the service leadership was
added to the service offering to indicate the management involvement to the customers
and to provide a channel to manage the service relationship with the customer segments
and communicate the service priorities. This may results in a more structured discussion
on the annual level of the customer expectations, the OPMA capabilities and the com-
mon targets for the future.
The main results of the second management theme session were the collection of the
management views on the improved service offering which was formulated based on the
customers’ feedback. This session provided the possibilities to finalize the main parts of
the improved service offering.
Theme Session - Analysts 1
Once the improved service offering was updated, it was also introduced further to the
analysts. The main topic was to get buy-in from the analysts to commit to the new offer-
ing, provide feedback to the new focus areas and the current performance with the ser-
vice experience. The session was also capturing the analysts’ ideas for the actual imple-
mentation of the improved service offering.
To summarize, the session provided the following main outcomes. First, it concentrated
on the discussion how the analysts can improve the service delivery, more specifically
the communication of analyst messages. This provided ideas for recommendations
which could help the analysts to better utilize their soft skills and involve customers to a
more proactive dialogue with them. Another conclusion was that there is continuous work
needed from the analysts to build and maintain the reputation and trust for the analyst
messages. This conclusion provided feedback to develop recommendations further.
5.3 Service Offering for OPMA as Customer Value Proposition
The improved service offering for OPMA was implemented into the service offering ma-
trix using the logic which was described in the previous sections. The updated service
offering is introduced in Table 10 below.
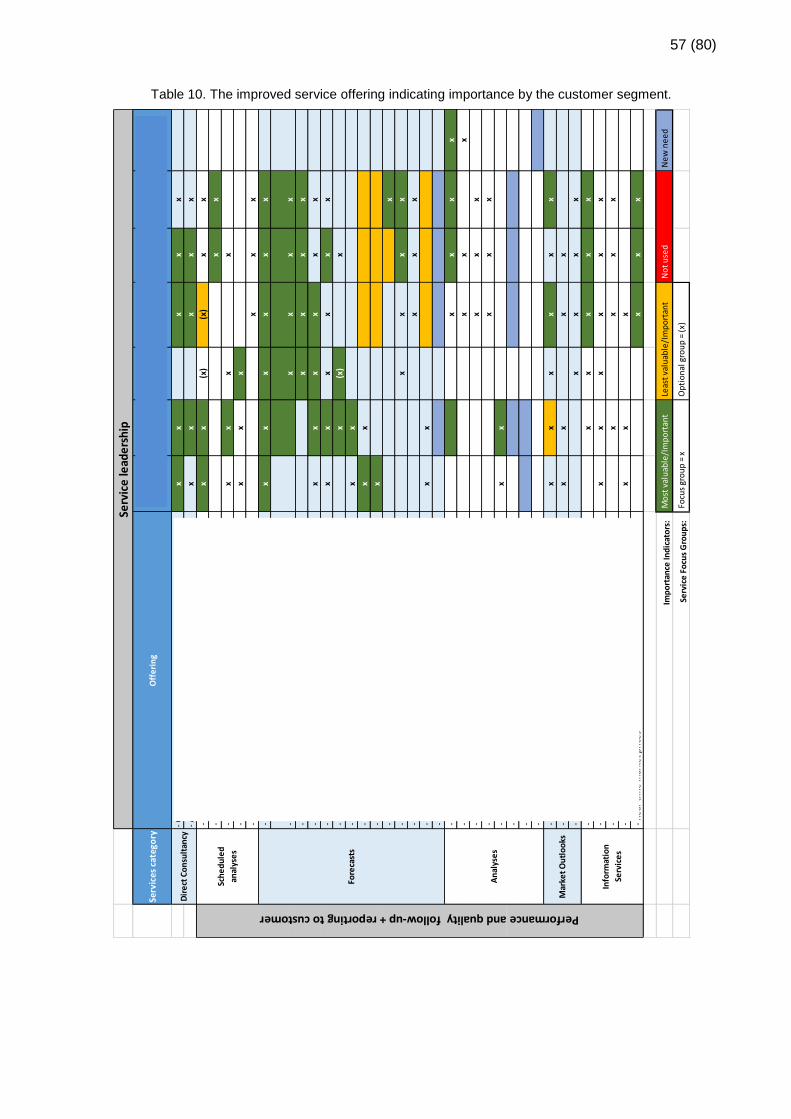
57 (80)
Table 10. The improved service offering indicating importance by the customer segment.
Serv
ices
cat
ego
ryO
ffe
rin
g
CS1
-A
Intr
aday
CS1
-B S
ho
rt
Term
CS1
-C M
id
Term
Ph
ys.
CS1
-D T
rad
ing
De
sk
CS1
-E1
Mid
Term
De
l.
CS1
-E2
Mid
Term
He
gd.
CS1
-E3
Ori
gin
atio
n
- C
on
tin
ou
s vi
ew
- P
rese
nse
in t
rad
ing
de
sk (
face
-to
-fac
e -
imm
ed
iate
re
sp.)
xx
xx
x
- A
d h
oc
qu
est
ion
s (m
ail,
me
ssag
ing,
etc
. - w
he
n a
vail
able
)x
xx
xx
- D
aily
sh
ort
te
rm m
ee
tin
g at
8.2
0 C
ETx
x(x
)(x
)x
x
- F
inan
cial
we
ekl
y ta
ctic
al m
ee
tin
g (p
arti
cip
atio
n)
xx
- W
ee
kly
foll
ow
-up
me
eti
ng
(an
alys
is p
erf
orm
ance
, de
velo
pm
en
t id
eas
)x
xx
x
- P
hys
ical
Tac
tics
me
eti
ng
(par
tici
pat
ion
)x
xx
- D
aily
me
eti
ng
for
ad h
oc
issu
es
and
cas
es
mid
te
rm h
ori
zon
11:
00 C
ETx
xx
- W
eat
he
r u
pd
ate
s an
d b
log
xx
xx
xx
- M
id t
erm
pri
ce f
ore
cast
+ f
un
dam
en
tals
(b
ase
an
d r
ange
s)x
xx
x
- C
O2
fore
cast
xx
xx
- A
rea
spo
t p
rice
fo
reca
sts
(bas
e a
nd
ran
ges)
xx
xx
xx
- S
po
t an
d f
ou
r w
ee
k p
rice
fo
reca
sts
+ fu
nd
ame
nta
lsx
xx
xx
x
- F
ron
t m
on
th s
po
t fo
reca
stx
(x)
x
- In
flo
w f
ore
cast
(fu
nd
ame
nta
ls, p
art
of
pri
ce f
cst)
xx
- In
trad
ay p
rice
se
nsi
tivi
tie
sx
x
- In
trad
ay s
ign
al f
ore
cast
x
- F
ue
l fo
reca
sts
- G
as a
nd
Oth
er
x
- F
ue
l fo
reca
sts
- C
oal
xx
xx
- P
rice
sp
read
to
ad
jace
nt
mar
kets
(EE
X)
xx
x
- In
tra
day
vo
lum
e in
dic
atio
ns
& p
rice
fo
reca
sts
xx
- P
rice
fo
reca
st E
EX
- C
ase
an
alys
is (
Co
mm
itm
en
t, c
on
vict
ion
cas
e a
nal
ysis
)x
xx
x
- E
lce
rt a
nal
ysis
(m
arke
t vi
ew
)x
xx
- C
on
tin
en
tal E
uro
pe
an p
ow
er
mar
ket
xx
x
- D
istr
ibu
tio
n o
f re
leva
nt
ext
ern
al m
arke
t an
alys
es
rep
ort
sx
xx
- S
yste
m p
rice
se
nsi
tivi
ty a
nal
ysis
xx
- F
orw
ard
an
alys
is (
jou
rne
y to
re
aliz
atio
n)
- M
arke
t fo
llo
w-u
p a
nd
pat
tern
s
- G
oO
an
alys
is
- M
on
thly
mar
ket
Ou
tlo
ok
(fu
ture
)x
xx
xx
x
- D
aily
mar
ket
ou
tlo
ok
lett
er
xx
xx
- M
acro
-eco
no
mic
ou
tlo
ok
xx
xx
- E
xte
rnal
mar
ket
dat
a, w
eat
he
r an
d p
rice
fo
reca
stx
xx
xx
- S
yste
m a
cce
ss t
o f
un
dam
en
tal d
ata
on
Eu
rop
e/N
ord
ic m
arke
ts
xx
xx
xx
- N
ew
s se
rvic
es
xx
xx
- D
eta
ile
d p
ow
er
syst
em
info
- m
apx
xx
- R
eal
-tim
e m
arke
t p
rice
sx
xx
Imp
ort
ance
Ind
icat
ors
:
Mo
st v
alu
able
/Im
po
rtan
t L
eas
t va
luab
le/I
mp
ort
ant
Ne
w n
ee
d
Serv
ice
Fo
cus
Gro
up
s:
No
t u
sed
Fo
cus
gro
up
= x
Op
tio
nal
gro
up
= (
x)
Serv
ice
lead
ers
hip
Dir
ect
Co
nsu
ltan
cy
Performance and quality follow-up + reporting to customer
Sch
ed
ule
d
anal
yse
s
Fore
cast
s
An
alys
es
Mar
ket
Ou
tlo
oks
Info
rmat
ion
Serv
ice
s
58 (80)
As illustrated in Table 10, the service categories and services are re-organized, re-
named and scrutinized with theme sessions results. On the left side of the matrix, there
are service categories and underlying service offering groups. Each significant customer
segment is marked in the columns on top of the matrix.
The matrix is further re-arranged by the importance of offering to the customers. The
importance has two meanings here. First, there is the importance in terms of how widely
the same service is shared by multiple customer segments. The most widely shared
offering in the service category is placed on top of the matrix. This is the horizontal axis
of the matrix. Second, the importance of certain offering to certain the customer segment
is highlighted and presented in order preceding the other service offering. This is the
vertical axis of the matrix. The most widely shared and the most important service offer-
ings are visualized in green color. Further on, the same service can be the most im-
portant to one customer segment and, at the same time, the least important to another.
The least importance is presented with yellow color in the matrix. Last, the remaining
service offerings and the new needs from the customers are listed at the bottom of each
service category. The new needs are marked with blue color and the remaining service
offerings are un-marked.
To conclude, the main results as compared to the previous service offering include the
updated focuses of the service offering to the customer needs, clearer indication of the
customer segments to be served, cleaning and combination of services and re-naming
the service categories for better communication. OPMA also has easier ways to identify
how wide (horizontal axis) and deep (vertical axis) the customer needs are.
5.4 Recommendations for Service Experience and Quality Improvement
Building the recommendations started by analyzing the strengths and weaknesses of the
current state analysis in more depth. The important task was to categorize the findings
to the service experience elements. As Grönroos (2008) defined, a service offering in S-
D logic includes service, products and interactions. Therefore, the two natural elements
of service experience are product features and interactions. The third service experience
element was presented to gather the findings which refused to fall naturally into either of
the previous elements. This was introduced as service leadership element to express
the overall issues of service relationship with the customer and service performance to
the management. The service leadership element has a connection to “Strategy and
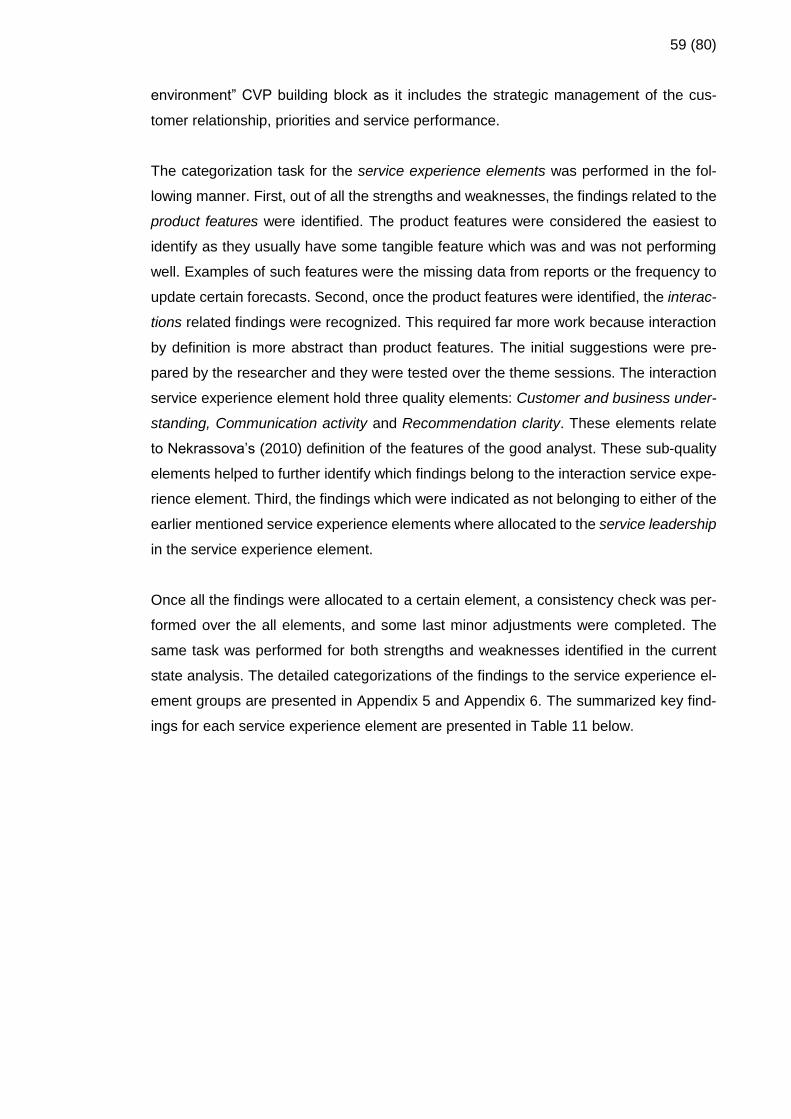
59 (80)
environment” CVP building block as it includes the strategic management of the cus-
tomer relationship, priorities and service performance.
The categorization task for the service experience elements was performed in the fol-
lowing manner. First, out of all the strengths and weaknesses, the findings related to the
product features were identified. The product features were considered the easiest to
identify as they usually have some tangible feature which was and was not performing
well. Examples of such features were the missing data from reports or the frequency to
update certain forecasts. Second, once the product features were identified, the interac-
tions related findings were recognized. This required far more work because interaction
by definition is more abstract than product features. The initial suggestions were pre-
pared by the researcher and they were tested over the theme sessions. The interaction
service experience element hold three quality elements: Customer and business under-
standing, Communication activity and Recommendation clarity. These elements relate
to Nekrassova’s (2010) definition of the features of the good analyst. These sub-quality
elements helped to further identify which findings belong to the interaction service expe-
rience element. Third, the findings which were indicated as not belonging to either of the
earlier mentioned service experience elements where allocated to the service leadership
in the service experience element.
Once all the findings were allocated to a certain element, a consistency check was per-
formed over the all elements, and some last minor adjustments were completed. The
same task was performed for both strengths and weaknesses identified in the current
state analysis. The detailed categorizations of the findings to the service experience el-
ement groups are presented in Appendix 5 and Appendix 6. The summarized key find-
ings for each service experience element are presented in Table 11 below.
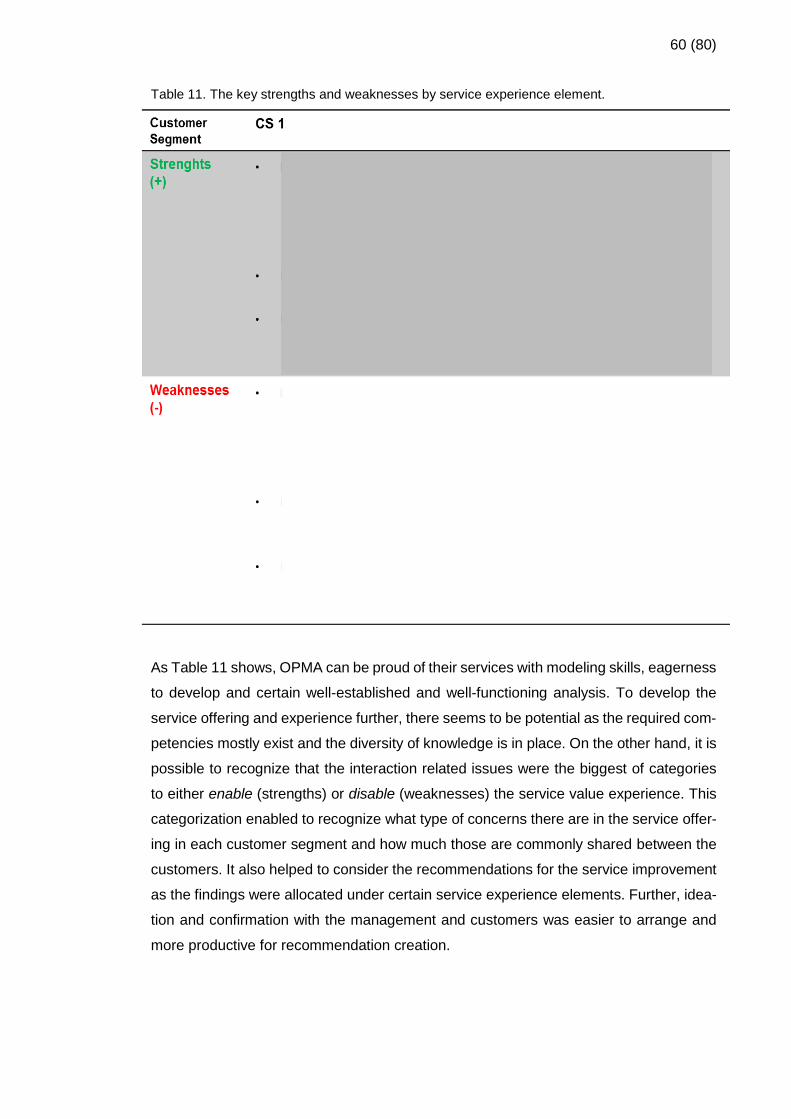
60 (80)
Table 11. The key strengths and weaknesses by service experience element.
As Table 11 shows, OPMA can be proud of their services with modeling skills, eagerness
to develop and certain well-established and well-functioning analysis. To develop the
service offering and experience further, there seems to be potential as the required com-
petencies mostly exist and the diversity of knowledge is in place. On the other hand, it is
possible to recognize that the interaction related issues were the biggest of categories
to either enable (strengths) or disable (weaknesses) the service value experience. This
categorization enabled to recognize what type of concerns there are in the service offer-
ing in each customer segment and how much those are commonly shared between the
customers. It also helped to consider the recommendations for the service improvement
as the findings were allocated under certain service experience elements. Further, idea-
tion and confirmation with the management and customers was easier to arrange and
more productive for recommendation creation.
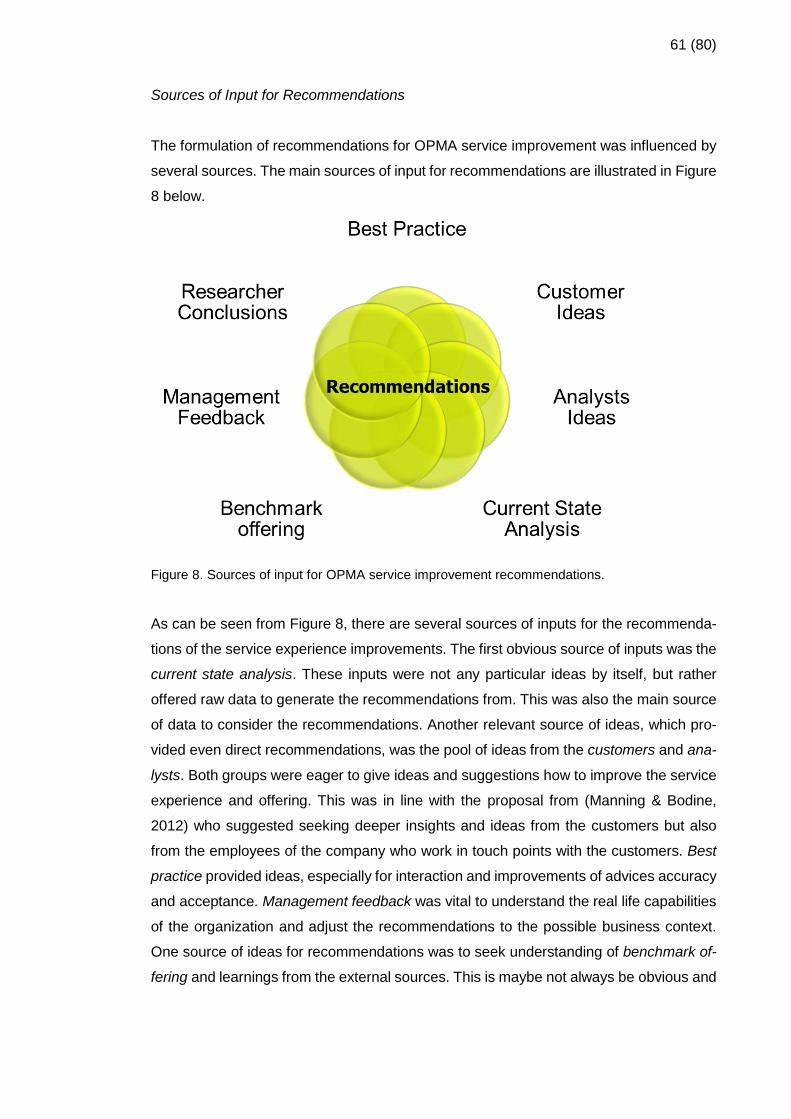
61 (80)
Sources of Input for Recommendations
The formulation of recommendations for OPMA service improvement was influenced by
several sources. The main sources of input for recommendations are illustrated in Figure
8 below.
Figure 8. Sources of input for OPMA service improvement recommendations.
As can be seen from Figure 8, there are several sources of inputs for the recommenda-
tions of the service experience improvements. The first obvious source of inputs was the
current state analysis. These inputs were not any particular ideas by itself, but rather
offered raw data to generate the recommendations from. This was also the main source
of data to consider the recommendations. Another relevant source of ideas, which pro-
vided even direct recommendations, was the pool of ideas from the customers and ana-
lysts. Both groups were eager to give ideas and suggestions how to improve the service
experience and offering. This was in line with the proposal from (Manning & Bodine,
2012) who suggested seeking deeper insights and ideas from the customers but also
from the employees of the company who work in touch points with the customers. Best
practice provided ideas, especially for interaction and improvements of advices accuracy
and acceptance. Management feedback was vital to understand the real life capabilities
of the organization and adjust the recommendations to the possible business context.
One source of ideas for recommendations was to seek understanding of benchmark of-
fering and learnings from the external sources. This is maybe not always be obvious and
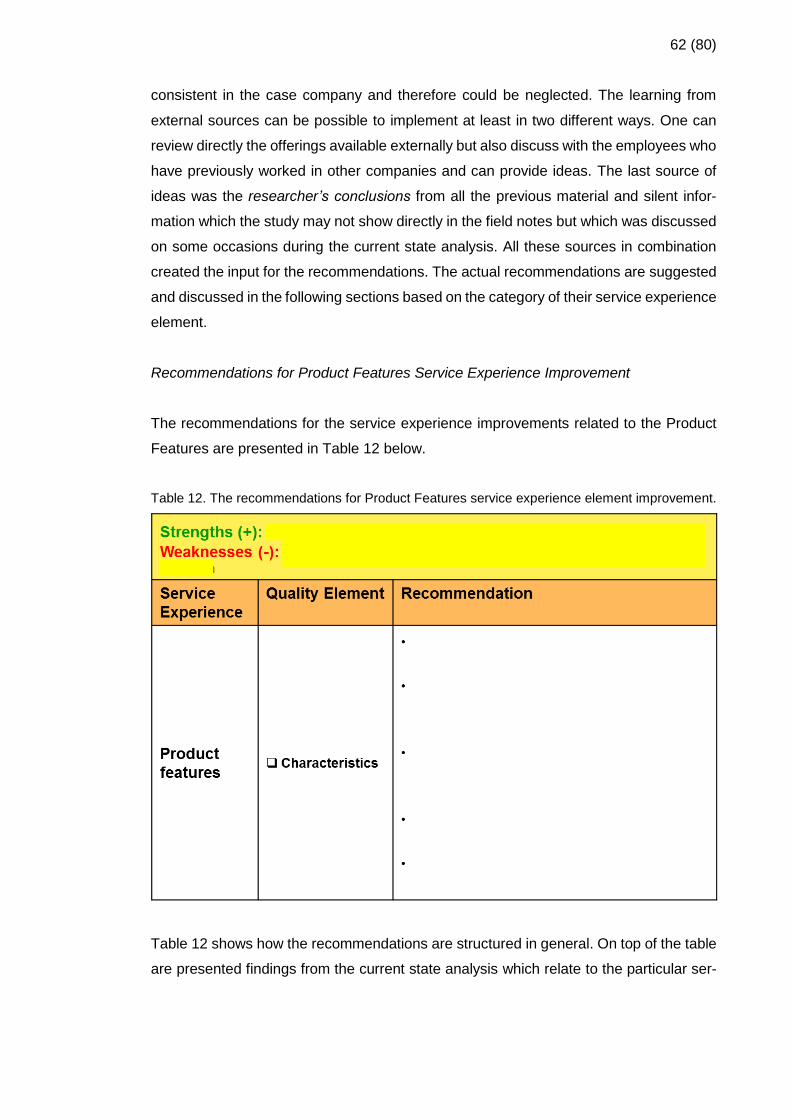
62 (80)
consistent in the case company and therefore could be neglected. The learning from
external sources can be possible to implement at least in two different ways. One can
review directly the offerings available externally but also discuss with the employees who
have previously worked in other companies and can provide ideas. The last source of
ideas was the researcher’s conclusions from all the previous material and silent infor-
mation which the study may not show directly in the field notes but which was discussed
on some occasions during the current state analysis. All these sources in combination
created the input for the recommendations. The actual recommendations are suggested
and discussed in the following sections based on the category of their service experience
element.
Recommendations for Product Features Service Experience Improvement
The recommendations for the service experience improvements related to the Product
Features are presented in Table 12 below.
Table 12. The recommendations for Product Features service experience element improvement.
Table 12 shows how the recommendations are structured in general. On top of the table
are presented findings from the current state analysis which relate to the particular ser-
63 (80)
vice experience element and recommendations. Below the current state analysis find-
ings are the columns for the service experience, related quality element and the actual
recommendations. First, the service experience column informs which service experi-
ence element is in question. Second, the quality element column defines the sub-cate-
gory for service experience element. Depending on the service experience element,
there can be one or several quality elements. Last, the recommendation column de-
scribes all the recommendations suggested for the particular service experience ele-
ment.
Further on, the Table 12 presents the recommendations for product features service ex-
perience element. In the OPMA service offering, most of the concerns related to the mid-
term forecast accuracy and automation and visualization of intraday and short-term trad-
ing analysis outcomes and graphs. Therefore, the recommendations relate to the im-
provement of the mid-term forecast for more market driven approach, as well as more
involvement of the fuel analysis team as their input has significant impact on the forecast
result. The intraday customers were concerned about the speed of analysis updates and
thus, the recommendations relate to the automatization of the process even further to
increase the frequency and forecast response to the changing market or power system
conditions.
Recommendations for Interaction Service Experience Improvement
The largest group of recommendations was related to the Interaction service experience
element. These recommendations are presented in following Table 13.

64 (80)
Table 13. The recommendations for Interaction service experience element improvement.
As seen from Table 13, the interactions service experience element has several sub-
quality elements and each of them have their own recommendations. The main recom-
mendations for Customer and Business understanding quality element were to increase
the short term analysts understanding of the customer’s planning process for production
allocation and planning. This is due to the fact that the analysis input has considerable
effect on the customer planning process and it would ease the dialogue if the analysts
are more aware how their forecasts impact on the customers’ planning, and which of the
forecast elements are the most relevant to this process. For the mid-term analysts, the
recommendation was to raise the understanding of forward markets in order to learn
more dynamic adjustment of forecasting and find the common language with the portfolio
managers and the traders.
For Communication activity quality element, the main recommendations were to build
collaboration network which would hold features for activating dialogue between the an-
alyst and trader, narrow the distance to the analysts, and enable faster response to re-
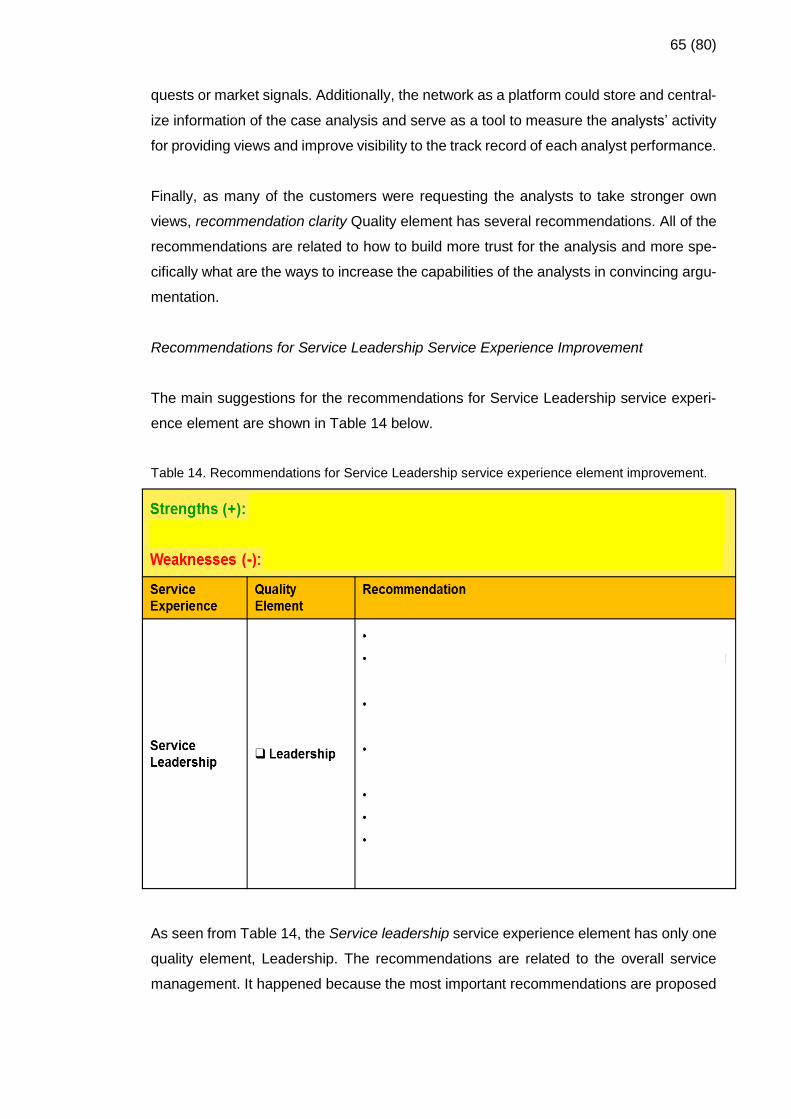
65 (80)
quests or market signals. Additionally, the network as a platform could store and central-
ize information of the case analysis and serve as a tool to measure the analysts’ activity
for providing views and improve visibility to the track record of each analyst performance.
Finally, as many of the customers were requesting the analysts to take stronger own
views, recommendation clarity Quality element has several recommendations. All of the
recommendations are related to how to build more trust for the analysis and more spe-
cifically what are the ways to increase the capabilities of the analysts in convincing argu-
mentation.
Recommendations for Service Leadership Service Experience Improvement
The main suggestions for the recommendations for Service Leadership service experi-
ence element are shown in Table 14 below.
Table 14. Recommendations for Service Leadership service experience element improvement.
As seen from Table 14, the Service leadership service experience element has only one
quality element, Leadership. The recommendations are related to the overall service
management. It happened because the most important recommendations are proposed
66 (80)
for management actions to balance the customers’ expectations and frustrations for the
analysis services priorities and increase the development transparency. The manage-
ment is recommended to communicate more actively the service balance over the main
segments CS1, CS2 and CS3, but also inside customer segment CS1. This is because
not all the customers neither seem to understand the current priorities nor they discuss
enough internally as customers. There is also a recommendation to arrange an annual
service review where the customers’ expectations are heard and commonly agreed
which the service levels customers want and OPMA is able to provide. Last, the devel-
opment transparency could be achieved with the utilization of common development
backlog visualization across the customer segments and more continuous, but shorter,
dialogue on the development-in-progress and OPMA development achievements.
5.5 Summary of the Improved Service Offering for OPMA
Summing up the improved service offering for OPMA discussed in Section 5, there were
two parts identified which, when taken together, form the improved customer value prop-
osition.
First, it consists of the newly organized service offering which is structured by the cus-
tomer segments. In the newly organized service offering, organized in a matrix, the most
valuable service offerings to the customers and intended focus groups by OPMA for the
service offering are matched. This should further improve as OPMA has now a clearer
view of the services importance to the customers.
Second, several recommendations to improve the service experience were identified to
the key service experience elements. These service experience elements include Prod-
uct features, Interaction and Service Leadership. The recommendations to product fea-
tures could help to improve the core product features and performance, which in OPMA’s
case are the forecasts and analyses. The recommendations for the interaction service
experience element can be said to be the most central and vital for the OPMA services.
As a service, OPMA provides advice giving which includes communication with the cus-
tomer in a convincing and trustful manner. Last, the recommendations to service leader-
ship element are essential in order to successfully manage and steer the service delivery
towards the customers and manage expectations from the different customer segments.
67 (80)
6 Feedback to Outcomes of the Study
This section presents the results from the feedback to the proposal of the improved cus-
tomer value proposition for OPMA. First, the feedback arrangements and progress are
presented. Second, the summary of the feedback results are discussed. Last, the section
finalizes by presenting the final proposal for the improved customer value proposition for
OPMA based on adjustments from the feedback.
6.1 Description of Feedback Arrangements
The feedback round was conducted with the OPMA management in a form of a discus-
sion session. The proposal for the improved OPMA service offering as the customer
value proposition was combined into a presentation which was delivered to the manage-
ment as pre-material before the discussion session. This was hoped to help the quality
of the discussion as the management had a possibility to see the material before the
sessions. The presentation included the current state analysis including both the detailed
and summary of the findings, the improved service offering matrix and the list of recom-
mendations.
Progress of Feedback Session
In the beginning of feedback session, the management was asked to confirm the sum-
mary of the current state analysis. The summary presented the findings from customer
segment CS1. Next, the session progressed to present the improved service offering.
Each area of the service offering matrix was presented separately and shortly discussed
to confirm its relevance and ask for possible feedback. After that, the session concen-
trated on the recommendations. The recommendations were presented by discussing
each service experience element separately. In each of the element, all the recommen-
dations were discussed and possible feedback was collected. Once the recommenda-
tions in every element were discussed, the received feedback was summarized before
moving to the next element. Once all the service experience elements were discussed,
all the feedback for the recommendations was summarized. Last, once the whole
presentation and feedback gathering was finished, all the received feedback was sum-
marized and the management was asked to confirm it and provide possible final general
comments.
68 (80)
6.2 Summary of the Feedback
Final feedback to the research outcomes of the improved customer value proposition for
OPMA consisted of the following comments:
For the Current state analysis, there were no additional comments received to the sum-
mary of the current state analysis as an input to the outcomes. The analysis results were
accepted and valid.
For the Service offering, the management concluded that wanted outcomes were pre-
sented for the improved service offering and no further feedback was necessary to pro-
vide.
For the Recommendations, the following feedback and comments were suggested: 1)
the first comment on the recommendations was that the Recommendations reflected the
performance of OPMA in one fixed period. It was recognized that “the analysis perfor-
mance is as good as the last analysis provided”. This meant that to give the absolute
right answers to improve mid-term forecasting may not be possible, and mid-term fore-
casting success may depend also on the market situation. The discussion was summa-
rized in the way that the recommendations should be looked into on the conceptual level
and not as direct suggestions. 2) The recommendation for the role based team respon-
sibilities was considered too large to a small team such as OPMA. The recommendation
was changed to the role based responsibilities which may be considered as a model. 3)
There was a discussion regarding the recommendation to develop a collaboration net-
work. As such, it was considered a valid suggestion but too broad a term to cover several
topics. As a conclusion, it was kept on the recommendations as the management wanted
to visualize the importance of communication in service experience. It was also noted
that this action would require a more detailed action plan, scoping and its step-wise im-
plementation 4) In general, the listed recommendations were considered to be on the
adequate abstract level to capture the essence of the needed service experience im-
provements. However, for further actions it is needed to think about an implementable
action list. 5) The order of recommendations was re-adjusted to highlight the business
priorities of recommendations. Finally, the management concluded that the recommen-
dation list provides a good reality check of the current situation both internally and from
the external perspective.

69 (80)
Summing up, the first outcome, the improved service offering, as it was initially proposed,
was valid and approved of without any changes. The second outcome, the recommen-
dations, was discussed on a detailed level. The main adjustments for the recommenda-
tions were based on the feedback and concerned the too abstract level of the recom-
mendations and its priority requirements to allow for the correct message to be ex-
pressed.
6.3 Final Proposal Based on the Feedback
The proposal for the improved customer value proposition was created in Section 5
based on the best practice and the conceptual framework created earlier in Section 3
and the results of the current state analysis conducted in Section 4. This proposal was
presented to the management and validated to form the final proposal of outcome. The
validated and final proposal of the improved customer value proposition for OPMA as,
first, the Service Offering and, second, as the Recommendations are summarized in Ta-
ble 15, Table 16, Table 17 and Table 18 below.
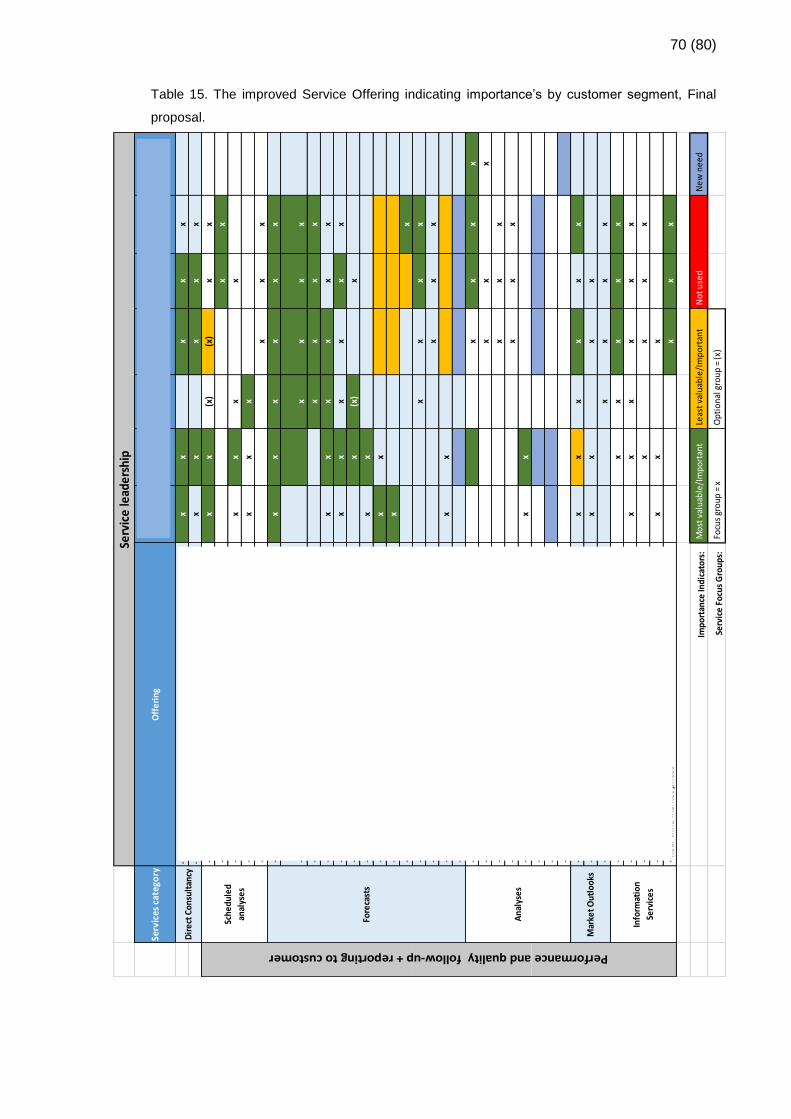
70 (80)
Table 15. The improved Service Offering indicating importance’s by customer segment, Final
proposal.
Serv
ices
cat
ego
ryO
ffer
ing
CS1-
A
Intr
aday
CS1-
B S
ho
rt
Term
CS1-
C M
id
Term
Ph
ys.
CS1-
D T
rad
ing
Des
k
CS1-
E1 M
id
Term
Del
.
CS1-
E2 M
id
Term
Heg
d.
CS1-
E3
Ori
gin
atio
n
- Co
ntin
ous
view
- Pr
esen
se in
tra
ding
des
k (f
ace-
to-f
ace
- im
me
diat
e re
sp.)
xx
xx
x
- Ad
hoc
ques
tion
s (m
ail,
me
ssag
ing,
etc
. - w
hen
avai
labl
e)x
xx
xx
- D
aily
sho
rt t
erm
me
etin
g at
8.2
0 C
ETx
x(x
)(x
)x
x
- Fi
nanc
ial w
eekl
y ta
ctic
al m
eet
ing
(par
tici
pati
on)
xx
- W
eekl
y fo
llow
-up
me
etin
g (a
naly
sis
perf
orm
ance
, dev
elop
me
nt id
eas)
xx
xx
- Ph
ysic
al T
acti
cs m
eet
ing
(par
tici
pati
on)
xx
x
- D
aily
me
etin
g fo
r ad
hoc
issu
es a
nd c
ases
mid
ter
m h
oriz
on 1
1:00
CET
xx
x
- W
eath
er u
pdat
es a
nd b
log
xx
xx
xx
- M
id t
erm
pri
ce fo
reca
st +
fund
ame
ntal
s (b
ase
and
rang
es)
xx
xx
- C
O2
fore
cast
xx
xx
- A
rea
spot
pri
ce fo
reca
sts
(bas
e an
d ra
nges
)x
xx
xx
x
- Sp
ot a
nd fo
ur w
eek
pric
e fo
reca
sts
+ fu
ndam
ent
als
xx
xx
xx
- Fr
ont
mo
nth
spot
fore
cast
x(x
)x
- In
flow
fore
cast
(fun
dam
ent
als,
par
t of
pri
ce fc
st)
xx
- In
trad
ay p
rice
sen
siti
viti
esx
x
- In
trad
ay s
igna
l for
ecas
tx
- Fu
el fo
reca
sts
- Gas
and
Oth
erx
- Fu
el fo
reca
sts
- Co
alx
xx
x
- Pr
ice
spre
ad t
o ad
jace
nt m
arke
ts (E
EX)
xx
x
- In
tra
day
volu
me
indi
cati
ons
& p
rice
fore
cast
sx
x
- Pr
ice
fore
cast
EEX
- C
ase
anal
ysis
(Co
mm
itm
ent,
con
vict
ion
case
ana
lysi
s)x
xx
x
- El
cert
ana
lysi
s (m
arke
t vi
ew)
xx
x
- C
ont
inen
tal E
urop
ean
pow
er m
arke
tx
xx
- D
istr
ibut
ion
of r
elev
ant
exte
rnal
mar
ket
anal
yses
rep
orts
xx
x
- Sy
stem
pri
ce s
ensi
tivi
ty a
naly
sis
xx
- Fo
rwar
d an
alys
is (j
ourn
ey t
o re
aliz
atio
n)
- M
arke
t fo
llow
-up
and
patt
erns
- G
oO a
naly
sis
- M
onth
ly m
arke
t O
utlo
ok (f
utur
e)x
xx
xx
x
- D
aily
mar
ket
outl
ook
lett
erx
xx
x
- M
acro
-eco
nom
ic o
utlo
okx
xx
x
- Ex
tern
al m
arke
t da
ta, w
eath
er a
nd p
rice
fore
cast
xx
xx
x
- Sy
stem
acc
ess
to fu
ndam
ent
al d
ata
on E
urop
e/N
ordi
c m
arke
ts
xx
xx
xx
- N
ews
serv
ices
xx
xx
- D
etai
led
pow
er s
yste
m in
fo -
map
xx
x
- R
eal-
tim
e m
arke
t pr
ices
xx
x
Imp
ort
ance
Ind
icat
ors
:
Mos
t va
luab
le/I
mp
orta
nt L
east
val
uabl
e/Im
por
tant
New
nee
d
Serv
ice
Focu
s G
rou
ps:
Not
use
d
Foc
us g
roup
= x
Opt
iona
l gro
up =
(x)
Serv
ice
lead
ersh
ip
Dir
ect
Con
sult
ancy
Performance and quality follow-up + reporting to customer
Sch
edu
led
anal
yse
s
Fore
cast
s
An
alys
es
Mar
ket
Ou
tlo
oks
Info
rmat
ion
Serv
ices
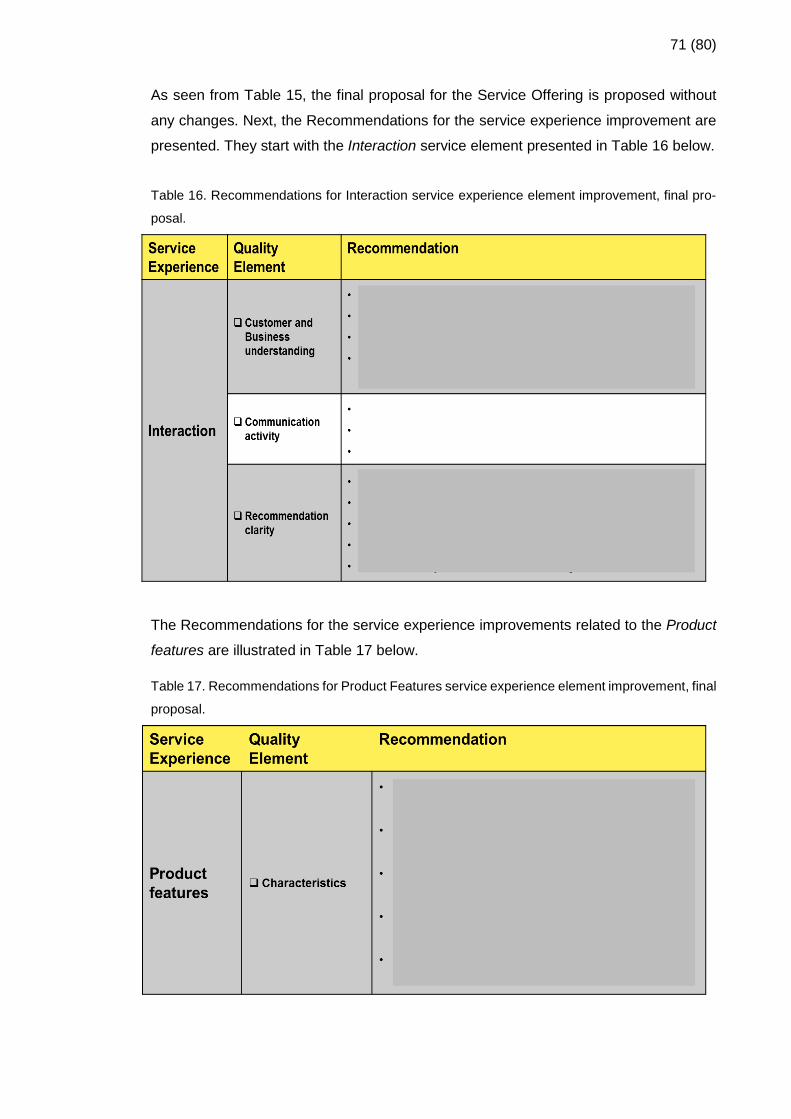
71 (80)
As seen from Table 15, the final proposal for the Service Offering is proposed without
any changes. Next, the Recommendations for the service experience improvement are
presented. They start with the Interaction service element presented in Table 16 below.
Table 16. Recommendations for Interaction service experience element improvement, final pro-
posal.
The Recommendations for the service experience improvements related to the Product
features are illustrated in Table 17 below.
Table 17. Recommendations for Product Features service experience element improvement, final
proposal.

72 (80)
Last, the recommendations for service experience improvements related to Service lead-
ership are illustrated in Table 18 below.
Table 18. Recommendations for Service Leadership service experience element improvement,
final proposal.
Summing up, the final proposal for the improved customer offering is the same as the
initial proposal presented earlier in Table 10. Instead, the final proposal for the Recom-
mendations for the service experience improvements in Product features, Interaction and
Service leadership were corrected based on the management feedback. As can be seen,
the corrected recommendations are mainly updated in terms of the order of recommen-
dations. The strengths and weaknesses from current state analysis findings, which were
earlier connected to the initial proposal for the recommendations, are not presented in
this final version of the corrected outcome.
73 (80)
7 Discussion and Conclusions
This section presents the main results of the Thesis and proposes possible immediate
next steps for putting the improved customer value proposition for OPMA into implemen-
tation. It also evaluates to objectives and outcome of the thesis.
7.1 Executive Summary
This study focused on developing the customer value proposition for Operative Market
Analysis department (OPMA) of the case company. The business problem for the study
arose from the uncertainty which analysis services provide the best information value for
making individual trading decisions by OPMA’s internal customers. Thus, the study con-
centrated on identifying the most value providing services and produced a focused CVP
for OPMA. Another outcome of the study was a list of the improvement recommendations
for the existing analysis and forecasting services.
Presently, the quality and outcome of the analysis and forecasting services provided by
OPMA is affected by spreading the analysts’ efforts into multiple information directions.
Meanwhile, several operative analysis services and their combinations can provide the
required information to support a considerable part of trading and other business deci-
sions. Additionally, the demand for different analyses from the customers exceeds the
current possibilities of OPMA to meet all the needs. Since analysts are not capable to
expand the current offering to each individual customer, they are not serving all existing
needs. Thus, it became essential to understand what analyses provide the most and
least value for the customers, how they can be grouped, and how the service delivery
can be further improved.
The study was conducted in several steps. The first step was to investigate the best
practice of CVP and build the customer value proposition for OPMA from the identified
building blocks. The second step was to conduct the current state analysis of the current
service offering and service experience. This step concentrated on recognizing the
strengths and weaknesses of the current service offering and experience for each of the
key customer segment. The findings were also analyzed to identify potential improve-
ments in the current service experience and service delivery. The interviews with the
customers, the analysts and the management provided the main data source for this
analysis. This core data was supported by several other data sources.
74 (80)
The third step was to build the improved service offering for OPMA and recommenda-
tions for the service experience improvements. These two outcomes created the final
outcome of the thesis, the customer value proposition (CVP) for OPMA. The improved
service offering was based on the findings from the current state analysis which identified
the existing most and least valuable offerings. The recommendations were based on the
customers’ and analysts’ suggestions for improvement, as well as, the researcher’s own
conclusions based on the available data and best practice.
As the result, the study contributed to the OPMA customer value improvement in several
ways. First, OPMA identified its most important services to customers and gained cus-
tomers insights of the current service experience of the offering. Second, the offering
with the lowest value was recognized as well as the new needs from customers. Third,
the study reminded OPMA to consider services in broader scope than just as delivery for
the products. The vital part of the service experience in OPMA is created by the style of
advice giving and the interaction with the customer, meaning that the way in which the
actual product outcome is communicated to the customer should be trustful and convinc-
ing. Fourth, OPMA may become more aware which customer groups they need to serve
and how their customer needs differ from each other. Fifth, the study was able to identify
the main challenges and special features in the current service offering. For example,
the mid-term forecasting needed further improvement in the approach to serve the cus-
tomers and also required better collaboration with the other analysis team. The intraday
and short-term customers concentrate on the system based risks in the analysis,
whereas the other customers look for more market risk based analysis. This should help
OPMA to recognize how to approach certain groups of customers with the proper offer-
ing. Another important notice of the service offering was the broad need for more weather
forecasting in all the customer segments. Finally, the study clarified and described the
process of improving the OPMA customer value proposition. This may be used by OPMA
for continuous and repeatable service improvement in the future. Thus, OPMA could use
the knowledge gained from this study to improve its overall customer value creation.
This study addressed the uncertainties of which OPMA analysis services were providing
the best customer value for customers in each user group. Additionally, its emphasis
were to investigate the preferred ways to receive the services from the analysts for each
customer group. As the more general outcome, OPMA could now have better opportunity
to leverage information from the study to improve its existing service experience. The
75 (80)
outcomes of the study may be translated into detailed action plan with the concrete ac-
tions to implement the identified improvements. The possible immediate next steps are
discussed in the following section.
7.2 Next Steps
This study was conducted to investigate the challenges in the current OPMA service
offering and service experience. The outcome of the study was the improved services
offering and the recommendations for service experience improvements. Whenever
OPMA may consider taking the improved services offering into use and follow the sug-
gested recommendations, the next practical steps may help and provide suitable assis-
tance to realize action taking.
1) Due to time limitations during the study, fairly brief discussions with the manage-
ment were possible to arrange. There should be arranged more detailed discus-
sions within the management of the Market Analysis department and OPMA to
introduce the improved service offering and recommendations in order to ensure
correct priorities and resource reservations.
2) As the most and least valuable service offering is identified with their current per-
formance, OPMA should engage itself into a follow-up discussion with each cus-
tomer segment separately to specify the detailed actions and find commitment
needed from each party.
3) The mid-term forecasting was considered to hold the most potential for improve-
ment and the greatest customer value potential. OPMA should consider allocat-
ing extra effort to a detailed planning and initiation of the improvement actions in
this area. Here, teaming up and mixing the resources with the other Market Anal-
ysis team and the key customers could offer accelerated learning and faster im-
plementation.
4) The interaction service experience element was identified as the central enabler
for the service improvement. OPMA should investigate how to engage the ana-
lysts to learn more about the communication and advice giving. The learning for
both the emotional effect of advices in trust building and real-life practices for
active listening and efficient dialogue would be beneficial to consider.
76 (80)
5) In this study, the work was scoped to cover only one customer segment, CS1. It
would be beneficial to expand the analysis to the rest of the other customer seg-
ments, CS2 and CS3, to review and create a similar improved offering and rec-
ommendations study. Most likely, it would also provide additional feedback to
further service alignment with segment CS1 and between other segments.
6) The study narrowed the scope of the customer value proposition to considering
only the improved service offering. In order to implement the whole CVP in prac-
tice, also the evaluation and possible re-configuration task of the key resources
and key activities should be conducted. Especially IT as the one identified key
partner would be beneficial to consider for such alignment with the improved ser-
vice offering.
7.3 Evaluation
This sub-section concentrates on discussing the evaluation of the objectives of the study
against the final outcome and addresses reliability and validity aspects of the study.
7.3.1 Objectives and Outcome
The objective of the thesis was to build a proposal for improved customer value propo-
sition for OPMA. This objective was addressed through two main outcomes; the im-
proved service offering and the recommendations for service experience improvement.
This study concentrated first on investigating best practice for building the CVP. Multiple
general approaches for building blocks of CVP were discussed on theoretical level, and
the conceptual framework was established to summarize the main ideas from several
scholars in the field. The framework was utilized in the current state analysis as well as
for the building of the improved customer value proposition for OPMA. The CVP creation
process was enabled by the suggested conceptual framework. Therefore, it can be con-
sidered that the objective was achieved.
The building blocks of the suggested conceptual framework included such elements of
CVP as strategy and environment, customer segment, customer needs and value expe-
rience and, customer offering, key resources and key activities. The target was to include
77 (80)
also the key activities and key resources as building blocks of improved CVP for OPMA.
However, this initial plan did not succeed due to the time limitation for the study. How-
ever, the data collection and the current state analysis were completed for the key re-
sources and key activities building block. Therefore, this work can be continued even
after this study is over.
Already the current state analysis was providing a great amount of information on the
current performance of OPMA services. As the analysis was conducted to broader scope
of customers than just customer segment CS1, the recorded data can be utilized for the
analysis of other segments, which can be seen as an additional achievement of the
study. Especially it could enable further investigation and analysis of the service perfor-
mance inside OPMA but also within the Market Analysis department.
The improved service offering provided more consistent view of OPMA service offering,
prioritized customer needs and indicated where the OPMA efforts should be focused on
in the future. Additionally, the recommendations pointed to which should be the most
relevant in the service experience elements and, especially how to find the most conven-
ient way and specific customer interaction approaches. On the other hand, the recom-
mendations for improvements were on a rather abstract level which not allow to start the
necessary actions immediately. It will require further work from OPMA to detail the actual
plan for implementation. This part might have had possibilities to detail even further dur-
ing the study.
To conclude, both outcomes which were set as targets for the study, namely the im-
proved service offering and recommendations for service experience improvement, were
produced, so therefore the objective can be considered to be met. As the next step, as
mentioned earlier, OPMA needs to concentrate on implementing the improved CVP into
practice. This may create new challenges for OPMA, as the analysts, who as the main
providers of services, need to consider several factors to improve their work. The suc-
cess of that effort will most likely require a few key persons in OPMA to start to investigate
recommendations further, learn more about them in practice and try them out with the
new courage.
78 (80)
7.3.2 Reliability and Validity
According to Section 2.3, the validity and reliability of the thesis was assured by taking a
number of different steps. For improving validity, each data collection, analysis of data
and conclusions drawn were described in detail. Additionally, all the interviews were
taken as field notes and also tape-recorded with the help of voice recording. The field
notes were then sent to each of the interviewees for validation and feedback. The notes
and related questionnaires were made available in the appendices of this study. The
customers, analyst and management were involved several times during the study, to
collect their suggestions and check for their interpretations and conclusions. Further on,
the conclusions were based on multiple sources of data from which the views were col-
lected. Finally, to confirm validity, direct quotes were used to detail the data reported on
the occasions when possible.
The reliability of the study was ensured by using different sources of data and ap-
proaches such as interviews and discussions to collection evidence and observations of
analysts’ in-action to confirm their existence. Additionally, due to the nature of business,
where analyst’s last recommendation is the measure and track record of his success,
special attention was required to the comments from the customers. These comments
were reflected against the market situations and weighted carefully if there potentially
were unnecessary bias involved. Additionally, instead of taking them for granted, these
comments were cross-checked with other customers as part of the interview topics. Bias
was avoided whenever possible by utilizing the multiple views of the interviewees and
as well as comparing the results to external benchmark material.
A considerably small number of interviews and feedback, in some cases only one re-
spondent, from different customer sub-segments may imply a challenge in terms of va-
lidity. Altogether as many as 31 interviews were conducted resulting as written field notes
and around 30 hours of tape recordings. On the other hand, the researcher employed
his own background and experience in the company gained over for the several years,
which may limit the impact of the data collection validity challenges. As the market con-
ditions and the advancements happening in the business most likely would be different
when someone would like to repeat this study, the results may also vary. This risk was
tried to be mitigated by thorough description of the building process and rigid reporting
of references to endure the traceability and validity.
79 (80)
References
Anderson, J. C., & Narus, J. A. (2004). Business Market Management. Upper Saddle
River, New Jersey: Pearson Prentice Hall.
Anderson, J. C., Narus, J. A., & van Rossum, W. (2006). Customer Value Propositions
in Business Markets. Harvard Business Review, March 2006, 91-99.
Bonaccio, S., & Dalal, R. S. (2006). Advice Taking and Decision-making: An Integrative
Literature Review, and Implications for the Organisational Sciences.
Organizational Behavior and Human Decision Processes 101, 127-151.
Bower, M. (1982). The Forces that Launched Management Consulting are Still at Work.
Journal of Management Consultancy. Vol. 1 (1), 4-6.
Cho, J., & Trent, A. (2006). Validity in qualitative research revisited. Qualitative Research
2006; 6(3); 319, 319-340.
Clarke, S. (2006). Managing the Introduction of a Structured Forecast Process.
Foresight: The International Journal of Applied Forecasting. Vol. 1 (4), 21-25.
Coghlan, D., & Brannick, T. (2006). Doing Action Research in Your Own Organization.
London: Sage Publications.
Fresis, L., & Infield, D. (2008). Renewable Energy in Power Systems. Chippenham,
Wiltshire, UK: John Wiley & Sons Ltd.
Greiger, L., & Metzner, R. (1983). Consulting to Management. Englewood Cliffs, New
Jersey: Prentice Hall.
Grönroos, C. (2008). Service Logic Revisited: Who Creates Value? And Who Co-
creates? European Business Review. Vol. 20 (4), 298-314.
Holsti, O. (1969). Content Analysis for the Social Sciences and Humanities. MA:
Addison-Wesley.
Johnson, M. W., Christensen, C. M., & Kagermann, H. (2008). Reinventing Your
Business Model. Harvard Business Review, December 2008, 59-68.
Jungermann, H. (1999). Advice Giving and Taking. In: HICSS-32. Proceedings of the
32nd Hawaii International Conference on System Science., (pp. 1-11).
Kambil, A., Ginsberg, A., & Bloch, M. (1996). Re-inventing Value Propositions. Center
for Digital Economy Research, Stern Scholl of Business, 1-32.
Kotler, P., & Armstrong, G. (2010). Principles of Marketing. New Jersey, Upper Saddle
River: Pearson Prentice Hall. 13th Ed.
Lanning, J. M., & Michaels, E. G. (1988). Delivering Value to Customers: A Business is
a Value Delivery System. McKinsey Quarterly, June 1988, pp. 53-57.
Lasswell, H. (1976). Power and Personality. New York: Norton.
80 (80)
Manning, H., & Bodine, K. (2012). Outside in: The Power of Putting Customers at the
Center of Your Business. New York: Houghton Mifflin Harcourt Publishing
Company.
Nekrassova, D. (2010). Managing Impressions and Gaining Control: Performances of
Emotion Work in Financial Organisations. Kaleidoscope: Vol. 9, 1-24.
Osterwalder, A., & Pigneur, Y. (2010). Business Model Generation - A Handbook for
Visionaries, Game Changers, and Challengers. New Jersey: John Wiley & Sons.
Parasuraman, A., Zeithaml, V. A., & Berry, L. L. (1985). A Conceptual Model of Service
Quality and Its Implications for Future Research. Journal of Marketing, Vol. 49
(Fall), 41-50.
Porter, M. E. (1996). What is Strategy? Harvard Business Review, November-December
1996, 2-22.
Porter, M. E. (2008). The Five Competitive Forces that Shape Strategy. Harvard
Business Review, January 2008, 24-41.
Prahalad, C. K., & Ramaswamy, V. (2004). Co-creating Unique Value with Customers.
Strategy and Leadership, Emerald group Publishing Limited, Vol.32, No.3, 4-9.
Quinton, S., & Smallbone, T. (2006). Postgraduate Research in Business. A Critical
Guide. SAGE Publications Ltd .
Russ-Eft, D., & Preskill, H. (2001). Evaluation in Organization - A Systemic Approach to
Enhancing Learning, Performance, and Change. Cambridge, MA: Perseus.
Shenton, A. (2004). Strategies for Ensuring Trustworthiness in Qualitative Research
Projects. Education for Information 22, 63–75.
Vargo, S. L., & Lusch, R. F. (2004). Service-dominant Logic as Foundation for Service
Science. Journal of Marketing, Vol. 68 (1), 1-17.
Vargo, S. L., & Lusch, R. F. (2008). Service Dominant Logic: Continuing the Evolution.
Journal of the Academy of Marketing Science. 36 (1), 1-10.
Whittemore, R., Chase, S., & Mandle, C. L. (2001). Validity in Qualitative Research.
Qualitative Health Research. 11, 522-537.
Woodruff, R. B. (1997). Customer Value: The Next Source for Competitive Advantage.
Academy of Marketing Science. Vol. 25 (2), 139-153.
Wouters, M. (2010). Customer Value Propositions in the Context of Technology
Commercialization. International Journal of Innovation Management. Vol. 14 (6),
1099-1127.
.
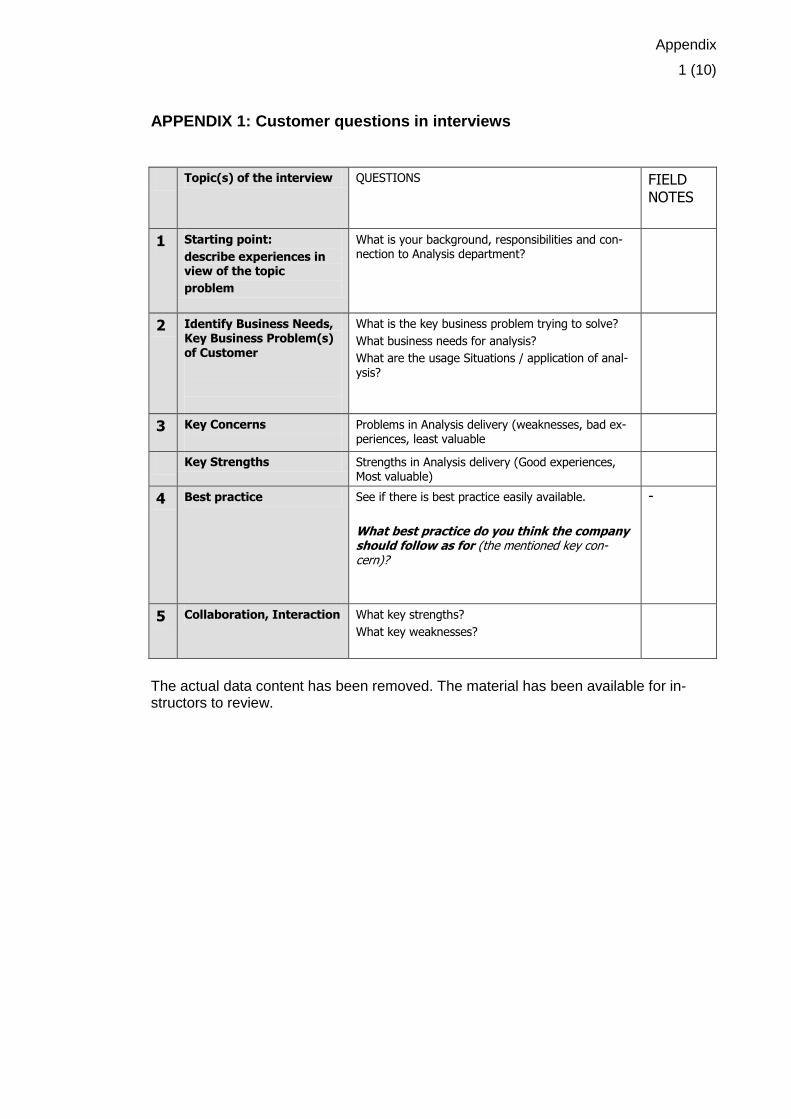
Appendix
1 (10)
APPENDIX 1: Customer questions in interviews
Topic(s) of the interview QUESTIONS
FIELD NOTES
1 Starting point:
describe experiences in view of the topic
problem
What is your background, responsibilities and con-nection to Analysis department?
2 Identify Business Needs, Key Business Problem(s) of Customer
What is the key business problem trying to solve?
What business needs for analysis?
What are the usage Situations / application of anal-ysis?
3 Key Concerns
Problems in Analysis delivery (weaknesses, bad ex-periences, least valuable
Key Strengths Strengths in Analysis delivery (Good experiences, Most valuable)
4 Best practice See if there is best practice easily available.
What best practice do you think the company should follow as for (the mentioned key con-cern)?
-
5 Collaboration, Interaction What key strengths?
What key weaknesses?
The actual data content has been removed. The material has been available for in-structors to review.
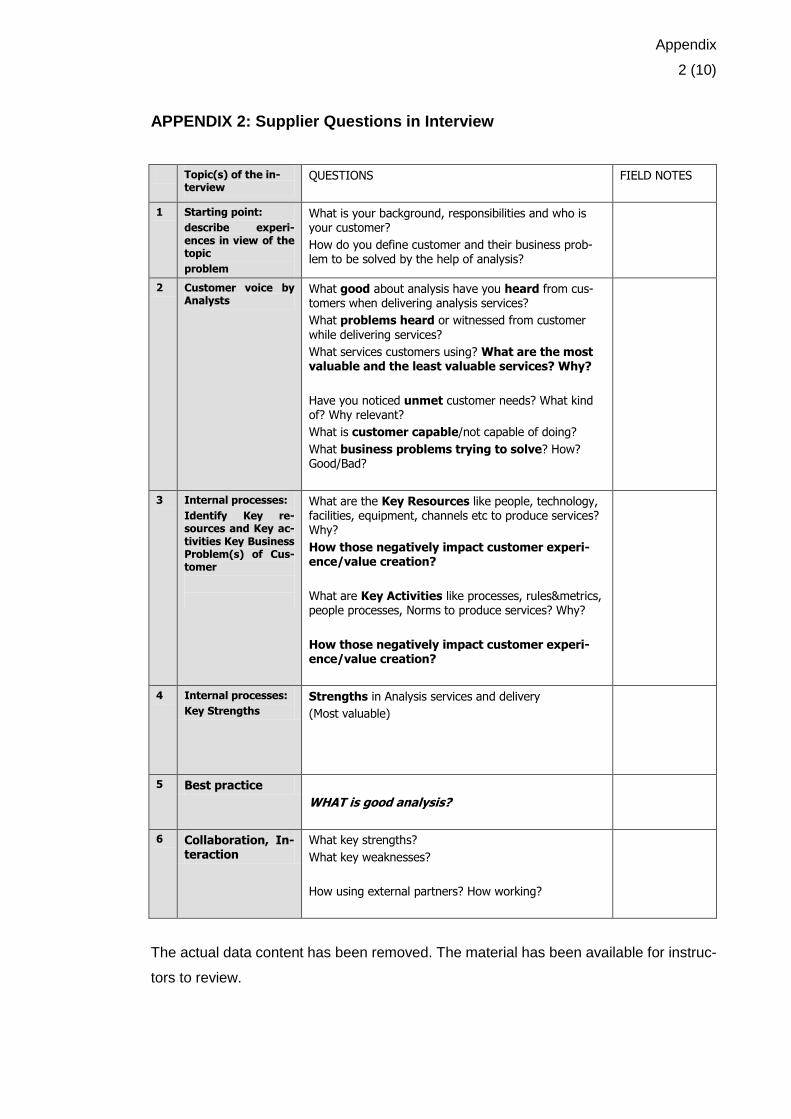
Appendix
2 (10)
APPENDIX 2: Supplier Questions in Interview
Topic(s) of the in-terview
QUESTIONS
FIELD NOTES
1 Starting point:
describe experi-ences in view of the topic
problem
What is your background, responsibilities and who is your customer?
How do you define customer and their business prob-lem to be solved by the help of analysis?
2 Customer voice by Analysts
What good about analysis have you heard from cus-tomers when delivering analysis services?
What problems heard or witnessed from customer
while delivering services?
What services customers using? What are the most valuable and the least valuable services? Why?
Have you noticed unmet customer needs? What kind of? Why relevant?
What is customer capable/not capable of doing?
What business problems trying to solve? How? Good/Bad?
3 Internal processes:
Identify Key re-sources and Key ac-tivities Key Business Problem(s) of Cus-tomer
What are the Key Resources like people, technology, facilities, equipment, channels etc to produce services? Why?
How those negatively impact customer experi-ence/value creation?
What are Key Activities like processes, rules&metrics, people processes, Norms to produce services? Why?
How those negatively impact customer experi-ence/value creation?
4 Internal processes:
Key Strengths
Strengths in Analysis services and delivery
(Most valuable)
5 Best practice
WHAT is good analysis?
6 Collaboration, In-teraction
What key strengths?
What key weaknesses?
How using external partners? How working?
The actual data content has been removed. The material has been available for instruc-
tors to review.
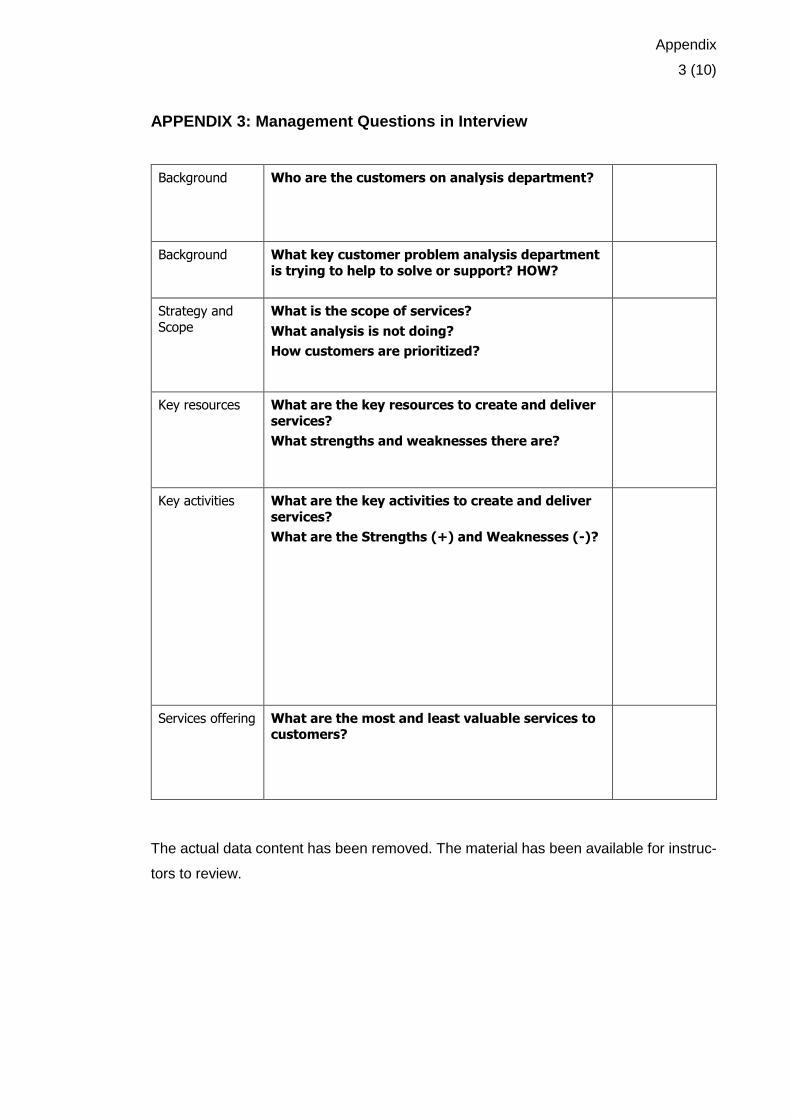
Appendix
3 (10)
APPENDIX 3: Management Questions in Interview
Background Who are the customers on analysis department?
Background What key customer problem analysis department
is trying to help to solve or support? HOW?
Strategy and
Scope
What is the scope of services?
What analysis is not doing?
How customers are prioritized?
Key resources What are the key resources to create and deliver
services?
What strengths and weaknesses there are?
Key activities What are the key activities to create and deliver
services?
What are the Strengths (+) and Weaknesses (-)?
Services offering What are the most and least valuable services to customers?
The actual data content has been removed. The material has been available for instruc-
tors to review.
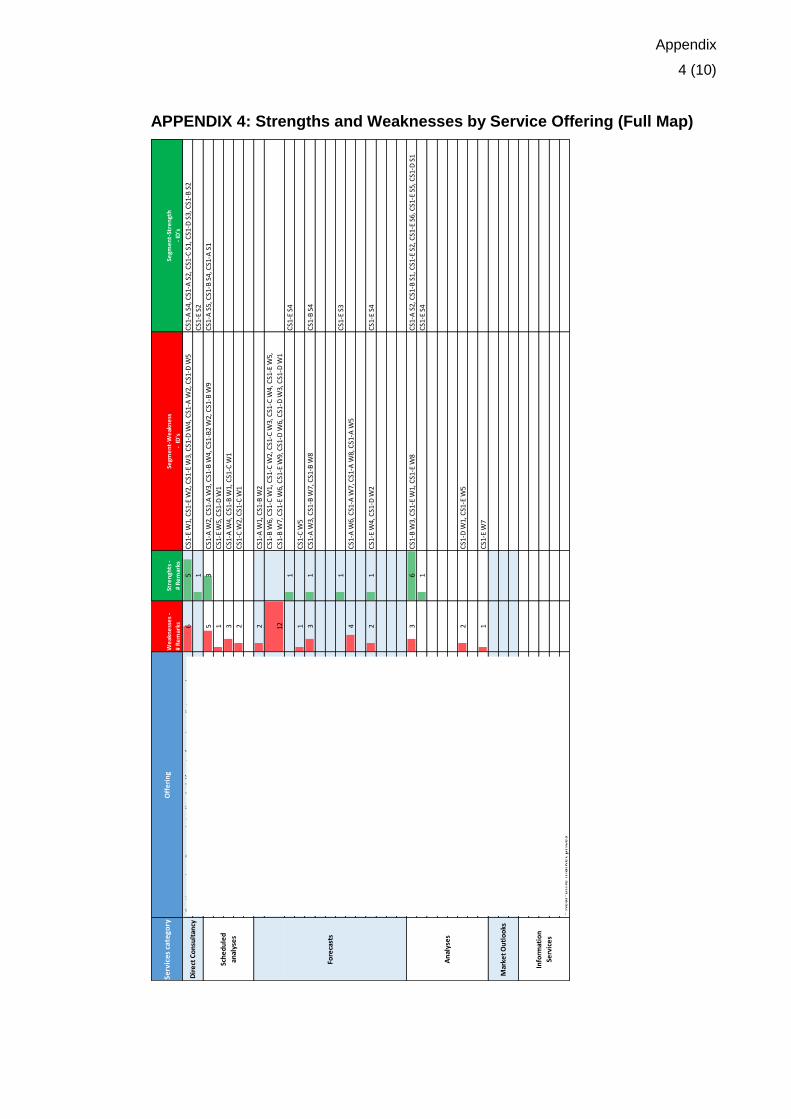
Appendix
4 (10)
APPENDIX 4: Strengths and Weaknesses by Service Offering (Full Map)
Serv
ices
cat
ego
ryO
ffe
rin
gW
eak
ne
sse
s -
# R
em
arks
Stre
ngh
ts -
# R
em
arks
Segm
en
t-W
eak
ne
ss
- ID
's
Segm
en
t-St
ren
gth
- ID
's
- C
on
tin
ou
s vi
ew
- P
rese
nse
in t
rad
ing
de
sk (
face
-to
-fac
e -
imm
ed
iate
re
sp.)
65
CS1
-E W
1, C
S1-E
W2,
CS1
-E W
3, C
S1-D
W4,
CS1
-A W
2, C
S1-D
W5
CS1
-A S
4, C
S1-A
S2,
CS1
-C S
1, C
S1-D
S3,
CS1
-B S
2
- A
d h
oc
qu
est
ion
s (m
ail,
me
ssag
ing,
etc
. - w
he
n a
vail
able
)1
CS1
-E S
2
- D
aily
sh
ort
te
rm m
ee
tin
g at
8.2
0 C
ET5
3C
S1-A
W2,
CS1
-A W
3, C
S1-B
W4,
CS1
-B2
W2,
CS1
-B W
9C
S1-A
S5,
CS1
-B S
4, C
S1-A
S1
- F
inan
cial
we
ekl
y ta
ctic
al m
ee
tin
g (p
arti
cip
atio
n)
1C
S1-E
W5,
CS1
-D W
1
- W
ee
kly
foll
ow
-up
me
eti
ng
(an
alys
is p
erf
orm
ance
, de
velo
pm
en
t id
eas
)3
CS1
-A W
4, C
S1-B
W1,
CS1
-C W
1
- P
hys
ical
Tac
tics
me
eti
ng
(par
tici
pat
ion
)2
CS1
-C W
2, C
S1-C
W1
- D
aily
me
eti
ng
for
ad h
oc
issu
es
and
cas
es
mid
te
rm h
ori
zon
11:
00 C
ET
- W
eat
he
r u
pd
ate
s an
d b
log
2C
S1-A
W1,
CS1
-B W
2
- M
id t
erm
pri
ce f
ore
cast
+ f
un
dam
en
tals
(b
ase
an
d r
ange
s)12
CS1
-B W
6, C
S1-C
W1,
CS1
-C W
2, C
S1-C
W3,
CS1
-C W
4, C
S1-E
W5,
CS1
-B W
7, C
S1-E
W6,
CS1
-E W
9, C
S1-D
W6,
CS1
-D W
3, C
S1-D
W1
- C
O2
fore
cast
1C
S1-E
S4
- A
rea
spo
t p
rice
fo
reca
sts
(bas
e a
nd
ran
ges)
1C
S1-C
W5
- S
po
t an
d f
ou
r w
ee
k p
rice
fo
reca
sts
+ fu
nd
ame
nta
ls3
1C
S1-A
W3,
CS1
-B W
7, C
S1-B
W8
CS1
-B S
4
- F
ron
t m
on
th s
po
t fo
reca
st
- In
flo
w f
ore
cast
(fu
nd
ame
nta
ls, p
art
of
pri
ce f
cst)
- In
trad
ay p
rice
se
nsi
tivi
tie
s1
CS1
-E S
3
- In
trad
ay s
ign
al f
ore
cast
4C
S1-A
W6,
CS1
-A W
7, C
S1-A
W8,
CS1
-A W
5
- F
ue
l fo
reca
sts
- G
as a
nd
Oth
er
- F
ue
l fo
reca
sts
- C
oal
21
CS1
-E W
4, C
S1-D
W2
CS1
-E S
4
- P
rice
sp
read
to
ad
jace
nt
mar
kets
(EE
X)
- In
tra
day
vo
lum
e in
dic
atio
ns
& p
rice
fo
reca
sts
- P
rice
fo
reca
st E
EX
- C
ase
an
alys
is (
Co
mm
itm
en
t, c
on
vict
ion
cas
e a
nal
ysis
)3
6C
S1-B
W3,
CS1
-E W
1, C
S1-E
W8
CS1
-A S
2, C
S1-B
S1,
CS1
-E S
2, C
S1-E
S6,
CS1
-E S
5, C
S1-D
S1
- E
lce
rt a
nal
ysis
(m
arke
t vi
ew
)1
CS1
-E S
4
- C
on
tin
en
tal E
uro
pe
an p
ow
er
mar
ket
- D
istr
ibu
tio
n o
f re
leva
nt
ext
ern
al m
arke
t an
alys
es
rep
ort
s
- S
yste
m p
rice
se
nsi
tivi
ty a
nal
ysis
- F
orw
ard
an
alys
is (
jou
rne
y to
re
aliz
atio
n)
2C
S1-D
W1,
CS1
-E W
5
- M
arke
t fo
llo
w-u
p a
nd
pat
tern
s
- G
oO
an
alys
is1
CS1
-E W
7
- M
on
thly
mar
ket
Ou
tlo
ok
(fu
ture
)
- D
aily
mar
ket
ou
tlo
ok
lett
er
- M
acro
-eco
no
mic
ou
tlo
ok
- E
xte
rnal
mar
ket
dat
a, w
eat
he
r an
d p
rice
fo
reca
st
- S
yste
m a
cce
ss t
o f
un
dam
en
tal d
ata
on
Eu
rop
e/N
ord
ic m
arke
ts
- N
ew
s se
rvic
es
- D
eta
ile
d p
ow
er
syst
em
info
- m
ap
- R
eal
-tim
e m
arke
t p
rice
s
Dir
ect
Co
nsu
ltan
cy
Sch
ed
ule
d
anal
yse
s
Fore
cast
s
An
alys
es
Mar
ket
Ou
tlo
oks
Info
rmat
ion
Serv
ice
s
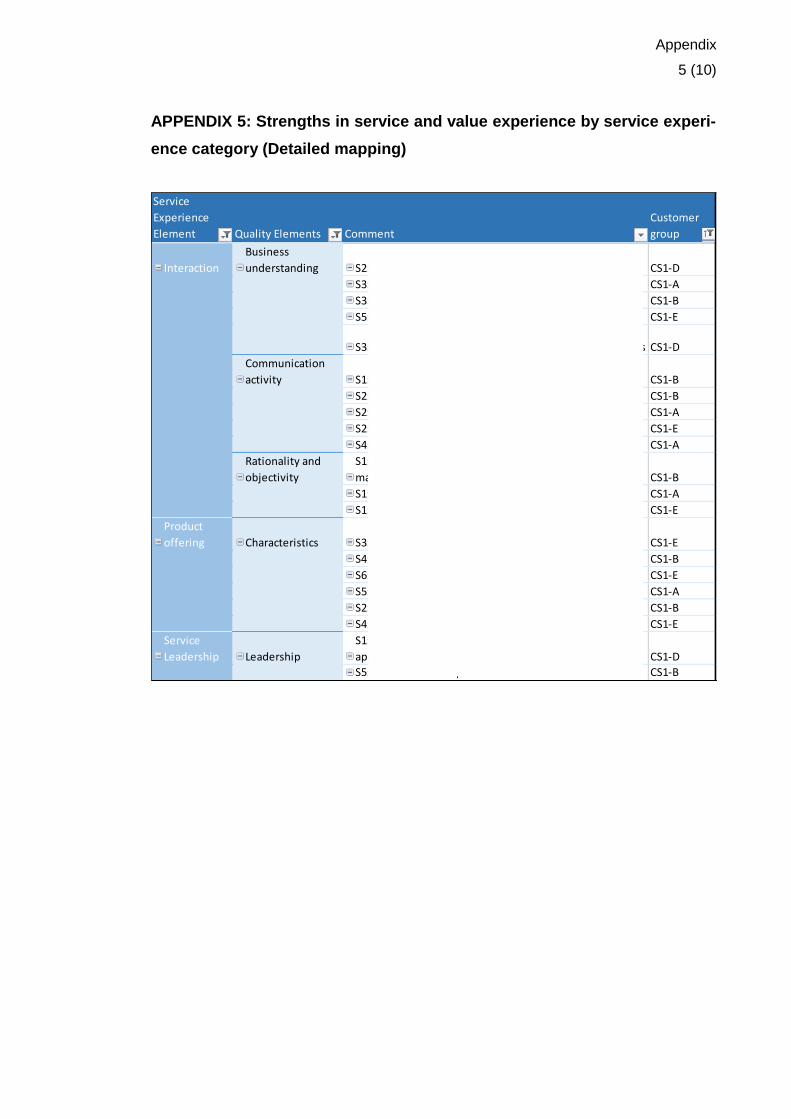
Appendix
5 (10)
APPENDIX 5: Strengths in service and value experience by service experi-
ence category (Detailed mapping)
Service
Experience
Element Quality Elements Comment
Customer
group
Interaction
Business
understanding S2: Lot of smart people CS1-D
S3: Eagerness to learn business CS1-A
S3: Understanding of fundament details behind data CS1-B
S5: More market driven than earlier CS1-E
S3: Younger analysts dare to challenge market and models CS1-D
Communication
activity S1: Moments of proactiviness and suggestions CS1-B
S2: Easy to ask adhoc (close) CS1-B
S2: Iniativiness for market opportunities CS1-A
S2: Moments of quick discussions and conclusions CS1-E
S4: Easy to ask adhoc (close) CS1-A
Rationality and
objectivity
S1: Possible to have trusted and open discussion of
market CS1-B
S1: Analyst provide complementary point of view CS1-A
S1: Valuable discussion partner CS1-E
Product
offering Characteristics S3: Spot sensitivities good CS1-E
S4: Short term forecasting process and presentation CS1-B
S6: Case analysis concept good CS1-E
S5: Analysis morning meeting structure CS1-A
S2: Possibility to benchmark againts external providers CS1-B
S4: Elcert analysis concrete CS1-E
Service
Leadership Leadership
S1: New operative analysis lead improved market driven
approach CS1-D
S5: Efforts to develop tools and methods CS1-B
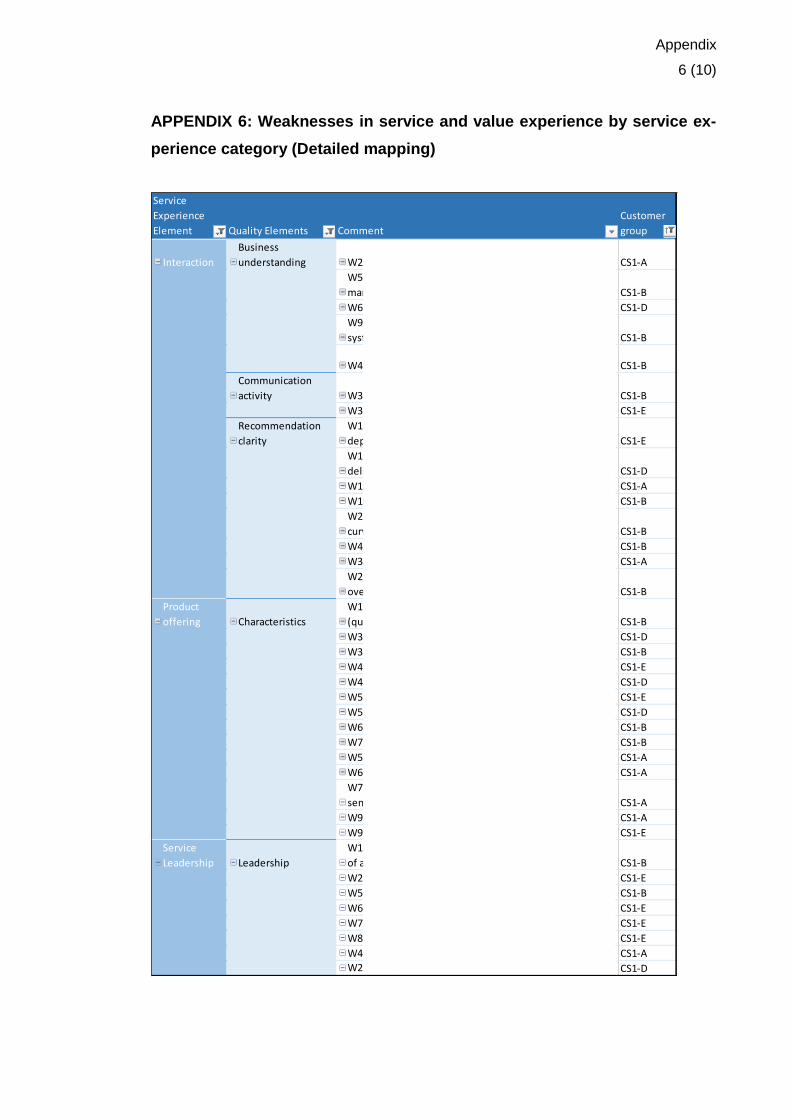
Appendix
6 (10)
APPENDIX 6: Weaknesses in service and value experience by service ex-
perience category (Detailed mapping)
Service
Experience
Element Quality Elements Comment
Customer
group
Interaction
Business
understanding W2: Understanding of market and business CS1-A
W5: Area price dynamics not enough considered in tight
market situations CS1-B
W6: Old-fashion thinking, hiding behind model CS1-D
W9: Analysts unaware of impact of their input (data) to
systems CS1-B
W4: Intraquarter profiles not considered in analysis CS1-B
Communication
activity W3: Being proactive to present cases and suggestions CS1-B
W3: Analysis distance to communicate CS1-E
Recommendation
clarity
W1: Frequency and quality of recommendations person
dependent CS1-E
W1: Missing view what levels market trading before
delivery CS1-D
W1: Own bet missing in weather analysis CS1-A
W10: ST analyst not having own view of forward markets CS1-B
W2: Lack of reasoning for own MT forecast vs. market
curve vs. benchmark CS1-B
W4: Analysts messages not consistent CS1-B
W3: Consistency – analysts and forecast CS1-A
W2: Own bet missing in weather and inflow analysis +
overall CS1-B
Product
offering Characteristics
W1: Mid term forecast benchmark statistics not available
(quality follow-up) CS1-B
W3: Mid term forecast result poor CS1-D
W3: Spot price volatility in weeks/quarters not shown CS1-B
W4: Coal analysis focus to case details CS1-E
W4: Morning analysis far away CS1-D
W5: Mid term forecast accuracy and levels (Hit ratio) CS1-E
W5: ST analysts has long distance to financial traders CS1-D
W6: Mid term forecast and analysis quality CS1-B
W7: Missing price levels and profiles for weeks/quarters CS1-B
W5: Frequency of Intraday forecast update CS1-A
W6: Consumption forecast not accurate CS1-A
W7: Clearer view of risk hours in import / export
sensitivities, wind effect CS1-A
W9: UMM impacts not easy to pick-up CS1-A
W9: Failing input accuracy and conversion to output (MT) CS1-E
Service
Leadership Leadership
W1: Clearer balance of development and communication
of achievements CS1-B
W2: Analysis focus on short term and top management CS1-E
W5: Analyst KPIs not aligned with customer CS1-B
W6: Some corporate vs. trading message dilemma CS1-E
W7: GoOs analysis not provided (O) CS1-E
W8: Unclear support for Origination case analysis (O) CS1-E
W4: Development priorities not visible CS1-A
W2: Too optimistic or influenced market view CS1-D
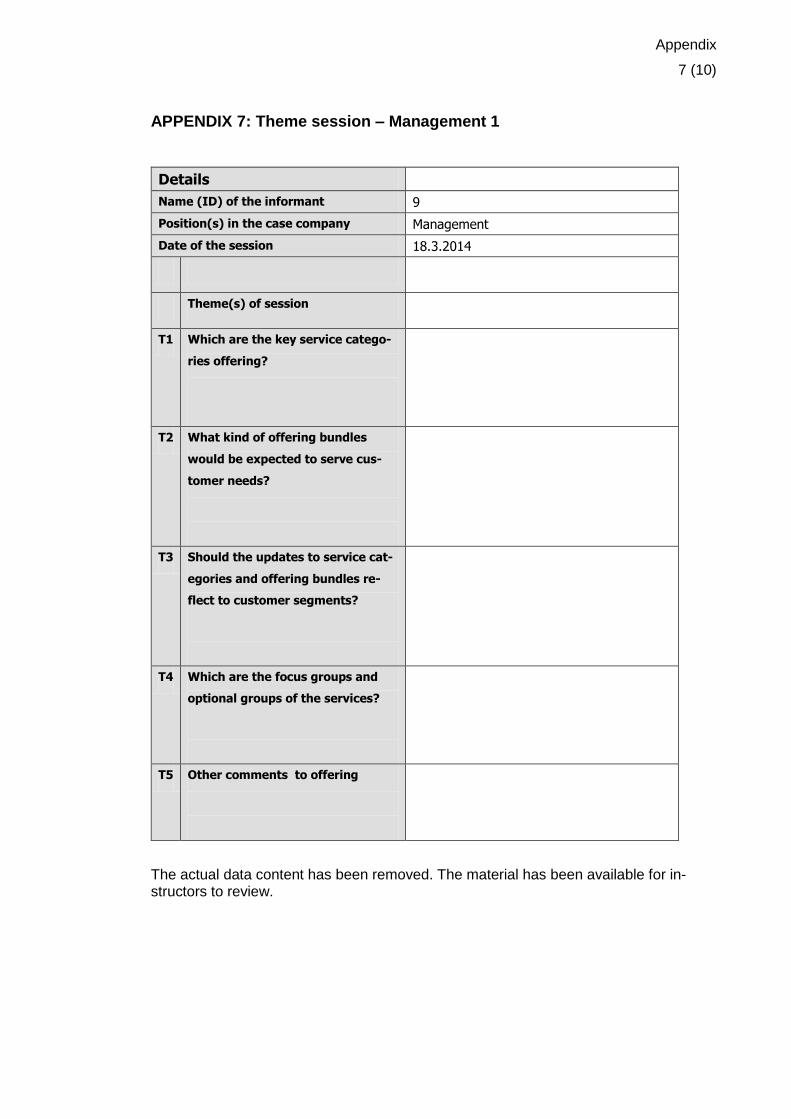
Appendix
7 (10)
APPENDIX 7: Theme session – Management 1
Details
Name (ID) of the informant 9
Position(s) in the case company Management
Date of the session 18.3.2014
Theme(s) of session
T1 Which are the key service catego-
ries offering?
T2 What kind of offering bundles
would be expected to serve cus-
tomer needs?
T3 Should the updates to service cat-
egories and offering bundles re-
flect to customer segments?
T4 Which are the focus groups and
optional groups of the services?
T5 Other comments to offering
The actual data content has been removed. The material has been available for in-structors to review.
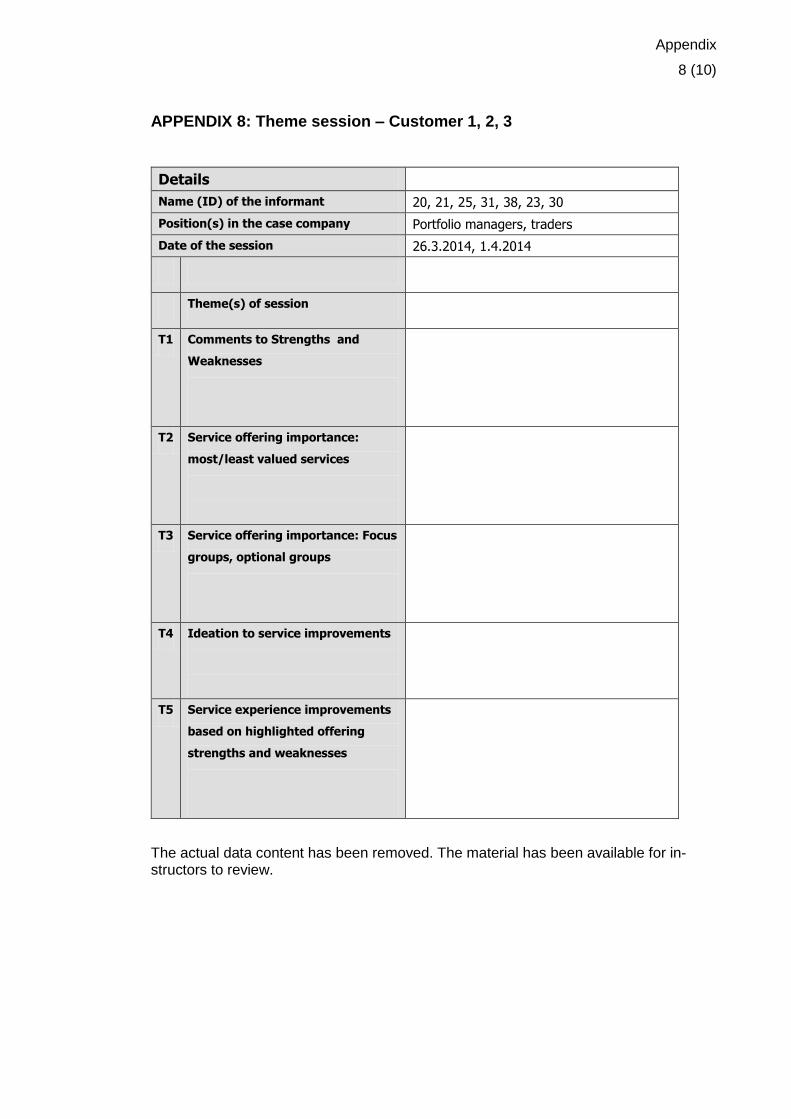
Appendix
8 (10)
APPENDIX 8: Theme session – Customer 1, 2, 3
Details
Name (ID) of the informant 20, 21, 25, 31, 38, 23, 30
Position(s) in the case company Portfolio managers, traders
Date of the session 26.3.2014, 1.4.2014
Theme(s) of session
T1 Comments to Strengths and
Weaknesses
T2 Service offering importance:
most/least valued services
T3 Service offering importance: Focus
groups, optional groups
T4 Ideation to service improvements
T5 Service experience improvements
based on highlighted offering
strengths and weaknesses
The actual data content has been removed. The material has been available for in-structors to review.
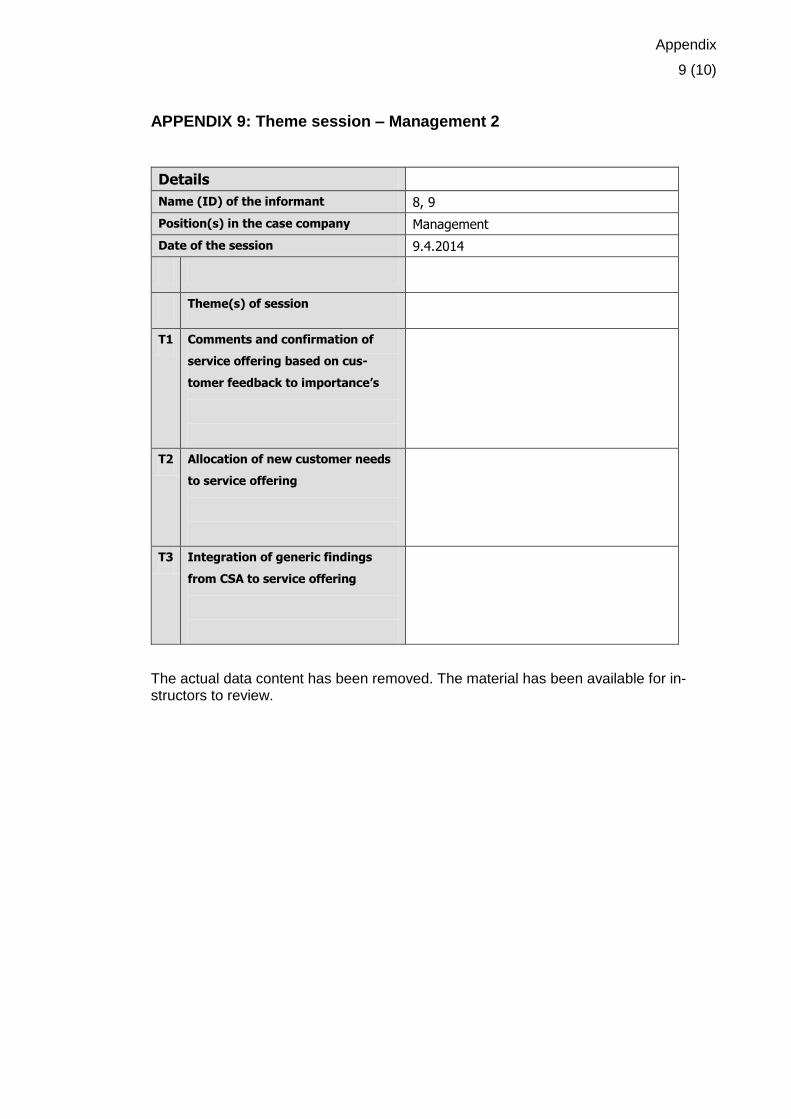
Appendix
9 (10)
APPENDIX 9: Theme session – Management 2
Details
Name (ID) of the informant 8, 9
Position(s) in the case company Management
Date of the session 9.4.2014
Theme(s) of session
T1 Comments and confirmation of
service offering based on cus-
tomer feedback to importance’s
T2 Allocation of new customer needs
to service offering
T3 Integration of generic findings
from CSA to service offering
The actual data content has been removed. The material has been available for in-structors to review.
Appendix
10 (10)
APPENDIX 10: Theme session – Analysts 1
Details
Name (ID) of the informant 1, 2, 3, 4, 5, 6, 10
Position(s) in the case company Supplier, analysts
Date of the session 10.4.2014
Theme(s) of session
T1 Introduction and comments to
new service offering
T2 Current service experience and
challenges, comments for im-
provement
T3 Ideation of implementation of im-
proved service offering
The actual data content has been removed. The material has been available for instruc-
tors to review.